
Abstract
Sensors for pH evaluation of concrete were made by a sol–gel process with alizarin yellow as pH indicator. The optical absorbance was measured with a visible spectrophotometer coupled with optical fibers. Results showed that the sensors had good reversibility, reproducibility, and fast response time.
Introduction
Concrete was a major construction material of the 20th century, and it is still the most used material on Earth (4.1 Gt of cement were produced in 2017, according to Cembureau estimations). 1 More and more buildings and structures are listed as historical nowadays. At the dawn of its development, concrete was considered to be everlasting. 2 However, with time, this belief was proved untrue, as many factors can affect the durability of concrete; among them, corrosion of rebars due to carbonation has been assessed to be the main cause of the decay of concrete structures. When dealing with reinforced concrete restoration, one faces two problems: structural consolidation and material conservation. 3 In the former, scientific knowledge and technical solutions give an exhaustive answer, while in the latter, restoration emphasizes the problem of the image in the field of architecture because of the many possible textures presented by exposed concrete. 3
Monitoring the deterioration of concrete works is assuming strategic importance in the case of interventions to enhance modern architectural heritage, where the control of deterioration includes preventive and scheduled maintenance activities. Maintenance is an essential tool to manage situations or early obsolescence in buildings not yet degraded by time or underused: examples in this sense are historical industrial assets 4 or the UNESCO Heritage, for which the enhancement is linked to the possibilities of re-use, and structural monitoring also allows a clear picture of the architecture and spaces potentially usable by a large audience. 5 The diagnostic analysis of the technical elements in cultural heritage is a central element for “prevention planning,” in terms of safety (also from the point of view of seismic protection), maintenance, and use, where often the engineering requirements for a “compatible” intervention come into conflict with the need to preserve the cultural, historical, artistic, and architectural characteristics of the property. 5 The European Framework Program for Research and Innovation (Horizon 2020) also highlights the positive effects resulting from the valorization of public buildings of cultural heritage. 6 To this aim and considering the huge investments often necessary to reach sustainability targets from an economic, energy, and environmental point of view, complex retrofit interventions are necessary on historical heritage usually characterized by a low energy–environmental quality. 7 Thus, the monitoring of concrete carbonation of historical buildings is of primary importance nowadays.
Weathering carbonation or atmospheric carbonation is the reaction of carbon dioxide (nowadays, roughly 0.041% by volume in air, according to the Mauna Loa Observatory in Hawaii, USA 8 ) with water in concrete capillary pores where it forms carbonic acid (H2CO3). The carbonic acid then reacts with calcium compounds, mainly portlandite (Ca(OH)2), formed after cement hydration and which constitutes typically 25–50 wt% of the cement paste to form solid calcium carbonate (CaCO3) and water. The portlandite consumption causes the concrete pore solution pH to decrease well below 13 and to reach a value as low as 8.3 for fully carbonated concrete. 8 Concrete with rebars requires a high pH to ensure the stability of the protective passive layer on the surface of the metal reinforcement. At this value, the protective oxide layer surrounding the reinforcing steel breaks down and corrosion becomes possible. This is a particular issue if the reinforcement is exposed to aggressive agents such as chloride ions. The corrosion products occupy a greater volume than the original ferrous reinforcement and, in a hardened, mature microstructure, can create internal stresses that cause cracking and spalling of the concrete cover.
Exposure conditions, primarily the presence of water vapor, can have a significant effect on the depth of carbonation and the amount of CO2 absorbed over time. In general, carbonation only occurs when the relative humidity (RH) value ranges between 40 and 90%. 9 If the RH value is too low, then there is insufficient water in the pores for CO2 to dissolve and form the carbonic acid needed to react with the calcium compounds. However, if the RH value is too high, then the CO2 pores network is full of water and the ingress of carbon dioxide is inhibited. When the RH is in a moderate range, the conditions are ideal to promote a greater carbonation depth and thus a higher CO2 dissolution in water in the pores. 9 The carbonation rate also depends on the quality of concrete (amount of cement and porosity of concrete). In most structures made using good quality concrete, carbonation usually takes several (or many) years to reach the level of the reinforcement. 10
Nowadays, the methods most often used to assess carbonation are destructive. The common methodology consists in the analysis of the carbonation front by spraying a 1% (w/v) ethanol solution of phenolphthalein on samples drilled from the concrete structure with the coring method. 11 This pH indicator solution changes its color from purple (in a basic environment) to colorless at pH below 9.5–9.0, highlighting the border of the carbonated zone (Figure 1). However, it does not allow the pH of partially carbonated areas to be determined.

Schematic representation of the carbonation front progress in reinforced concrete highlighted by phenolphthalein color variations.
Moreover, the main sensor technology used to assess the rate of corruption of rebars in steel–concrete composites is based on electrochemical methods, such as potential, polarization resistance, and electrochemical impedance measurements, 12 fiber optic strain sensors based on the extrinsic Fabry–Pérot configuration, 13 or acoustic emission. 14 However, these kinds of sensors need to be placed directly on the surface of the rebar and can only report the phenomena when it is already advanced (i.e. after chemical damage of the steel). Therefore, the real challenge is to prevent rebar damage, using an early detection of the carbonation front inside concrete before it approaches the steel reinforcements.
A review of pH assessment in hardened concrete was recently proposed by Behnood et al., 15 subcategorizing destructive and non-destructive approaches. Destructive methods involve high-pressure pore solution extraction, in-situ leaching where a certain amount of water is injected in a freshly drilled hole, as well as ex-situ leaching, which involves the removal of concrete powder and its dispersion in water. Non-destructive research has focused on the development of embedded sensors, such as potentiometric electrodes and fiber optic sensors 15 (Figure S1-Supplementary material).
Therefore, pH probes to indirectly monitor carbonation caused by pH lowering at different depths inside artifacts seem to be the most reasonable candidates. Commercial pH probes based on optic fibers currently available on the market are designed to operate continuously only in mild chemical environments, such as solutions and suspensions with pH at most slightly alkaline. A fiber optic pH sensor made of a pH-sensitive layer embedding a pH indicator immobilized in a solid substrate which changed the color with the pH of the cementitious matrix was proposed by Habel and Krebber. 16 The sensitive layer was made of a compacted powder kept wet before use by a small watertight topcoat. Other researchers have also reported the feasibility of using sol–gel optic fiber sensors for measuring pH in concrete.17 –20 McPolin et al. immersed a fiber optic probe, made by a sol–gel sensor with a cresol red indicator dye trapped inside (pH change in the range 8–13), in the cement mortar, and monitored pH fluctuations of a carbonated specimen for 18 months. 21 Khalil et al. reported an optical pH sensor using meso-tetraarylporpholactone (change in the pH range from 11.5 to 13.2). 22 Srinivasan et al. used a sol–gel/TNBS (trinitrobenzenesulfonic acid) composite as an indicator that shows a change in optical properties in the pH range from 12 to 14. 23 Many other authors proposed sensors with different pH indicators entrapped in a sol–gel matrix, but these studies were not focused on concrete monitoring.24 -47
To sum up, the use of destructive methods can be overcome with an embeddable small and solid pH sensor prepared by immobilizing a pH-sensitive dye into a polymer 48 or an inorganic matrix.16 -23 Then, by means of an appropriate pH indicator (with a suitable color change interval), it is possible to detect the carbonation in its early stages, preventing depassivation of rebars before the phenomena become critical for structural stability. pH-sensitive dyes are usually weak organic acids with absorption over the visible range, used as optical transducers. 49
The sol–gel technique is a room temperature or near room temperature process which yields inorganic glasses after hydrolysis and polycondensation of organometallic precursors such as, for example, Si(OR)4. Because of the versatility of the process, the porosity of the final product can be easily tailored, enabling the entrapment of organic functional groups into the porous matrix. 50 There are two main methods for the incorporation of organic functional groups into a sol–gel glass: doping and grafting. 50 Chemical doping is highly versatile because organic molecules are simply encapsulated within the gel’s porosity. In this case, the hydrolysis of a mixture of silicon alkoxydes is done in a solution also containing the organic molecules with the desired functional groups. However, as the organic molecules are not chemically bound to the gel matrix, they are often leached out over time. On the contrary, in the grafting technique, organic functional groups are covalently bound to the sol–gel matrix, and leaching of the reagent is much more difficult.24,51 In this case, these organic molecules usually contain the –Si(OR)3 group and grafting occurs through a condensation reaction with hydroxyl groups HO–Si≡ on the sol–gel surface. 50
Finally, instead of using phenolphthalein as pH indicator, Martín-Del-Río et al. proposed the use of alizarin yellow R and indigo carmine to indicate the pH of concrete on cored samples from an existing structure. 52
To the best of our knowledge, sol–gel-based pH-sensitive optical probes for carbonation monitoring of concrete are based on the embedding of the whole sensor, both pH-sensitive element and a section of the optic fiber, directly into concrete during pouring. Although this approach is suitable to assess pH variation inside the artifact, it requires the “sacrifice” of one optic fiber for each pH probe and it is not suitable for assessing the degree of carbonation in already existing structures. In fact, after concrete hardening, the branched optic fiber can no longer be removed, and this is not practical for a real application on site. In addition, no pH sensor based on alizarin yellow and made by the sol–gel process has been investigated for monitoring the pH of cementitious materials.
Thus, the approach we propose in this paper is an attempt to solve the aforementioned issues still present in sensors for civil engineering applications. A silica sensor was manufactured via the hydrolysis and condensation of a silicon alkoxide and, for the first time, alizarin yellow was entrapped as the organic dye in the silica matrix. The sensor was embedded in a cement mortar, and the absorbance and intensity of the light reflected by the pH sensor was then measured with a portable spectrophotometer equipped with optical fibers. The changes in the absorbance and the intensity of the reflected light were finally correlated to the cement paste’s pH variations during accelerated carbonation tests.
Materials and methods
Materials
The chemicals used were tetramethyl orthosilicate (TMOS), methanol (MeOH), cetyltrimethylammonium bromide (CTAB), sodium hydroxide (NaOH) and 1,2-dihydroxyanthraquinone (alizarin yellow R, AY) sodium salt (ACROS Organics). All chemicals were used as received without any further purification.
Preparation of the sensors
The synthesis of silica matrices proceeds through the hydrolysis–condensation mechanism of TMOS in a slightly alkaline environment. The reaction scheme can be written as follows (Equations 1–3):
Si-(OCH3)4 + H2O → HO-Si-(OCH3)3 + CH3OH (hydrolysis) (1) HO-Si-(OCH3)3 + 3(CH3O)-Si-OH → 3(H3CO)-Si-O-Si-(OCH3)3 + H2O (condensation) (2) HO-Si-(OCH3)3 + Si-(OCH3)4 → 3(H3CO)-Si-O-Si-(OCH3)3 + CH3OH (condensation) (3)
Sol–gel sensors were prepared similarly to the method reported in Rottman et al. 43 A volume of 5.0 mL of TMOS, used as silica matrices precursor, was quickly and carefully dissolved in 5 mL of methanol, to avoid early reactions of the precursor toward environmental humidity as much as possible. Then, 0.16 mL of a previously prepared 0.05 M methanolic solution of the dye alizarin yellow R, whose color changes from yellow to red in the 10–12 pH range, 19 was added to the TMOS solution. Subsequently, 0.8 mL of an 8.2 × 10⁻² M (3.8% w/w) methanolic solution of CTAB was added as a surfactant to prevent agglomeration of silica particles during the following reactions. 46 The solution was stirred for few minutes and then 4.6 mL of distilled water was carefully added drop by drop to promote early hydrolysis stages. After that, 1 mL of 10-3 M NaOH solution for the basic catalysis of the reaction was carefully and slowly added. Immediately after alkaline catalyst addition, the solution becomes milky as a result of formation of silica colloids, and orange due to the pH indicator color change. The whole mixture was stirred for 60 min using a magnetic stirrer at room temperature to ensure the proper mixing of the reagents and reactions. The milky colloid became gradually clearer until reaction occurred, slightly increasing its viscosity during this time. The final product was a castable clear viscous sol. A volume of 5.0 mL of this sol was then poured into a polypropylene cylindrical mold. The transparent sol was left for 10 days at 25°C inside a drying oven (Memmert UN30, Schwabach, Germany), and then for a month in a controlled atmosphere at room temperature with a RH value of 57–58%, to avoid fast drying and consequent cracking of the silica monolith. To prevent warping and cracking of the matrix due to differential shrinkage, 53 a very slow drying was imposed. At the end of the aging time, the monolith was carefully removed from the mold, weighed and sized.
The final monolith was orange in color, solid, clear transparent, with a weight of 0.5 g, and dimensions of 8.7 mm in diameter and 7.15 mm in height.
Characterization of pH-sensitive elements
Microstructure and surface morphology analysis of the silica monoliths was evaluated using a Field Emission–Scanning Electron Microscope (FE–SEM) (Hitachi S3600, Tokyo, Japan). The samples were metalized using gold before observations, to avoid electrical charging.
The diffraction pattern of the produced materials was acquired by X-ray diffraction (XRD) spectroscopy using a Pan’Analytical X’Pert Pro instrument (Pan’Analytical, Almelo, The Netherlands) working with Cu Kα radiation (0.154056 nm) in the range 5–70° (2θ), with a step size of 0.05° (2θ). Diffraction patterns were indexed by means of the database data P.D.F. 2000 (International Center of Diffraction Data, Newtown Square, PA, USA).
The nature of the interaction between pH indicator (alizarin yellow R) and the silica matrix was investigated using Attenuated Total Reflectance–Fourier Transform Infrared (ATR/FTIR) spectroscopy. The spectra were obtained using a Nicolet iS50 spectrometer (Thermo Scientific, Milano, IT) at 2.0 cm-1 resolution in the range 400–4000 cm1. The data were analyzed using OMNIC TM software. Bands were attributed by comparison with the spectra reported in the literature.
Sensor assembly and embedding into mortar samples
The pH sensor was inserted inside a cement mortar (CEMII/A-LL42.5R according to EN197/1 standard) prepared by mixing water:cement:sand in the ratio 1:2:3. Cement and sand were first manually dry mixed, then water was slowly added until the mixture became workable. Subsequently, the mixture was poured inside a cylindrical mold, and the sol–gel sensor, with alizarin yellow R entrapped inside, was completely inserted in the still-fresh cement mix, paying attention to leaving the upper part of the sensor clean to allow contact with the optical fiber and therefore the capture of the absorption spectrum. The mortar, with the sensor in the core, was cured for 1 day in high humidity conditions, then it was left completely immersed into water for 7 days and finally left to dry for 2 days. As is well known, carbonation is a deleterious process although it occurs over several years. In this study, to make these times reasonably short, the sensor was inserted into a mortar cover (described above) with very thin walls, so that the carbonation process happened faster but with the same criteria in which it occurs in a building (Figure 2). The pH indicator alizarin yellow R in contact with fresh concrete, whose pH is typically highly alkaline, 12–13, makes the sensor change from light yellow to dark orange. The carbon dioxide injected inside the chamber diffused through the surface layer of concrete sample, penetrated inside it through the network of pores, passed into solution, and reacted with Ca(OH)2 and calcium silicate hydrates (C-S-H) to form calcium carbonate. Then, the alkalinity decreased to less than 9 and the sensor returned to yellow.

Mortar sample with an internal embedded pH sensor at the bottom of the Teflon piece which hosts the optical fiber.
Accelerated carbonation tests
The cell for the accelerated carbonation test is shown in Figure 3. The carbonation chamber, homemade and assembled, was first set under vacuum by means of a primary vacuum pump. The proper sealing of the chamber was evaluated using an analogical pressure meter fitted directly in the wall of the cell. No pressure increase over time was observed, as proof of the correct setting of the chamber. Afterward, synthetic air with 50,000 ppmv (5 vol%) of CO2 (research grade) was injected into the cell, as in Grengg et al. 54 The flows were controlled by means of a Teledyne Hastings Instruments HFM 300 controller and HFC 302 mass flow controllers. 55 The pressure in the chamber was maintained continuously at 1.2 bar and monitored by means of the same pressure meter used to check the chamber sealing. The RH of the chamber was fixed at 70 ± 5% (this condition is favorable for carbonation 56 ) by using a saturated NaCl solution, a method commonly used to calibrate humidity sensors; the inner atmosphere of the closed system rapidly goes to the equilibrium toward the saturated NaCl solution. The room temperature was maintained constant at 20 ± 3°C and monitored using a calibrated thermometer. Weekly, the samples were carefully and quickly extracted from the chamber to be wetted with a paintbrush, because water is necessary to activate the pH sensor. The RH% and CO2 concentration conditions inside the chamber were rapidly restored after every sampling and checked.

Set up for the pH measurement with fiber optic sensors.
Colorimetric measurements – experimental set-up
Colorimetric assessment of pH variation in the surrounding of the pH-sensitive elements was carried out through spectrophotometric measurements. A portable single-ray multichannel micro spectrophotometer (Flame, Ocean Optics, Largo, FL, USA), equipped with a high-power halogen light source (HL-2000-HP-FHSA, Ocean Optics, Largo, FL, USA) and a multimode bifurcated optic fiber (DBIF-200-2-VIS-NIR Thorlabs, Thorlabs Inc. Newton, NJ, USA), was used to perform colorimetric analysis. The measurements were performed in diffuse reflectance mode. Spectra were acquired through the software provided by the spectrophotometer manufacturer (OceanView 1.6.), using the parameters listed in Table 1.
Acquisition spectra experimental conditions.

All spectra were recorded in the wavelength range of 400–750 nm. Instrument calibration was performed systematically before every acquisition by means of a total-white planar pellet of barium sulfate used as reference (Figure S2-Supplementary material).
Results and discussion
FE–SEM observations
FE–SEM micrographs of the SiO2 matrix with encapsulated AY are shown in Figure 4. A network of spherical particles packed together is clearly visible, as expected in a base-catalyzed process, where colloidal silica clusters are initially formed and then grows through gelation. 50 A diffuse surface porosity was observed, with pores having an average diameter below 100 nm. According to Islam et al., 57 silica crystals nucleate, and through electrostatic charge-matching cationic head groups of the CTAB interact with SiO2 species leading to aggregation of different silica crystal nuclei. Then, pores develop as a result of the differential stresses from drying/shrinkage of organic solvents. However, during the aging period, silica crystal nucleation and growth continues.

FE–SEM micrographs of the SiO2–AY matrices: (a) 20k×, (b) 60k×.
XRD analysis
As expected, XRD patterns (Figure S3-Supplementary material) of amorphous substances do not possess sharp Bragg peaks, as crystalline compounds have, but very broad peaks as a result of the short-range order. 57 In the XRD pattern in Figure S3, the peculiar broad hump at 22° (2θ) in 2θ was attributed to the cristobalite structure (JCPDF Reference code: 39-1425), according to the literature. 58
FT–IR in ATR mode
FT–IR spectrum of CTAB–SiO2–AY is reported in Figure 5 and shows a small band at ca. 810 cm-1 probably corresponding to the bending vibrations of the Si–O–Si network. 59 The small peak at ∼856 cm-1 is probably due to Si–CH3 bonds.47,53 The small –OH peak at 995 cm-1 is probably caused by ν(Si–O) stretching vibration associated with dangling oxygen atoms on silica.53,59 In fact, available surface reacts to produce Si–O–Si bonds by condensation, and surface reactions occur homogeneously throughout the wet gel by diffusion along the open pore structure. 53 These reactions are terminated with either hydroxyl (–OH) or alkoxy (–OR) groups, and then converted to stable Si–CH3 groups (the band at 856 cm-1), which limits further condensation reactions. 53 These results confirm that the surface modification is fairly complete. 53 The intense peak at 1112 cm-1 and the shoulders around 1144 and 1193 cm-1 can be assigned to the transversal optical (TO4) and longitudinal optical (LO4 and LO6) modes of the Si–O–Si asymmetric stretching vibrations, respectively.47,53,59 The peaks at 1269 and 1407 cm-1 can be correlated to the in-phase stretching of Si–CH3 groups in a siloxane polymer. 60 The peak at ∼1450 cm-1 may be due to the CH2 scissoring of TMOS. 47 The peak at 1728 cm-1 refers to the C–O stretching of carbon group belonging to CTAB 47 or to Si–O–CH3. 53 The bands at ∼2865 cm-1 and ∼2944 cm-1 are assigned to the CH2 asymmetric and symmetric stretching vibrations of the CTAB, respectively, probably due to the interaction of CTAB molecules with alizarin yellow R molecules. 47 Bands at 2915 and 2944 cm-1 are ascribed to in-phase and out-of-phase stretching of Si–CH3 groups in a siloxane polymer, respectively. 60 The presence of adsorbed water and H–bonded silanol groups is presented as broad bands ∼3337 cm-1, indicating the hydrophilic characteristics of matrices as reported in the literature.47,58,60,61 Finally, no band due to functional groups associated with AY was detected, as evidenced also in a previous work, 59 probably because of its low concentration (silica to AY molar ratio ≈4100).
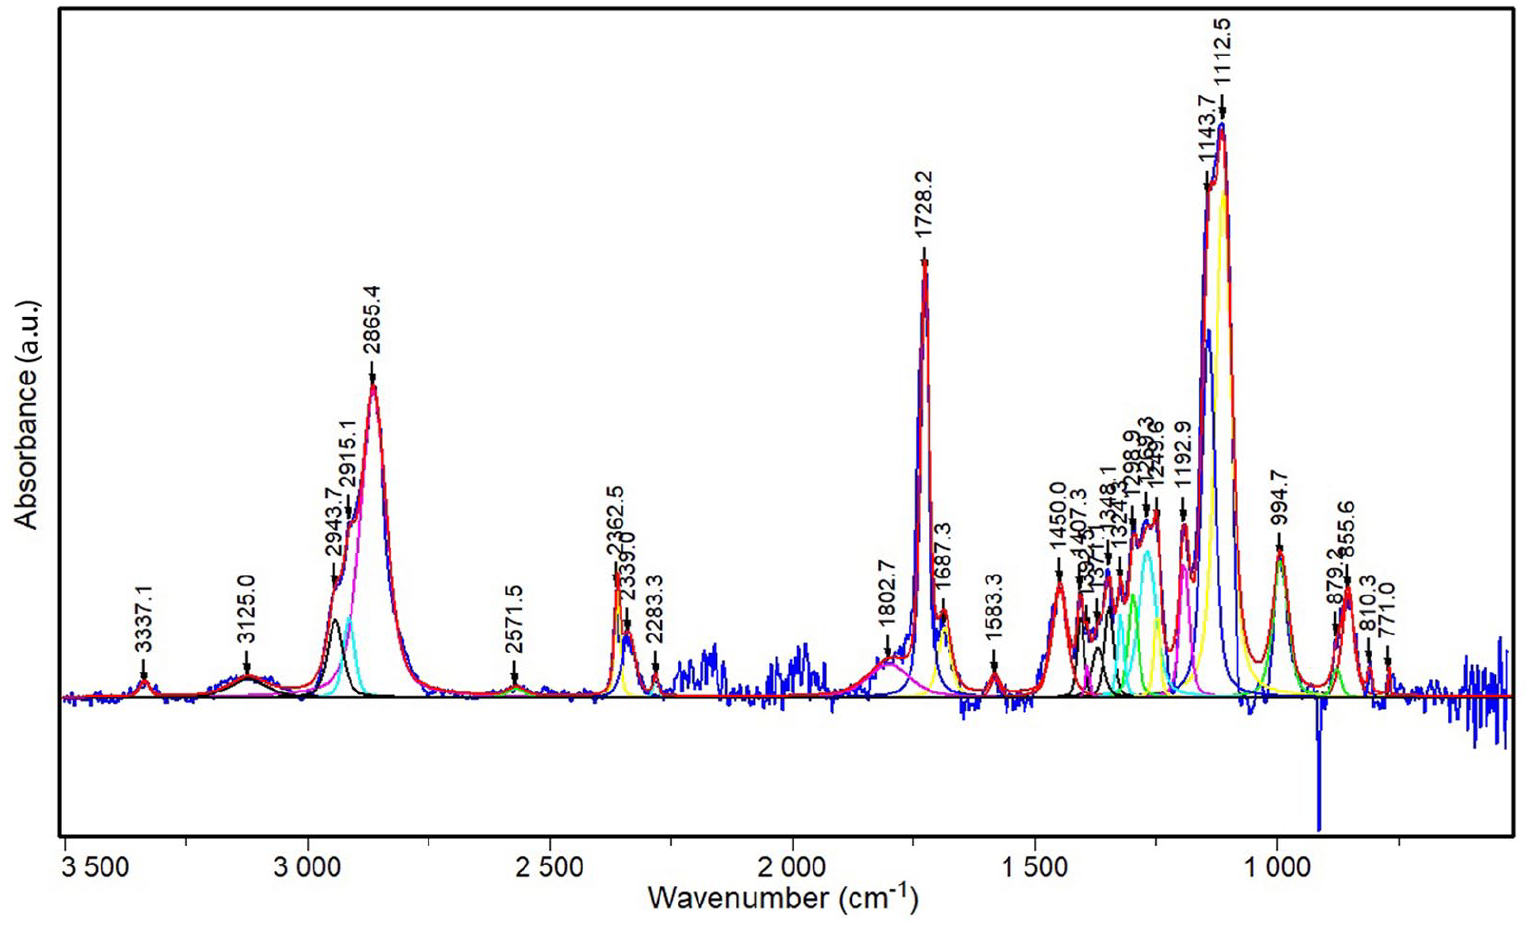
FT–IR spectra of the silica matrix with alizarin yellow R molecules encapsulated.
During the synthesis stage, CTAB dissolved in methanol fills the spaces and forms the interpenetrating channels. 58 These pores were then filled with dye species, and alizarin yellow probably forms a homogeneous film through physical interactions with silica matrix.
Fiber optic reflection spectroscopy
Figure 6(a) shows the absorption spectra obtained from fiber optic reflection spectroscopy (FORS) analysis. From the spectra, it is clear that the maximum of the absorbance curve in the range 550–650 nm initially at 582 nm increases up to 613 nm after 4 weeks. Then, this maximum shifted to lower values of absorbance down to 584 nm. This result can be attributed to the fact that the pH-sensitive element needed a certain time to detect the pH variation and evidenced it by means of the color change from yellow to dark orange, and then to yellow again. These changes in color can be directly related to the changes in pH of the solution in contact with the entrapped dye in the sol–gel sensor.

(a) Absorbance spectra recorded over the period May–November 2019 (the numbers on each curve represent the wavelength (in nm) of the maximum of the broad peak in the range 500–650 nm); (b) wavelength of the peak of maximum absorbance in the range 550–650 nm.
Figure 6(b) displays the maximum absorption peaks values of the spectra, in the UV–vis region, of the pH-sensitive element with AY indicator, to highlight the color shift according to pH variation of the surrounding mortar caused by the carbonation of the material. The monitoring takes into account a period of 7 months. The color of each segment of the curve emphasizes the colorimetric response of the pH-sensitive element: at the beginning of the study, the pH-sensitive element was light yellow, and after 4 weeks a color change to dark orange was observable. Finally, the pH-sensitive element returned to the original light-yellow color when the concrete, in contact with the CO2, started to carbonate and the pH decreased.
The pH-sensitive elements were also tested in different aqueous solutions with an increasing pH value (from 7 to 14) to simulate the pH evolution of the cement paste from fresh to carbonated material. Figure 7(a) shows the color evolution of the sensor from brownish red with a maximum absorbance peak centered at 658 nm (corresponding to pH=14) to yellow with a peak at 587 nm rinsed in a solution at pH 7.
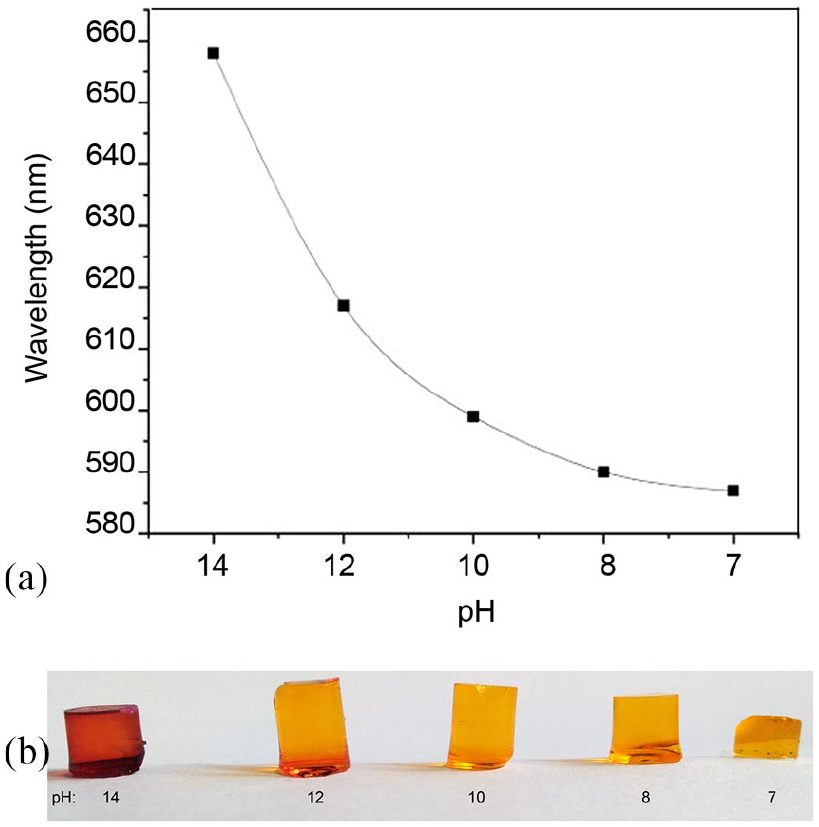
(a) Wavelength of the peak of maximum absorbance in function of the different pH values in the range 550–650 nm; (b) color variation of the sol–gel sensors with alizarin yellow R entrapped in the matrix when dipped in solutions with different pH values.
For a starting pH value of about 12.5, as expected in a mortar made with a CEMII/A-LL42.5R cement, 15 the expected wavelength of the maximum absorbance peak was 625 nm (Figure 7(a)). However, when in contact with the mortar, the estimated pH value was slightly underestimated. In fact, the wavelength of the maximum absorbance peak was observed at 613 nm, that is, the pH value was estimated to be ∼12. In fact, contrarily to what happened in a solution, the change in color of the embedded pH-sensitive element was not uniform because of diffusion of water molecules only from the bottom and the side of monolith, effectively in contact with mortar, and not from its whole volume. The same thing is suggested to happen in the pH-sensitive elements embedded in the Teflon cover, that is the proper sensor, as the upper face of the monolith is in contact with the optical fiber and not with the mortar.
These assumptions are validated observing the cross-section of a mortar sample shown in Figure S4-Supplementary material. The picture was taken using a different sensor than the one characterized above (7 mm in height), and shows a gradient in the color change of the sensor from the bottom to the top. Another possible explanation is the limited availability of water molecules.
Table 2 shows the few available solutions for pH monitoring in concrete structures based on FORS and a photodiode. The discussed proposed solution is competitive with respect to the existing approaches, and makes a step forward in the possibility to evidence pH variations within cementitious materials. Finally, the investigated system was able to follow the pH change during accelerated tests without the need to drill holes and fill them with water, contrarily to what was done elsewhere.15,51
Comparison between the features of the proposed sensor and the literature data.

Design of the whole sensor device
Finally, considering the encouraging results described in the previous paragraphs of the present paper, we propose the design of a complete sensor device (Figure 8). The details of the elements that compose the whole device are listed in the legend of Figure 8.

Scheme of the whole sensor device for a potential real application on-site; (a) multimode fiber connection to the spectrophotometer and light source, (b) fiber sleeve, (c) light reflected to the spectrophotometer (outer fibers), (d) custom-made Teflon cover, (e) light from the lamp (inner fiber), (f) epoxy resin sealing, (g) carbonated zone, (h) pH-sensitive element, (i) moistured contact zone between pH-sensitive element and concrete.
Adopting the design we propose for the whole device, it is possible to insert the fiber when a measurement is required and then extract it. The Teflon cover can be sealed properly using an appropriate cap to avoid external air entering inside the artifact, altering the carbonation degrees in the surrounding area of the device. The cover can be sealed on the concrete using an epoxy resin. By using different optics fibers and cover lengths, it is possible to assess the carbonation degree at different depths inside the bulk of the material. Further, with this approach, it is possible both to insert the sensor during concrete pouring (for novel artifacts) and to insert it inside already existing historical ones without excessive damage to the structure.
Conclusions
In the present work, robust optical pH probes were developed by means of a pH-sensitive dye entrapped in a silica monolith obtained through an easy sol–gel method. This approach allowed us to obtain pH-sensitive probes that exploit some advantages for continuous on-site application in concrete structures: they are inert and can be easily obtained with a suitable shape and dimension. Moreover, the obtained sensitive elements were reasonably tough and resistant to aggressive environments, and produced an acceptable quick analytical output. In addition, the devised optical pH sensor had a high sensitivity, a good reproducibility (the sensor was able to reversibly change color when immersed alternately in solutions with a neutral and a basic pH), and rather long-term stability (of at least some months). Finally, a slight shift in the exact pH value determination of the pore solution was noted due to the working principle of the sensor, in which diffusion of water molecules can only happen from the bottom and the side of the sensor in contact with the cementitious paste. However, this feature does not impinge upon carbonation detection by means of optic fibers and embedded sensors. The main limitation of the device lies in the mandatory presence of water to evidence the color change of the pH indicator, which limits its use in a real structure. A possible solution to this issue could be to produce pH-sensitive elements thinner than the one used in the present study (about 7 mm in height).
The design of the pH probe holder, embedded in the concrete matrix, allows insertion and removal of the same optic fiber multiple times in different sampling points. This feature helps to overcome the problem of reusability of the same optic fiber multiple times, making the suggested approach affordable and low cost when a high number of measurements in different points and depths of the artifact are required.
Further works should be done to assess the applicability of the proposed sensors to detect and monitor carbonation front progress in the bulk of concrete samples at different depths.
Supplemental Material
Supplementary_material – Supplemental material for Sol–gel-entrapped pH indicator for monitoring pH variations in cementitious materials
Supplemental material, Supplementary_material for Sol–gel-entrapped pH indicator for monitoring pH variations in cementitious materials by Barbara Inserra, Kaname Hayashi, Andrea Marchisio and Jean-Marc Tulliani in Journal of Applied Biomaterials & Functional Materials
Footnotes
Declaration of Conflicting Interests
The authors declared no potential conflicts of interest with respect to the research, authorship, and/or publication of this article.
Funding
The authors disclosed receipt of the following financial support for the research, authorship, and/or publication of this article: This work was supported by the PRIN project 2015 “Monitoraggio, Consolidamento, Conservazione e Protezione di Beni Culturali” (Monitoring, Consolidation, Conservation and Protection of Cultural Heritage; protocol 2015WBEP3H_003).
Guarantor
J.M.T.
Contributorship
J.M.T. and A.M. researched literature and conceived the study. K.H. and B.I. were involved in the sensor’s development, measurements, and data analysis. B.I. wrote the first draft of the manuscript. B.I., A.M., and J.M.T. reviewed and edited the manuscript and approved the final version of the manuscript.
Supplemental material
Supplemental material for this article is available online.
References
Supplementary Material
Please find the following supplemental material available below.
For Open Access articles published under a Creative Commons License, all supplemental material carries the same license as the article it is associated with.
For non-Open Access articles published, all supplemental material carries a non-exclusive license, and permission requests for re-use of supplemental material or any part of supplemental material shall be sent directly to the copyright owner as specified in the copyright notice associated with the article.