
Abstract
An approach to solve the limitations of autologous bone grafting procedures in bone injury treatment is to develop bioactive coatings in the implantation system. The objective of this work is to compare the temperature effect on the stability of hydroxyapatite, graphene, and collagen colloidal suspensions to be used as biocompatible and bioactive coatings on a carbon fiber composite surface. Synthesized hydroxyapatite was assessed by X-ray diffraction. Zeta potential at different temperatures was evaluated. Specimens were characterized using scanning electron microscopy and Raman analysis. The results showed that the best hydroxyapatite/graphene ratio was 85/15, while those of the hydroxyapatite/collagen mixtures were 85/15. A hydroxyapatite/graphene/collagen mixture was synthesized based on these results.
Introduction
Among the best coatings that can be used in bone implants is hydroxyapatite (HA), which is the main component of the mineral phase of bone tissue; it is a ceramic type of osteoconductive material composed of calcium, phosphorus, oxygen, and hydrogen per the formula Ca10(PO4)6(OH)2, whose calcium:phosphorus proportion in human bone is 1.67:1. This bioceramic is an alloplastic material whose crystalline configuration is hexagonal dipyramid. It has been widely used in biomedical applications because of its biostability, biocompatibility, and bioactive properties. The mechanical behavior and the rate and quality of bone integration of HA depend on the size of the crystals, pore size, porosity, and interconnectivity.1–7
HA coatings on metal prostheses accelerate the process of bone formation, since HA is composed of practically the same proportion of calcium and phosphorus as human bone, and they also improve the behavior of the prosthesis in the physiological environment, avoiding the formation of fibrous tissue at the metal–bone interface and establishing a direct bond with the bone, thus helping the fixation of the prosthesis.
There are a variety of methods for coating materials with HA; however, given the similarity in principles, these can be classified into three groups: thermal spray techniques, steam deposition techniques, and wet techniques. 8 Among the most popular techniques is plasma spray, preferred due to the large area covered and the great adhesion between the substrate and the coating; the main disadvantages presented by this method are the exposure of the substrate at high temperatures, which in some cases produces thermal stress on it, and the impossibility of coating complex geometries.8,9 Other methods include ion beam deposition, pulsed laser deposition, magnetron sputtering, biomimetic deposition, and electrophoresis deposition.8–12
Despite this, it has been reported that the intensity of tissue response to an implant it will vary depending on the HA coating resorption capacity. The HA resorption will be affected by its crystallinity. It is proposed that the HA coating is more desirable in some amorphous phases rather than with high crystallinity, because the amorphous phase in HA coating leads to a more stable interface with the biological settings. Moreover, it has been concluded that the success of the implants is related to its capacity to resorb or degrade, leading to cellular penetration. 13 Moreover, it has been proposed that bacterial infection can happen with biocompatible and HA coated implants. Bacteria were more likely to grow onto or next to the HA implants, which resulted in a more severe histopathological characterization of infection. 14
The objective of this work is study of formulations of HA, collagen, and graphene coatings that improve the biocompatibility of a composite material mainly composed of carbon fibers proposed to be used as a prosthesis due to its good mechanical properties (data not shown).
Methodology
Chemicals
All chemicals used in the experiments were of reagent grade and used as received. Eighty-five percent phosphoric acid (H3PO4), calcium hydroxide (Ca(OH)2), and potassium chloride (KCl) were purchased from Fermont. Distilled water was used in the salt leaching process and used to prepare all the solutions.
Synthesis and characterization of HA powder
HA powder was prepared by the precipitation method. Ca(OH)2 was used as a calcium source and H3PO4 as a phosphorus source in an alkaline environment (pH >11). The Ca/P molar ratio was 1.67. Firstly, an aqueous solution of H3PO4 was mixed with Ca(OH)2 powder and the mixture was stirred during 1 week. Then the mixture was centrifuged three times at 3000 rpm for 5 min. The slurry was filtered off through a Buchner funnel and washed with ethanol. The filtered sample was left to dry at 80°C for 5 days in an oven. Finally, the resulting HA powder was divided into two parts: one of them was sintered at 1050°C for 2 h (HAS), and the other was not (HA).
HA powder was analyzed by X-ray diffraction (XRD) and Raman spectroscopy. The analysis was performed using a Bruker D8 Advance diffractometer operated at 30 kV and 30 mA. Both zeta potential and particle size analysis of HA powders treated at different temperatures were determined by a SZ-100 nanoparticle analyzer instrument. A total of 1 g of HA powder, 0.001 mol of KCl and 100 ml of 70% ethanol were used in order to carry out the zeta potential analysis and 10 ml of HA powder with 100 ml of ethanol was used in the particle size analysis. A Misonix Branson 2510R-MT ultrasonic cleaner was used to mix the samples.
A total of 0.5 g of HA was sintered at four different temperatures for 2 h to observe the influence of the temperature on the electrodeposition of the material. The set temperatures were 160°C, 470°C, 870°C, and 1090°C to control the crystal structure of the HA. The sample that presented the best results in the potential Z tests was selected to make mixtures of collagen and graphene.
HA and HAS porous scaffold preparation
Potassium chloride (KCl) was added to HA and HAS in a KCl/HA-HAS ratio of 1.85. The mixture was homogenized by grinding them together in a porcelain mortar. Then, the samples were uniaxially compacted using a hydraulic press into cylindrical scaffolds with a force of 5000 lbs for 2 min. HA and HAS scaffolds were sintered in different temperatures ranging from 160°C to 1090°C for 2 h in an oven.
Zeta potential studies
Once HA was selected, a zeta potential analysis was performed using a HORIBA SZ-100 zetameter by taking 1 mg of the HA and 1 mmol of potassium chloride and dissolving them in 100 ml of 70% ethanol using a BRANSONIC 2510R-MT sonifier.
The sample sintered at 1090°C offered the best results and was selected for the next part of the experiment. Mixtures of HA and collagen were made by weight ratios of 80/20, 85/15, 90/10, and 95/5, respectively. Their zeta potentials were tested under the same conditions as above. Subsequently, mixtures of HA and graphene were made at 80/20, 85/15, 90/10, and 95/5, respectively, for zeta potential tests.
Two samples were selected from each mixture based on the results obtained in the zeta potential assessment. Samples 80/20 and 85/15 HA/collagen and 85/15 and 90/10 HA/graphene were selected. To make the final formulation of HA, graphene, and collagen, the following proportions were used to obtain a total of four samples of 68/12/20, 72/13/15, 72/8/20, and 76/9/15 of HA, graphene, and collagen respectively.
Particle size determination
Particle size was measured in non-treated HA (HA) and HA treated with the different sintering temperatures (HAS) to see the effect of temperature on its particle size. To determine particle size in the samples, a HORIBA SZ-100 zetameter device was used. Samples were prepared in a solution of 10 mg in 100 ml of ethanol. Particle size analysis was performed by dynamic light scattering (DLS), in the dynamic range of 0–30 µm.
Electrode preparation
Both the electrode and the counter electrode must be conductive in order to perform the deposition by electrophoresis. The carbon fiber complies with this characteristic, but since it was covered with epoxy resin it was necessary to give it a pre-treatment so it could be used as an electrode.
The composite was received in sheets and cut into rectangles 4 cm long by 2 cm wide. Figure 1 shows the shape of the electrode.
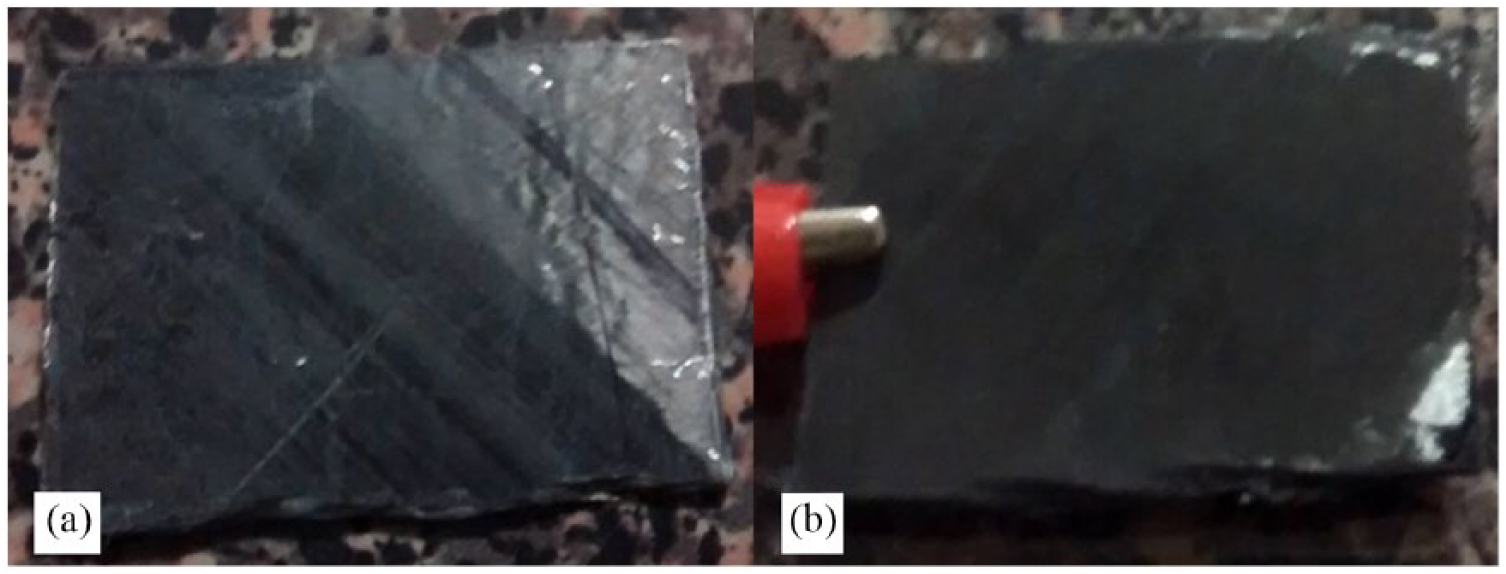
(a) Electrode with composite material 4 cm × 2 cm. (b) Worn electrode with sandpaper of 200 grains/cm2.
Surface wear was performed on the front face of the material using 200 grit sandpaper to remove some of the epoxy resin from the surface. The continuity of the electrode was checked using a commercial multimeter to make sure that the entire surface was conductive on one side.
Electrophoresis
A simple electrophoretic equipment was developed that maintained 1 cm between the electrodes and that could connect to the power source.
Following the best results in the zeta potential studies, it the formulation of 72/13/15 w/w/w HA/graphene/collagen (HA/Grap/Col) was chosen, electrophoresis was done in triplicate, and samples were prepared using a common solvent, ethanol; to do this, samples were dissolved using 5%, 10%, and 20% w/v of the mixture in 40 ml ethanol. The same specifications were used for mixtures where only HA was included. Based on the zeta potential results, the electrode was placed at the anode of the source. The electrophoresis was performed at room temperature in a 50 ml beaker at 30 V direct current for 1 h with constant stirring at 100 rpm.
Results and discussion
Hydroxyapatite characterization
Figure 2 shows the Raman spectra of HA; all bands have been assigned to the internal vibrational modes of the PO4- group. The strong peak at 960 cm−1 corresponds with the symmetric stretching mode ν1 of the tetrahedron PO4−3 group (P-O bond); the weak peak around 600 cm−1 is assigned to the triple degenerative bending mode ν4 of PO4−3 (O-P-O bond); the double degenerative bending mode ν2 of the PO4−3 group (O-P-O bond) can be observed as a medium peak at 440 cm−1.15–17 Hence, Figure 2 shows the Raman spectrum of HA, which is comparable to what is reported in the literature, demonstrating that the synthesis was performed correctly.
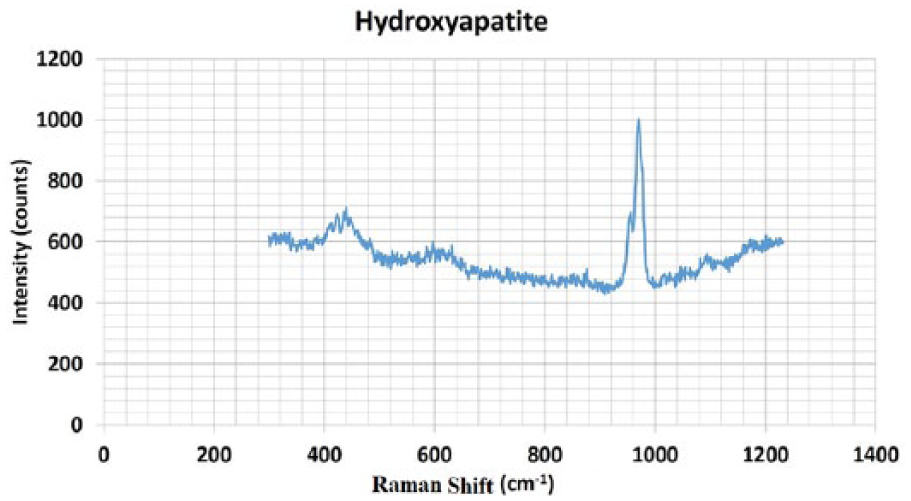
Raman spectrum of hydroxyapatite.
Characterization of hydroxyapatite powder
The percentage yield of HA powder obtained by the wet-precipitation method was 82%. In comparison to the reagent cost, 100 g of HA produced by the wet-precipitation method is 10 times cheaper than 100 g of commercial synthetic HA of Aldrich, although cost references depend on fluctuations in the market.
To characterize the crystallized HA powder, an XRD analysis was performed. The XRD analysis showed that HA is the only crystalline phase identified in the material (Figure 3).
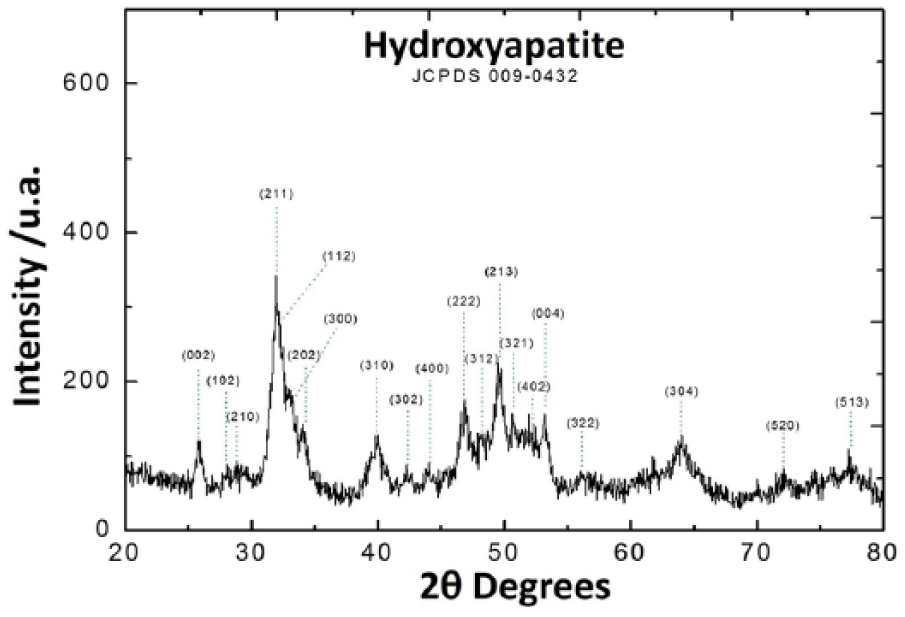
X-ray diffraction spectrum of hydroxyapatite.
XRD analysis of HA powder showed a diffraction pattern in which the first four greater peaks of intensity located between the angular zone 20 < 2θ < 60 were assigned corresponding to the Miller indexes of 002, 211.112, 300. Despite those indexes being attributed to HA, the lack of separated peaks with lower intensity indicates a low degree of crystallinity. 18 However, a comparison between the obtained HA XRD patterns and the JCPDS 09-432 file shows that HA powder obtained by the wet-precipitation method represents the typical HA pattern.
Particle size analysis of HA powders shows that the relation between temperature and the particle size of HA powder is inversely proportional to the thermal treatment. It was observed that with no thermal treatment, the particle size was 29.08 ± 3.17 µm, and when the temperature increased (160°C, 470°C, 870°C, and 1090°C), the particle size decreased (11.76 ± 0.94, 11.43 ± 0.40, 10.63 ± 0.46, and 7.89 ± 0.22 µm, respectively) (Figure 4).
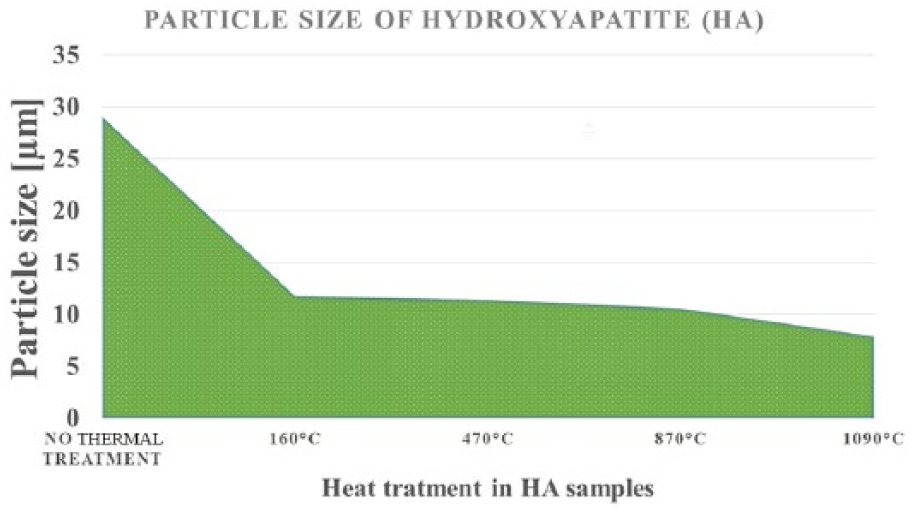
Particle size of thermal treated hydroxyapatite.
It has been reported that different particle sizes can be obtained at the same sintering temperature, but particle sizes can be larger if the sintering process time is prolonged.19–24 In our samples, it was observed that HA particle size is inversely proportional to temperature increment. Despite this, Yin et al. 25 commented that since cytotoxicity is independent of particle size, coatings with smaller particle size are best distributed at surfaces.
The effect of the heat treatment can be observed particularly in the sample sintered at 1090°C, where the porosity of the particle reduces remarkably in relation to the others. The particle size of 30 µm of the sample without heat treatment is attributed to the presence of coordinated water when allowed to dry at a temperature of 80°C. The particle size is suitable to use in coatings, because at a size of 10 µm it allows cell adhesion; however, is not as feasible to use in other medical applications, because the size of the particle would complicate the construction of seeding channels in the bone.
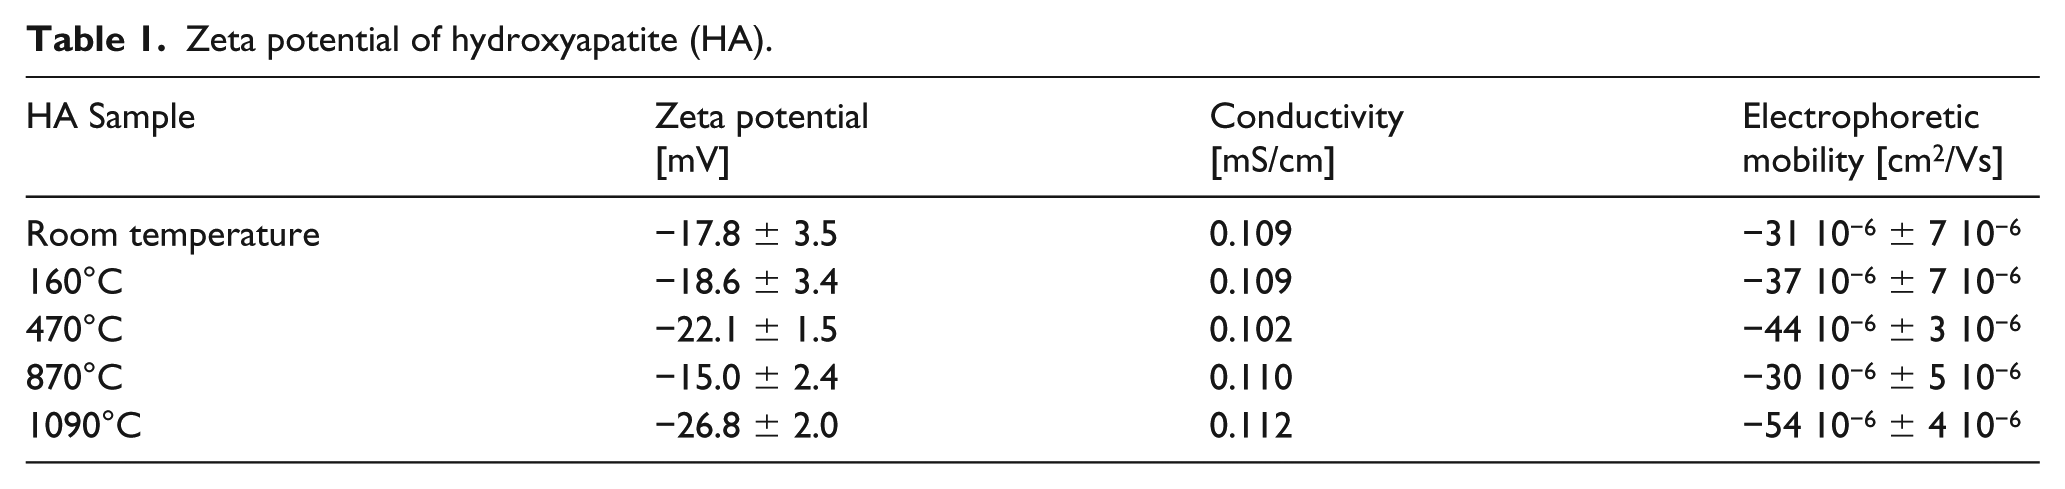
According to de Vos et al., 26 low zeta potentials have been reported to stimulate the differentiation of osteogenic cells at the surface of the material and negatively charged surfaces have excellent biocompatibility. Table 1 shows the lowest zeta potential results for HA powders at 1090°C compared with the other temperatures. In contrast, the effect of heat temperature on HA and HAS at 160°C produced a lower percentage of porosity and higher zeta potential than the other two controls at 840°C and 1093°C. It can be inferred that better cell adhesion and proliferation is obtained with 1090°C thermal treatment.
Zeta potential of hydroxyapatite (HA).
Zeta potential analysis
Table 1 shows the results obtained from the zeta potential evaluation of the HA samples in ethanol. For all cases, the pH of the solutions was measured, obtaining a pH of 7.5 for all cases.
According to a study, the zeta potential value for HA at this pH should be around 14.8 mV, as seen in the sintered sample at 870°C, however, given the favorable results of the sample at 1090°C, it was decided to make the mixtures of collagen and graphene. 27
There exist several reports that proposed the correlation between temperature and zeta potential value,28–32 where this is explained by the zeta potential magnitude improving when the temperature is increased. 28 This phenomenon occurred in our samples, because at room temperature the zeta potential value was the lowest at −17.8 ± 3.5 mV and, at the highest temperature of 1090°C, the zeta potential magnitude increased until −26.8 ± 2.0 mV.
The zeta potential of the collagen that was obtained experimentally was 6.6 mV. Table 2 shows the results of the formulation of sintered HA at 1090°C, collagen, and graphene.
Zeta potential of hydroxyapatite at 1090°C and different formulations with collagen and graphene.
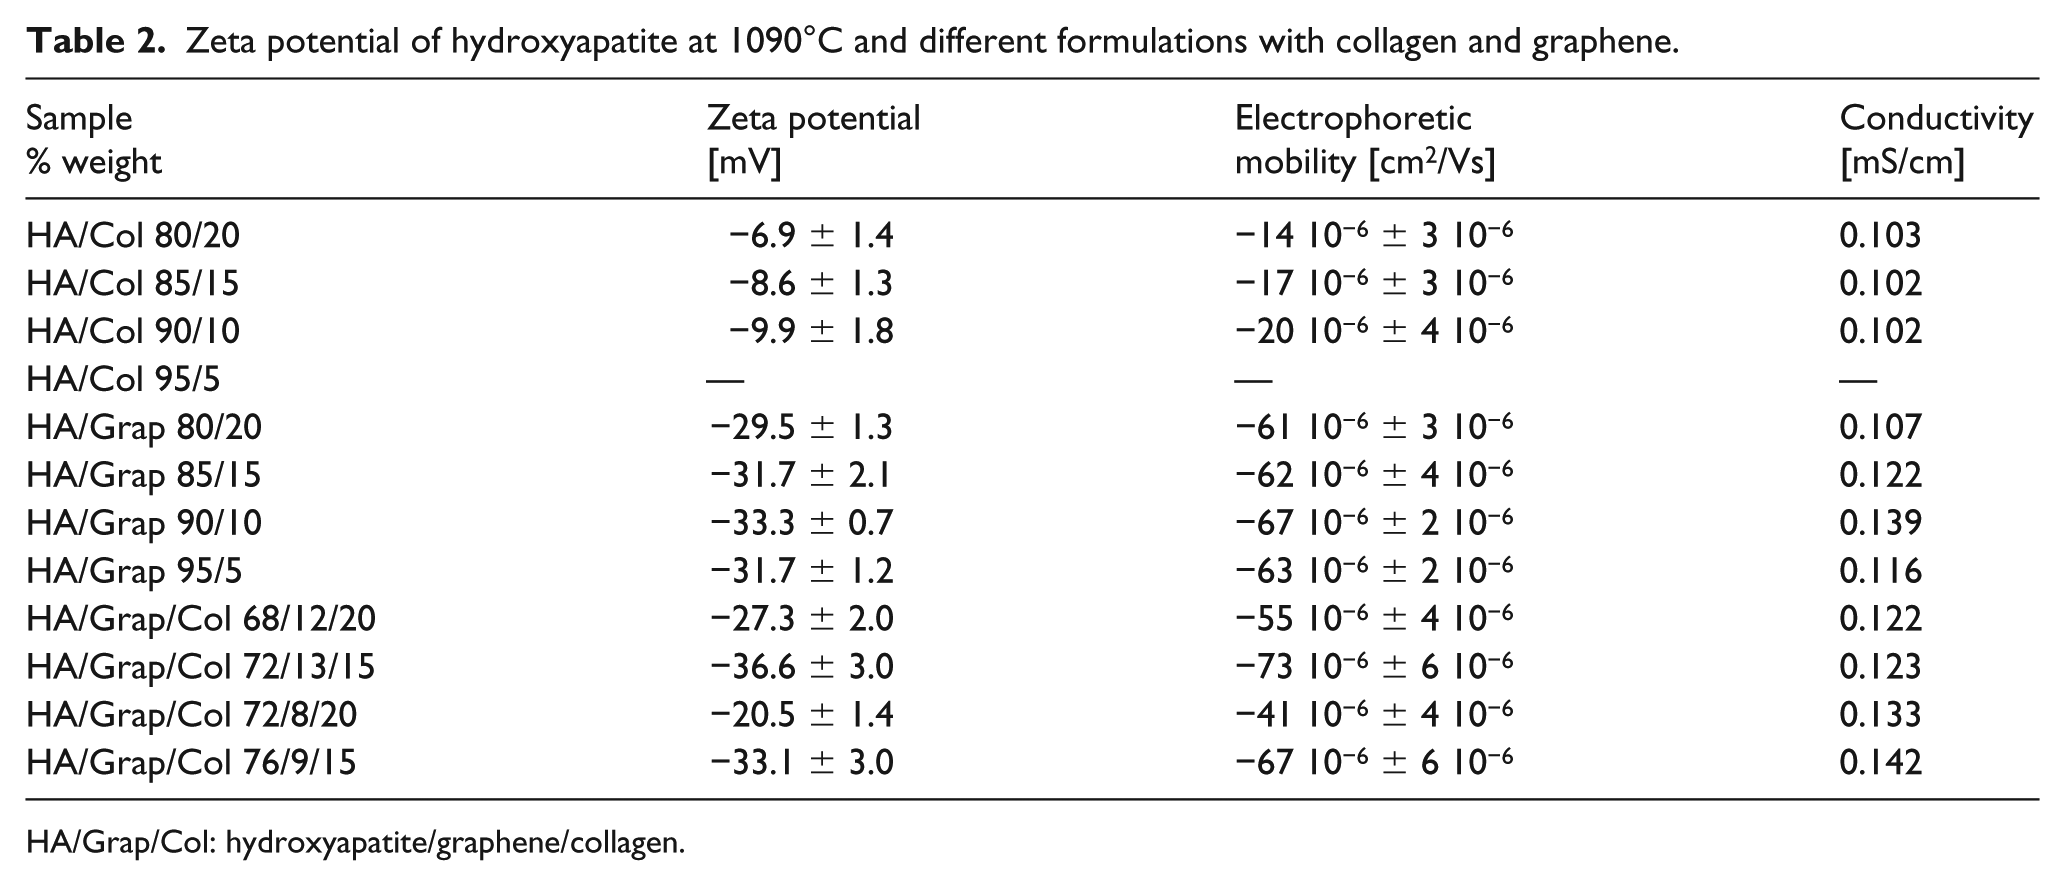
HA/Grap/Col: hydroxyapatite/graphene/collagen.
The zeta potential is a measure of the magnitude of charges on nanoparticles: the higher the value (positive or negative), the more stable the colloid dispersion is. Normally, a value of >30 mV indicates good stability, while samples with zeta potential values from −11 to −20 mV are close to the threshold of agglomeration, and samples with zeta potential values from −41 to −50 mV have good stability 33 ; it was observed that the presence of graphene increased the magnitude of zeta potential and the HA/Grap/Col 72/13/15 sample demonstrated a more stable coating, which possesses the higher concentration of graphene.
On the other hand, zeta potential gives an indication of the charge present on the particle surface. So, all our obtained samples showed a negative value, which means that our coatings are negatively charged. Shao et al. 34 proposed that samples with positive surface charges were found to be more toxic than those with negative surface charges. Positively charged nanoparticles or nanoparticles with higher “like” charges offered a higher interaction force with cells. So, it can be said that our coatings have the potential to be non-toxic to cells.
Due to various complications, it was not possible to obtain a result for the 95/5 mixture. The zeta potential of this formulation decreased considerably, being a solution that showed agglomeration in a matter of minutes and, therefore, was unstable.
Graphene alone showed an experimental zeta potential of −31.2 mV and showed no agglomerations at a temperature of 24–25°C.
An improvement in the zeta potential of the relatively similar HA alone was observed, whereby the 85/15 and 90/10 samples of HA and graphene were selected. This selection was made on the basis that it is sought to improve the mechanical properties of the coating by collagen and graphene without neglecting the osteoconductivity presented by HA; in addition, since graphene is not biodegradable, it is preferable that it is not used in high concentrations.
Considering the above, although the 80/20 and 85/15 samples of HA/collagen did not obtain the best results, the chemical composition and weight percentage are similar to those of human bone, so these two samples were preferred over the 90/10 sample.
To make the final mixture of HA, graphene, and collagen, it was considered that the bone is formed by an organic and inorganic part, whereby the HA and graphene represent the inorganic part with the selected weight ratios (85/15 and 90/10).
Compared to the results obtained with only with HA and collagen, where they agglomerated in minutes, the zeta potential of the suspension was greatly improved to the degree of being partially stable. Tests were performed at a temperature between 24°C and 25°C.
Scanning electron microscopy
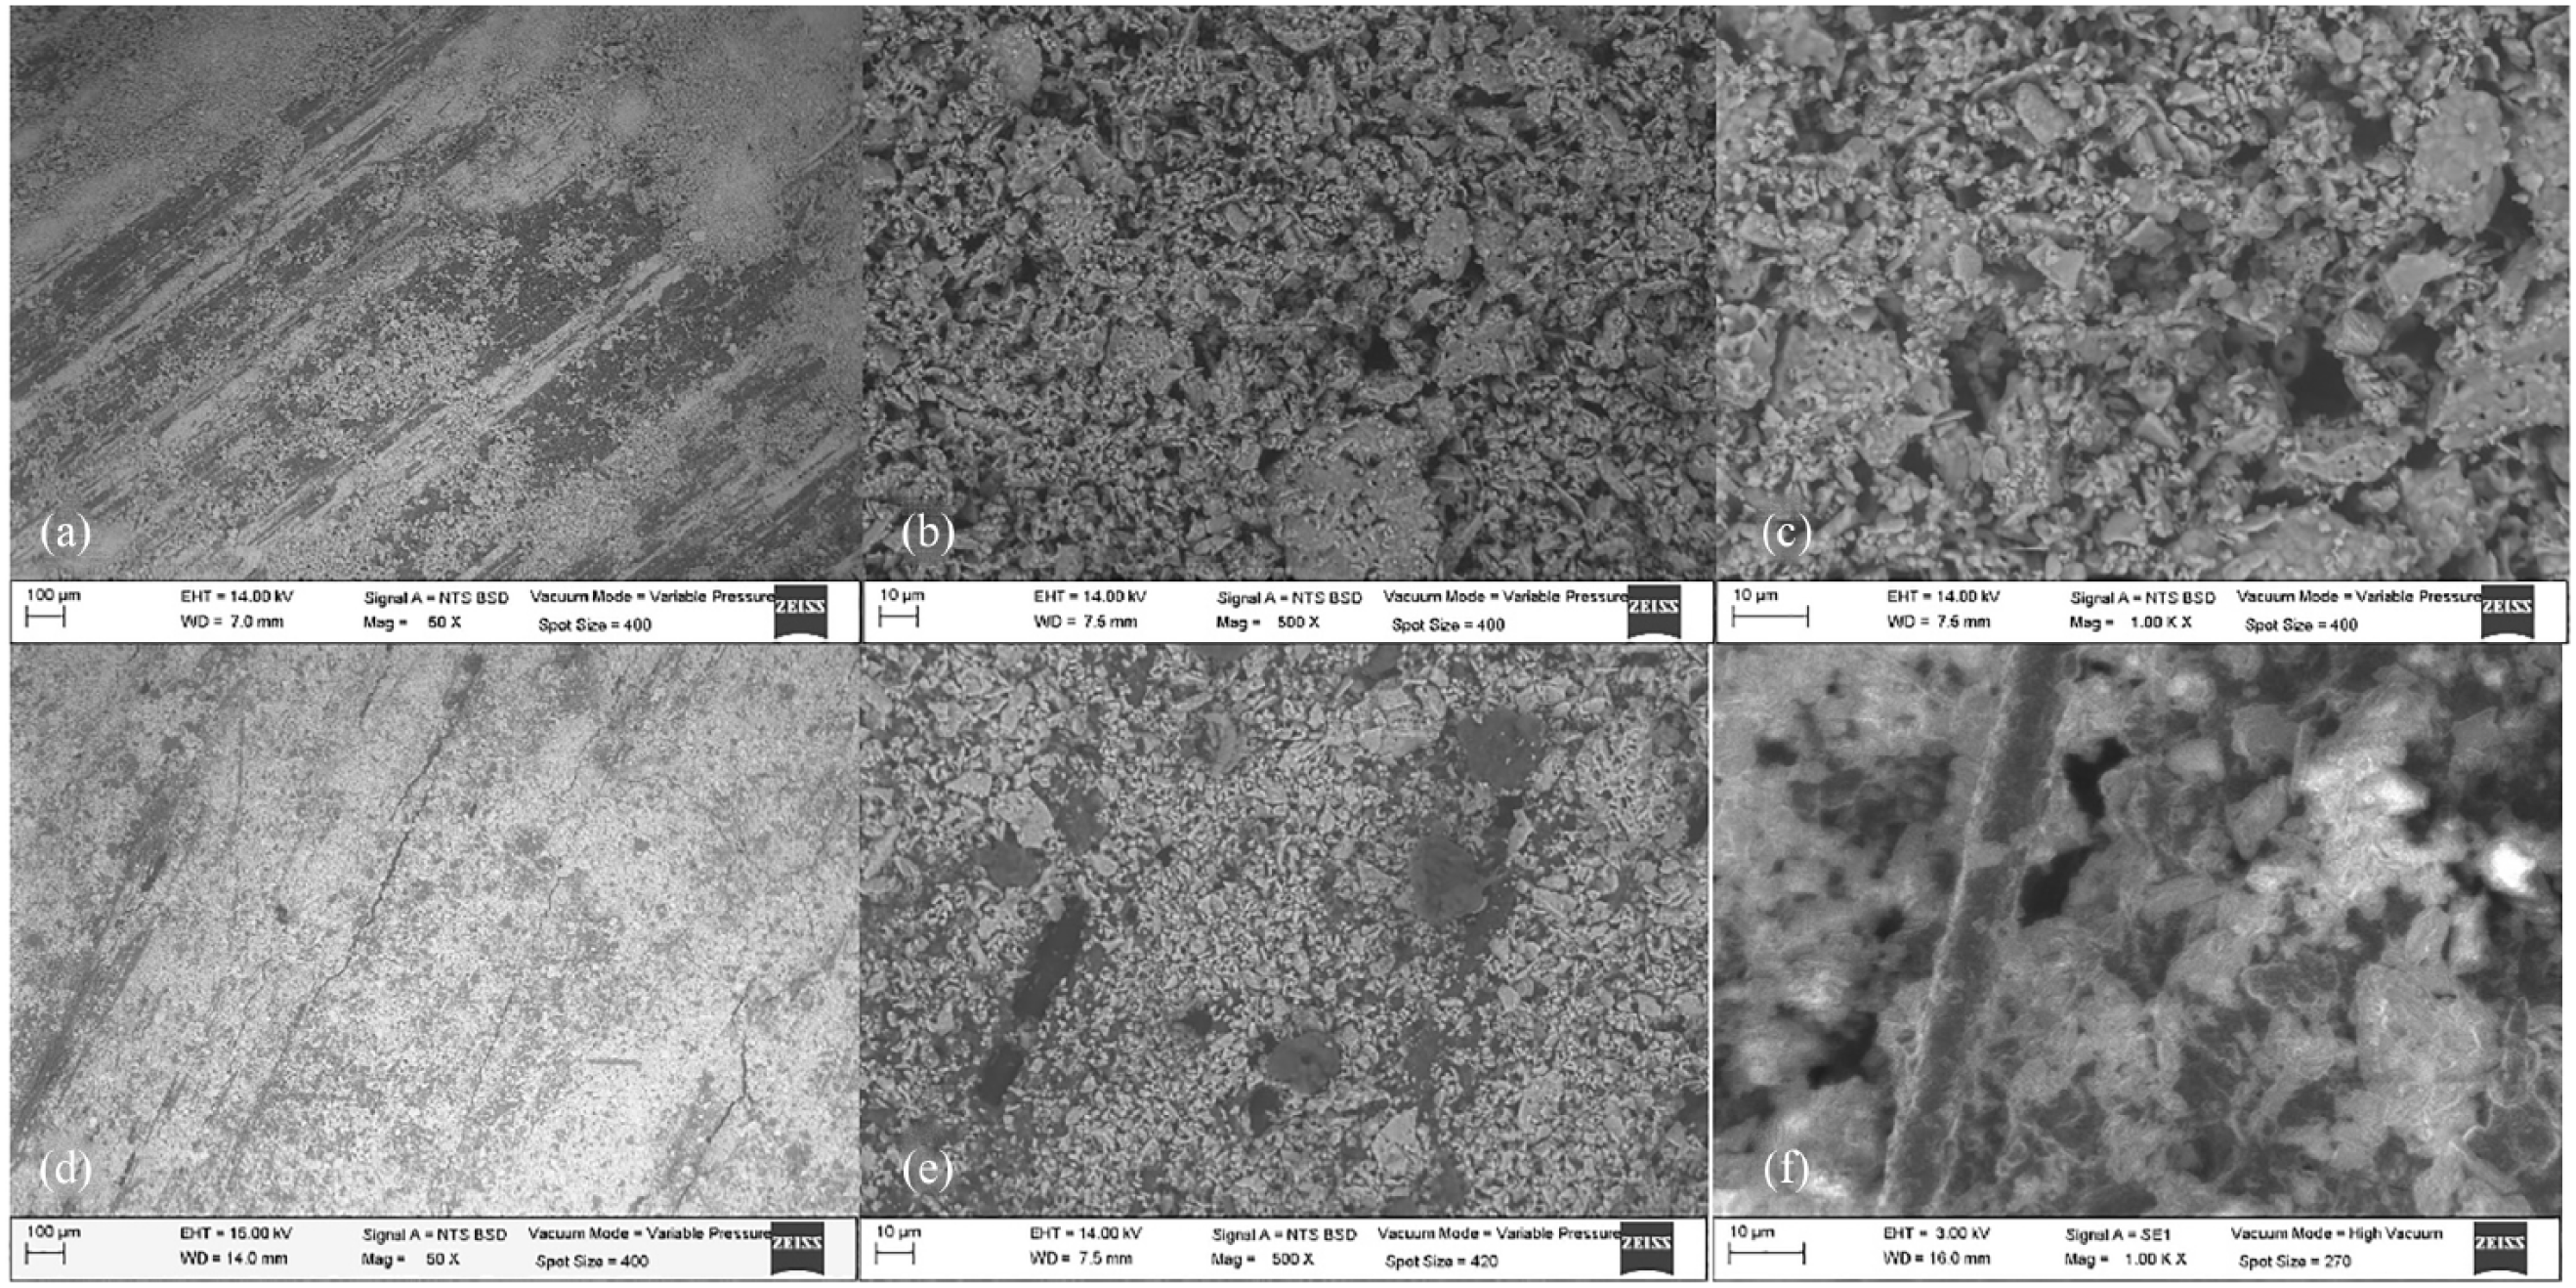
Figure 5 shows a comparison between the results of sample deposition with the HA/graphene/collagen mixture against the pure HA sample, which was performed at a 5% concentration. This concentration presented smaller cracks.
Moreover, it is possible to observe that the HA coating is more uniform than its mixtures; in Figure 5(d) it is possible to observe carbon fibers that were not coated, and in Figure 5(a) there appear to be uncoated areas; however, if the HA sample is analyzed with a chemical detector, it can be observed that there is a total surface coating and the color variation may be caused by a lower concentration of HA in those areas. Also, it can be observed in Figure 5(f) that the HA crystals were attached to the electrode.
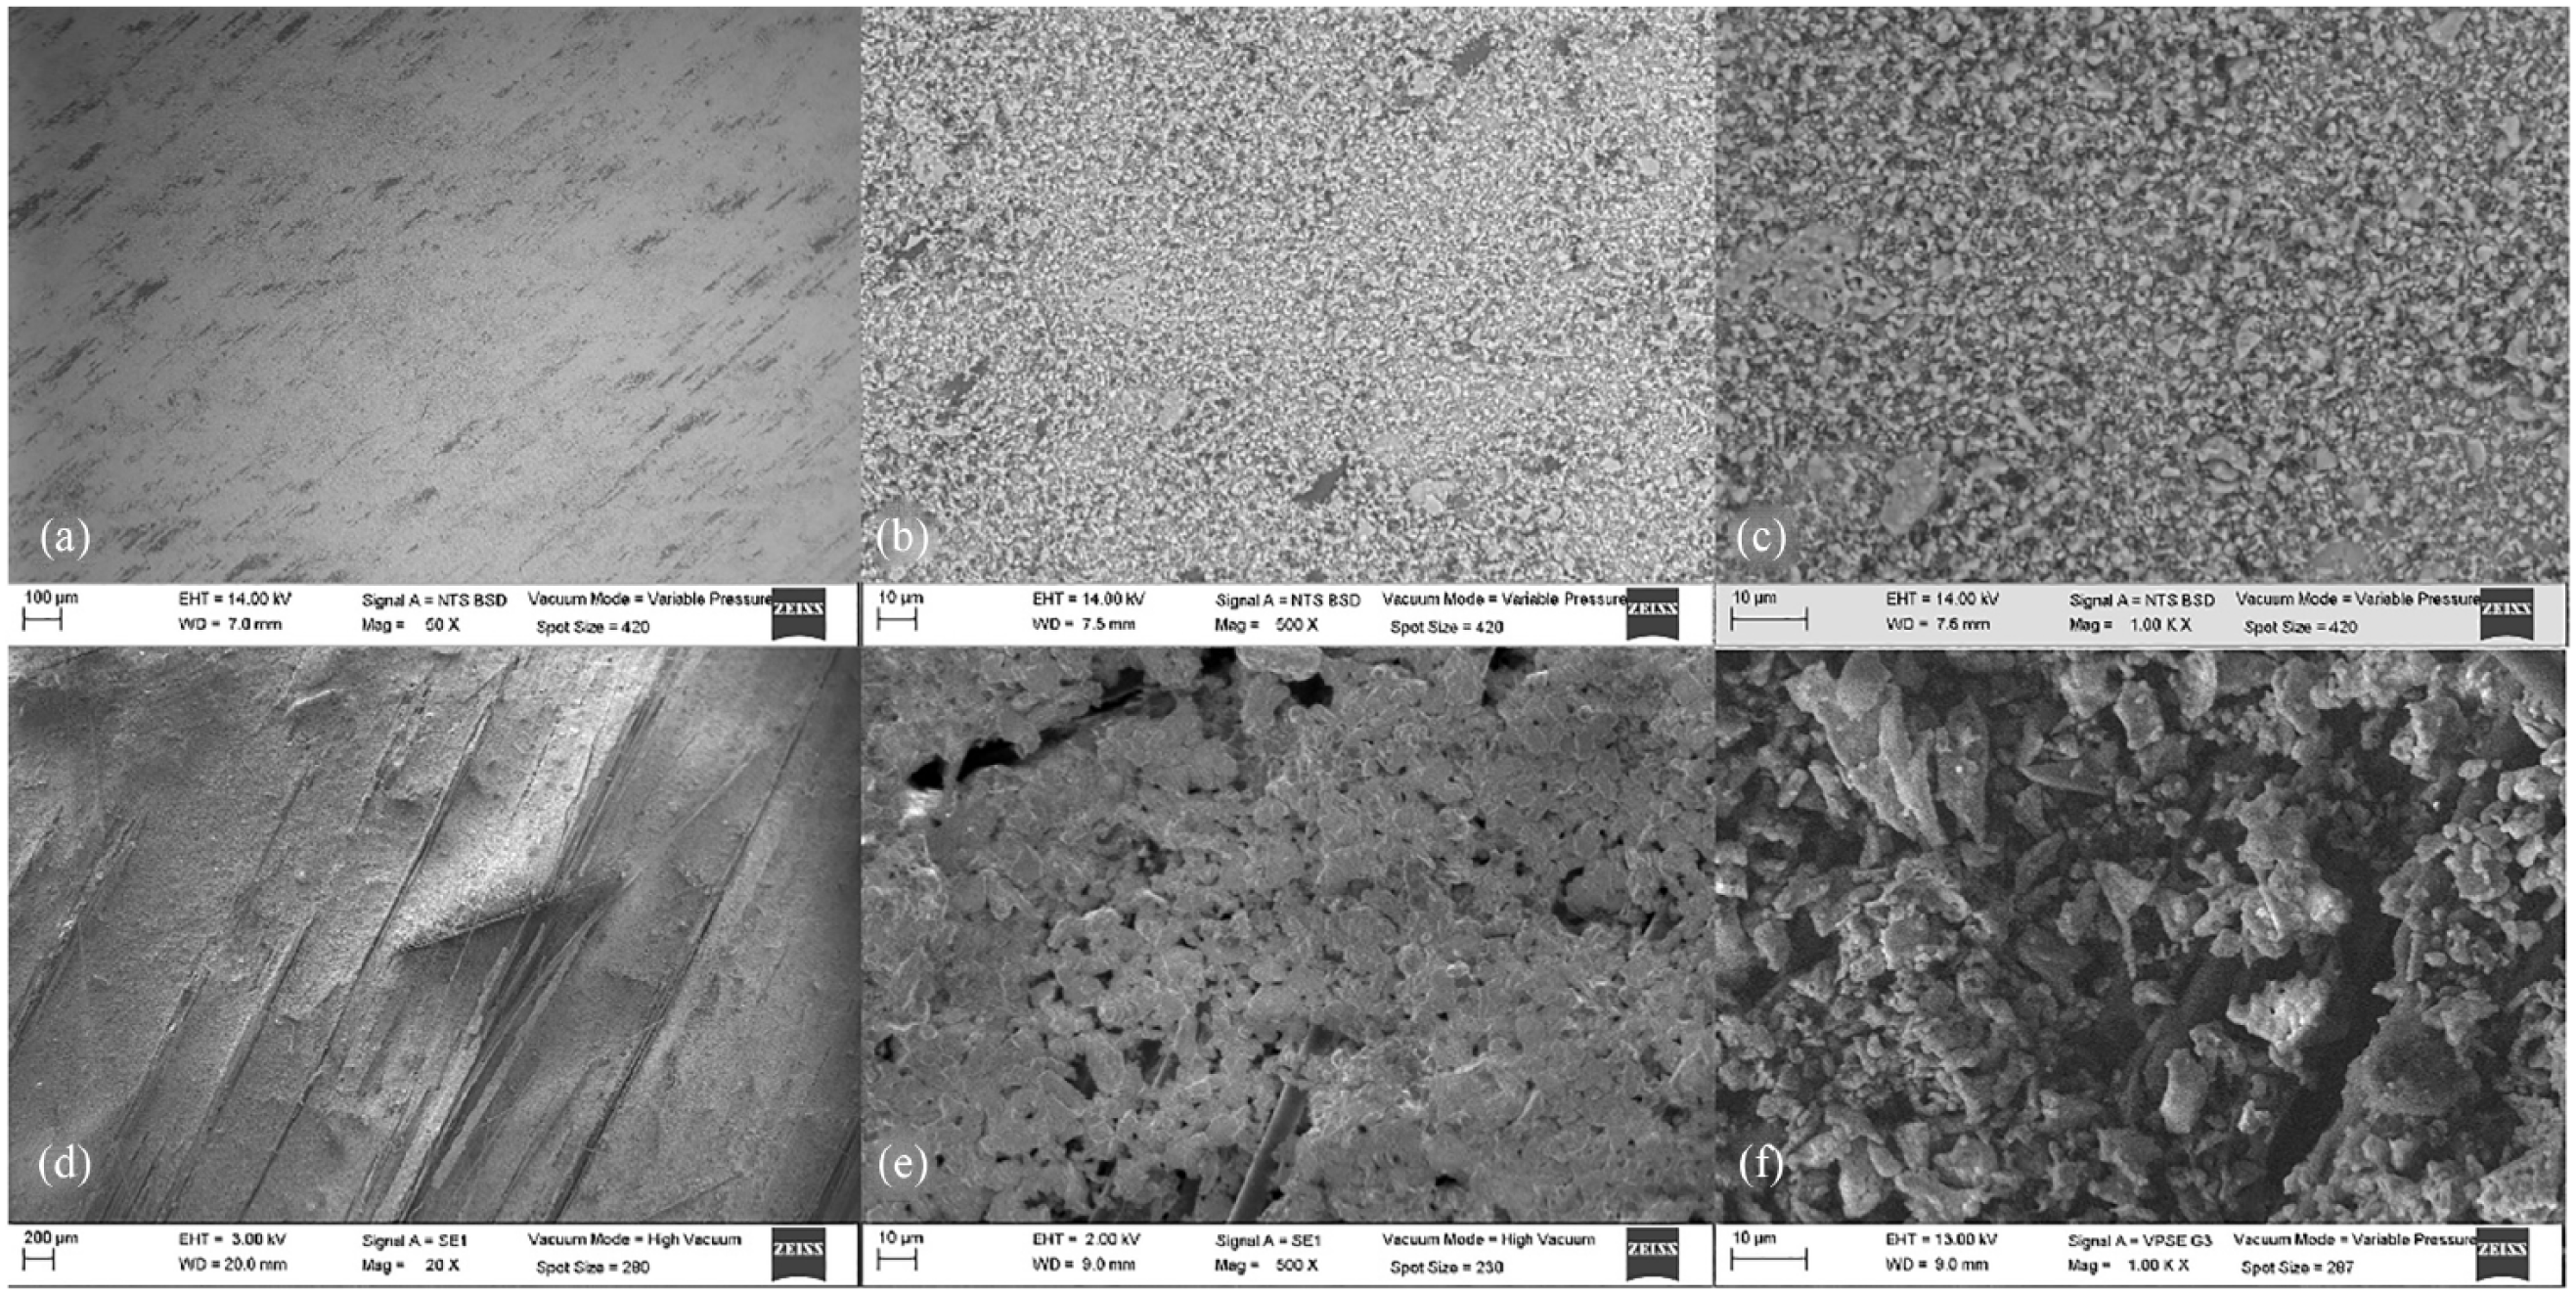
Microscopy of hydroxyapatite (HA) and 5% w/w/w HA/graphene/collagen (HA/Grap/Col) coatings on the carbon fiber surface: (a) HA coating at 50× magnification; (b) HA coating at 500× magnification; (c) HA coating at 1000× magnification; (d) HA/Grap/Col coating at 50× magnification; (e) HA/Grap/Col coating at 500× magnification; (f) HA/Grap/Col coating at 1000× magnification.
Figure 6 shows the comparison between the results of sample deposition with the HA/Grap/Col blend against the pure HA sample, which was performed at the 10% concentration. The coating on both samples is not uniform, presenting more cracks that are noticeable in the coating of the mixture.
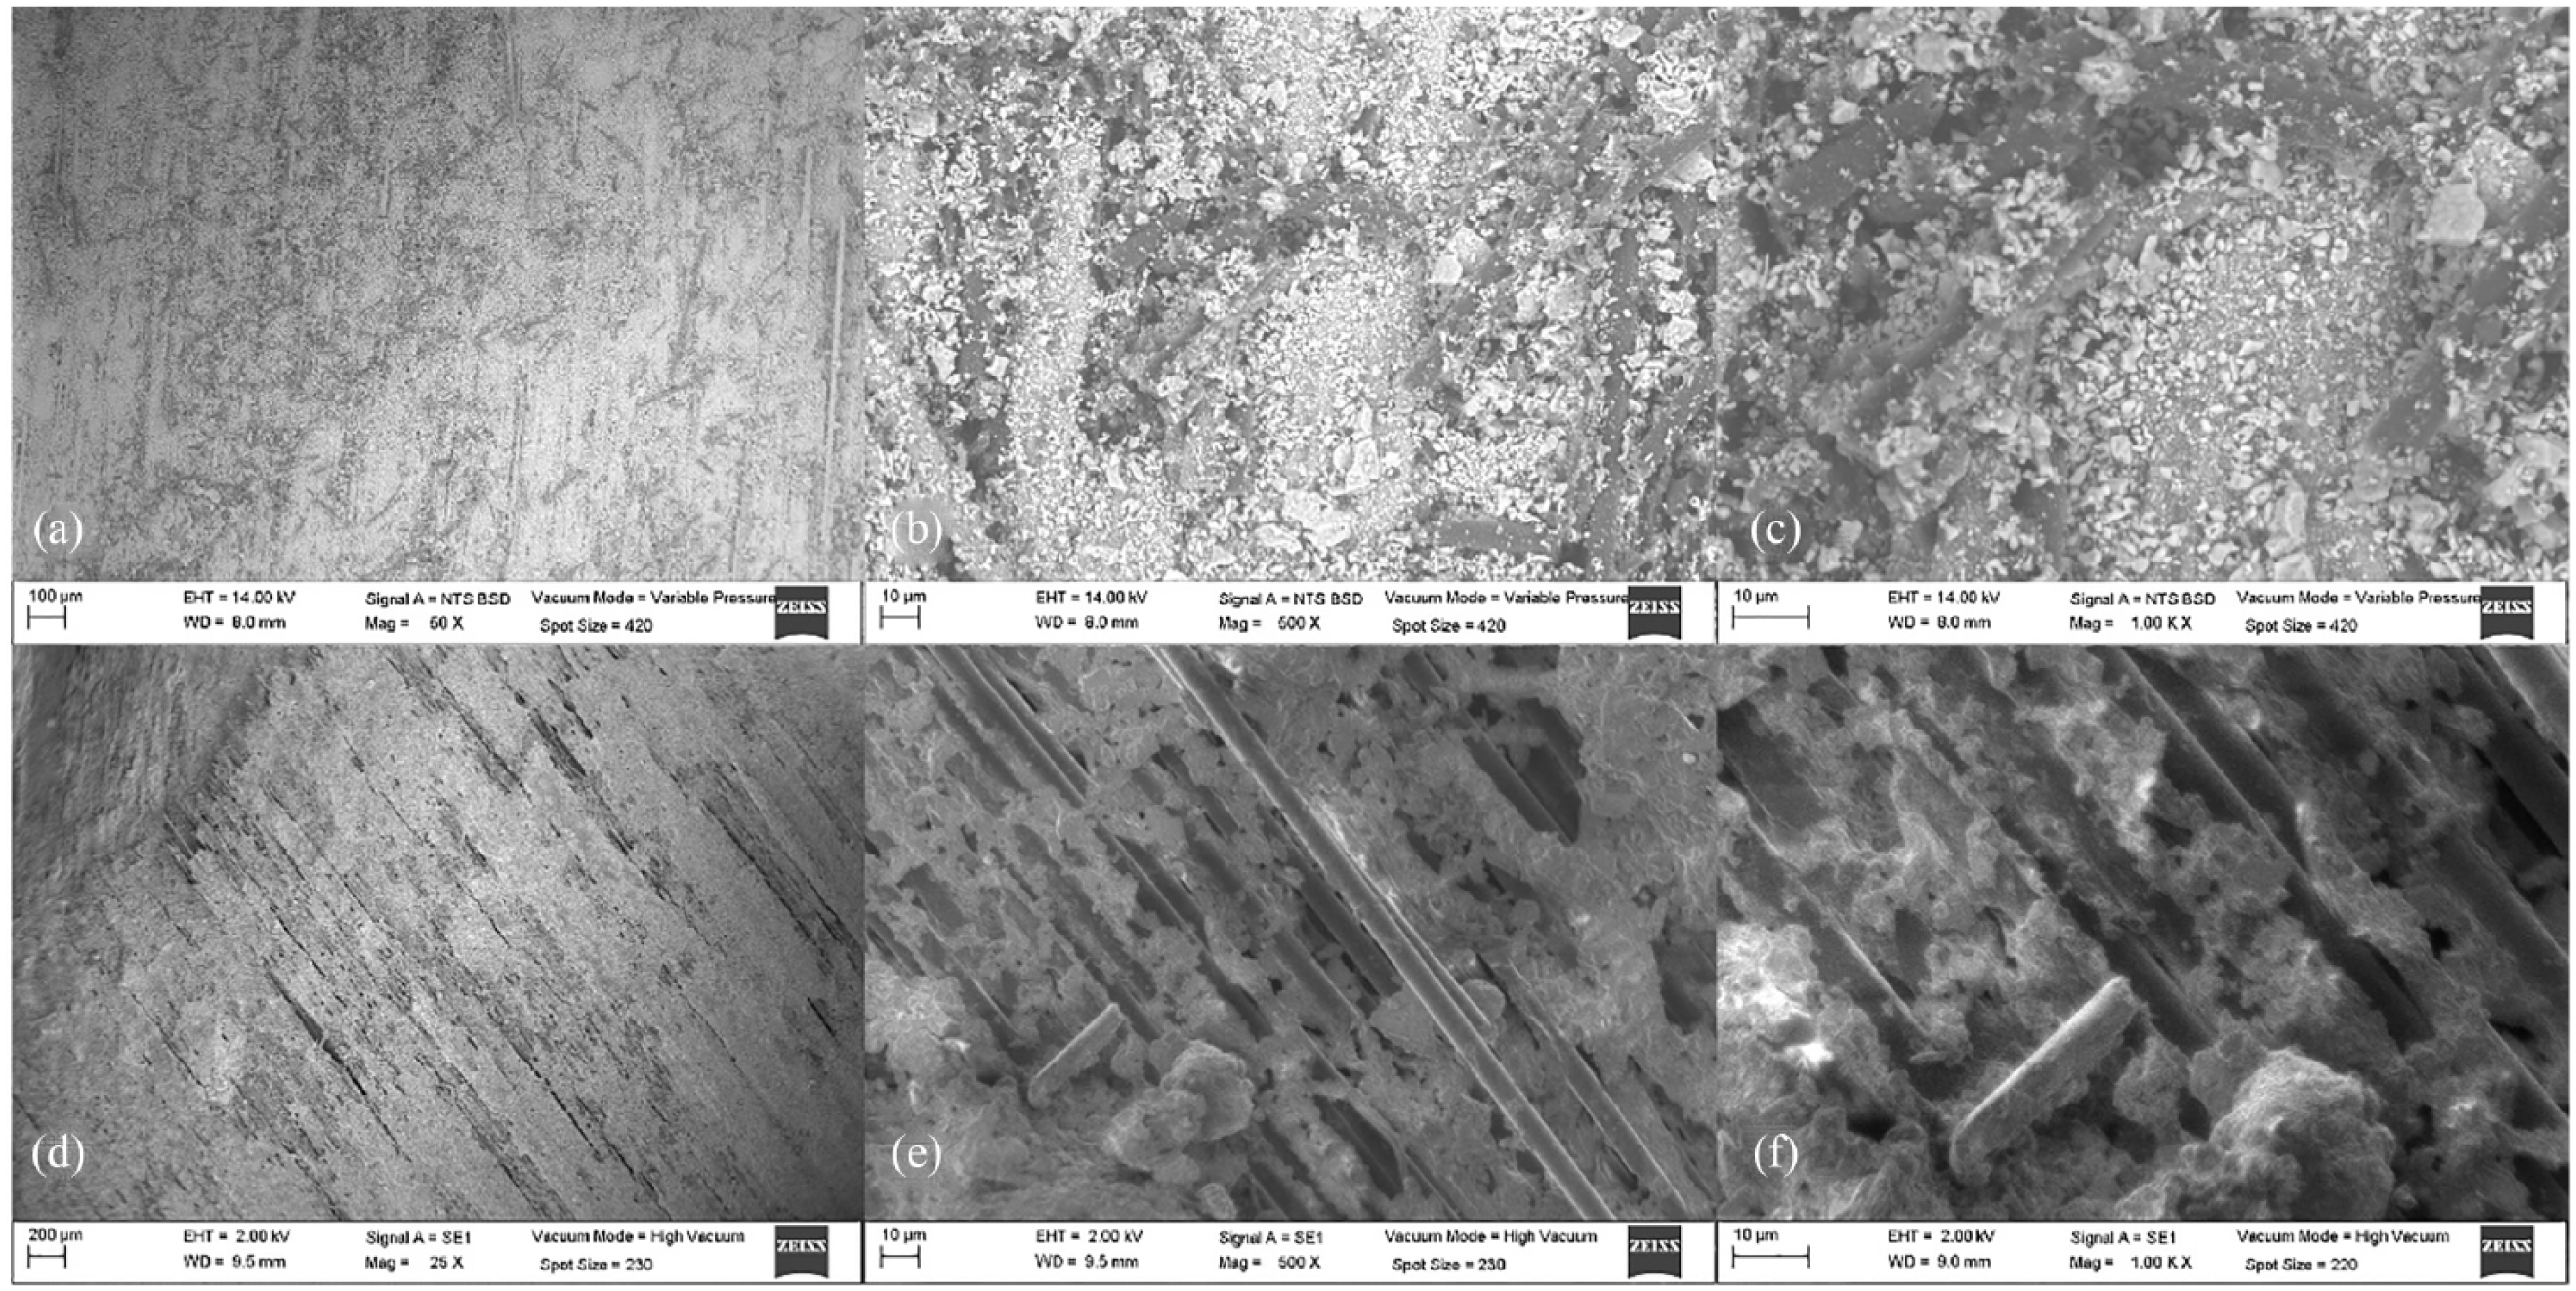
Microscopy of hydroxyapatite (HA) and 10% w/w/w HA/graphene/collagen (HA/Grap/Col) coatings on the carbon fiber surface: (a) HA coating at 50× magnification; (b) HA coating at 500× magnification; (c) HA coating at 1000× magnification; (d) HA/Grap/Col coating at 50× magnification; (e) HA/Grap/Col coating at 500× magnification; (f) HA/Grap/Col coating at 1000× magnification.
It is possible to observe a better coating ability on the HA sample than on the mixture; in Figures 6(a) and (d) it is possible to observe uncoated carbon fibers, whereas in Figures 6(b) and (c) a small agglomerate of HA and uncoated areas can be observed. Figures 6(e) and (f) show non-coated carbon fibers, demonstrating that 5% of the mixture concentration is better than 10% mixture concentration for coating purposes.
Figure 7(a) shows a comparison between the results of sample deposition with the HA/Grap/Col blend against the pure HA sample, which was performed at the 20% concentration. In this sample the coating obtained from the mixture was more uniform than that of pure HA, although the HA deposit has uncoated areas due to cracking.
Microscopy of hydroxyapatite (HA) and 20% w/w/w HA/graphene/collagen (HA/Grap/Col) coatings on the carbon fiber surface: (a) HA coating at 50× magnification; (b) HA coating at 500× magnification; (c) HA coating at 1000× magnification; (d) HA/Grap/Col coating at 50× magnification; (e) HA/Grap/Col coating at 500× magnification; (f) HA/Grap/Col coating at 1000× magnification.
Figure 7(e) shows the homogeneously coated zone with pure HA, whereas in Figure 7(b) an apparent porosity is observed. Since electrophoresis is a method that offers a homogeneous coating, it is concluded that this zone was not coated, as it should. Figure 7(d) shows areas that have not been coated and an unrecognized agglomeration, which is not appreciable to the naked eye. Raman spectroscopy could not identify the given compound as it is not present throughout the coating, but it was concluded to be collagen.
Figure 7(f) shows the coating of the HA, graphene, and collagen mixture at 1000× magnification where the concentration allowed the carbon fiber to be completely coated.
Scanning electron microscopy (SEM) micrographs allow the observation that as the concentration of the mixture decreases, the coatings become more homogeneous.
Raman spectroscopy
Blanks of the materials that confirmed the blends were made: HA, collagen, graphene nanofibers, and the surface of the pre-treated electrode. The Raman spectrum of the target of HA is shown in Figure 2. Figure 8 shows the Raman spectrum of collagen, where the band at 1658 cm−1 corresponds to amide I C=O stretching vibration, and peaks between 1234 and 1243 cm−1 are assigned to amide III, mainly C-N stretching and N-H in-plane bending vibrations, which correspond to proline-poor or polar regions of collagen. The bands at 1408 cm and 1451 cm−1 are assigned to (CH3, CH2) bending vibrations due to the amino acid side chain of collagen.35–37
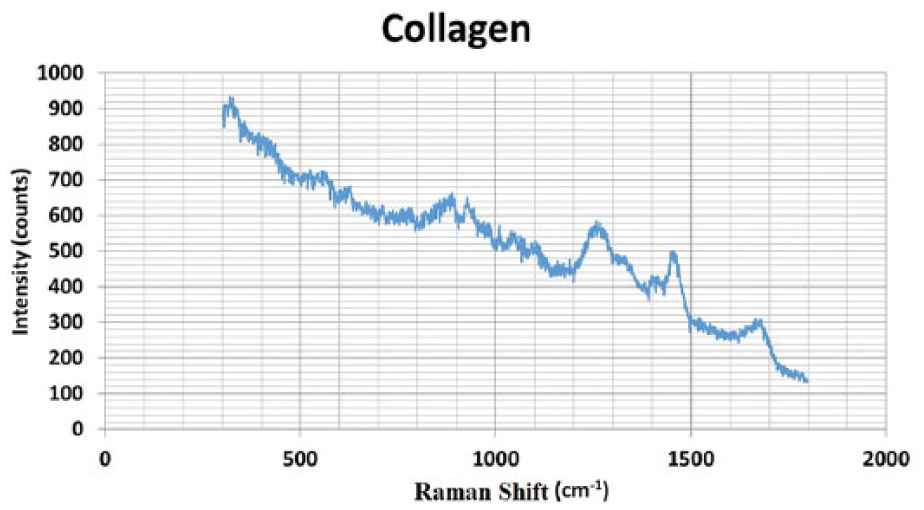
Raman spectroscopy of collagen.
In the case of the Raman spectrum of graphene (data not shown), it showed a peak at 1600 cm−1, another band of imperfections of the structure near 1500 cm−1, and a third band at 2600 cm−1, indicating that the fiber presents a structure in two dimensions.
Figure 9(a) shows the spectrum of the carbon fiber where the deposit was made; the fluorescence of the compound could not be controlled, resulting in the spectrum that is shown. However, for the purposes of this project this signal should not be visible. Figure 9(b) shows the Raman spectrum of the carbon fiber coated by pure HA, where the presence of HA peaks can be observed, together with fluorescence due to the low coating present in the sample.
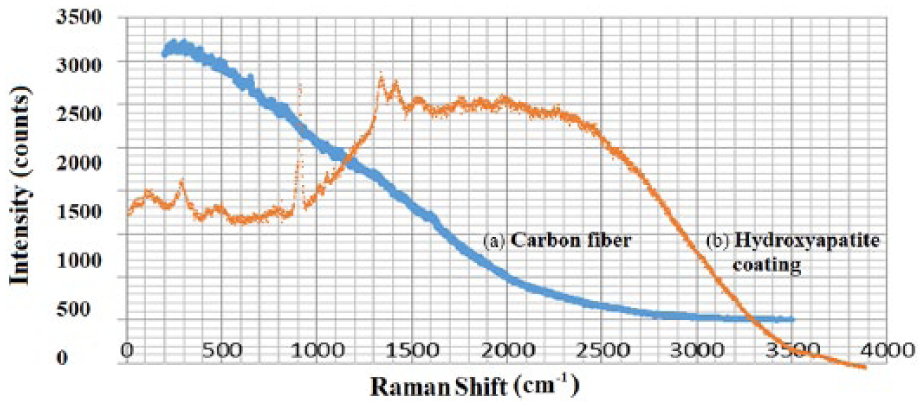
Raman spectroscopy of carbon fiber and hydroxyapatite: (a) carbon fiber; (b) hydroxyapatite.
Most of the sample has two zones: a white zone created by HA on the surface and a black zone in which most of the deposit was graphene. Figure 10(a) shows the spectrum of the white zone of the carbon fiber coated by the mixture of HA, graphene, and collagen, which reveals the presence of HA, while Figure 10(b) shows the spectrum of the black zone where no HA is present. Collagen peaks were not detected in the Raman spectrum.
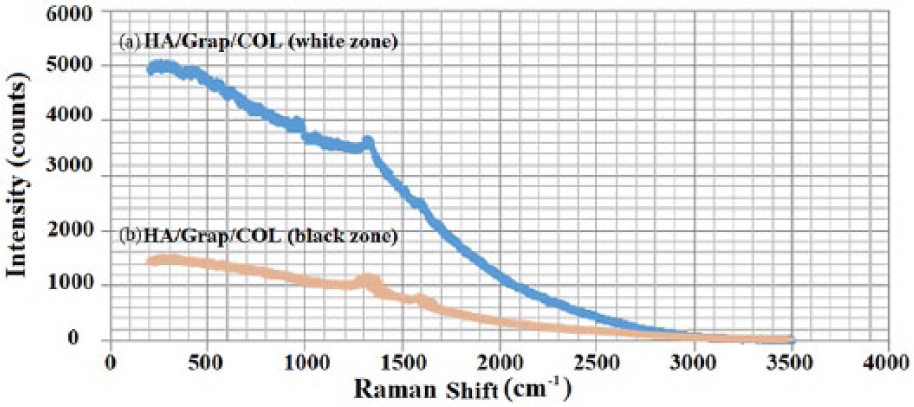
(a) Raman spectroscopy of hydroxyapatite/graphene/collagen (HA/Grap/Col) formulation on the white zone. (b) Raman spectroscopy of HA/Grap/COL formulation on the black zone.
Material deposited by the electrophoresis method
Table 3 shows the material deposited on the electrode without being able to distinguish between deposited and not deposited for the mixture of HA, graphene, and collagen.
Deposited material by electrophoresis.
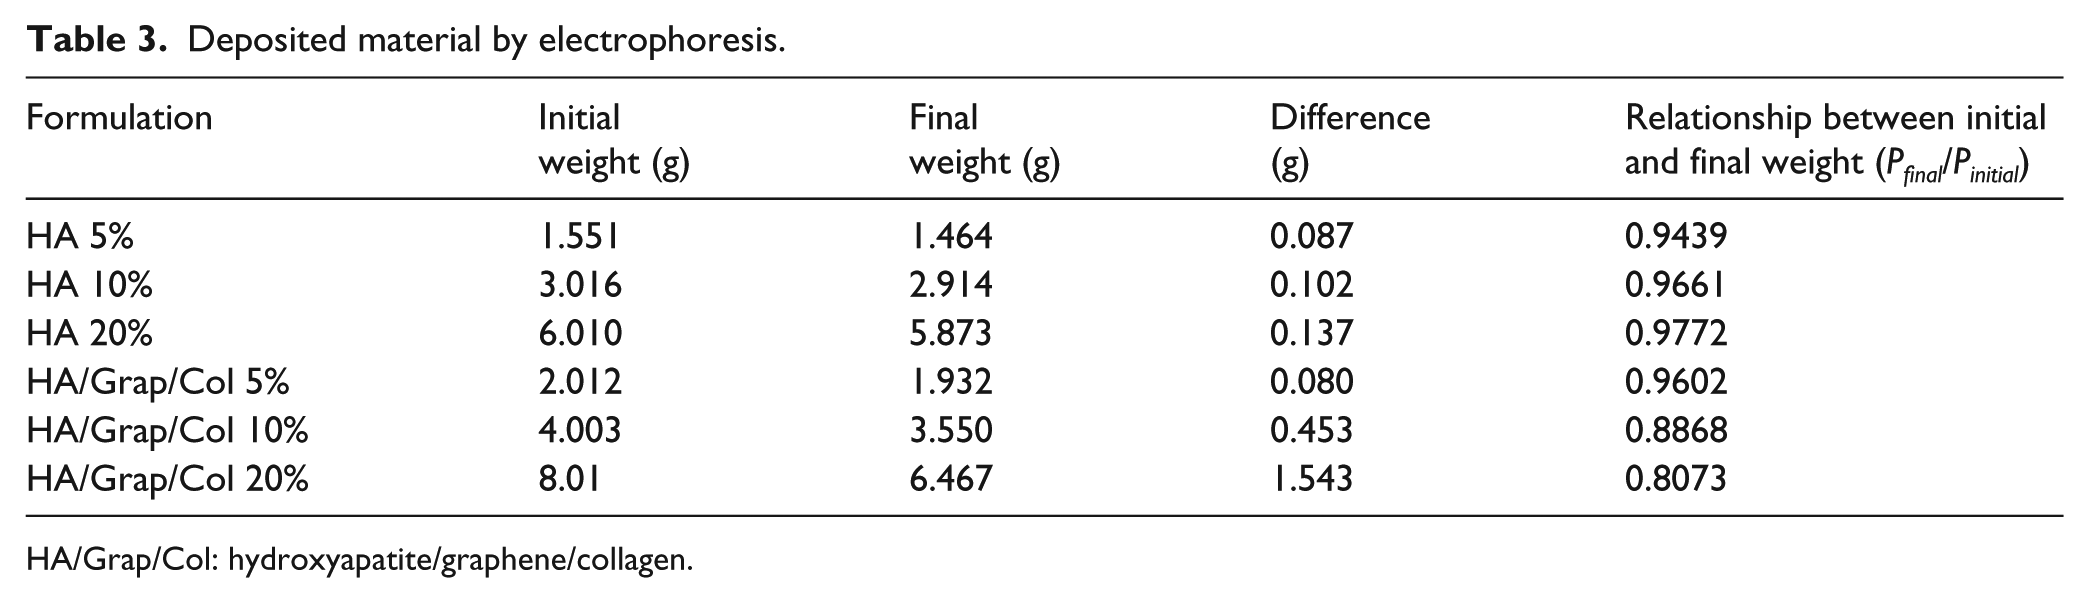
HA/Grap/Col: hydroxyapatite/graphene/collagen.
The results of the table show that for the samples of 5% the deposition of the material on the electrode is the same. Because the material does not saturate the ethanol solution as much as the others do, the agglomeration is less. The smaller mass transport to the electrode helps to obtain a more homogeneous coating because the material is deposited little by little, which accords with the SEM micrographs.
The total deposit of pure HA was affected as concentration increased, because at higher concentration there is more resistance to current flow, limiting the coating; however, the opposite case is observed in the coatings mixed with graphene, which being a conductive material, allows more current flow and more material to be deposited on the electrode in higher concentrations. The limitation of this procedure is that an increase in the current in the same area implies an increase of temperature, which is not desirable even though it can help the combination of the components.
The electrophoresis results can be compared to the summations principle of an integral, such that the larger the intervals the more variation exists in the final product; hence, a more concentrated suspension will result in a larger deposition, which is because the electrode is affected by the dispersed material, which creates noticeable gradient effects in the electric field applied on the electrode, despite HA being a non-conductive material.
Finally, the pure HA coatings presented a loss of material when a finger was passed over the deposit; this shows the need to apply methods that increase the adhesiveness, such as sintering once the electrode is coated. The mixtures added with graphene did not present this problem, although their adhesiveness to the electrode also was not so good either. Finally, it is necessary to add a pre-treatment of the electrode to eliminate possible contaminants, mainly sandpaper residues.
Conclusions
This work compared the temperature effect on the porosity and average pore diameter of HA porous scaffolds manufactured by the salt leaching method. HA was obtained by the wet-precipitation method, which demonstrated being a very convenient procedure because of the cost of the reagents, good yield, and simplicity. Regarding the thermal treatment applied to HA and HAS porous scaffolds, it can be concluded that higher porosity was obtained at 840°C. The lower zeta potential of HA powder at 840°C indicates adequate cell adhesion and proliferation proprieties.
All HA and HAS scaffolds obtained above 30% porosity, so they would be ideal for trabecular bone replacement applications. However, future cytocompatibility, in vitro bioactivity, and mechanical characterization tests are necessary to evaluate different formulations with graphene and other biopolymers that improve the mechanical properties and osteoconductibility of HA and HAS scaffolds.
The increase of zeta potential is related to more stable solutions; in addition, the electrical conductivity of the graphene helps to improve the conductivity of the solution and, as mentioned by the law of Faraday, increase the deposit in the electrode. The collagen is not dispersed in the solution, possibly agglutinating as observed in the scanning microscopy images or sedimented, since no collagen was found in the other samples analyzed by Raman spectroscopy. These results allowed the removal of the collagen from the mixture and reduced the concentration of graphene in the HA so that it is possible to apply methods like sintering to improve its mechanical properties. It is recommended to test the 90/10 concentration of HA/graphene, since its zeta potential is very similar and it is still considered stable to start from this solution in future works.
For medical applications, the coating with the graphene mixture is not the optimum, since the deposit that is produced is mainly graphene, as observed in the characterization of the electrode; however, on its surface, the 5% weight concentration blend can be used, as roughness aids cell growth. HA, on the other hand, despite having a homogeneous coating in a concentration of 5% with the proposed method, does not present sufficient adhesiveness, since the simple fact of touching removes a part of it from the electrode.
Future work
Regarding the electrophoretic technique, future tests where voltage variations, temperature, and time applied can be evaluated, in order to obtain a complete characterization of the methodology for HA and HA/Grap/Col coating on carbon fiber surfaces. Future studies on the biocompatibility with osteocytes of the coatings should be evaluated, as well as considering the possibilities of pre-treating the graphene or replacing it with another component that improves the conductivity of the medium and gives it better mechanical properties to the HA. It is expected to be able to evaluate the adhesiveness of the material as well as to apply techniques to improve the adhesion of the material to the electrode so that it may have medical applications for coating prosthetics.
Footnotes
Acknowledgements
The authors thank Alan Saul Alvarez Suarez for revision of the English in the manuscript.
Declaration of conflicting interests
The author(s) declared no potential conflicts of interest with respect to the research, authorship, and/or publication of this article.
Funding
The author(s) disclosed receipt of the following financial support for the research, authorship, and/or publication of this article: This work was supported by “Fondo Sectorial de Investigación y Desarrollo en Salud y Seguridad Social SS/IMSS/ISSSTE-CONACYT 2016” (Mexico) (Grant Number 272310).