
Abstract
Background:
A multiferroic material can simultaneously show two or more basic magnetic properties, including ferromagnetism, antiferromagnetism, and ferroelectricity. BiFeO3 is a multiferroic material with a rhombohedral distorted perovskite structure. Doping can reduce the volatility of Bi and greatly improve the magnetoelectric properties of BiFeO3.
Methods:
To investigate the influence of the doping content we used the following analytical methods: X-ray powder diffraction (XRD), scanning electron microscopy (SEM), microwave network analysis (PNA-N5244A), and the Superconducting Quantum Interference Device (Quantum Design MPMS) test.
Results:
With the increase of Ca2+ concentration in the solution, the grain size of Bi1-xCa x FeO3 becomes smaller, showing the role of Ca2+ ions as the dopant for fine grains. The calcination temperatures are the major causes for the saturated magnetization. The residual magnetization (Mr) and the coercive force (Hc) decrease linearly with the increase of x value, and due to the effect of Ca2+ substitution at Bi3+ sites, which causes the valence change of Fe and/or the oxygen vacancies.
Conclusions:
The XRD result indicates that the diffraction peak emerges with the increase of Ca2+ and the main diffraction peak achieves a high angle. The best calcining temperature is 600 °C, and the morphology is very dependent on the calcining temperature.
Introduction
Multiferroic materials were introduced by Switzerland in 1994. Schmid 1 showed that materials with two or more of the basic properties of iron, including ferromagnetism or antiferromagnetism, ferroelectricity, and elasticity simultaneously, are called multiferroic materials. These materials show spontaneous polarization and magnetization simultaneously, at a certain temperature that causes the magnetoelectric coupling effect. This effect leads to several new and meaningful physical phenomena in multiferroic materials, such as magnetization redirection or transition of the ferromagnetic phase under the effect of field and polarization redirection or transition of ferroelectric phase, etc. 2 It has the potential to be very desirable in applications related to magnetic storage media and sensors. Temperature-dependent magnetization and hysteresis loops indicate antiferromagnetic behavior in BiFeO3 at room temperature.3–6 At present, the most popular application of the perovskite multiferroic materials is in solar cells. Till now, the main methods of preparing BiFeO3 are hydrothermal, co-precipitation,7–8 and the sol-gel method. 9 However, it is difficult to obtain larger magnetoelectrics 10 due to the volatilization of the bismuth element, as the existence of the pure phase of BiFeO3 delays the conversion of Fe3+ into Fe2+ in the preparation process. This may be due to the existence of an oxygen vacancy, which causes leakage of current. Many reports have shown that doping could prevent the volatilization of the Bi element, which reduces oxygen vacancies and improves the structure and magnetoelectric properties. Currently, doping in the A-bit BiFeO3 is done mainly by alkaline earth ions such as Ca, 11 Sr, 12 Ba, 13 and rare earth ions14–24 such as La, Nd, Sm, and Gd. Doping in B-bit BiFeO3 is mainly done by excessive ions such as Co, Ti, 25 Mn,26–27 Nb, 28 Cr, 29 Sc, etc. In the present work, we have used the polyacrylamide sol-gel method, which has the advantages of easy control and convenient synthesis of BiFeO3 nanoparticles by doping Ca2+ in A-bit BiFeO3.
Materials and methods
The preparation of synthetic BiFeO3
The various steps for the synthesis of Bi1-xCa x FeO3 powder by the polyacrylamide sol-gel method 2 are shown in Figure 1. At first, identical amounts of Bi(NO3)3·5H2O and Fe(NO3)3·9H2O are added to dilute nitric acid. Then, some ethylenediamine tetraacetic acid is added as a complexing agent. Appropriate amounts of glucose and Ca(NO3)2·6H2O are added according to the proportion, and the mixture is constantly stirred. Acrylamide monomer with metal cations is added and the precursor liquids for the reaction are mixed completely. The precursor solution is heated at 70 °C in a water bath for 5–10 min to obtain a transparent solution. Then, an appropriate amount of ammonia is added to the transparent solution to bring its pH value to about 3. Finally, the solution is heated at 80 °C for 5–7 h in the water bath until a wet gel is obtained. The wet gel is placed in a digital oven at 120 °C to dry for 12 h to obtain a dry gel. Then the dry gel is passed through ethanol to obtain a self-propagating light yellow powder. The powder is ground in a muffle furnace at 600 °C for 3 h to obtain a mud-yellow fine powder.
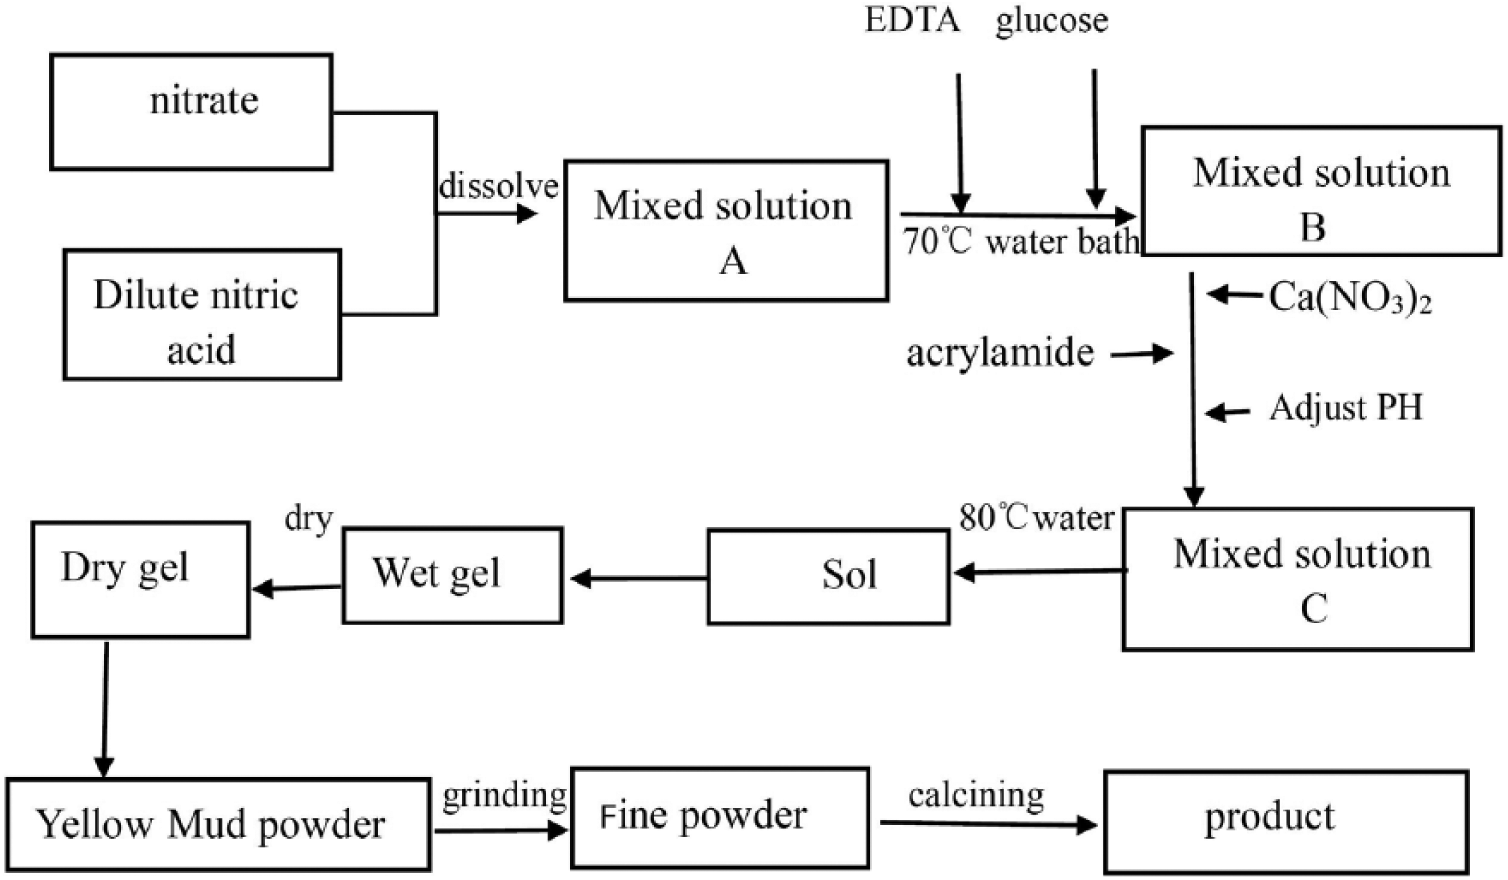
The flow chart of the experimental process.
Sample characterization
X-ray diffraction (XRD; D/max-2500v/pc, Rigaku, Japan) was used to characterize the structure of the material. The XRD process was carried out using a pressure pipe at 40 kV; pipe flow, 20 mA; Cu-Kα target radiation; scanning speed, 10°/min; scanning range 10°–80° (2θ). A scanning electron microscope (NoVaTM Nano 430, FEI, Hillsboro, USA) was used to observe the microstructural properties of the Bi1-xCa x FeO3 nanomaterial, including particle size, geometrical shape, uniformity, and reunion phenomenon. The magnetic character of the samples was tested with a Superconducting Quantum Interference Device (Quantum Design MPMS series XL-7, San Diego, USA). We have measured the hysteresis loop of samples at room temperature. This process enables to determine the magnetic parameters of samples such as the saturation magnetization (Ms), residual magnetization (Mr), and coercive force (Hc). The measured dielectric parameters of the samples were tested using microwave network analysis (PNA-N5244A), performed at Keysight, USA.
Results and discussion
XRD analysis of Bi1-xCa x FeO3
Figure 2 shows the XRD patterns of Bi1-xCa x FeO3 (x = 0.02~0.12) powders calcined at 600 °C for 3 h. All the samples are single phase and all the diffraction peaks coincide with the standard perovskite structure (JCPDS card no. 861518) of BiFeO3. In Figure 2, no impurity peaks are obviously of Ca2+ doping and show a good crystallinity. With the increase of Ca2+concentration in the solution, the intensity of the diffraction peak of the samples gradually reduces, such as the (12-1) peak. This explains that the increase in Ca2+ concentration in the solution is against the growth of Bi1-xCa x FeO3 crystal.
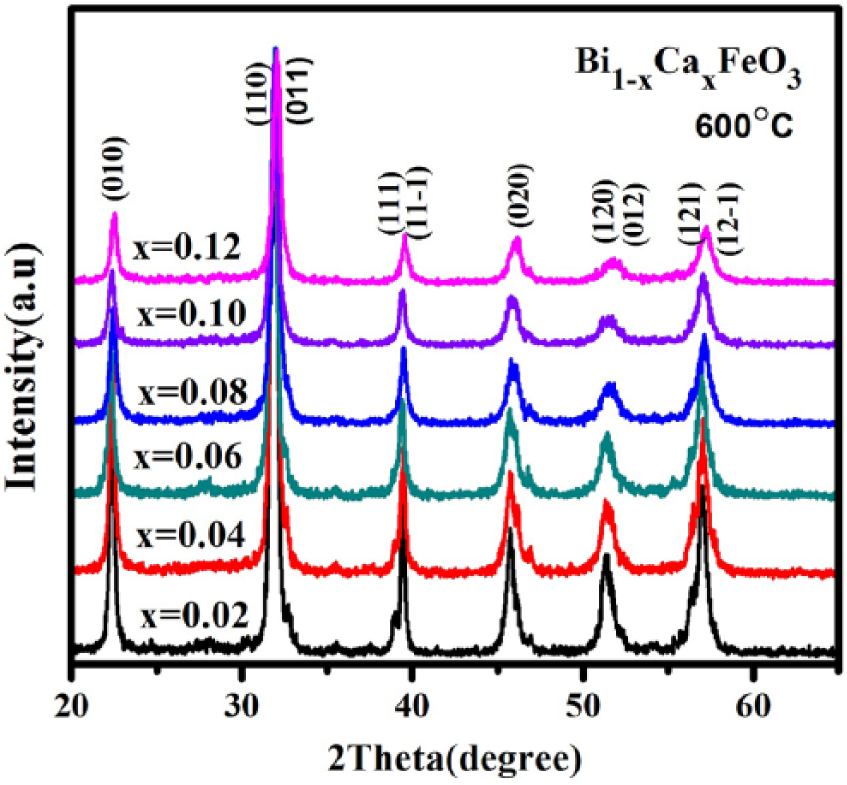
XRD patterns of Bi1-xCa x FeO3 samples calcined at 600 °C for 3 h.
The diffraction peaks appear to merge into another plane. As shown in Figure 3, for example, (012);(120) merge into (120), (111);(11-1) merge into (11-1), and (121);(12-1) merge into (12-1) with the increase of Ca2+ concentration in the solution. This suggests that with Ca2+ doping, the crystal structure changes 24 due to the different ionic radius.
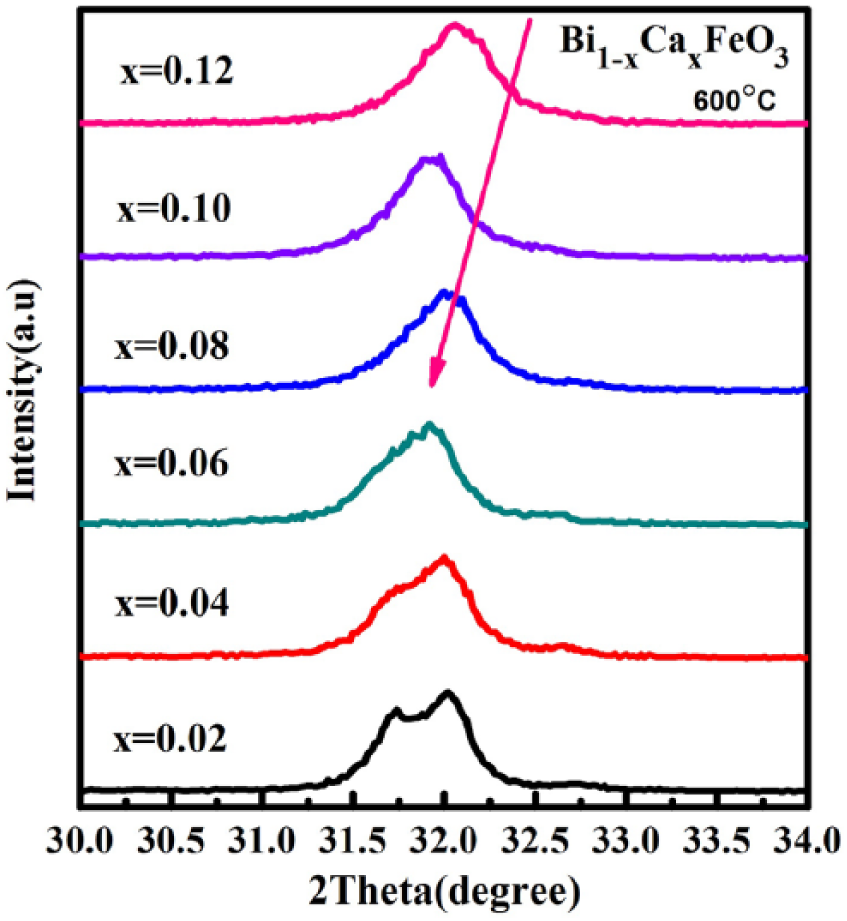
XRD patterns of Bi1-xCa x FeO3 samples.
According to Scherrer’s equation: 25
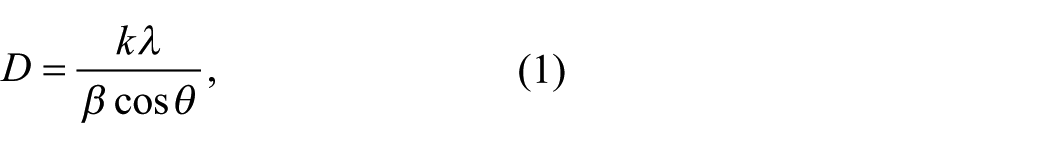
where k is the Scherrer constant, β is the half-width of the high peak, D is the grain size, λ is the X-ray wavelength, and θ is the diffraction angle. The wider the peak, the smaller the grains, and vice versa. Therefore, with the increase of Ca2+ concentration in the solution, the grain size of Bi1-xCa x FeO3 is smaller, showing the role of Ca2+ ions as the dopant for fine grains.
Figure 4 shows the average grain size with variation in the Ca2+ content, calculated using Jader 5.0 software. We can see from the figure that the average grain size of the samples is reduced with increased dosage of Ca2+. This is in agreement with the previous conclusion. Especially from x = 0.02 to x = 0.06, the average grain size of samples decreases linearly. When the doping of Ca2+ become more than 0.06, the grain size decreases more slowly. From the doping x = 0.08 to x = 0.12, the average grain size becomes almost independent of concentration of Ca2+. It can be concluded that when the concentration of Ca2+ in the solution reaches a specific value, the sample has little effect on the average grain size.
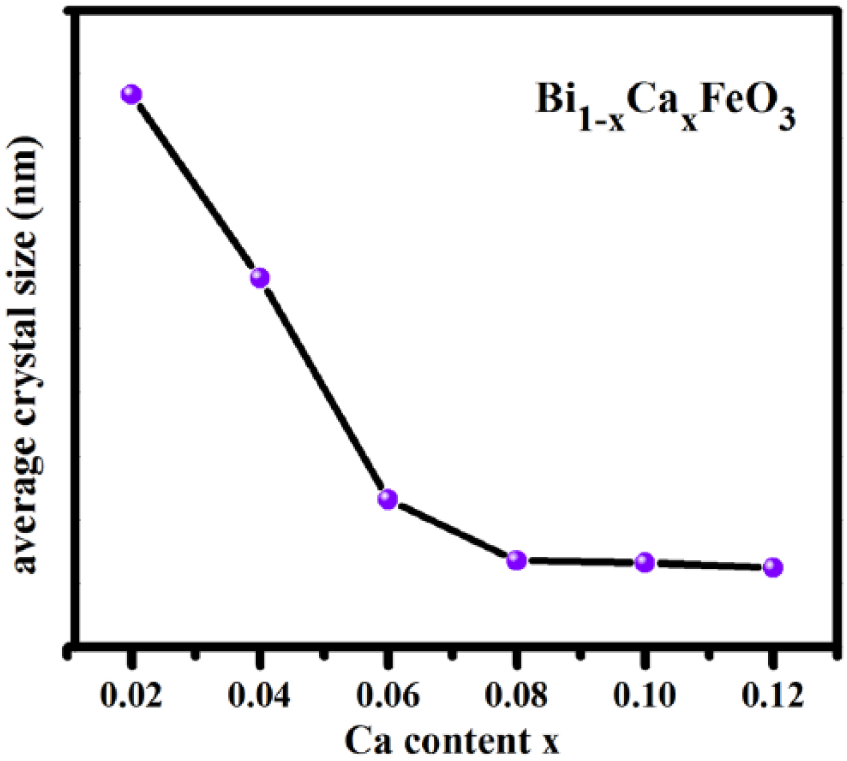
The average grain size trends with changes in Ca2+ content.
Figure 5 shows the XRD spectrum of Bi0.88Ca0.12FeO3 calcined at different temperatures. All the samples are of single-phase structure with a sharp diffraction peak, which suggests the crystallinity of the samples is good even at elevated calcining temperature. As shown in Figure 5, a small amount of impurity phase (*) and (♣) calcined at 700 °C and 500 °C leads to decomposition of Bi1-xCa x FeO3 yielded into the mixed phase of Bi25Fe2O29 and Bi2Fe4O9. 25
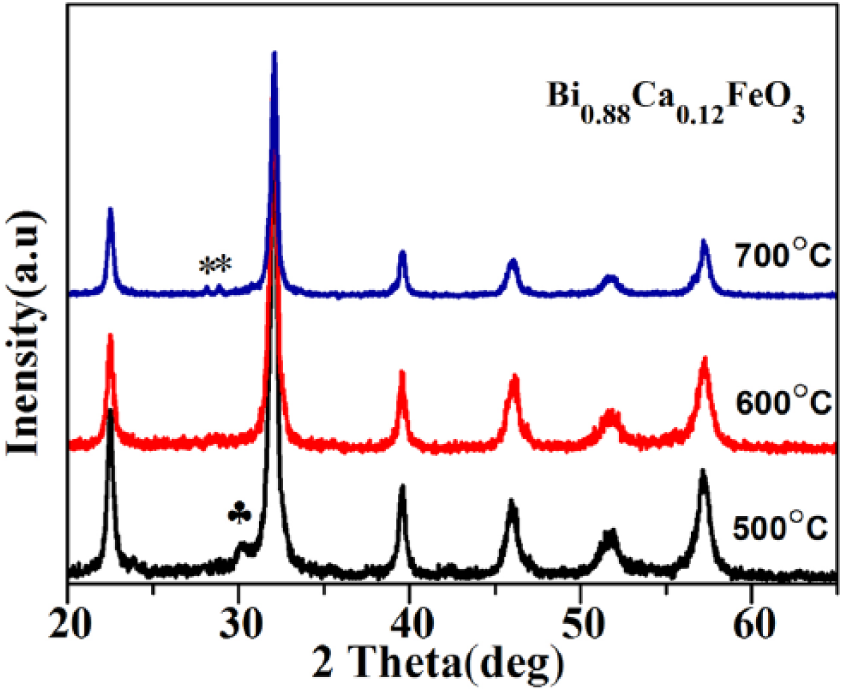
XRD graphs of Bi0.88Ca0.12FeO3 calcined at different temperatures.
The SEM studies of Bi1-xCa x FeO3
Figure 6 shows the SEM images of Bi1-xCa x FeO3 calcined at 600 °C for 3 h. According to Figure 6, the particle size of the samples decreases and the grain boundary becomes clearer with increasing Ca2+ in the solution. The reunion phenomenon of samples shows the role of Ca2+ doping, which has refined the grain. This is inconsistent with the XRD results. Also, the brightness of the image with the addition of Ca2+ means that increases in Ca2+ are advantageous to make the grain surface smooth and flat. When the amount of Ca2+ doping is x = 0.04, more grain adopts a rectangular or square shape. With increases of Ca2+, grain shape becomes more and more irregular. This is in agreement with the XRD conclusion (doping changes the crystal structure). Finally, the doping of Ca2+ not only affects the particle, but can also contribute to the density of the sample.
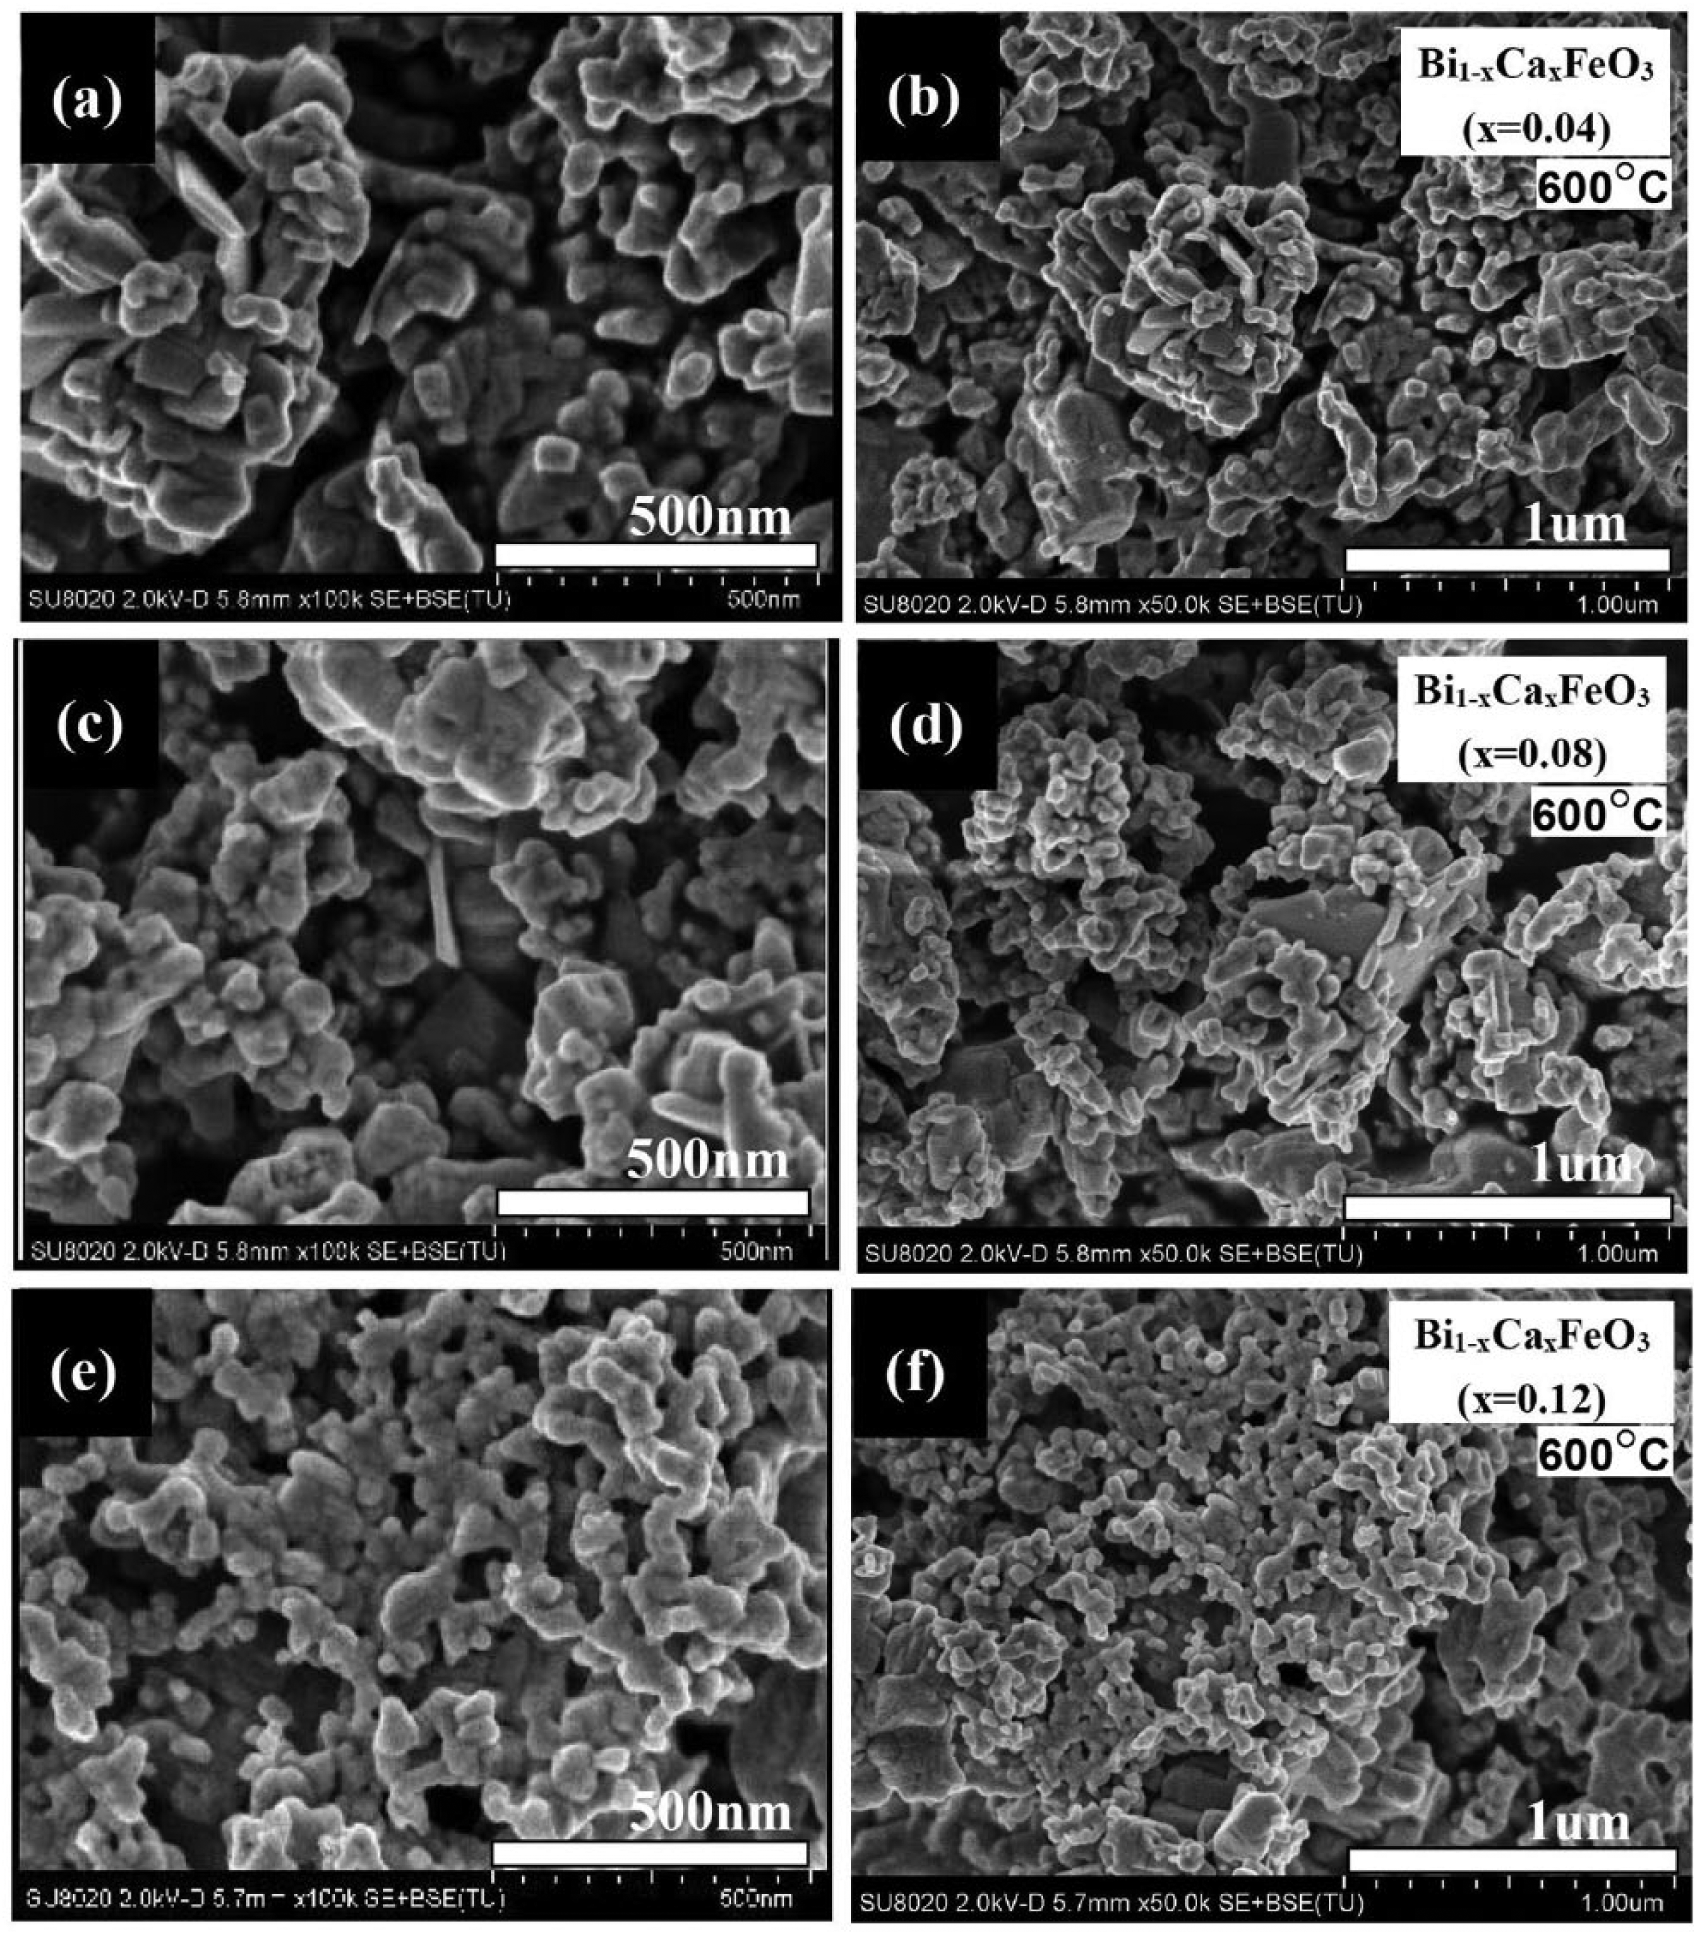
SEM micrographs of Bi1-xCa x FeO3 calcined at 600 °C for 3 h.
Figure 7 shows the SEM images of Bi0.88Ca0.12FeO3 after different calcining temperatures. The different calcining environment had a great influence on the morphology of the samples. When calcined at 500 °C, most of the particles in the sample are small, the shape is approximately circular, and the grain boundary is clearly visible. When it enters the crystalline phase at 600 °C, the particles become smaller, with irregular shapes. When the temperature is around 700 °C, the samples recombine, increasing the grain size. This is due to high calcining temperature resulting in shrinkage of the crystals under increasing stress. 27
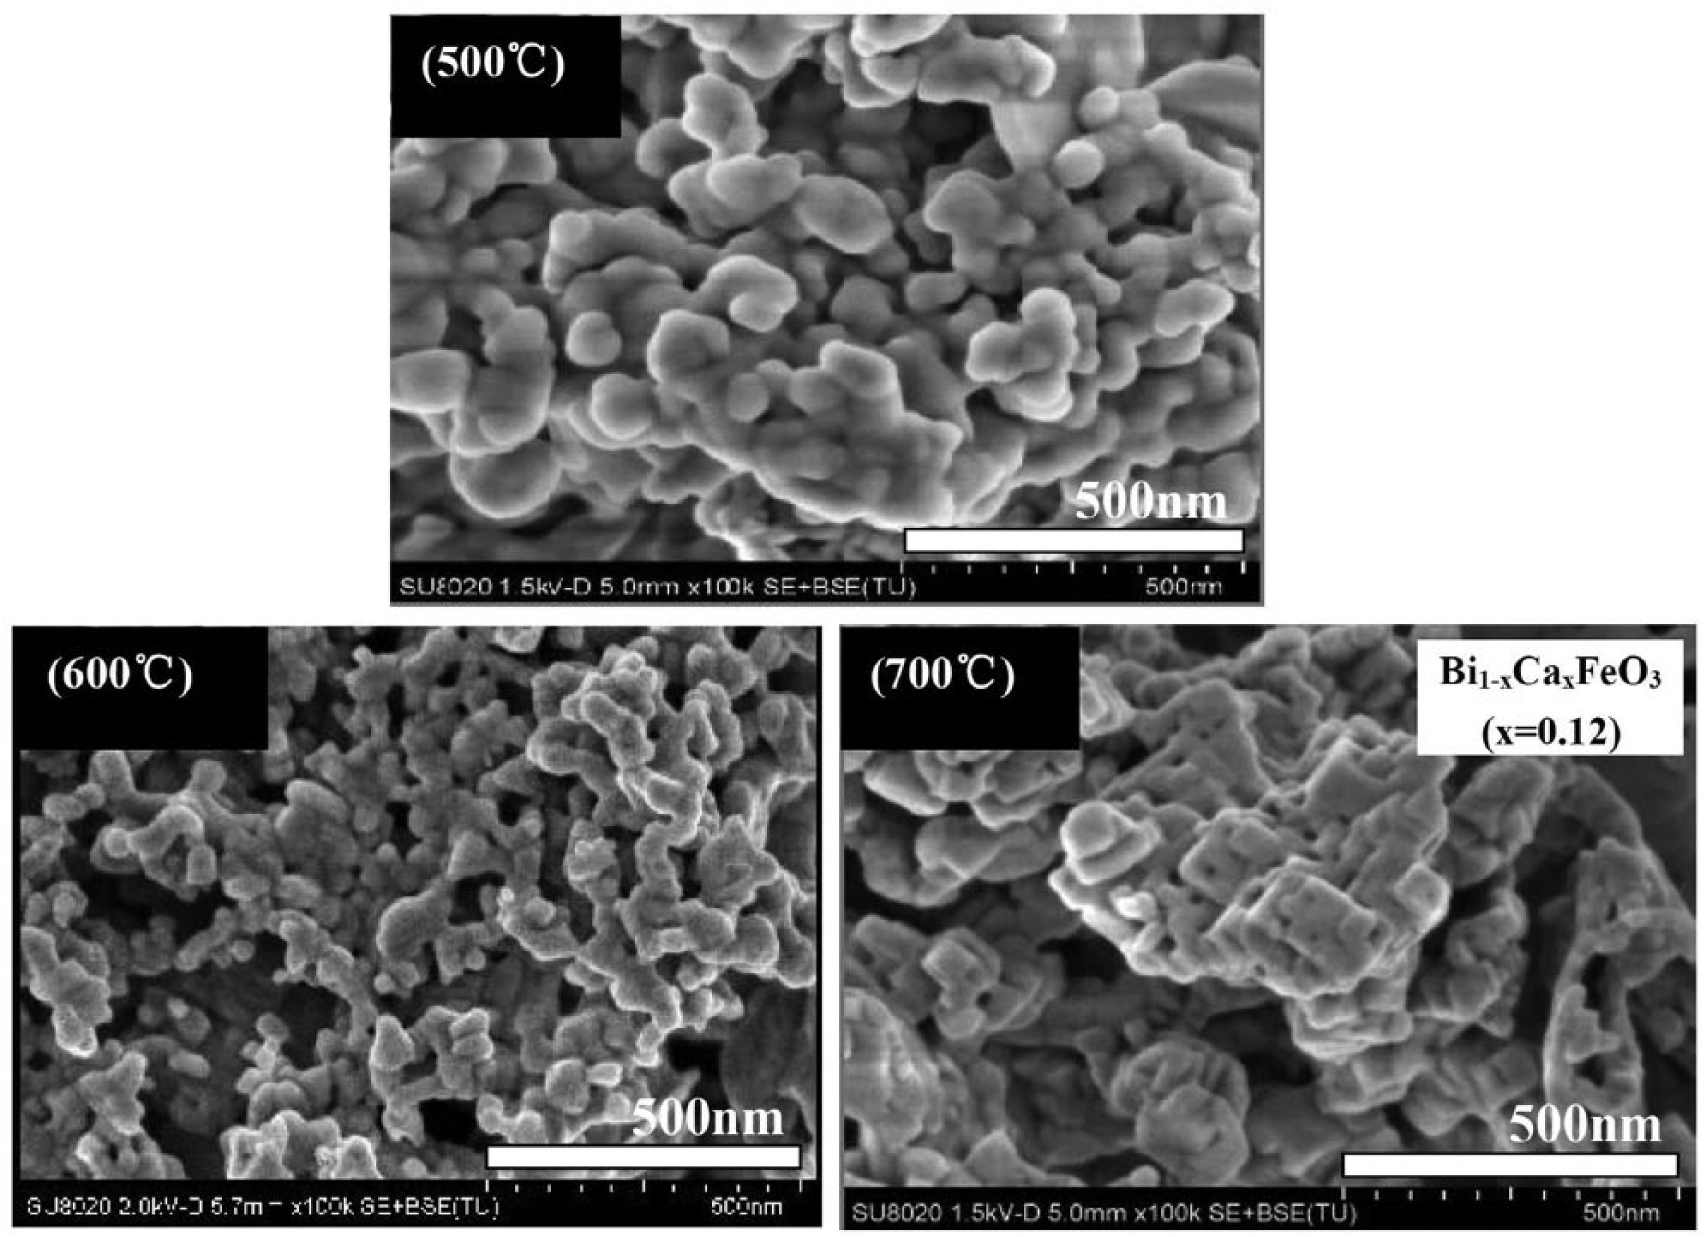
SEM micrographs of Bi0.88Ca0.12FeO3 calcined at different temperatures.
Magnetic studies of Bi1-xCa x FeO3
Figure 8 shows the magnetic hysteresis curves for Bi1-xCa x FeO3 calcined at 600 °C for 3 h. According to the shape of the curve, three hysteresis loops are at the saturated state and the saturation magnetization could be expressed by using the following relation:28–29
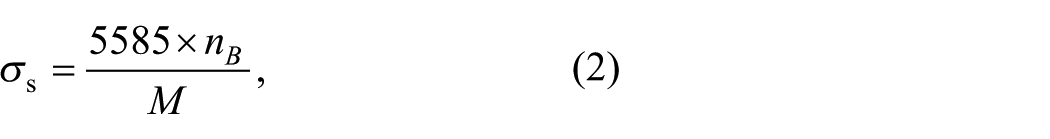
where nB is a magnetic moment with Bohr magneton as the unit, and M is the relative molecular mass. With the increase of Ca2+, the area of the loop is reduced and there is a small change in the horizontal and vertical direction, which proves that the content of Ca2+ has little effect on the magnetic properties of the sample.
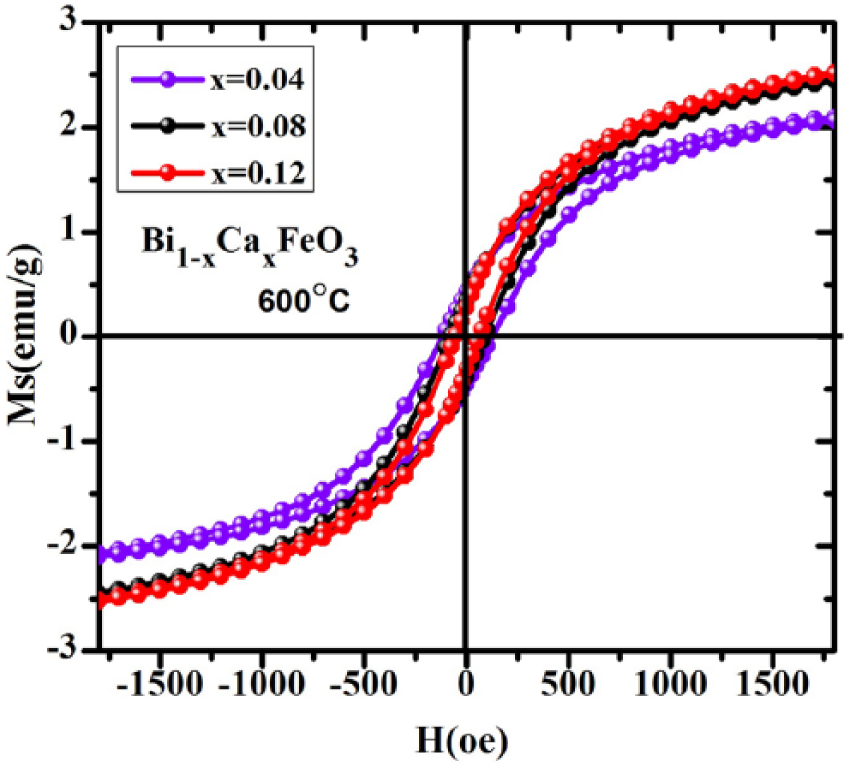
Magnetic hysteresis curves of Bi1-xCa x FeO3 calcined at 600 °C.
The calcining temperatures are the major cause of the saturated magnetization of the doped samples. 30 According to Figure 9, with increasing calcining temperature, the area of the M–H (magnetic hysteresis) curve increases. When the temperature increases from 500 °C to 600 °C, the saturation magnetization (Ms) decreases, but the area of the curve has no visible change. When the temperature is 700 °C, the area of the M–H curve increases quickly due to the second phase enhancing its magnetic properties.
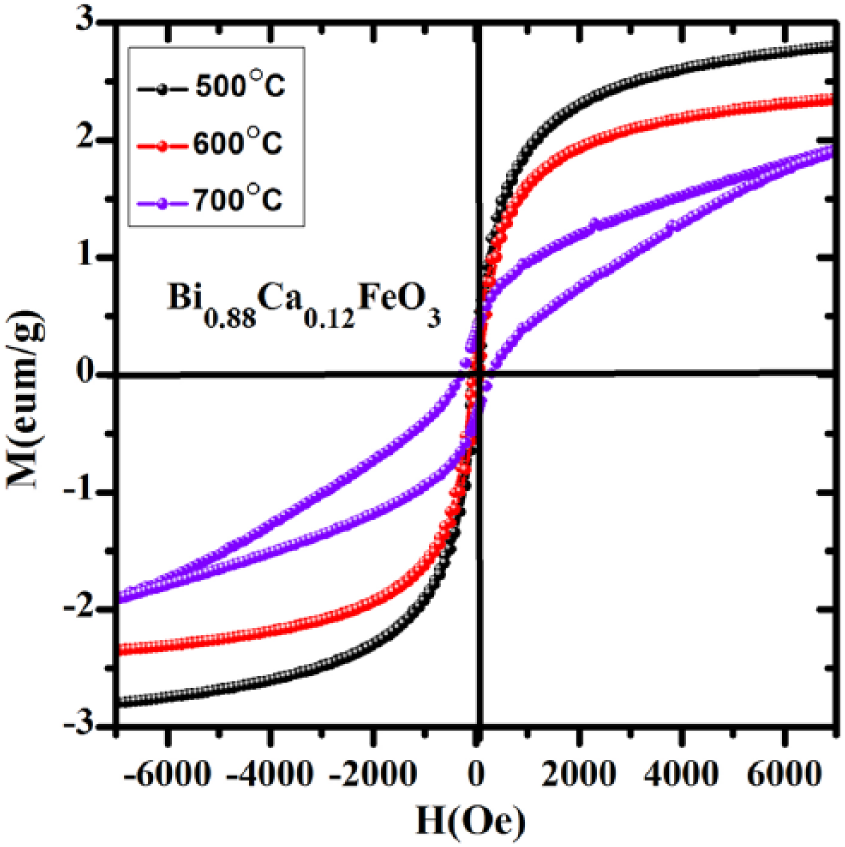
Magnetic hysteresis curves of Bi0.88Ca0.12FeO3 calcined at different temperatures.
According to the variation of the magnetic parameters shown in Figure 10, the residual magnetization (Mr) and the coercive force (Hc) decrease linearly with the increase of the x value due to the increase of Ca2+ resulting in magnetocrystalline anisotropy. 31 The effect of Ca2+ substitution at Bi3+ sites causes the valence change of Fe and/or the oxygen vacancies. 32 However, the saturation magnetizations (Ms) are increasing with the x value. Figure 11 shows the effect of the calcining temperature on the magnetic parameters. The values of Mr and Ms follow the same trend with increasing temperature, but Hc follows a different trend (i.e., increases with increasing temperature).
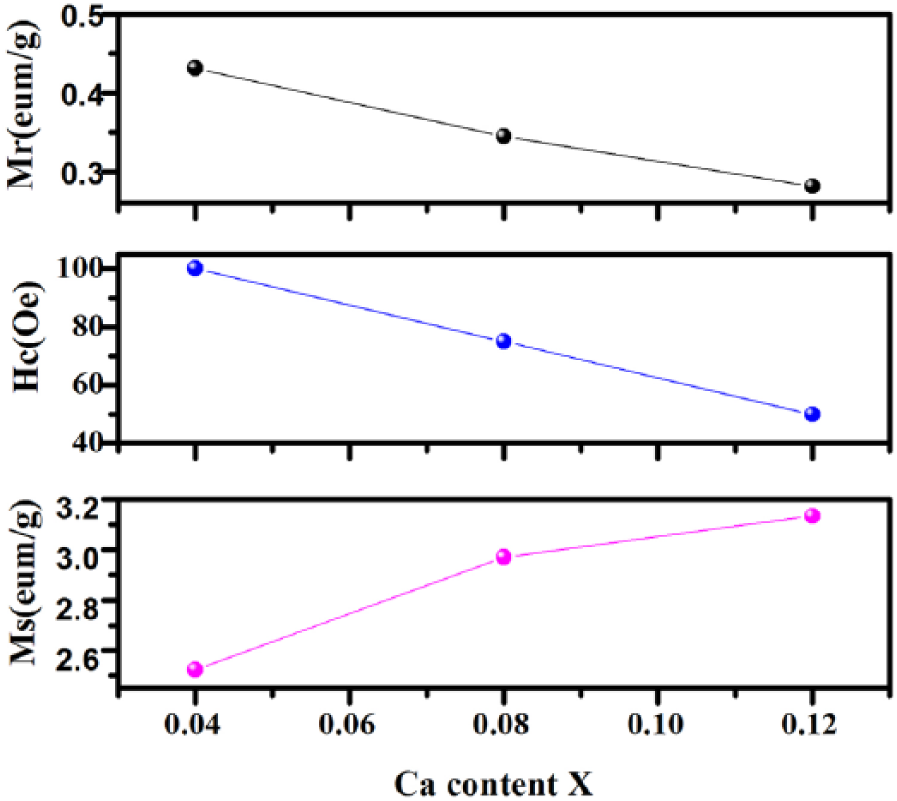
The variation of magnetic parameters with x value.
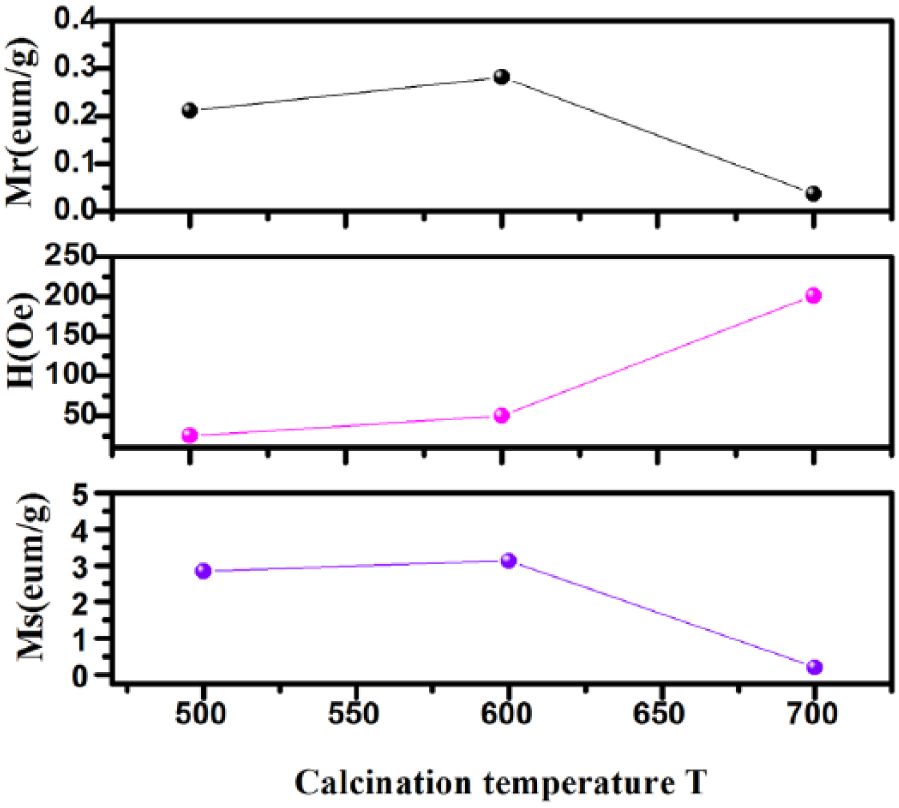
The variation of magnetic parameters with temperature.
Dielectric studies of Bi1-xCa x FeO3
It is well known that different crystals have different dielectric constants. Oxygen vacancies can change the magnetic and electrical and optical properties significantly in the perovskite material ABO3. 33 The dielectric constant is one of the main macroscopic qualities for the comprehensive reflection of the medium within the behavior of electric polarization. Its value is not only affected by temperature (T), but also by frequency (F). Many studies, such as Thakur et al. 31 and Yotburut et al., 26 have reported that the dielectric constant varies with frequency in the low-frequency range. They have studied the dielectric constant ε′, which varies with frequency within the range 102~106 HZ. The results show that the dielectric constant is smaller at higher frequencies. Figure 12 shows the variation of the magnetic loss angle (tan δε) or the electric loss angle (tan δu) with frequency. Figure 12(a) shows that with an increase of the x value, the value of electric loss first falls, then stabilizes, in the range 3 × 10⁹ Hz to 8 × 10⁹ Hz. Here, electric loss does not change with the x value. Figure 12(b) shows that the value of magnetic loss x does not change with increasing x value at frequencies higher than 7 × 10⁹ Hz.
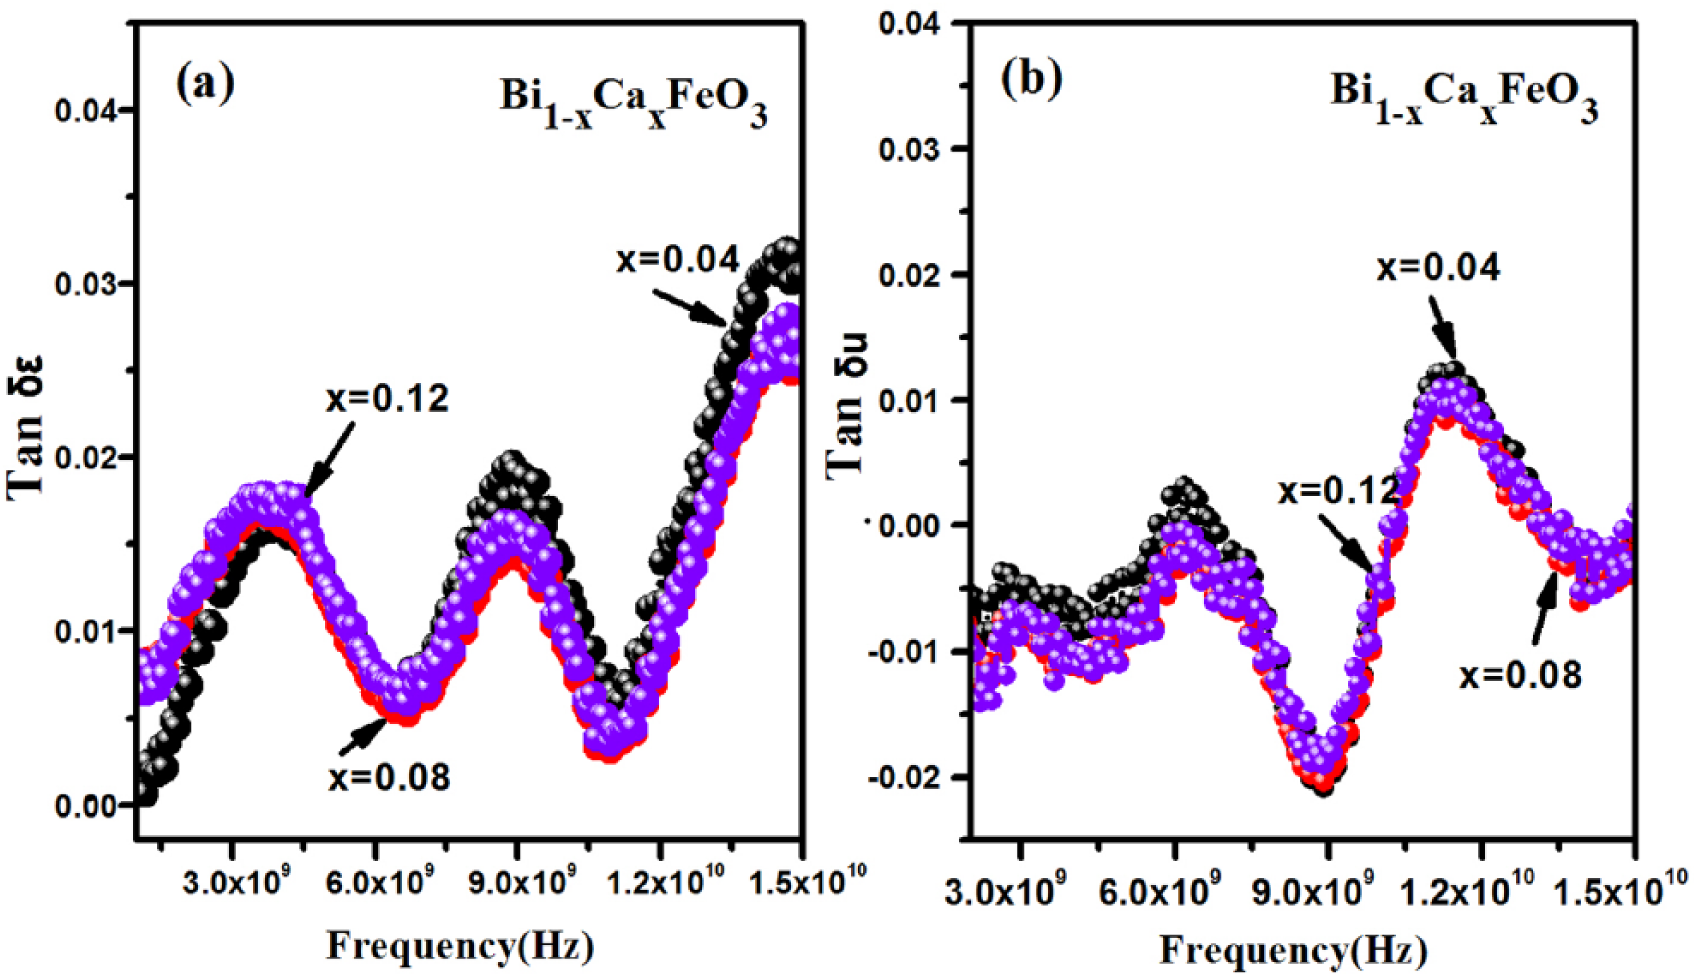
The variation of loss angle with frequency.
Conclusions
In this paper we used the sol-gel method to synthesize a batch of Bi1-xCa x FeO3 nanoparticles and study their performance as magnetoelectric materials. Due to the difference in the ionic radius of the alternative Bi3+ ions and Ca2+ ions, the average grain size decreases. Even with the same amount of Ca2+ ions, there is different purity in the samples at different temperatures. From the SEM images we can see that the size of the sample decreases due to the different radius of Bi3+ and Ca2+.The results show that the samples are small and regular at x = 0.12 and calcining temperature 600 °C. Increased amounts of Ca2+ ions have little effect on the magnetic properties of the samples, but the calcining temperature brings about the second phase, which has a significant effect on it. At high frequency, the magnetic loss values are not dependent on the x value, and the electric loss has the same value in the frequency range 3 × 10⁹ Hz to 8 ×10⁹ Hz (i.e., independent of the x value).
Footnotes
Authorship
JP Lin, ZP Guo, and KL Huang contributed equally to this work. Q Lin and Y He participated in experimental design. JP Lin and KL Huang performed the experiments. JP Lin, ZP Guo, and M Li collected the data. Q Lin and Y He are co-corresponding authors and contributed equally to this study.
Declaration of Conflicting Interests
The author(s) declared no potential conflicts of interest with respect to the research, authorship, and/or publication of this article.
Funding
The author(s) disclosed receipt of the following financial support for the research, authorship, and/or publication of this article: This work was financially supported by the National Natural Science Foundation of China (grant numbers 1364004, 11647309, 11547307, 11164002) and the Innovation Project of Guangxi Graduate Education (grant number YCSW2017097). The project was also funded by Guangxi Key Laboratory of Nuclear Physics and Nuclear Technology.