
Abstract
Background:
The nanocrystalline structure of La1-xCa x FeO3 was prepared by a sol–gel method involving an auto-combustion process. The incorporation of rare-earths in LaFeO3 induces strain in magnetic properties, especially in terms of the following parameters: replacement amount, oxygen partial pressure, and calcination temperature.
Methods:
To determine the effects of the amount of Ca2+ ion doping agent and the calcination temperature on the microstructure, particle morphology, and magnetic properties of LaFeO3 crystal, we performed the following respective analytical methods: X-ray powder diffraction, Fourier-transform infrared (FT-IR) spectroscopy, scanning electron microscopy, and vibrating sample magnetometer tests.
Results:
The orthorhombic structure of LaFeO3 perovskite did not change even when it was doped with Ca2+ ions, and its space group continued to be Pnma (No.62). FT-IR spectra confirmed that the main band appearing at 568 cm−1 is due to the antisymmetric stretching vibration of Fe–O–Fe bonds in FeO6. The introduction of Ca inhibits the growth of grains but the morphology of particles is improved. With an increasing concentration of Ca2+ ions, magnetic behavior of the samples also witnessed an increasing trend in a proportionate manner. With an increase in calcination temperature, the enclosed area of the magnetic hysteresis curve of the sample reduced remarkably.
Conclusions:
The growth of nanoparticles can be restrained with an increase of Ca content that is used as doping agent. The magnetic behavior of La1-xCa x FeO3 tilts towards G-type antiferromagnetism; the magnetic orientation is achieved from the super exchange interaction of Fe3+ ions with oxygen ions.
Introduction
Perovskite oxide is one of the new functional materials which have great potential in the future. 1 LaFeO3 is a type of metal oxide with the perovskite structure (ABO3). When single phase LaFeO3 and single- or double-doped A/B chemically interact with each other during sol– gel preparation, the resultant crystal structure usually has an orthogonal perovskite structure, with the crystal’s symmetry being the space group Pnma. In this case, the lattice parameters change significantly because different elements are used as dopants during crystal preparation: these variations in lattice parameters have a direct impact on the local environment of Fe ions.2,3 When LaFeO3 is modified with A or B site elements that acts as substituents, the general formula of the resultant chemical compounds are La1-xA x FeO3 (A = Ca, Sr, Ba, Ce or other rare earth elements), LaFe1-xB x O3 (B = Mn, Co, Cr, or other transition metals elements), respectively. Because different A- or B-site elements replace LaFeO3 material, the performance characteristics of the resultant compounds also change, especially in terms of the following parameters: replacement amount, oxygen partial pressure, and calcination temperature. Pecchi et al. conducted a study on the catalytic activity of LaFeO3 doped with Ca. 2 They used the citrate method and co-precipitation method to determine the catalytic activity of the aforementioned LaFeO3 material. Furthermore, Kong and Shen used the co-precipitation method to determine gas sensitivity of La1-xCa x FeO3. 3 In addition, Ahmed and El-Dek used the conventional solid phase reaction method to determine the magnetic properties of Ca-doped La1-xCa x FeO3 material. 4 When the Ca2+ concentration was increased steadily in the crystal, the number of Fe4+ ions increased steadily but the number of Fe3+ ions decreased simultaneously. Owing to these changes in the number of Fe3+/Fe4+ ions in the environment, the magnetic susceptibility of the Ca-doped La1-xCa x FeO3 crystal increased markedly. 1 Abdel-Khalek and Mohamed synthesized La1-xCa x FeO3 by the method of co-precipitation. 5 Then they studied its structure and magnetic properties extensively. Based on the results of magnetic measurements, they inferred that the sample has weak ferromagnetic properties and spin (antiferromagnetic) ordering. When the concentration of Ca2+ dopants (x ≤ 0.1) is increased continuously in the crystals, there is a corresponding increase in the magnetic parameters of the crystals. The magnetic behavior of crystals may become more pronounced because Fe3+ ions are oxidized to Fe4+ ions, with a steady increase in Ca2+ dopants in the crystal environment. 1 The traditional preparation of LaFeO3 is done by performing the solid state reaction method under a high-temperature environment (ca. 700°C) to ensure that the reaction reaches completion. The result of the reaction was different when the sintering temperature was higher.6,7 There are also reports describing how wet chemical methods, such as co-precipitation, and other methods were used for preparing LaFeO3; however, the sintering temperatures are too high in these methods.8,9 In different preparation methods, raw materials and the sintering temperature play an important role in the ferroelectric, ferromagnetic, morphology, structure, and other properties of the synthesized samples. 7 Presently, few studies have reported about how low-temperature synthesis of Ca2+-doped LaFeO3 nanoparticles can be performed using the citrate sol–gel method. Moreover, the structure, morphology, and magnetic properties of Ca2+-doped LaFeO3 nanoparticles have been studied to a significantly less extent in research studies. In this paper, we studied the effect of Ca2+ substitution La1-xCa x FeO3 ferrite and investigate the influence of Ca2+ substitution in magnetic properties and microstructure.
Material and methods
Sample synthesis
In this experiment, the citrate sol–gel method of synthesis was used to prepare La1-xCa x FeO3 (x = 0–0.5) perovskite nanoparticles. 1 The resultant nanoparticles were prepared using different proportions of Ca2+ as dopants in the aforementioned nanoparticles. In addition, the effect of varying calcination temperature of the reaction was quantified by determining the structure, morphology, and magnetic properties of as-synthesized samples in the reaction mixture. The starting composition of the principal sample was as follows: La(NO3)3·6H2O, Fe(NO3)3·9H2O, Ca(NO3)2·4H2O, and citric acid. During the synthesis process, citric acid was dissolved in deionized water. To obtain a solution, it was necessary to completely dissolve citric acid in water. Then, a variety of nitrates were dissolved completely in citric acid (solution A) to yield solution B. Thereafter, ammonia was slowly added to solution B to adjust its pH to 7. At this stage, the ammoniacal solution B was transformed into a sol. Then, the resultant sol was placed in a water bath pot and subjected to stirring continuously; the temperature of the water bath was maintained at 60°C. After being kept for about 3 h in the water bath, the sol transforms into a wet gel. At this stage, the stirring of the gel was stopped. The resultant wet gel was aged for about 12 h. Then, it was placed in a blast oven and dried at 130°C for 6 h to yield a xerogel; the accelerant ethanol was added to the dry gel obtained from the spread, and a yellow fluffy powder was obtained subsequently. After polishing the powder, we transferred it into a crucible. Then, the powder was calcined in a muffle furnace, after being calcined at 500°C, 700°C, 800°C for 2 h.
Sample characterization
The integrated technique of thermogravimetric analysis and differential scanning calorimetry (TGA-DSC; SDT Q600, TA Instruments, USA) was performed to analyze the dry gel through thermal decomposition process. In this experiment, X-ray diffraction (XRD; D/max-2500v/pc, Rigaku, Japan) was used to further characterize the structure of the material: the main parameters of the XRD process were as follows: pressure pipe, 40 kV; pipe flow, 20 mA; Cu-Kα target radiation; scanning speed 10°/ min; scanning range 10°–80°(2θ). Furthermore, Fourier-transform infrared (FT-IR) spectrometer analysis (Spectrum Two; Perkin Elmer, USA) was performed to observe functional groups and chemical bonds of the samples, with a spectral resolution of 1 cm−1. Then, IR spectroscopic analysis of the samples was performed in the wavelength range 400–4000 cm−1. Scanning electron microscopy(SEM) analysis (NoVaTM Nano 430; FEI, USA) was performed to observe the microstructural properties of LaFeO3 nanomaterial, including particle size, geometrical shape, uniformity, and reunion phenomenon. Vibrating sample magnetometer (VSM) analysis (VSM-100; CCYPCD, China) was performed to observe the magnetic properties. We tested hysteresis loop of samples at room temperature under the following conditions: the maximum magnetic field H = 0.8 T and the highest sensitivity was 5 × 10⁻⁵ emu. With this process, we determined the magnetic parameters of samples, including the saturation magnetization (Ms), remnant magnetization (Mr), and coercive force (Hc) values.
Results and discussion
TGA results
Figure 1 shows that the weight loss of the samples starts from 30°C in the TGA curve. In the differential thermal analysis (DTA) curve, weak endothermic peaks appeared at 47.5°C because of evaporation of water from the wet gel. Furthermore, endothermic peaks appeared at 131.5°C and 169.5°C owing to the expulsion of water that was present hitherto inside the dry gel. For example, adsorption water, water of crystallization, and water vapor generated during the reaction are some types of water molecules entrapped within the dry gel. A sharp exothermic peak appears at 226°C; this peak may correspond to that at about 219°C on the TGA curve, where it primarily represents extensive weight loss caused by the decomposition of organic matter and the combustion of residual organic substances generating CO2 and N2 gases. After attaining a temperature of 226°C, the sample does not undergo any significant weight loss. As a result, weak exothermic peaks appear at about 325°C and 420°C in the DTA curve. The temperature 420°C is crystallization temperature of LaFeO3.10–12
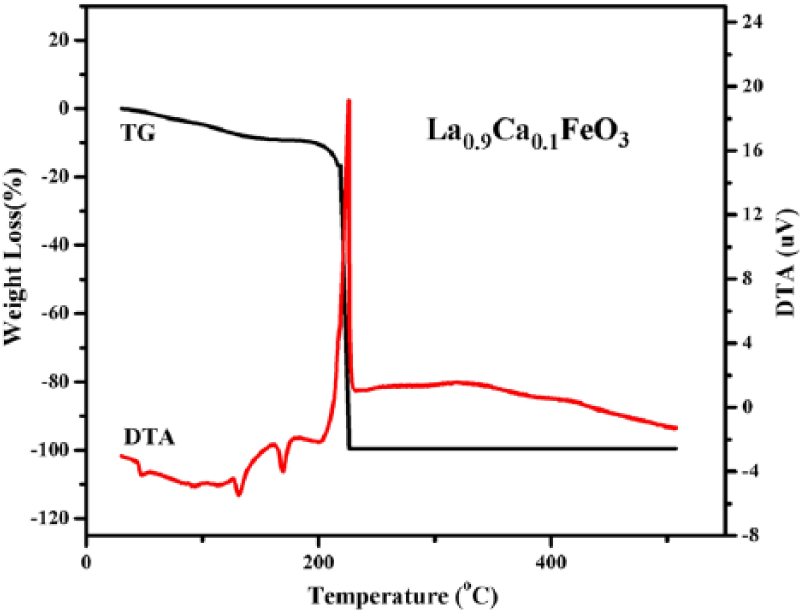
TGA and DTA curves of La0.9Ca0.1FeO3 xerogel.
XRD analysis
Figures 2 and 3 display the XRD patterns of La1-xCa x FeO3 (x = 0–0.5). In the presence of the contrast standard JCPDS 37-1493, the orthorhombic structure of LaFeO3 showed a perovskite structure, and its space group was Pnma.2,13,14 With an increase in the proportion of Ca substitution in the crystal lattice, the diffraction peaks shifted to 2θ values in a remarkably increasing direction. The shift in diffraction peaks occurred because the ionic radius (0.134 nm) of the Ca2+ ion was smaller than the ionic radius (0.136 nm) of the La3+ ion. The Ca doping consequently decreased the cell volume of La1-xCa x FeO3, although to slight extent.15–17 In addition, La3+ ion was replaced partially by the lower state Ca2+ ion so as to maintain charge neutrality of the entire compound. Subsequently, the perovskite structure either produced an Fe4+ ion, which is a B-site element having higher valence state, or an oxygen hole.4,18–20 Because the Fe4+ ion radius (0.0585 nm) is less than the Fe3+ ion radius (0.0645 nm), the cell became still smaller in size. When x = 0.2, the diffraction peaks (141) and (311) appear as a merged peak (141). This phenomenon indicates that the structure of the sample will be distorted when the level of Ca dopants reaches a certain concentration in the reaction mixture. At x = 0.5, the diffraction peak decreased. This indicates that there may be an impurity phase of CaCO3 in the temperature range 25–35°C.
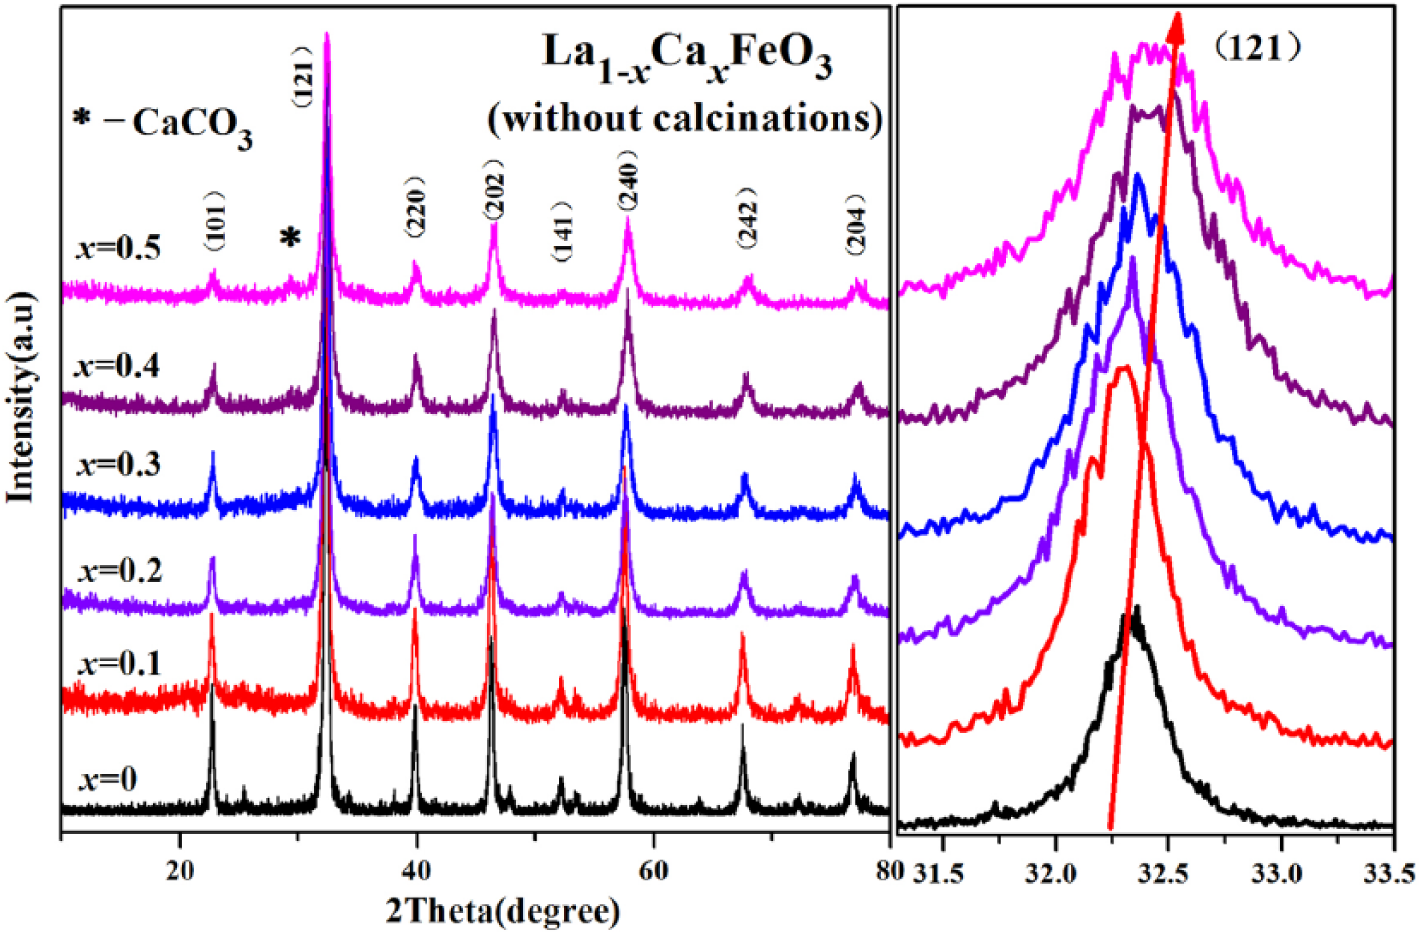
XRD diffraction pattern of La1-xCa x FeO3 (x = 0–0.5) without calcination.
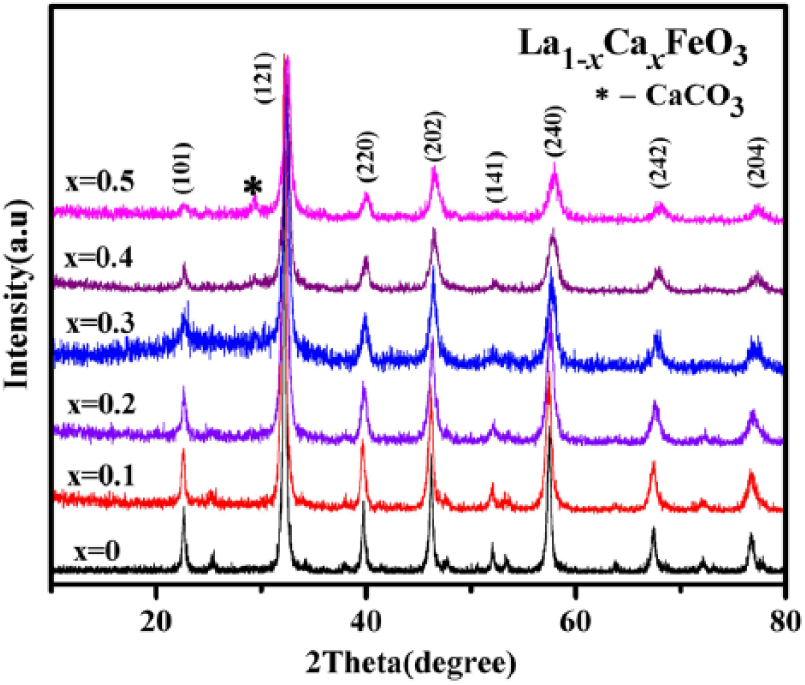
XRD diffraction pattern of La1-xCa x FeO3(x = 0–0.5) through 2 h of calcination at 500°C.
Figure 4 shows the XRD pattern of La0.6Ca0.4FeO3 samples obtained after subjecting them to calcination at different temperatures. It can be seen that all the samples have a single-phase structure, and the shape of the diffraction peak is sharp and well-defined. This indicates that even if calcination temperature is increased steadily, the crystallinity of the crystal continues to be intact. In addition, an impurity phase of CaCO3 appears in both non-calcined samples and samples calcined at 500°C for 2 h. The appearance of the impurity phase despite calcination indicates that the sample was probably not fully calcined at that temperature.
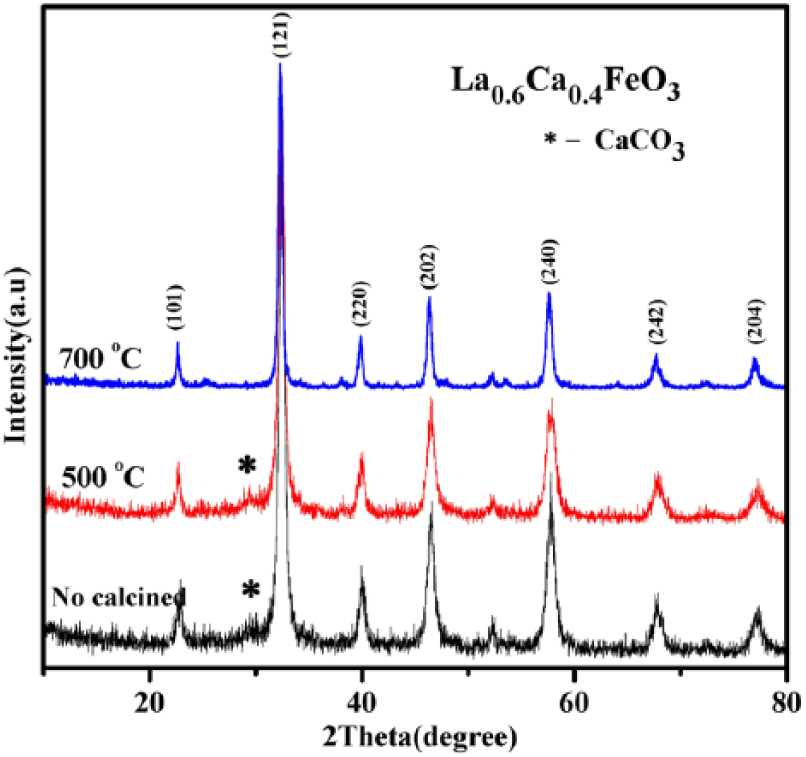
XRD diffraction pattern of La0.6Ca0.4FeO3 samples without calcination and with calcination at 500°C or 700°C after 2 h.
Figure 5 illustrates the trends in the average grain size corresponding with the variation in the amount of Ca dopants. The variation in the average grain size was calculated using Jader 5.0 software. Scherrer’s formula was used to do the estimation as follows:
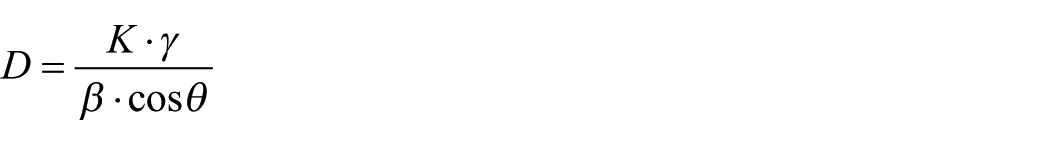
where D is the average grain size, β is full width at half maximum (FWHM), and γ is the wavelength of copper target (0.15405 nm). The Bragg’s diffraction angle is denoted by θ. Based on Figure 5, we infer the following observation: The average grain size of the sample reduces with an increase in the amount of Ca2+ dopants. This indicates that that Ca2+ ion replaces La3+ ion in the crystal lattice and inhibits the growth of particles.
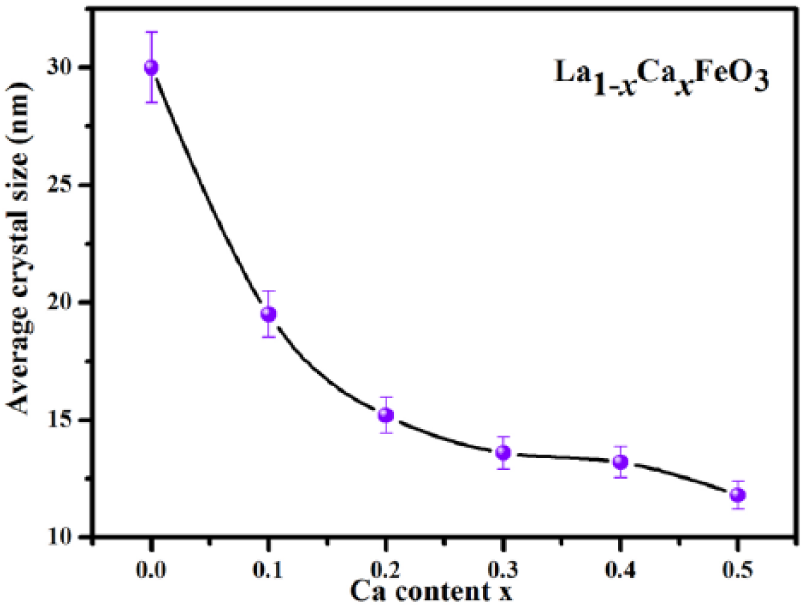
The average grain size of La1-xCa x FeO3 (x = 0–0.5) sample calcined at 500°C for 2 h.
Infrared analysis
Figure 6 shows the FT-IR spectra of a La1-xCa x FeO3 sample that was calcined at 500°C for 2 h. Using an FT-IR spectrometer with pure KBr as the background, the main band appeared at about 568 cm−1; this band represents the antisymmetric stretching vibration in the Fe–O–Fe bond of FeO6, a regular octahedron. The main band represents the vibrational stretching of Fe–O–Fe bond in the absorption spectra of samples. According to Abdel-Khalek and Mohamed and Li et al.,5,21 the aforementioned main band appeared at around 574 cm−1 and 400 cm−1, respectively, in samples of La1-xCa x FeO3. Furthermore, Thirumalairajan et al. found that a small vibration peak appears at about 1058 cm−1; 22 this peak was found to be the main vibration band of the CO32− functional group. The appearance of this peak in the absorption spectra indicates that the samples might have been exposed to air, and that La carbonate might be present on the surface of LaFeO3.
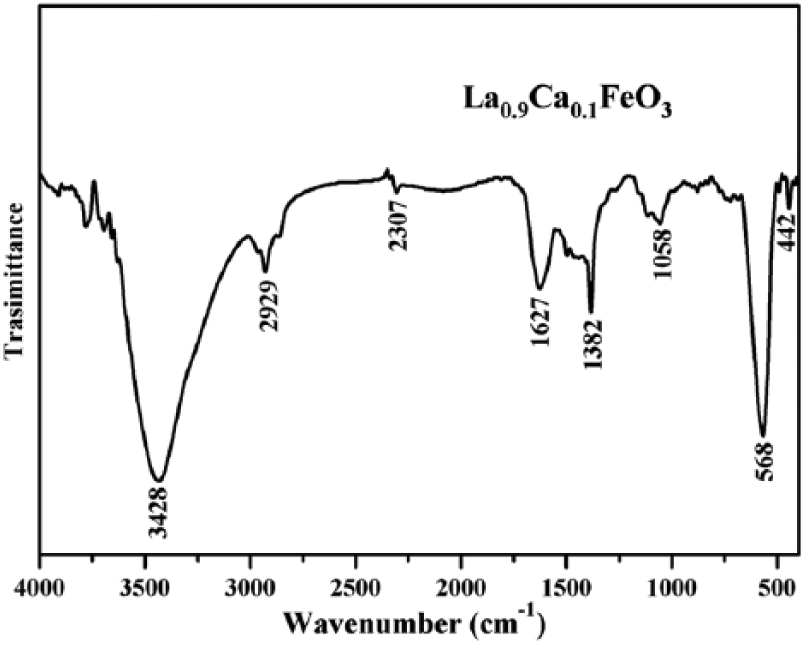
Infrared spectrum of La0.9Ca0.1FeO3 calcined at 500°C for 2 h.
However, the XRD spectra did not detect this chemical species in the sample. Furthermore, a small vibration speak appears at about 1382 cm−1, which indicates the asymmetric stretching vibration of the metal. The appearance of this band at 1382 cm−1 wavelength is in good agreement with the spectra presented in other studies. 23 At around 1627 cm−1, a vibrational band appears in the spectrum; this band is attributed to the asymmetric stretching vibration of carboxyl group. In addition, Thirumalairajan et al. reported the appearance of a vibrational band at about 1627 cm−1. 24 A very small absorption band appeared at around 2929 cm−1, which was then attributed to CO2 species in our sample compound. Moreover, Thirumalairajan et al. reported the appearance of a vibrational band at about 2924 cm−1. 22 At about 3428 cm−1, a broad peak appears due to the symmetric and asymmetric stretching vibration of water molecules absorbed from air; these latent water molecules are present in our sample compound. Furthermore, this broad band extends between 3300 cm−1 and 3600 cm−1, manifesting the correlation between the vibrational levels of various kinds of latent water molecules in the sample.21,25,26
Structures and grain sizes
Figure 7 shows that the dispersion and morphology have not changed much despite the sample being doped with Ca2+ ions. With an increase in the concentration of Ca substitution, the particle size becomes smaller because the Ca2+ ion replaces the node position of La3+ ion. Consequently, the stacking-fault energy increases in the material, thereby increasing the nucleation node and inhibiting the growth of particles. In summary, the doping impact of Ca2+ is change on the performance of the sample. 15
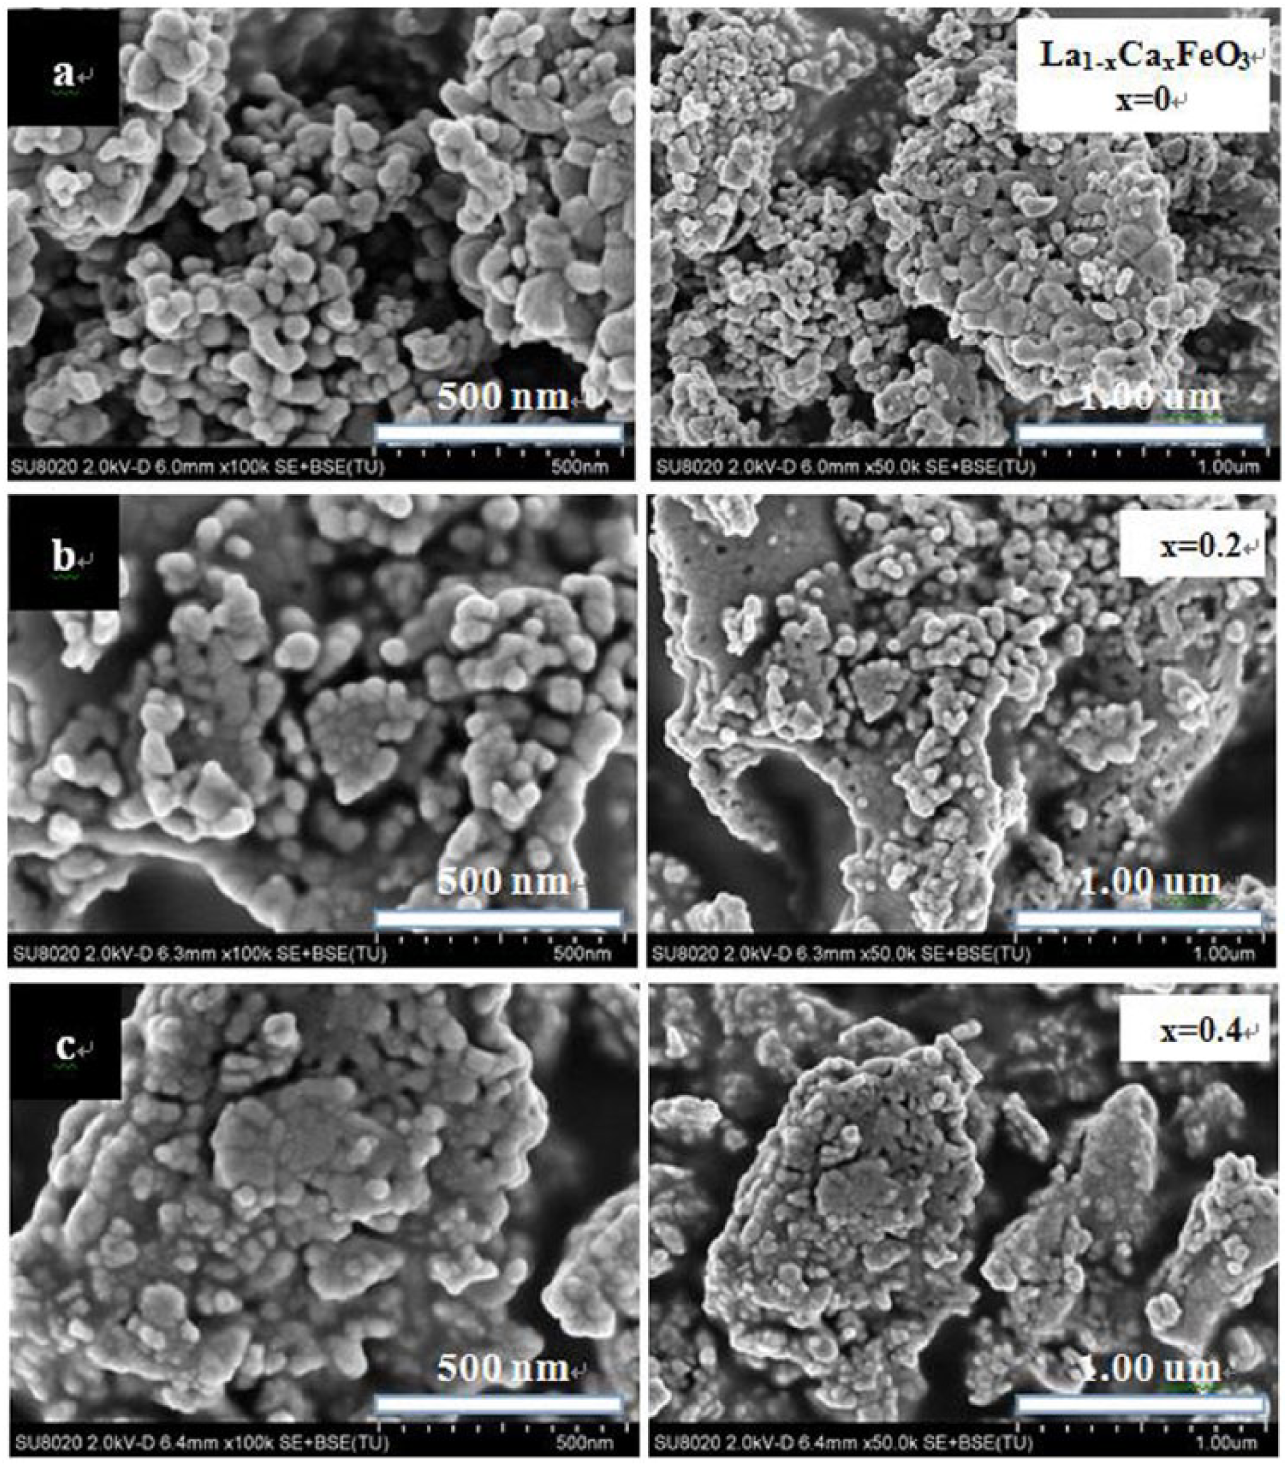
SEM images of La1-xCa x FeO3 (x = 0, 0.2, 0.4) calcined at 700°C.
The statistical data was obtained using particle size distribution analysis software (Mac-View ver.4.0; Mountech Co. Ltd, Tokyo, Japan). From Figure 8, which displays the particle size histogram of La1-xCa x FeO3 (x = 0, 0.2, 0.4), we conclude that the particle size of undoped samples was mainly in the range 28–68.8 nm. However, when the content of Ca dopant was 0.2, the particle size was in the range 25–56.2 nm. Furthermore, when the calcium dopant’s content was 0.4, the particle size was in the range 20–53 nm. These results indicate that the particle size decreases with an increase in the amount of Ca2+ dopants. The trend of the average grain size is in good agreement with previous studies, as confirmed by statistical data obtained with Jader 5.0 software and distribution analysis software.27,28
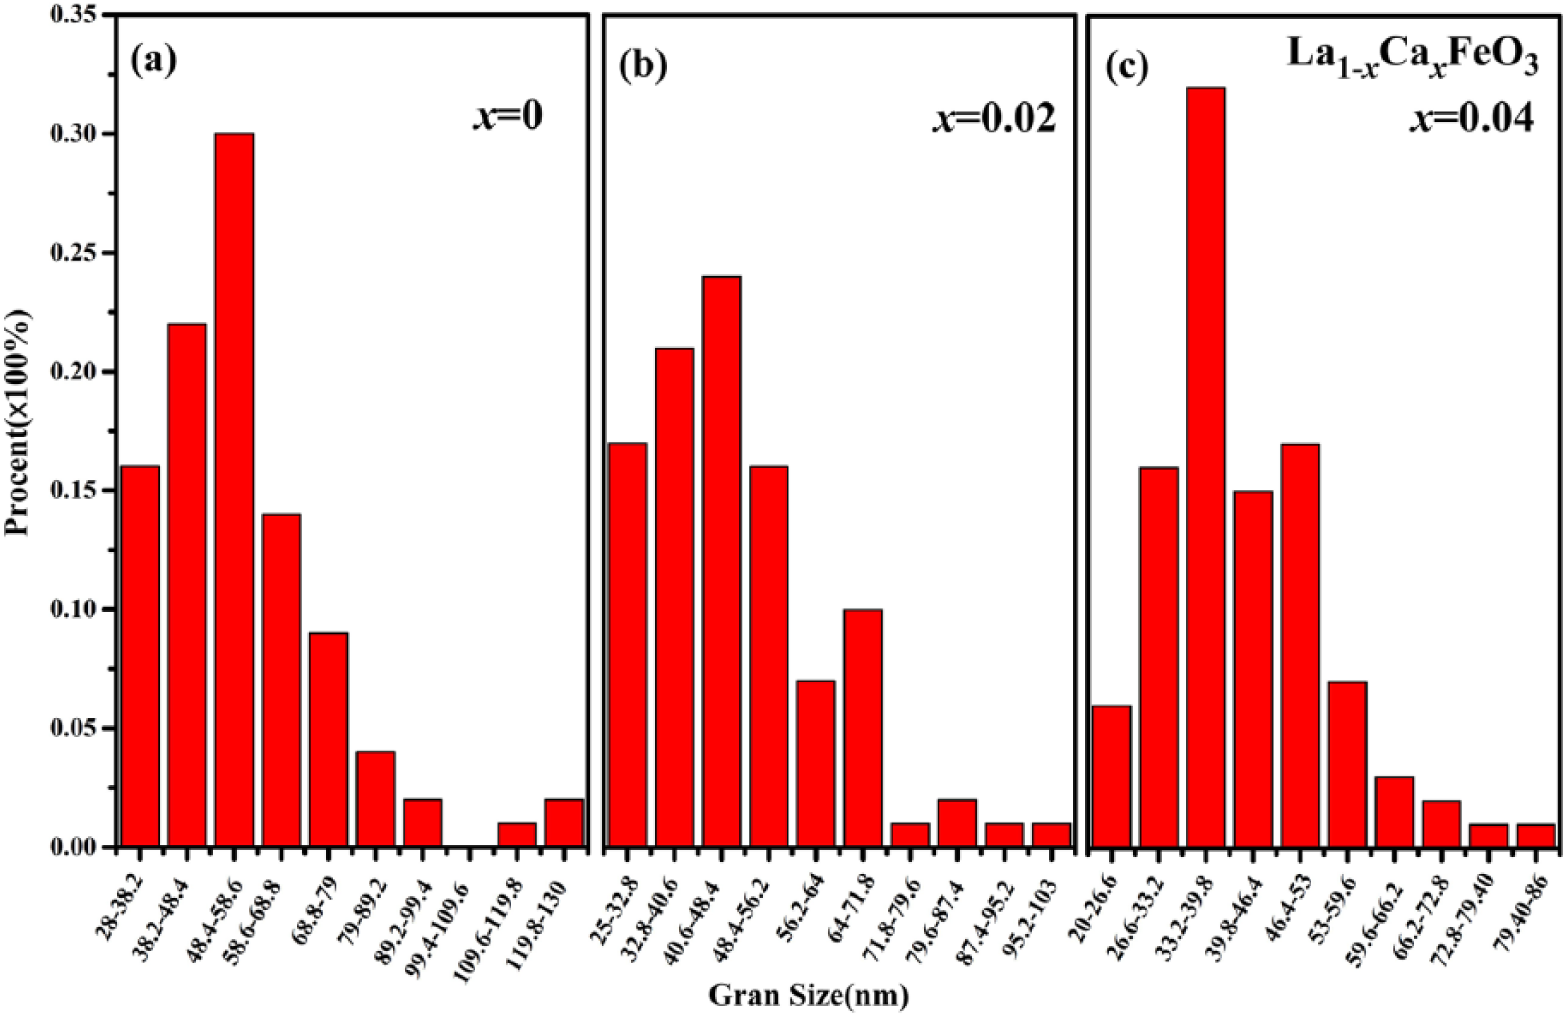
Particle size histogram of La1-xCa x FeO3 (x = 0, 0.2, 0.4) calcined at 700°C.
Magnetic property of particles
As shown in Figure 9, the hysteresis loop of La1-xCa x FeO3 (x = 0–0.5) samples is not the same as that representing a sample subjected to calcination. In this case, a La1-xCa x FeO3 sample exhibits a tilting toward G-type antiferromagnetism. The magnetic hysteresis (M–H) of La1-xCa x FeO3 compound originated from Fe3+ ion tilting toward antiparallel spin; this kind of change in magnetic orientation is achieved by super exchange interaction of Fe3+ ions with oxygen ions. 1 The shape of the hysteresis loop exhibits a weak ferromagnetic behavior, which does not reach the state of saturation. In these conditions, magnetization increases with an increase in the amount of Ca dopants, and the doped crystals exhibit important features of spin antiferromagnetic ordering. In summary, the magnetization level increases in crystals due to a gradual increase in the strength of ferromagnetic interactions and a subsequent decrease in antiferromagnetic interactions in the sample.4,16–18
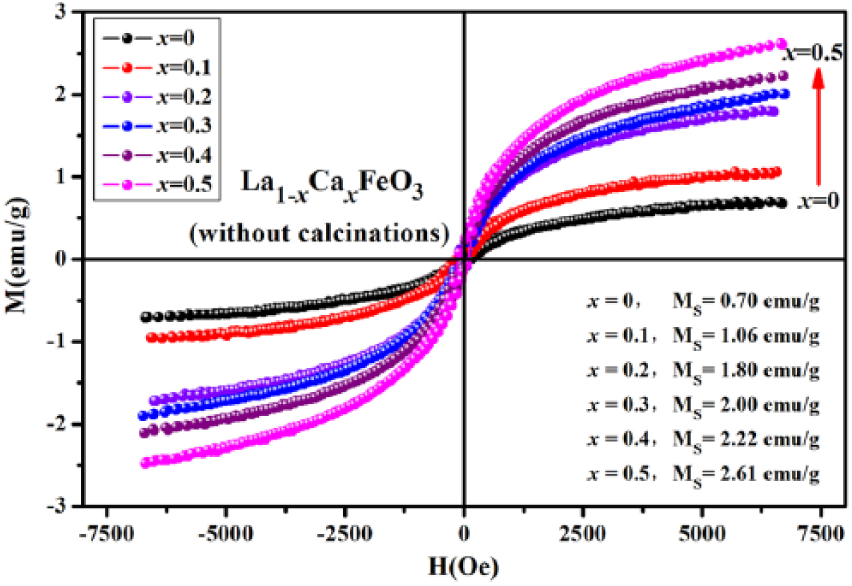
Hysteresis loop of the La1-xCa x FeO3 (x = 0–0.5) samples without calcination.
Figure 10 illustrates the hysteresis loop of La1-xCa x FeO3 (x = 0–0.5) sample compounds subjected to calcination for 2 h at a temperature of 500°C. Because Ca2+ ions replace La3+ ions in the sample compound, there will be two possible scenarios: when the Ca2+ doping amount (x) reaches a certain value, La1-xCa x FeO3 would form two or more phases; with an increase in the value of (x), Fe3+ to Fe4+ transition would progress certainly leading to two phases. 4 According to the Figure 10, magnetization had has an increasing trend with an increase in Ca2+ concentration (x) as doping agent. Thus, magnetic mutation occurs when x = 0.3. The phenomenon is attributed to the generated Fe3O4 impurities, 16 and it leads to an enhancement in the magnetic behavior of the sample.
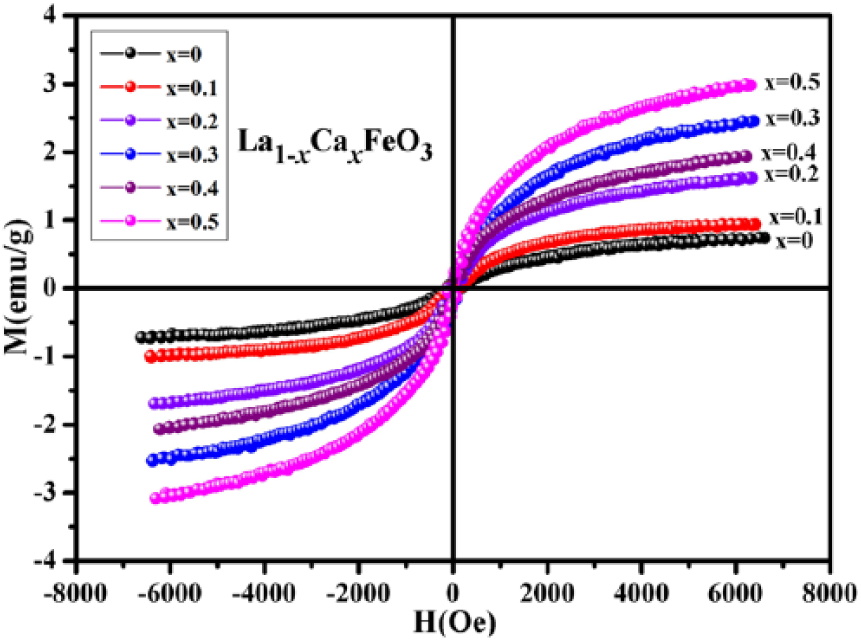
Hysteresis loop of La1-xCa x FeO3 (x = 0–0.5) calcined at 500°C.
Figure 11 shows the hysteresis loop of La0.8Ca0.2FeO3 samples subjected to calcination at different temperatures. Figure 11 clearly suggests that the enclosed area of the M–H curve of the sample area is reduced with an increase in calcination temperature. When the temperature is increased from room temperature to 500°C, the round solid symbol representing the area of the curve moves down but there is no obvious change in hysteresis loop At this stage, the magnetic area of the curve does not exhibit a significant change with changes in temperature; however, saturation magnetization (Ms) of the sample does change with changes in temperature. When the temperature is increased from 500°C to 800°C, the enclosed area of the M–H curve of the sample exhibits mutation, because the spin ferromagnetic ordering weakens gradually and the sample now tilts towards antiferromagnetic ordering. This change in magnetic ordering of the sample has been attributed to the steady increase in sintering temperature. With an increase in the sintering temperature from 500 to 800°C, the iron oxide content decreases in the sample compound. As a result, the magnetic properties of the sample also change dramatically. 19 In addition, the M–H curve appears horizontal and it seems to have moved from its previous inclination toward vertical direction. This change in direction has been attributed to the ferromagnetic and antiferromagnetic coupling in the sample.
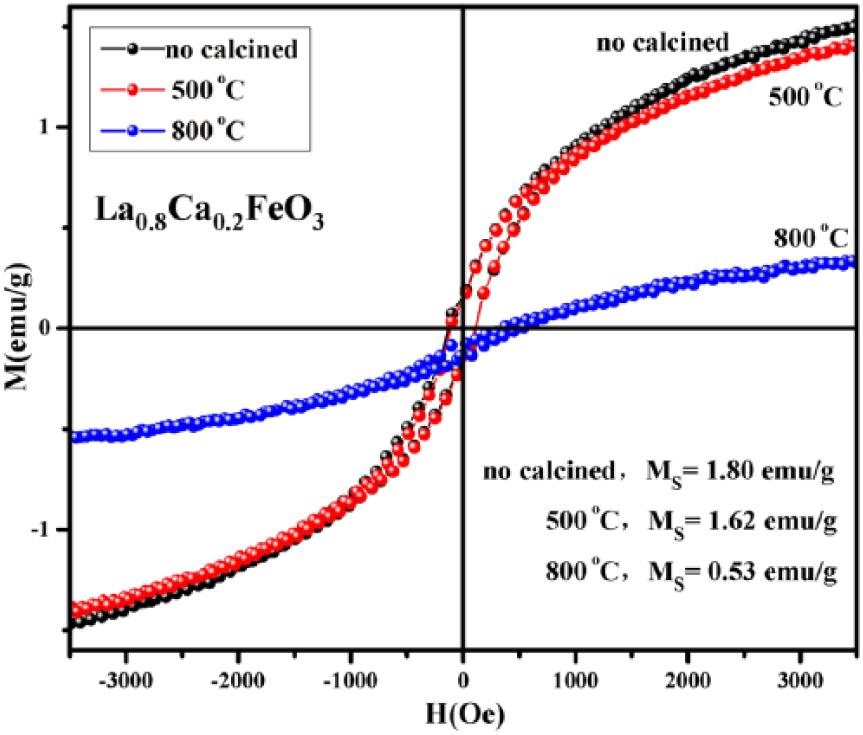
Hysteresis loop of La0.8Ca0.2FeO3 without calcinations and calcined conditions of 500°C or 800°C for 2 h.
Figure 12 illustrates the variation trend of magnetic parameters with different values of Ca2+ doping content (x). The residual magnetization (Mr) and saturation magnetization (Ms) show a tendency to increase with an increase in x values. The coercive force (Hc) exhibits an exactly opposite change trend: with an increase in the x value, there is attenuation in the value of Hc in the sample. Figure 12 also reflects the influence of calcination temperature on the magnetic parameters of the sample; the calcination temperature (T) has the same effect on variation trends of Mr, Hc, and Ms: the values of the aforementioned magnetic parameters decrease as T increases. The coercive force (Hc) of the sample is related to magnetic anisotropy,13,27,29 indicating that the introduction of Ca2+ and high-temperature calcination probably weakens the magnetic anisotropy of the sample, and evidence for this is indicated in experiments using energy-dispersive X-ray spectroscopy or X-ray photoelectron spectroscopy.24,30,31 As a result, there is a decrease in coercive force (Hc).32,33
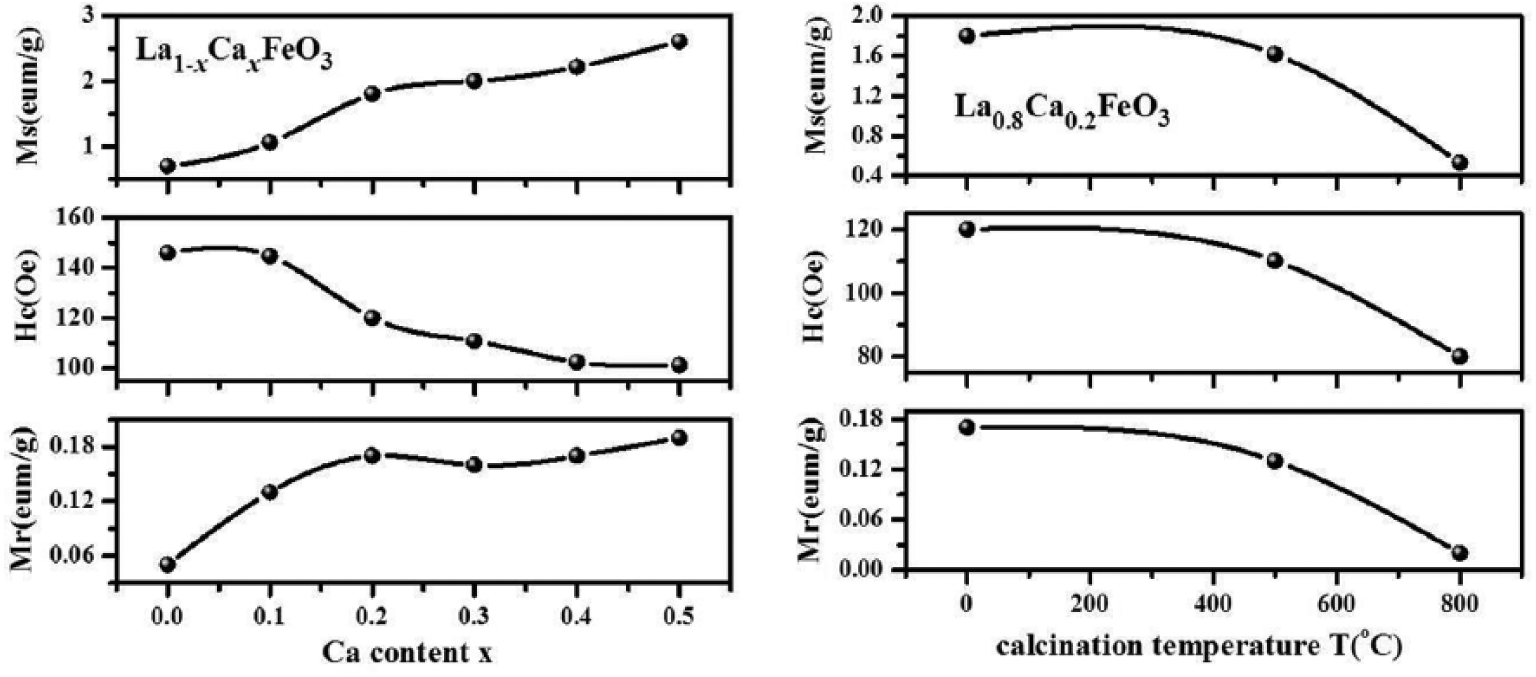
The diagram depicting the variation trend of magnetic parameters with different values of Ca2+ doping content (x) and calcination temperatures.
Conclusion
In this study, we developed an innovative citrate sol–gel method that was easy to implement with precision control. 29 With this novel method, we carried out the synthesis of La1-xCa x FeO3 nanoparticles at a low temperature. Furthermore, the structure, morphology, and magnetic properties of the as-synthesized nanoparticles were also studied in this experiment. The XRD spectra illustrated that La1-xCa x FeO3 nanoparticles have an orthorhombic perovskite structure. With an increase in the proportion of Ca substituents as dopants in the sample, the diffraction peaks of La1-xCa x FeO3 crystals moved remarkably in an increasing direction, leading to a sharp change in Bragg’s angle of diffraction (2θ). SEM showed that the growth of nanoparticles can be restrained with an increase of Ca content that is used as doping agent. This is because the particle size decreases with an increase in the content of Ca2+ ions as dopants. Furthermore, La1-xCa x FeO3 exhibits weak ferromagnetism. With an increasing concentration of Ca2+ ions, the magnetic behavior of the samples also witnessed an increasing trend in a proportionate manner. With an increase in calcination temperature, the enclosed area of the M–H curve of the sample reduced remarkably.
Footnotes
Declaration of conflicting interests
The author(s) declared no potential conflicts of interest with respect to the research, authorship, and/or publication of this article.
Funding
The author(s) disclosed receipt of the following financial support for the research, authorship, and/or publication of this article: This work was supported by the National Natural Science Foundation of China (grant numbers 11364004 and 11164002) and by Guangxi Key Laboratory of Nuclear Physics and Nuclear Technology.