
Abstract
Introduction:
Steel-concrete composite structures are playing an increasingly important role in economic construction because of a series of advantages of great stiffness, good seismic performance, steel material saving, cost efficiency, convenient construction, etc. However, in service process, due to the long-term effects of environmental impacts and dynamic loading, interfaces of a composite structure might generate debonding cracks, relative slips or separations, and so on, lowering the composite effect of the composite structure.
Methods:
In this paper, the piezoceramics (PZT) are used as transducers to perform experiments on interface debonding slips and separations of composite beams, respectively, aimed at proposing an interface damage identification model and a relevant damage detection innovation method based on PZT wave technology.
Results:
One part of various PZT patches was embedded in concrete as “smart aggregates,” and another part of the PZT patches was pasted on the surface of the steel beam flange, forming a sensor array.
Conclusions:
A push-out test for four specimens was carried out and experimental results showed that, under the action of the external loading, the received signal amplitudes will increasingly decrease with increase of debonding slips along the interface. The proposed signal energy-based interface damage detection algorithm is highly efficient in surface state evaluations of composite beams.
Keywords
Introduction
Steel and concrete composite structure (SCCS) which is composed of two different materials is an excellent structural system that has been widely applied in engineering. During an SCCS construction, concrete is cast into a form, generating several surfaces between concrete and steel which are connected by bonding strength and/or connectors such as studs. When the composite interface fails, due to a lower concrete adhesive (or stud) strength or a particularly severe loading, debonding cracks will be formed along the interface, resulting in relative slips or separations which will severely weaken the combination effect of the SCCSs or even lead to a structural collapse and bring huge economic losses and social impact. Therefore, in order to ensure the SCCS’s reliability, the identification of a kind of real-time and online method for the SCCS interface damage monitoring (or identification) is required, and the proposed method should be easily operated and have a good sensitivity to the interfacial damages such as debonding cracks and separations.
In recent years, the SCCS interfacial damage identification and monitoring technology has been paid great attention by scholars all over the world because SCCS technology has been widely applied and some accidents do occur as a result of interfacial issues. To clearly understand and solve the problem, the SCCS interfacial damages should be researched and corresponding damage identification methods should be proposed. To date, several relevant methods for SCCS damage identification or monitoring have been reported, such as infrared thermal imaging technology, ultrasonic detection technology, electromagnetic pulse detection technology, laser detection technology, piezoceramic impedance-based technology, and so on,[1, 2] but not all of them can meet the requirements of the interfacial damage identification of the SCCSs.
The infrared thermal imaging method is one kind of nondestructive flaw detection technology: once the target being measured has a relative change in thermodynamic characteristics in the surrounding environment, infrared thermal imaging technology can be used to detect the change.[3, 4] However, due to a very fast infrared attenuation in the concrete, there are limitations for its application in the detection range. For a complex interface, the result of infrared detection technology is often inaccurate. Additionally, the infrared thermal image method needs an external infrared transponder, there is a high cost of labor and equipment, and it is unable to realize a real-time monitoring or damage identification of a SCCS’s interface.
Ultrasonic testing technology is successful in structural interface monitoring, which is basically the launching of ultrasonic waves in one side of the structure and receiving the echo after running into obstacles from the other side. By comparing differences between the sound wave and its echo in time domain, the damage level and the location can be identified, thereby realizing the goal.[5–8] But for the issue of SCCS interfacial damage identification, the existing ultrasonic testing technology still has some deficiencies. The internal concrete may inevitably possess uneven or empty parts, say, so using ultrasonic testing technology may not be able to get the desired signal. Since the current ultrasonic technology is used from the outside concrete surface, it is usually unhelpful for a large volume concrete structure for the fast attenuation of the detection signals, especially for high frequency ultrasonic waves.
Electromagnetic pulse radar detection technology has been used to detect cracks in road base structures.[9] But electromagnetic wave frequencies are too high to travel far distances in concrete due to the quick energy attenuation. Moreover, the expensive electromagnetic emission instrument seriously restricts its wide use in SCCS interfacial damage detection.
The laser shear imaging method (LSM) can also be applied in imaging the concrete inside interface damage. This method can detect tiny invisible cracks of concrete surface by the imaging method.[10–12] However, it can only identify the concrete surface damage, and cannot be used for SCCS interfacial damage because the laser is difficult to accurately locate the required place.
Piezoceramic impedance-based monitoring technology has been popular in recent years, but this technology is successful in only local damage detection.[13, 14] For the SCCS interfacial damage, the piezoceramic impedance damage detection method cannot efficiently play a role.[15, 16, 17]
On the basis of the characteristics of piezoceramics, Song et al. developed a “smart aggregate (SA)” sensor and embedded it in concrete structures for structural health monitoring (SHM).[18] By using SA-based active sensing technology and the energy analysis method, Xu detected the interface adhesion firmness between steel and concrete.[19–21] Based on a piezoceramic impedance-based method, Tawie monitored the boundary of a reinforced concrete internal contact with a steel bar and reinforced concrete firmness and got an ideal result.[22] But in common SCCS beams, concrete and steel are generally connected through the stud connectors. Due to the shear effect along the interface, the relevant slip and separation along the interface might be generated. Because of the compression and pull effects of the steel studs on concrete, this can easily lead to concrete vertical split cracks and so bring uncertainty to the certain interface damage; therefore, the SCCS beam interfacial damage detection is a very complex issue.
This paper aims at proposing a piezoceramic wave-based method to identify the SCCS beam interfacial damage such as slips and/or separations along/from the interface. Therefore, a group of “smart aggregates” were made by encapsulating piezoceramic chips into a small volume of fine concrete and embedding them in concrete as transducers, and the other group of piezoceramic chips was pasted onto the surface of the SCCS beam flange as transducers. Based on the piezoelectric wave method, the detection signal energy was compared between the healthy state and the damaged state to understand the state identification of the SCCS beam interface.[23–27] The proposed method can establish a foundation for the relevant interfacial damage identification in the future.
Composite structures and interface damage monitoring
Composite structures and interface properties
From the 1990s, designers began to use composite structures such as steel reinforced concrete composite structures and steel-concrete composite structures.[28] These materials exhibit very good mechanical performances to make up for their respective shortcomings and form the optimum combination. They also have the high load bearing capacity, stiffness, and excellent seismic performance, and many other advantages.[29, 30] But in an actual construction, due to the influence of surface roughness and the compactness of concrete plate, the interfacial contact still has nonlinear characteristics and weak areas. When the interface is affected by the external load, concrete shrinkage, and environmental factors, the interface may produce cohesive cracks and the composition effect will be reduced; when the bond cracks are serious, even destruction of the structure might be caused. The interfacial damage forms of the SCCS beams are typically divided into two categories, shear sliding failure and vertical separation, respectively.
At present, damage identification or monitoring methods for the complex SCCS interface in practical engineering are not completely established because of the limitation of the work environment of large composite structures and also the difficulties in practical application use of traditional monitoring instruments. Therefore, it is necessary to establish a practical composite structure interface damage theory and the method of real-time monitoring and damage assessment.
Piezoelectric effects and piezoelectric wave method
Piezoelectric effects include the positive piezoelectric effect and the inverse effect.[26] The piezoelectric effects are actually a process of mutual transformation between electric energy and mechanical energy. When the piezoelectric element generates a mechanical deformation, positive and negative center components will generate relative movements between the electric field polarizations. The phenomenon that two electrode surfaces of the piezoelectric element produce the opposite charge is called the positive piezoelectric effect, which is the process of converting mechanical energy into electrical energy, shown in Figure 1.
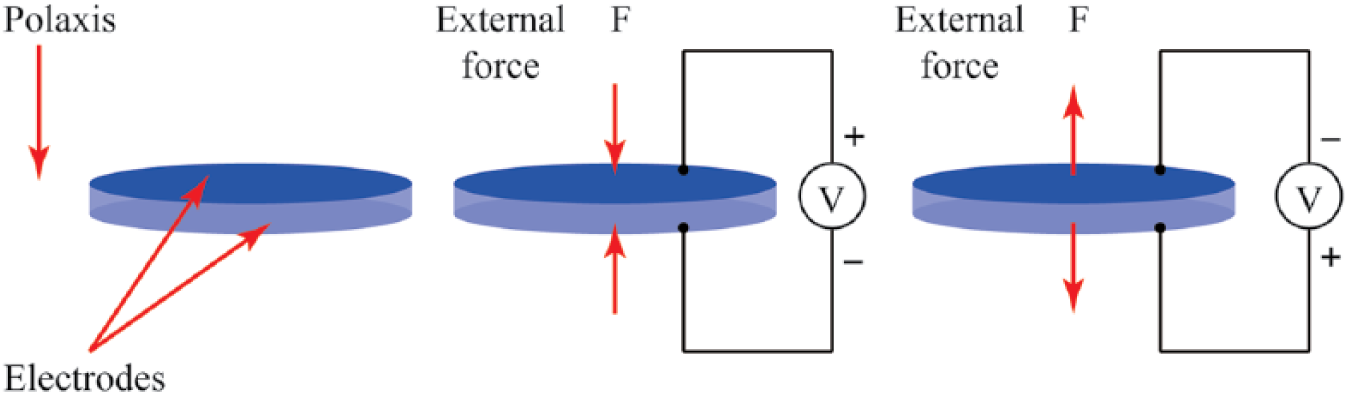
Direct piezoelectric effect.
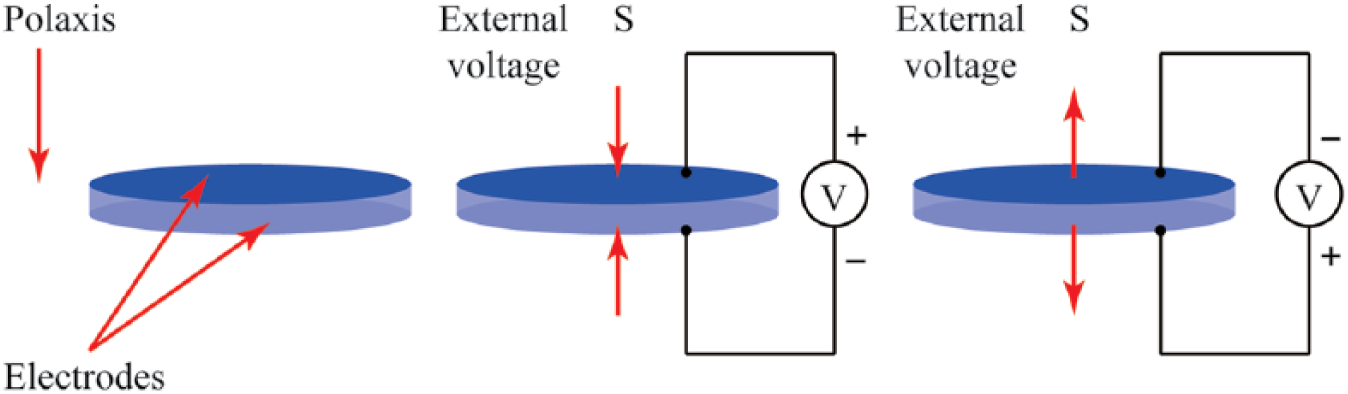
In contrast to the piezoelectric effect, when a voltage is applied on the surfaces of the two electrodes of the piezoelectric element in the same way, the center of positive and negative charge moves relatively, and the piezoelectric element is deformed. The effect in the electric field is called the inverse piezoelectric effect, which is the process of converting electrical energy into mechanical energy, shown in Figure 2. In this paper, lead zirconate titanate (PZT) is used to manufacture the transducers. A group of PZT transducers are selected as drivers and the others are applied as sensors.
Inverse piezoelectric effect.
Recently, PZT material has been widely researched and applied in the field of civil engineering because of the advantages of the fast response, wide frequency response range, small volume, easy fabrication, low price, and so on. According to the piezoelectric effects and the wide frequency response range, the material can be used to manufacture transducers to be applied in SHMs and damage identification (DI). The mechanical and electrical behaviors of PZT-based transducers can be theoretically described by piezoelectric equations according to different boundary conditions.
The boundary condition of piezoelectric vibrator can be divided into a mechanical boundary condition and an electrical boundary condition. According to the classification of the mechanical boundary and the electrical boundary conditions, four kinds of piezoelectric vibrators for different boundary conditions can be obtained after the combination. It can be seen, in this paper, that the constitutive equation of the piezoelectric vibrator is the first type (D type) because it meets the requirement of the free mechanical boundary condition and short circuit electrical boundary condition, which means the independent variables are the stress T and the electric field strength E, and the dependent variables are strain S and the electric potential D. The relationships are described by equations (1) and (2)[26]


where sE is the short circuit elastic compliance constant matrix, εT is the free dielectric constant matrix, d is the piezoelectric strain constant matrix, and dt is the transpose of d matrix.
Because of the nature of the SCCS beam interface and the SHM requirement, the PZT-based active wave method is used in this paper for the interfacial DI. The schematic of PZT wave-based interface DI of SCCS beams is shown in Figure 3. A group of smart aggregates (SAs) are pre-embedded in the concrete flange of the composite beam, and the other group of PZT patches is pasted onto the surface of the steel flange. A function generator is used to generate an expected digital signal and a signal amplifier is applied to amplify the signal to the desired value to activate the PZT patch pasted on the surface of the steel beam. The signal is propagating through the interface and received by the opposite SA used as the sensor. Then, the received signal is stored by a digital oscilloscope controlled by a computer. Finally, the received signals are analyzed and used in interfacial DI by a proposed algorithm.
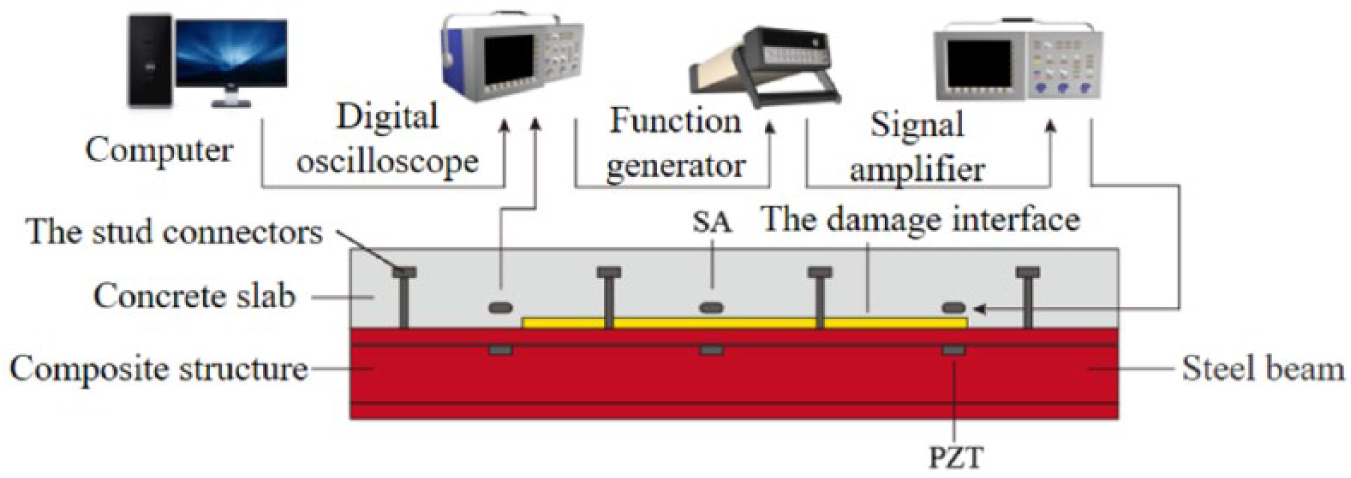
The schematic of PZT-based interface damage identification (DI) of SCCS beam.
Composite structure interface damage detection experiment
Experiment goals and contents
The experiment aims to identify the interfacial damages in a SCCS beam. Therefore, two types of structure damage specimens were built in the experiment in the laboratory to simulate the interface slip and separation, respectively. Two standard push-out test specimens were designed to research the relative slip damage along the interface of an SCCS beam. The interface slip behaviors in SCCS beams are typically researched by the standard push-out test that is recommended by the Association for Steel-Concrete Composite Structures (ASCCS), focusing on establishing the relationship between interfacial loads (shear forces) and relative slips; meanwhile, two separation specimens were built to simulate the separation damage along the interface, concentrating in setting up the relationship between stud pulling-out forces and interface separation displacements. The four specimen parameters are shown in Table 1. The research contents concluded the specimen design, experimental setup, signal selection, push-out test, data acquisition, data processing, and the establishment of an interfacial DI algorithm, etc. Therefore, the PZT transducers were installed in the given locations and different cross-sections were adopted to monitor the changes of the interface state.
The parameters for interface slip and separation specimens.
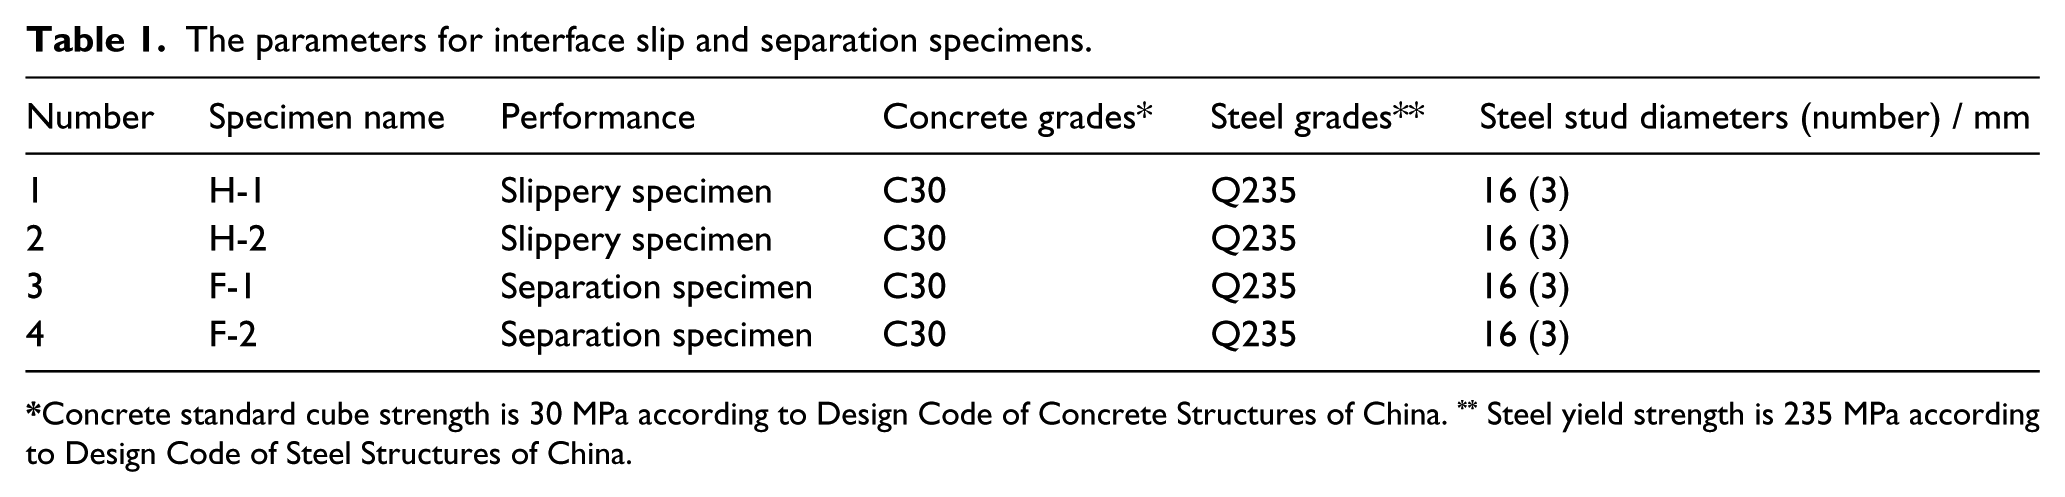
Concrete standard cube strength is 30 MPa according to Design Code of Concrete Structures of China. ** Steel yield strength is 235 MPa according to Design Code of Steel Structures of China.
Experiment setup
The first step is selecting the appropriate type and size of piezoceramic chips for the experiment. Two kinds of PZT chips of circular plate and rectangular thin plate with a single or double electrode were used. The single surface electrode PZT chips were used to manufacture the surface pasted transducers, and the double surface electrode PZT chips were applied to produce SAs. Two kinds of compression and shear PZT chips were selected. The round shape PZT chips with the size of Φ10 mm (diameter) ×1 mm (thickness) were used to produce SAs, and the rectangular shape PZT chips with the size of 12 mm (length) × 6 mm (width) × 1 mm (thickness) were applied to manufacture the pasted transducers. The selected PZT chips are shown in Figure 4.
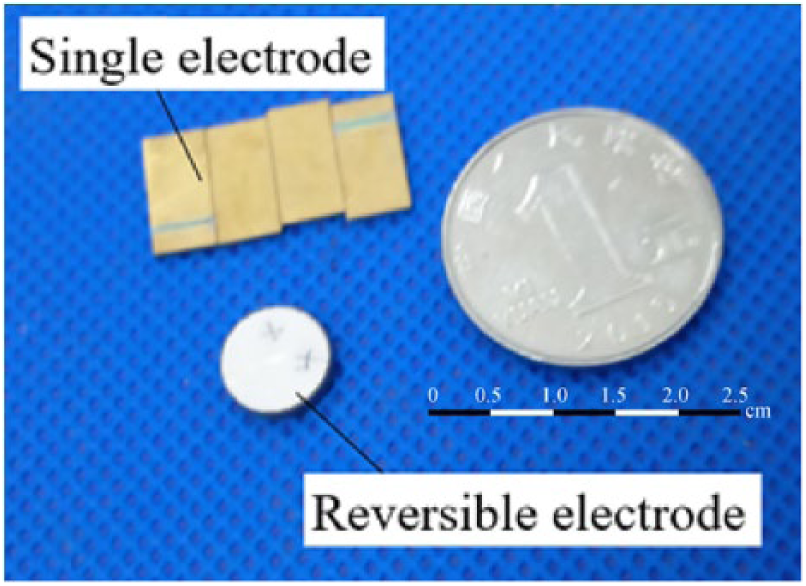
The selection of PZT chips in the experiment.
The second step is producing SAs used as transducers. Since PZT material usually has brittle performance, as used in SHM or DI fields, the PZT chips should be encapsulated in a small volume of find concrete, shown in Figures 5 and 6, respectively. A PZT chip was welded to connect with a shielded conductor wire, and cast into a steel cylinder form which was permanently used as a part of the SA. After concrete curing for 28 days, a PZT-based SA product was manufactured for use.
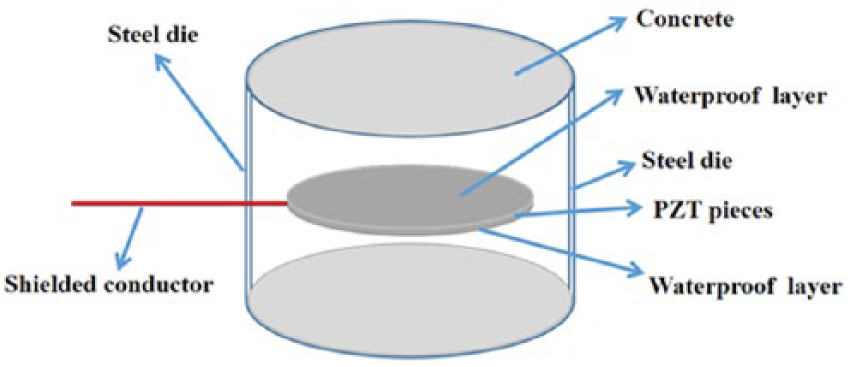
A smart aggregate (SA) composition in detail.
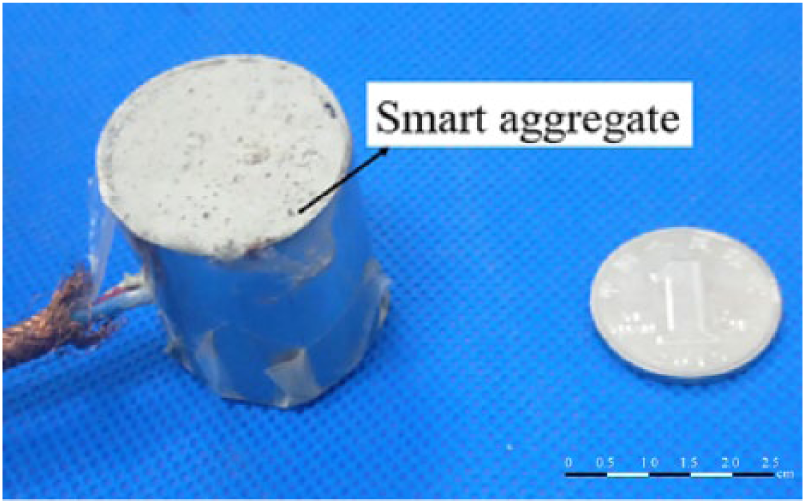
A smart aggregate product.
The experimental setup for the SCCS beam interfacial damage detection system used in this paper is mainly divided into a piezoelectric power supply, a function generator, and a digital oscilloscope, shown in Figure 7. The main experimental setup for the interfacial damage detection system included as follows. The RIGOL DG10×2 dual channel function arbitrary waveform generator enabled output of five types of basic waveforms and arbitrary waveforms with the frequency range from 1 μHz to 5 MHz, which fully meets the requirement of the damage detection. A PZT signal amplifier is applied as requiring amplifying the detection signal voltage amplitudes. A RIGOL DS1000B digital oscilloscope with the measurement accuracy of 10-3 volts is used as the signal acquisition device in this experiment. It fulfils the functions of triggering, collecting, storing, and calculating the signal, as well as carrying out real-time sampling in the range of 1 GSa/s and equivalent sampling in the range of 25 GSa/s.
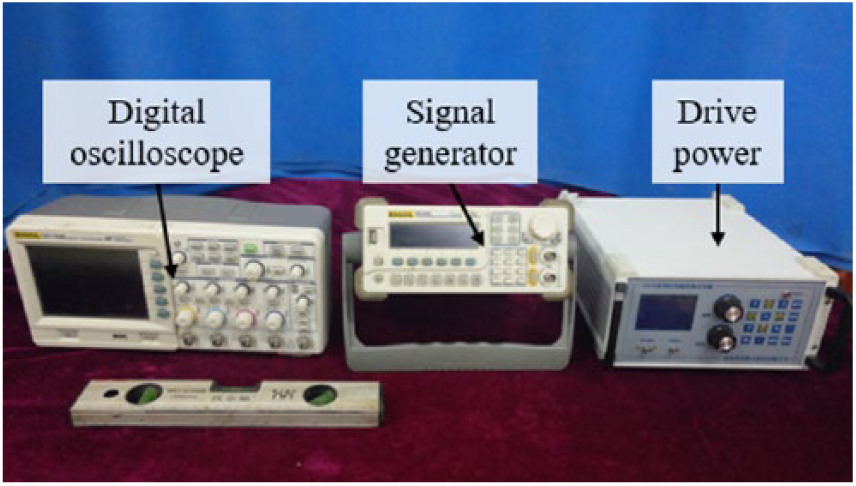
Signal excitation and collection setup.
The experiment is designed to identify the interfacial damage of the SCCS beam, so the interface state identification under different loading conditions is also the key point. Therefore, the specimen is loaded by a monotonic increasing loading plan. The main data acquisition devices are shown in Figure 8. The vertical load was applied by a hydraulic jack with the measurement accuracy of 1 N, and the displacements (slips and separation movements) were measured by UCAM-70-A displacement device with the measurement accuracy of 10-3 mm.
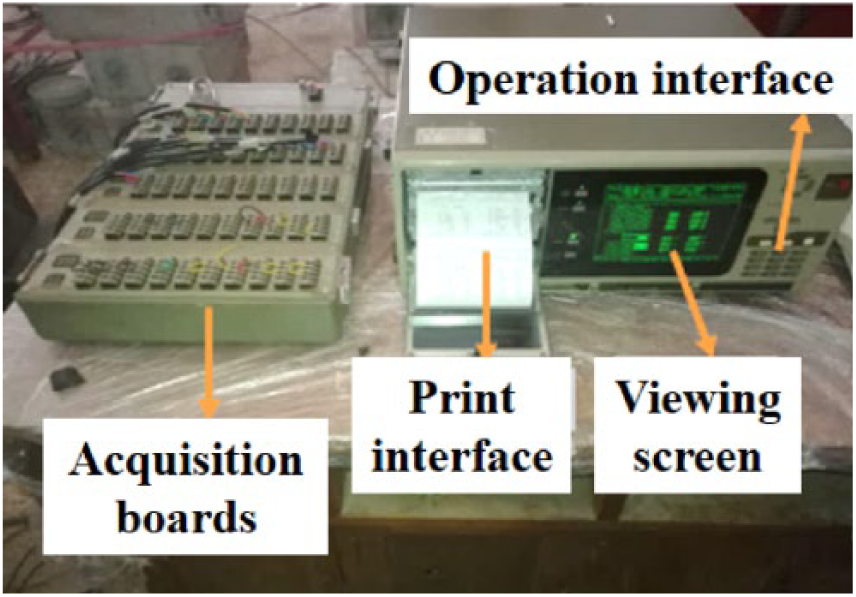
The setup of displacement acquisition.
In the composite beam slip monitoring experiment, the push-out specimen installed with PZT transducers was as shown in detail in Figure 9. A concentration load was applied on the top of the specimen to generate a relative displacement (slip) in the interface between concrete and steel. Meanwhile, the load-displacement relationship was measured by the acquisition system. During each loading step, the interfacial DI system was used to monitor the interface change by the PZT wave-based method.
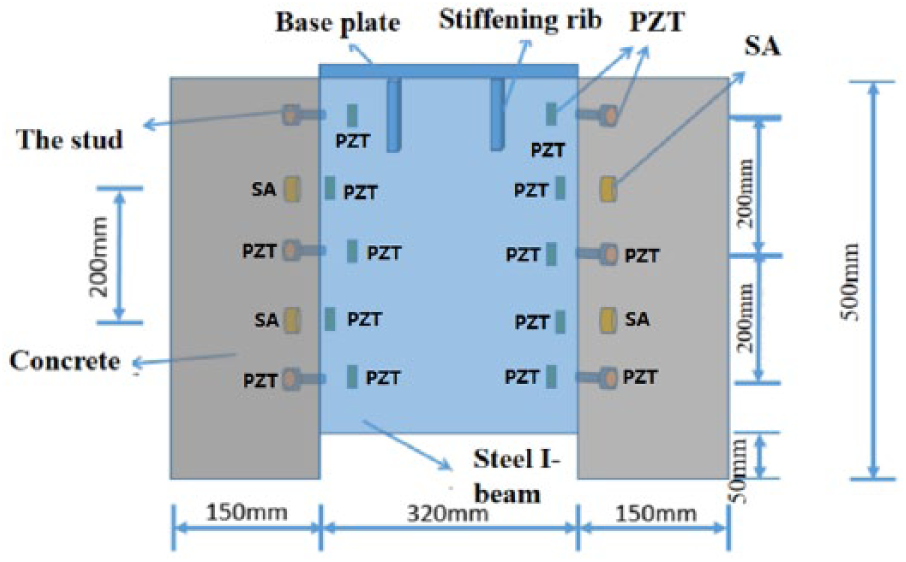
The push-out specimen and layout of PZT transducers.
In the composite beam separation monitoring experiment, two specimens connected with a set of steel studs were produced. Through the studs, the concrete body was linked together with the steel beam. The concrete body was fixed to the foundation structure by anchor bolts in the laboratory, and a concentration load was applied by a hydraulic jack from the bottom to jack up the steel beam to produce a vertical separation in the interface, shown in Figure 10. During the loading process, the load–displacement relationship was also measured by the acquisition system. Additionally, during each loading step the interfacial separation identification system was operated to monitor the interface separation state by the proposed method.
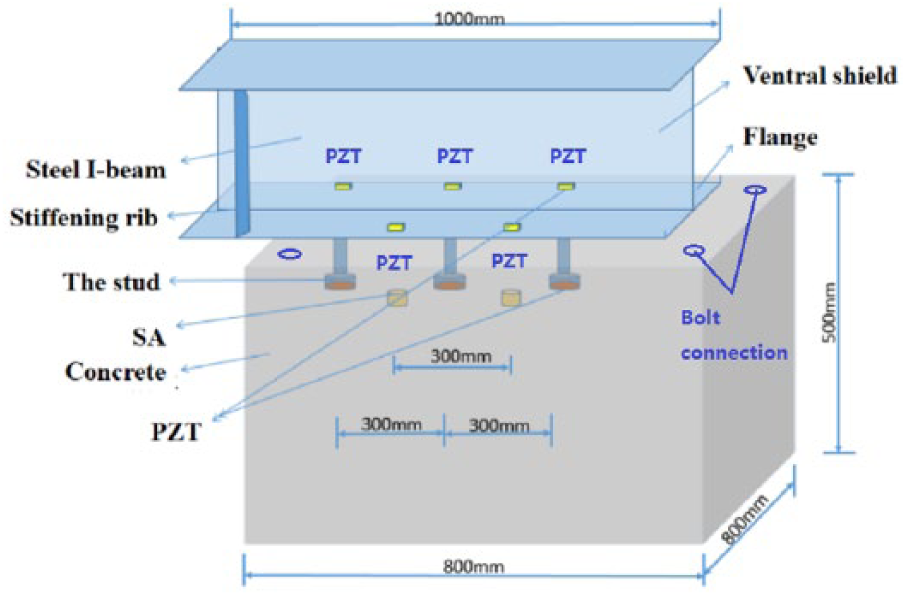
The separation specimen and layout of PZT transducers.
Selection of excitation signal and experimental results
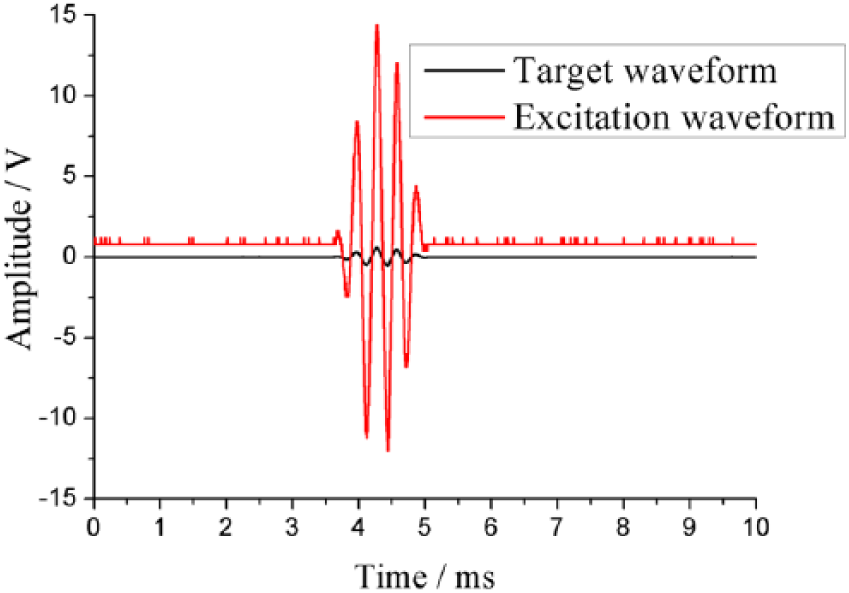
In order to guarantee the accuracy of experimental results, a narrow band excitation signal was selected based on the principle of weak frequency dispersion during wave propagation. Therefore, a standard five peak wave, which was modulated by Hanning window function, was selected as the excitation pulse wave. The selected signal can be represented by equation (3)
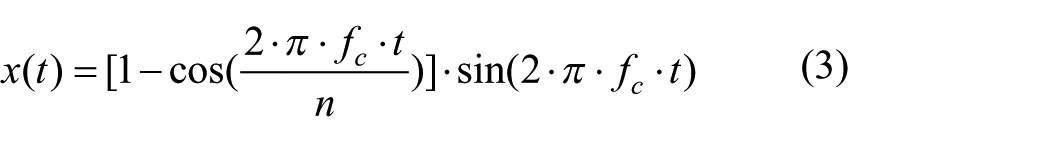
where x(t) is the excitation signal in time domain, n is the number of mono-tune frequency, and fc is the central frequency of the signal. The center of the signal frequency of 10 kHz was selected in the experiment. The selected frequency can both meet the requirement of experiment device in the working range and have well experimental results according to the pre-experiments.
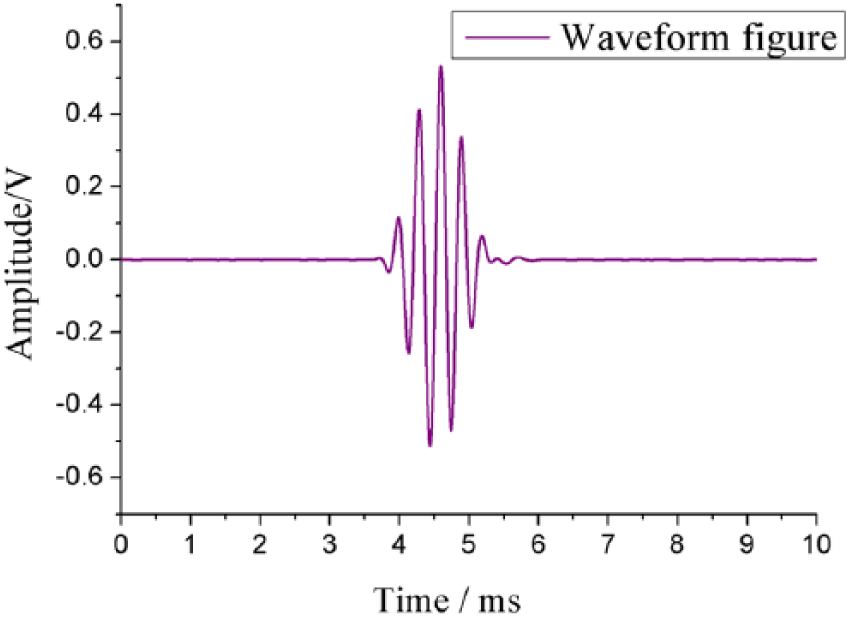
A combination method in both time domain and frequency domain was used for the received signal data processing. The frequency spectrum analysis was used to get the signal main frequency, and the time history analysis is applied to verify the excitation signal waveform for validation of the obtained signals, which will lay a foundation for further analysis. In time domain, after signal filtering, it was found that the waveform figure is almost unchanged compared with the original excitation waveform. The signal width was basically as the same as the original one, but amplitudes were significantly lower than the original. The signal waveform received by digital oscilloscope is shown in Figure 11. After dealing with the filtering, the waveform and spectrum diagram were as shown in Figures 12 and 13, respectively.
A received waveform figure.
The excitation wave after filtering in time domain.
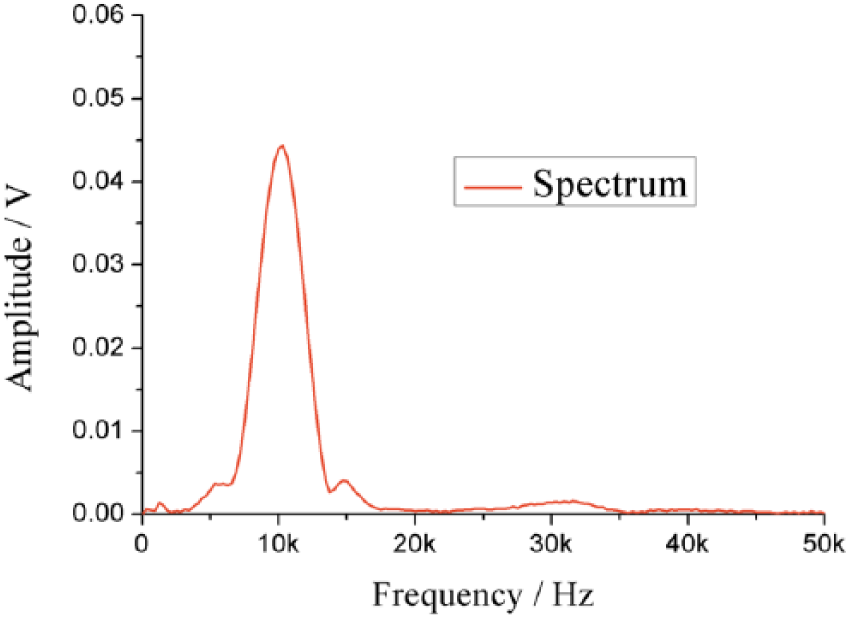
The excitation wave in frequency domain.
To investigate the influence of signal filtering on the results, the Butterworth filtering technology is applied to filter the received signals, and the cut-off frequency from 6.5 kHz to 13.5 kHz was selected. Through a comparison, it was found that the signal filtering will not have a great influence on the frequency, but will have an influence on the amplitude. Because an impulse with the central frequency of 10 kHz is used in the experiment, the signal energy is concentrated on a small range near 10 kHz, to realize the goal of filtering the environmental noises.
Displacement results
In the push-out experiment, the load-slip relationship curves were normally divided into three stages, shown in Figures 14 and 15, respectively. At the OA stage, as the applied load is small, the relative slip is very small, and as the load increases, the relative slips gradually increase. At the AB stage, the relative slips increase greatly as the small load increases. After the ultimate point B, at the BC stage, the relative slips still kept increasing even when the load decreased.
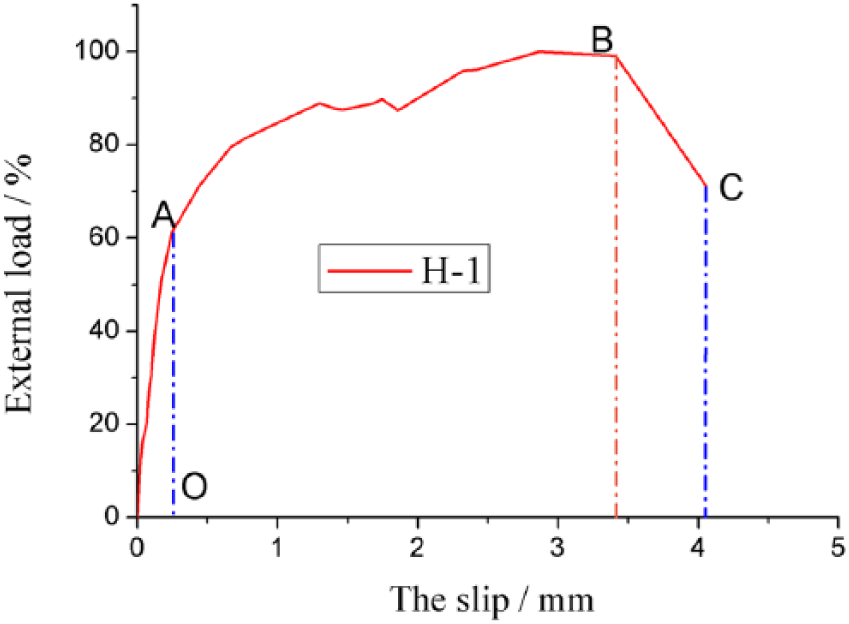
The P-∆ curve of push-out specimen H-1.
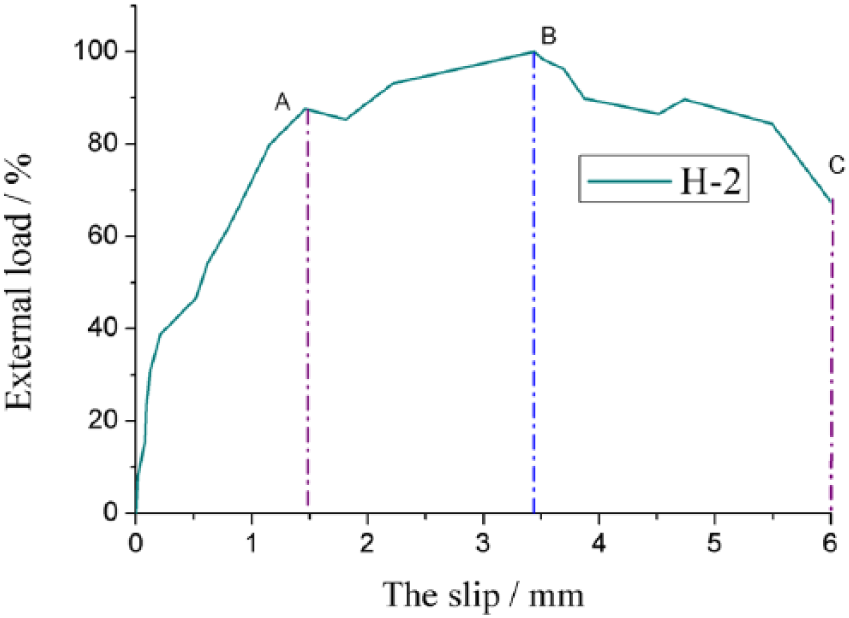
The P-∆ curve of push-out specimen H-2.
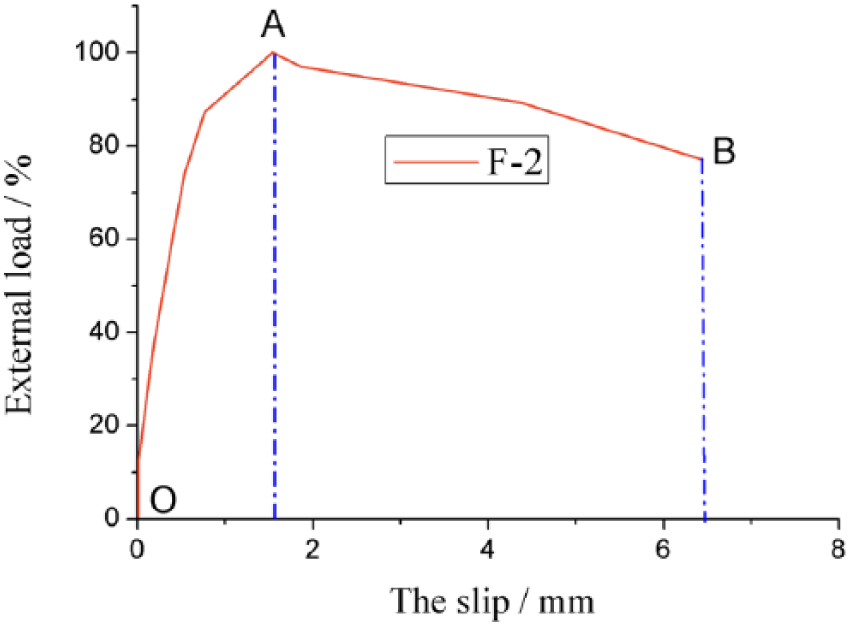
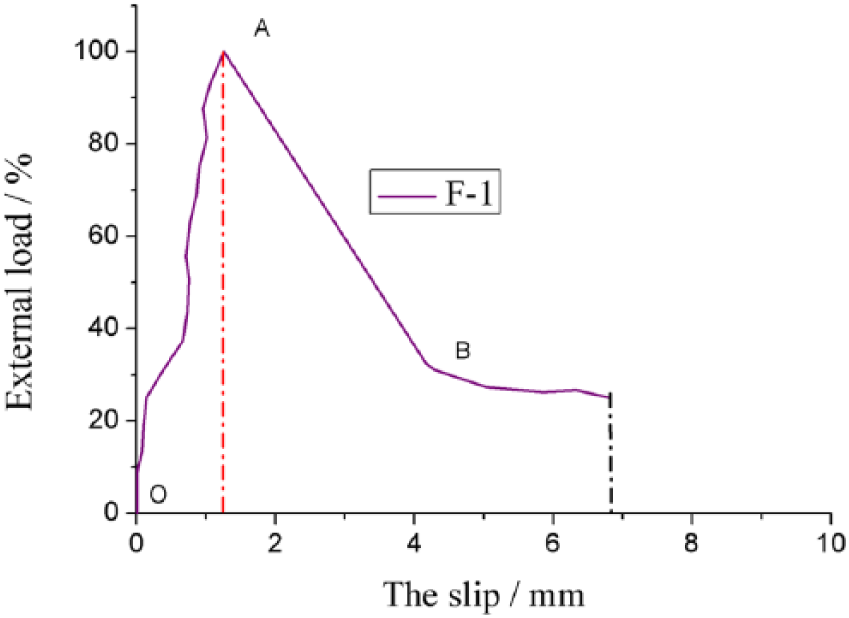
In the separation, the load–displacement relationship curves were basically categorized into two stages, shown in Figures 16 and 17, respectively. At the OA stage, the separation displacements were gradually increasing in a linear way. After the ultimate point A, at the AB stage, the separation displacements suddenly decreased, also in a linear way.
The P-∆ curve of separation specimen F-1.
The P-∆ curve of separation specimen F-2.
Signal processing method
During each test stage for the four specimens, the PZT active wave-based interfacial DI method was used to measure the signal responses. The received signals were used to set up the relationship between signal responses and the interface damage levels. The simplest and the most efficient method is using the signal amplitude (energy) representing the nature of the received signal after signal discretization. The whole energy of the received signal can be expressed as the sum of the square of the absolute value at each time step, shown in equation (4)
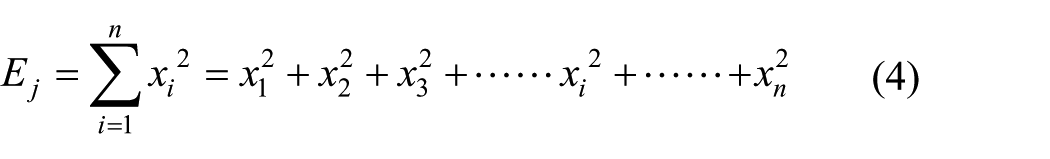
where xi is the signal amplitude, and Ej is the energy of the received signal. In order to compare the difference for various signals to clearly represent the properties of the received signals, a dimensionless variable is defined, shown in equation (5)
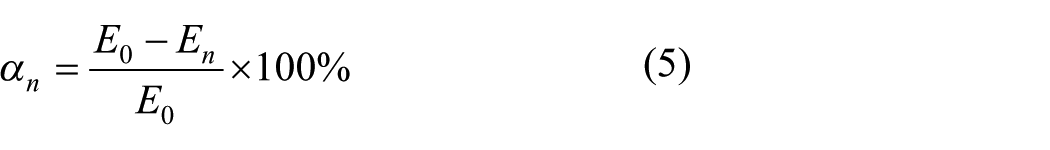
where α(n) is a dimensionless variable representing a relative energy of the received signal, n is the number representing the corresponding load level, En is the signal energy at the corresponding loads level, and E0 is the excitation signal energy before loading. Based on the formula of equation (5) and the interfacial damage classification in the following section, a signal energy-based algorithm can be established to identify the interfacial damage levels for the SCCS beams.
Experimental interfacial damage identification results
A series of PZT pairs were selected as transducers to form several signal measuring channels. In the pair of transducers, one was used as an actuator, and the other was applied as a sensor. The location of the excitation and reception is shown in Table 2. For the separation experiments, the results after calculations are shown in Figures 18, 19, and 20, respectively.
The signal excitation and reception locations.
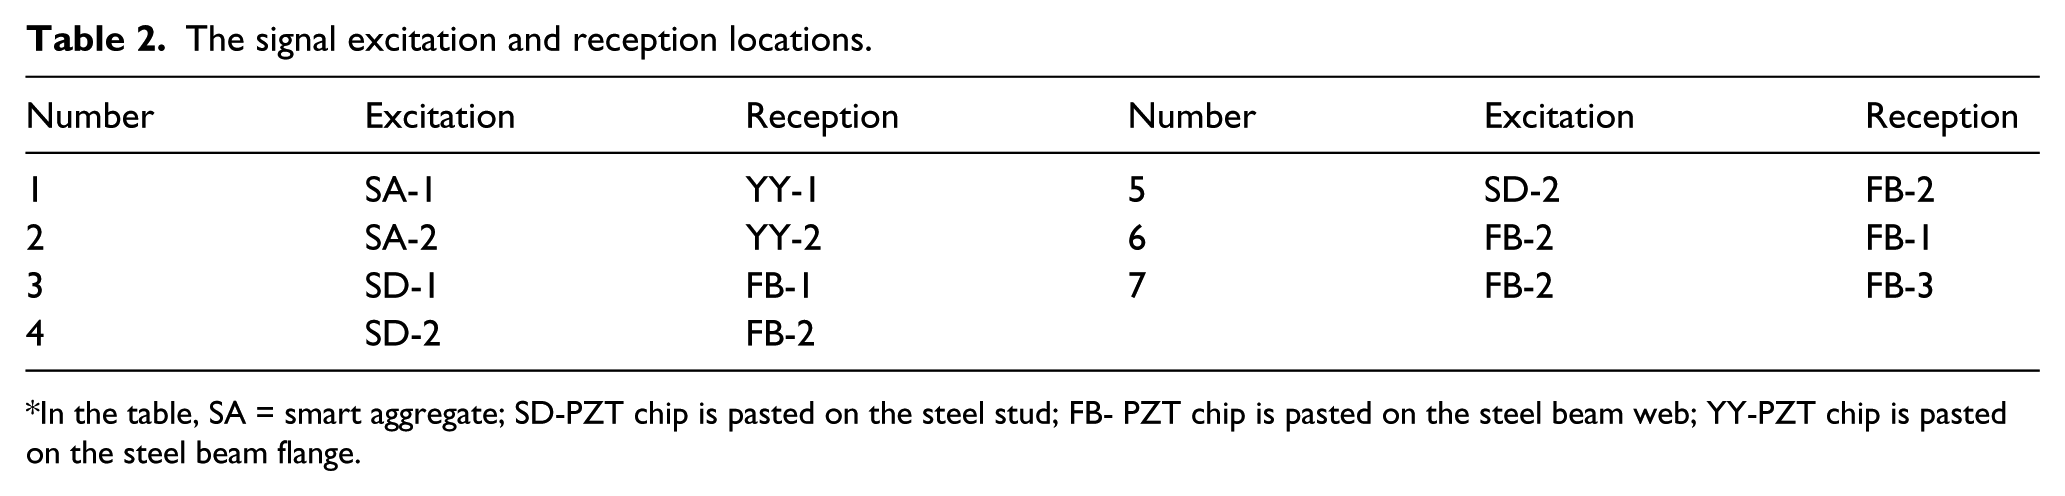
In the table, SA = smart aggregate; SD-PZT chip is pasted on the steel stud; FB- PZT chip is pasted on the steel beam web; YY-PZT chip is pasted on the steel beam flange.
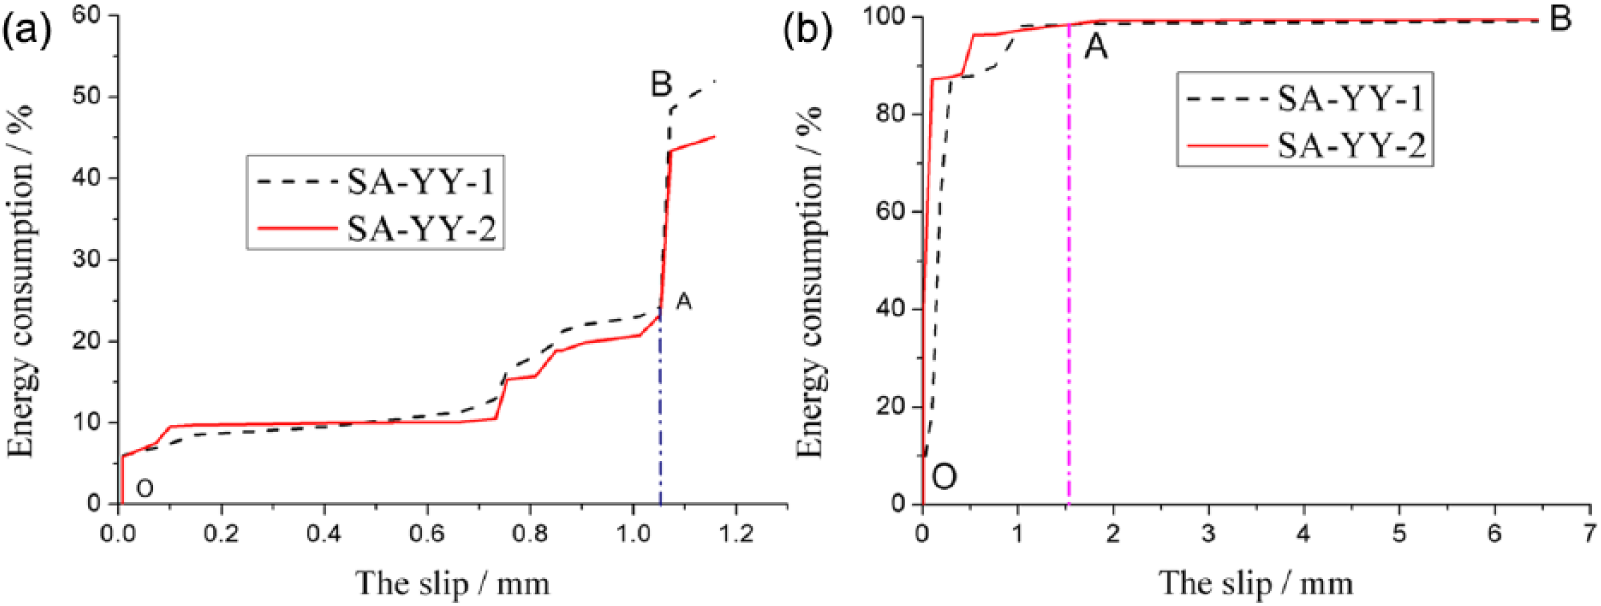
The energy dissipation ratio – the slip diagram of SA-YY. (a) Separation specimen F-1. (b) Separation specimen F-2.
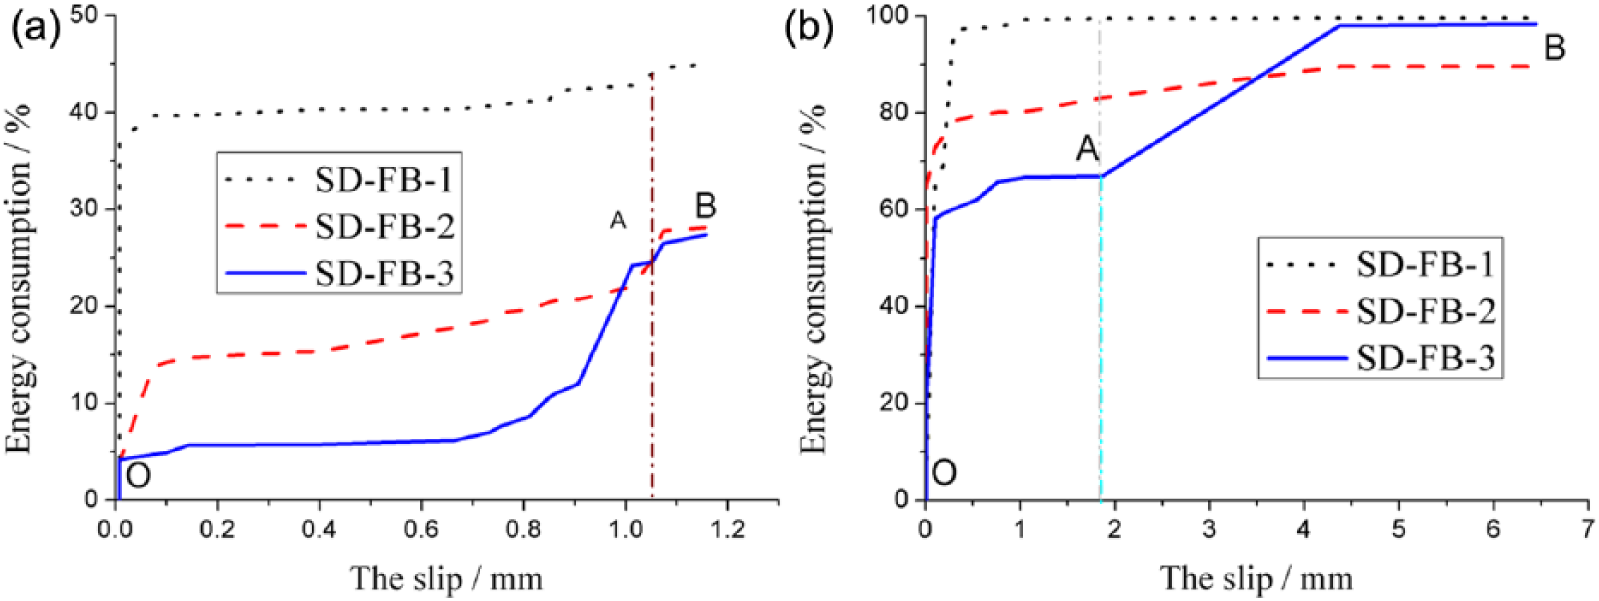
The energy dissipation ratio – the slip diagram of SD-FB. (a) Separation specimen F-1. (b) Separation specimen F-2.
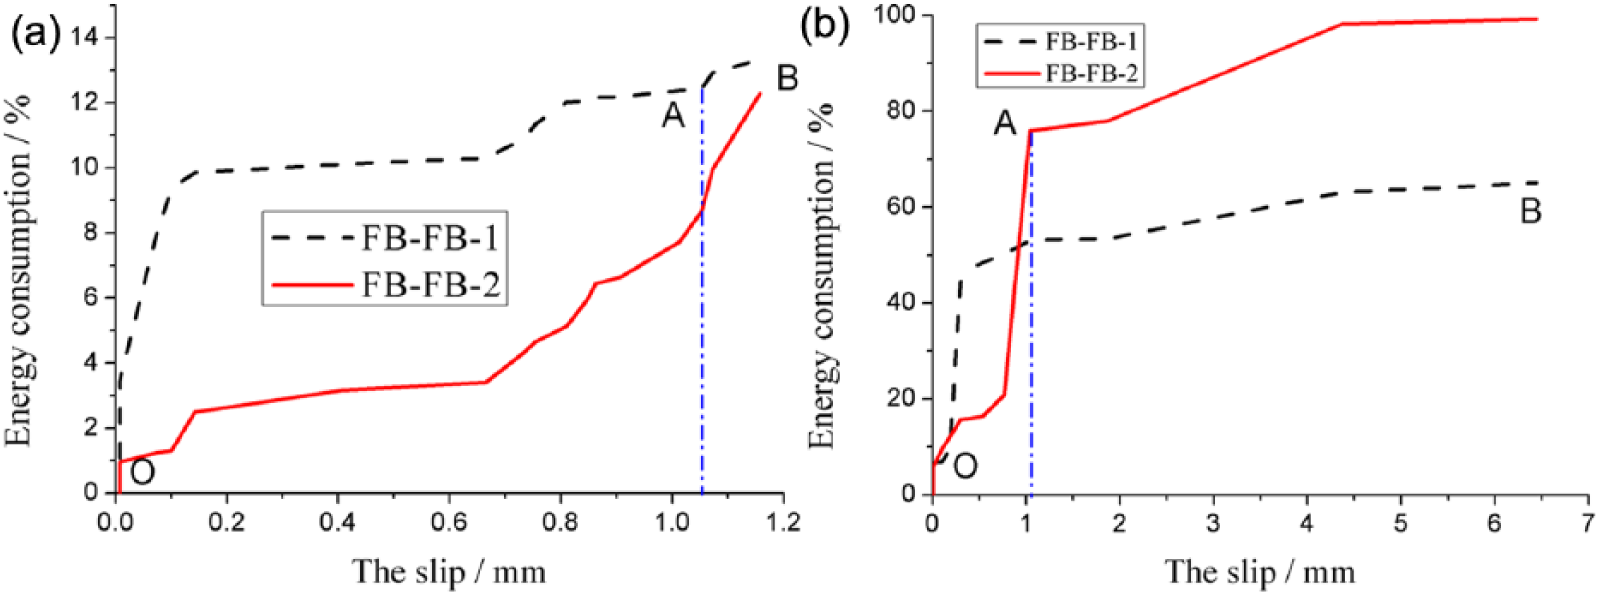
The energy dissipation ratio – the slip diagram of FB-FB. (a) Separation specimen F-1. (b) Separation specimen F-2.
For the separation experiments, as the external load is small and the percentage of energy consumption is linearly increasing, which means the interface in the SCCS beam is stable. As the load is approaching the ultimate capacity, the separation displacement greatly increases, accompanying the greatly increasing percentage of energy consumption of the received signal. But for different PZT pairs at different locations, the change rule has a little difference.
For the push-out experiments, the results after calculations are shown in Figures 21, 22, and 23, respectively. The curves can be divided into three stages. For the first stage, the relationship between the percentage of energy consumption and the relative slip is linearly increasing. The stable curves increase until the relative slips begin to dramatically increase for the second stage; meanwhile, the percentage of energy consumption keeps increasing. For the third stage, the percentage of energy consumption remains unchanging (almost 100%), which means the interface between the concrete flange and the steel beam is totally destroyed and preventing the signal from propagation.
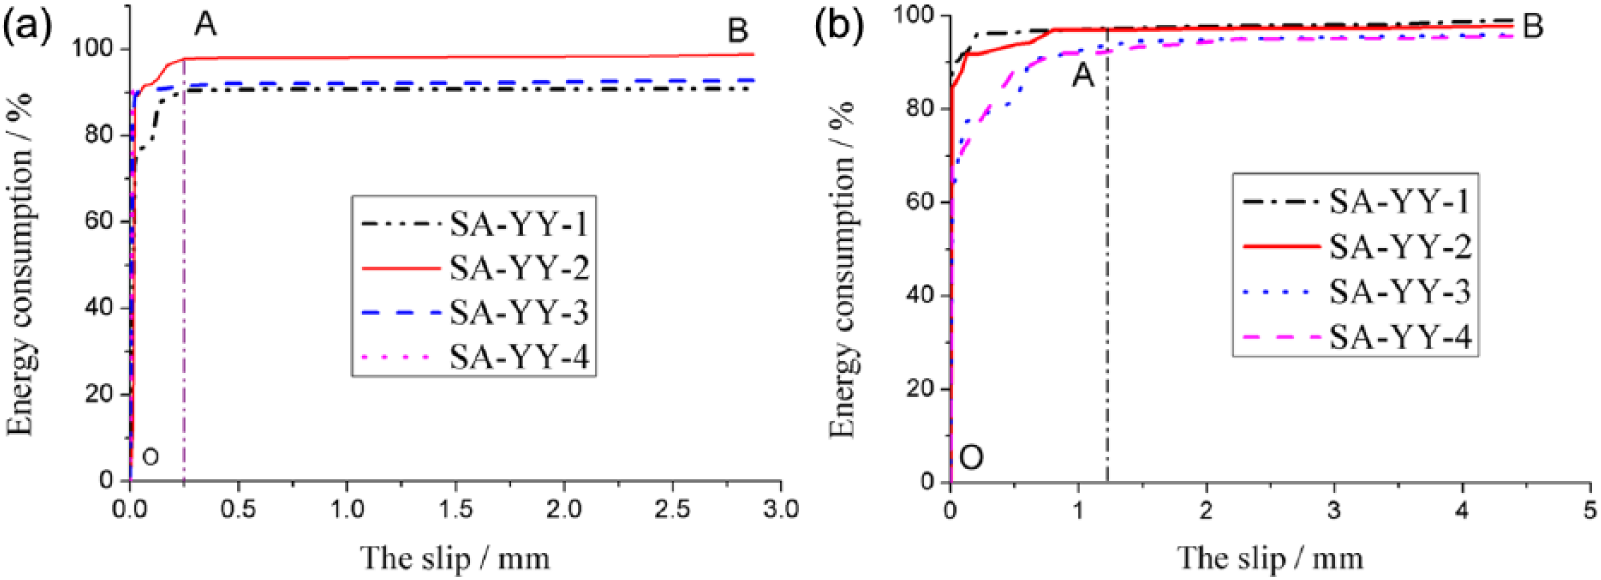
The energy dissipation ratio – the slip diagram of SA-YY. (a) Push-out specimen H-1. (b) Push-out specimen H-2.
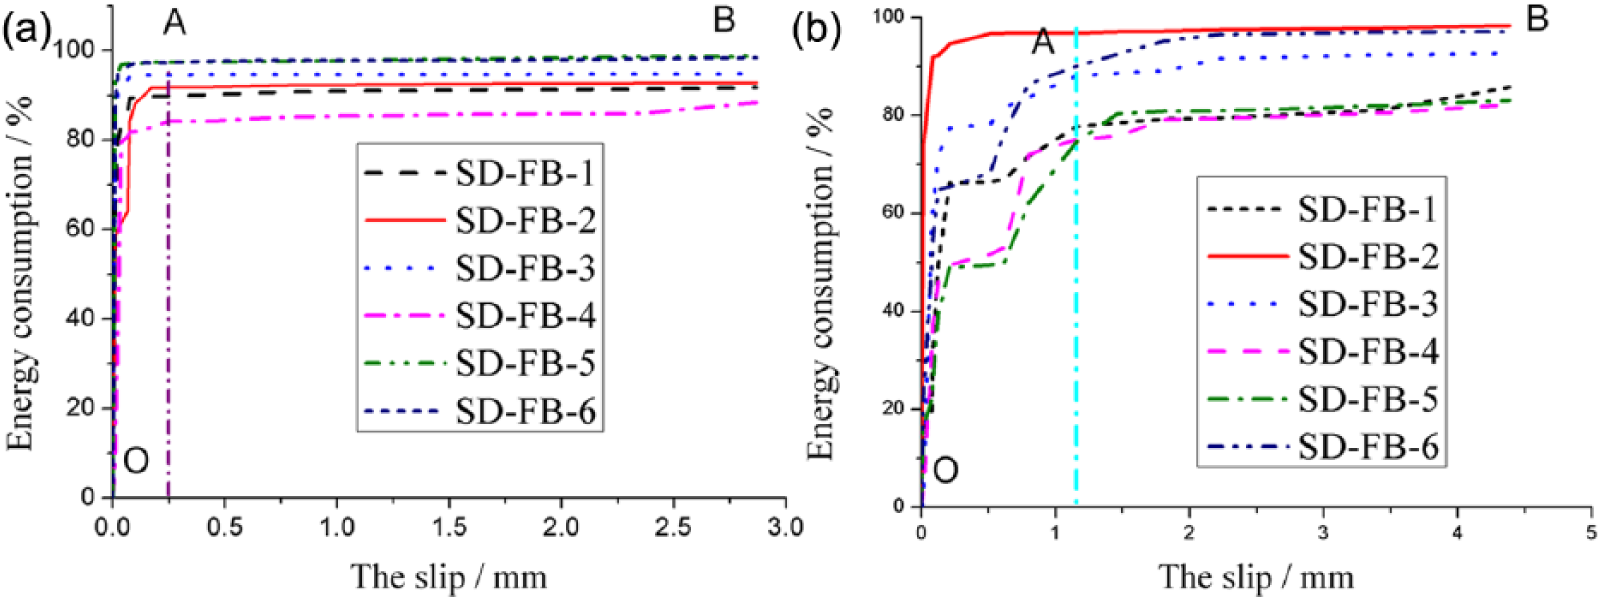
The energy dissipation ratio – the slip diagram of SD-FB. (a) Push-out specimen H-1. (b) Push-out specimen H-2.
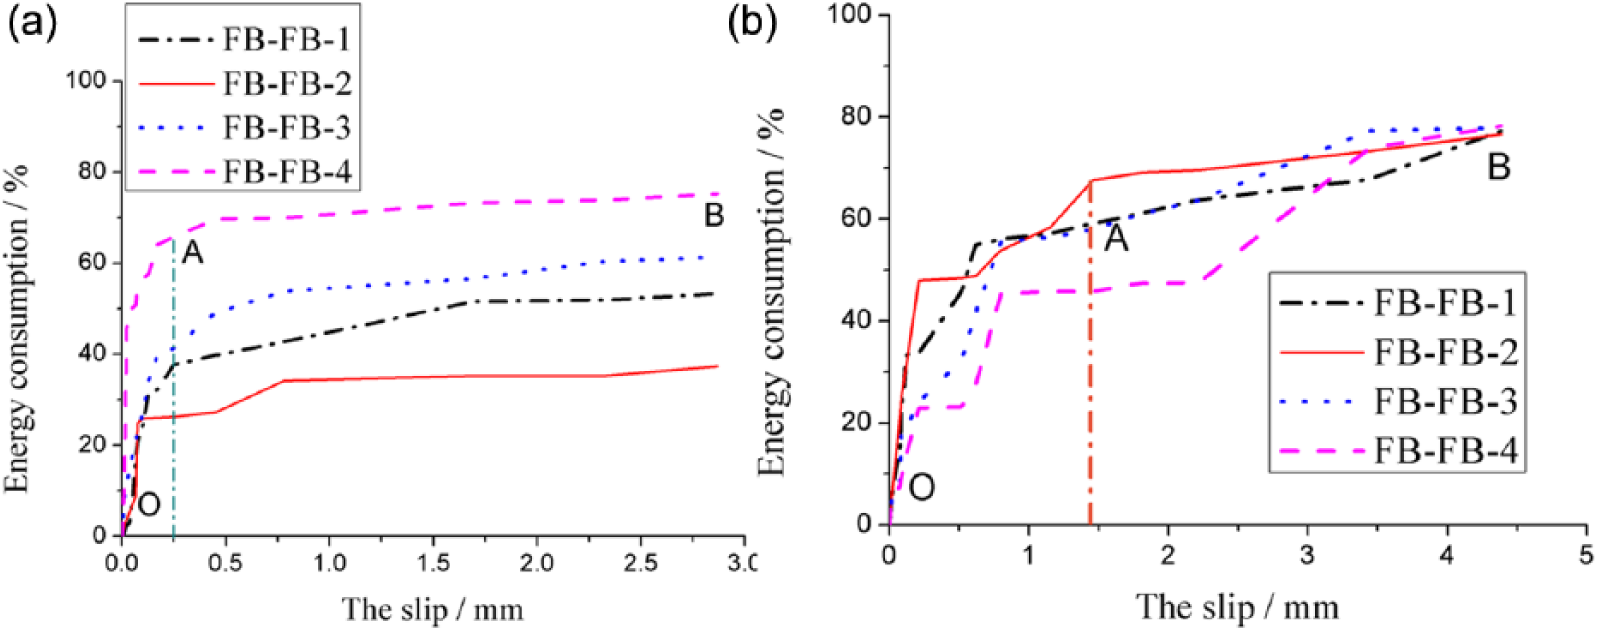
The energy dissipation ratio – the slip diagram of FB-FB. (a) Push-out specimen H-1. (b) Push-out specimen H-2.
Conclusions
This research shows that the PZT active wave-based method can effectively identify the interfacial damages in steel and concrete composite beams. By embedding the smart aggregates in the composite beam flange or pasting the PZT chips on the surface of the steel beam, a pair of PZT transducers can be formed to be used in interfacial damage detection. Two kinds of the push-out test and separation test were carried out to research the relationship between the percentage of energy consumption and the interface displacement. The main experimental results can be concluded as follows:
The PZT-based detection signal, which is a standard five peak impulse with the central frequency of 10 kHz modulated by Hanning window function, is selected and validates the efficiency in the interfacial damage detection of SCCS beams.
The relationship between the signal energy and interfacial damage levels is established. The nonlinear relationship is used to divide the interfacial damage situations into two or three stages, based on the different loading conditions. For the loading direction parallel to the interfacial surface (in the push-out test), the minor, moderate, and major relative slips representing three kinds of damage levels are divided. For the loading direction vertical to the interfacial surface (in the separation test), the minor and major separations denoting two kinds of damage levels are classified.
The percentage of energy consumption of the received signal can be used as a variable to set up the identification algorithm. The percentage of energy consumption of the received signal increases with the development of the relative slips or separation displacements, which sets up a close relationship between the detection signal energy and the interface state.
Based on the relationship, an algorithm for the interfacial damage identification of the SCCS beams is established. By using the proposed algorithm, interface states can be monitored or identified. The concept and the mechanism can also be applied in the corresponding interface damage identification or monitoring of similar structures.
Footnotes
Declaration of Conflicting Interests
The author(s) declared no potential conflicts of interest with respect to the research, authorship, and/or publication of this article.
Funding
The author(s) disclosed receipt of the following financial support for the research, authorship, and/or publication of this article: This work was financially supported in part by the Liaoning Province Higher Education Fundamental Research Project of China (LJZ2017002); the Liaoning Provincial Department of Education Science Research Project (LJZ2016029); the National Natural Science Foundation of China (51278313).