
Abstract
Introduction:
The mass accumulation of phosphogypsum has caused serious environmental pollution, which has become a worldwide problem. Gypsum is a kind of green building material, which is lighter, has better heat and sound insulation performance, and is easier to recycle compared to cement. The application of cast-in-situ phosphogypsum wall could consume a large amount of pollutant, and improve the efficiency of building construction.
Methods:
The preparation and thermal insulation performance of cast-in-situ phosphogypsum wall were investigated. The property of phosphogypsum–fly ash–lime (PFL) triad cementing materials, the adaptability of retarders and superplasticizers, and the influences of vitrified microsphere as aggregates were explored. Thus, the optimum mix was proposed. Thermal insulation performance tests and ANSYS simulation of this material was carried out.
Results:
Optimal structures based on heat channels and the method of calculation determining related parameters were proposed, which achieved a 12.3% reduction in the heat transfer coefficient of the wall.
Conclusion:
With good performance, phosphogypsum could be used in cast-in-situ walls. This paper provides the theoretical basis for the preparation and energy-saving application of phosphogypsum in the walls of buildings.
Introduction
Phosphogypsum (PG) is a by-product of industry that is mainly produced during the reaction of phosphate ore and sulfuric acid in wet processes. The chemical equation for this process is:
For each ton of phosphoric acid produced, there are 5 tons of phosphorous gypsum emissions.1–3 Annual emissions are about 200–280 Mt/a worldwide; China’s emissions exceed 55 Mt/a. However, the rate of utilization is less than 30%. 4 Phosphogypsum contains soluble phosphorous, fluorine, and various impurities such as heavy metal ions. Accumulation of phosphogypsum can cause serious pollution to land, water sources, and air. The use of phosphogypsum has become an important influencing factor in the sustainable development of the phosphate fertilizer industry. To date, much research has been carried out on the utilization of phosphogypsum. Mousa and colleagues 5 studied the preparation of nano-material from phosphogypsum. Değirmenci and colleagues 6 studied the application of phosphorus gypsum in soil stabilization, and found that phosphogypsum and fly ash provide an inexpensive and advantageous construction product. In addition, Zheng and colleagues 7 studied the method of decomposition of phosphorus gypsum to SO2 in an inert atmosphere. The use of phosphogypsum is mainly concentrated in the field of building materials, which is also the most effective way to consume it. Tian and colleagues 8 studied the preparation method of foam concrete by phosphogypsum; the system of PG–cement–ground-granulated blast-furnace slag (GGBFS) possesses better carbonation resistance, which can be used in foam concrete. Lin Yang and colleagues 9 studied the utilization of original phosphogypsum as raw material for the preparation of self-leveling mortar, which provided a method for the direct use of phosphogypsum and a high-performance mortar applied in civil engineering.
Worldwide energy consumption is expected to increase by 33% between the years 2010 and 2030; building energy consumption accounts for 20–40% of total energy consumption. Building energy consumption accounts for 27.6% of total energy consumption in China, which is expected to increase to 35% by 2020. 10 Different countries and areas have different requirements for building energy-saving standards. In China, it is required that space heating and cooling consumes no more than approximately 60% of the total energy used in buildings. 11 To meet the requirements of energy conservation, the materials of the wall are selected from different grades of foam concrete, aerated concrete, rock wool, and other materials.
With the development of construction technologies, people have paid more attention to the comfort of the building. In addition to the thermal insulation performance mentioned above, buildings should also meet other performance requirements, such as fire protection, light quality, and so on. 12 As a building material, the production energy consumption of gypsum is far below that of cement. Gypsum also possesses better architectural functions; and is easier to recycle. Değirmenci 13 studied the curing condition of phosphogypsum, which was used as a raw and calcined material for making the cementitious binder. It was concluded that phosphogypsum can be applied for the production of interior wall materials. Ariyanayagam and Mahendran 14 explored the fire resistance of steel frame walls lined with calcium silicate boards and gypsum plasterboards. It was found that the fire resistance of this material was superior to that of magnesium oxide board-lined walls.
Compared to cement, gypsum has the characteristic of a short setting time and micro-expansion. In addition, gypsum materials can meet the mechanical property requirements of non-loadbearing walls. Using gypsum materials to build non-loadbearing walls can improve construction efficiency and avoid cracking of the wall. In our paper, with the calcined PGL as a raw material, by adjusting and optimizing the ratio of light material and admixtures, cast-in-situ phosphorus gypsum material was prepared according to the requirements of the cast-in-situ process. Furthermore, we also proposed the corresponding thermal insulation structure and studied the insulation performance achieved by the use of phosphogypsum in the building wall.
Experiment
Raw material
Calcined phosphogypsum
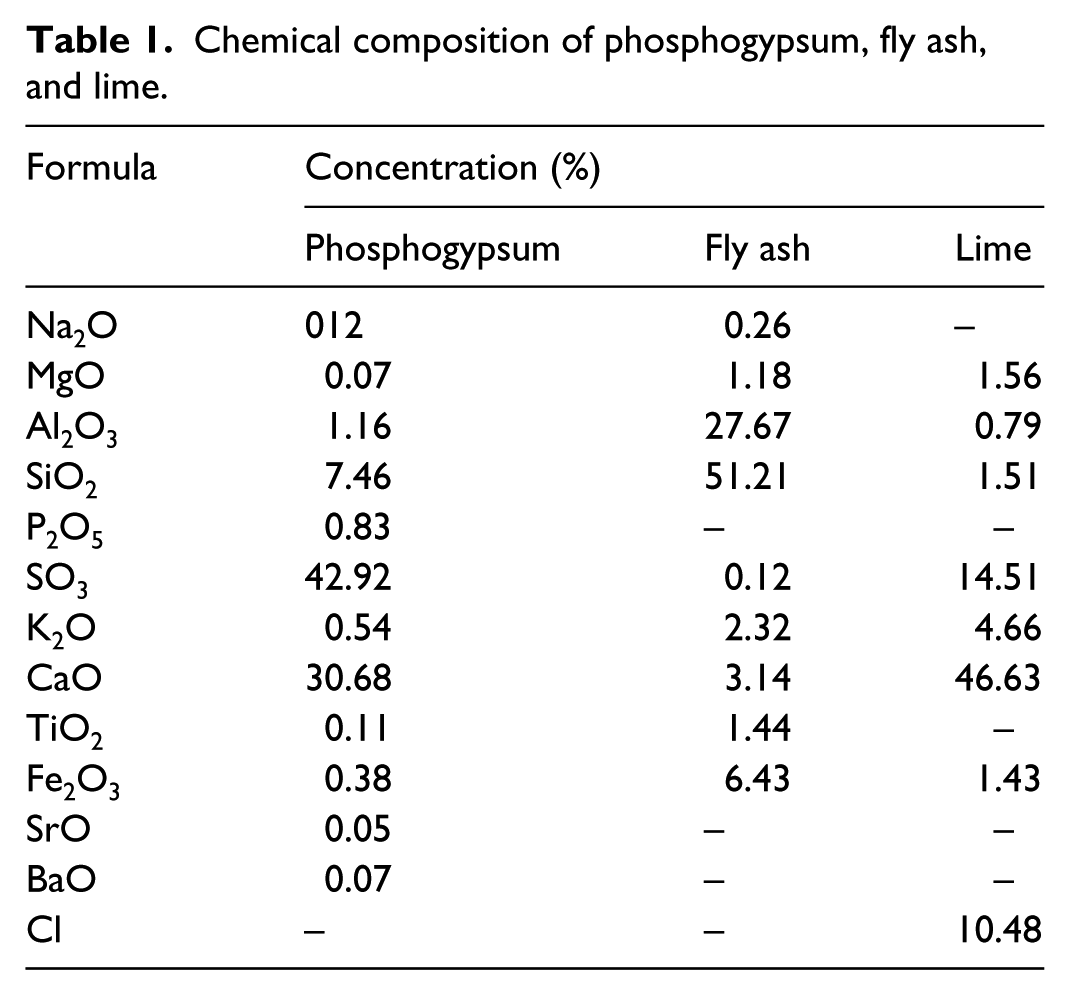
The phosphogypsum used in this research was from Yihua Industry Co., Ltd. (Hubei, China). The SEM image of the phosphogypsum is shown in Figure 1. The chemical composition was obtained by X-ray fluorescence and is given in Table 1. The setting time of calcined phosphogypsum was 5.5 min, and the compressive strength at 1 day was 14.0 Mpa.
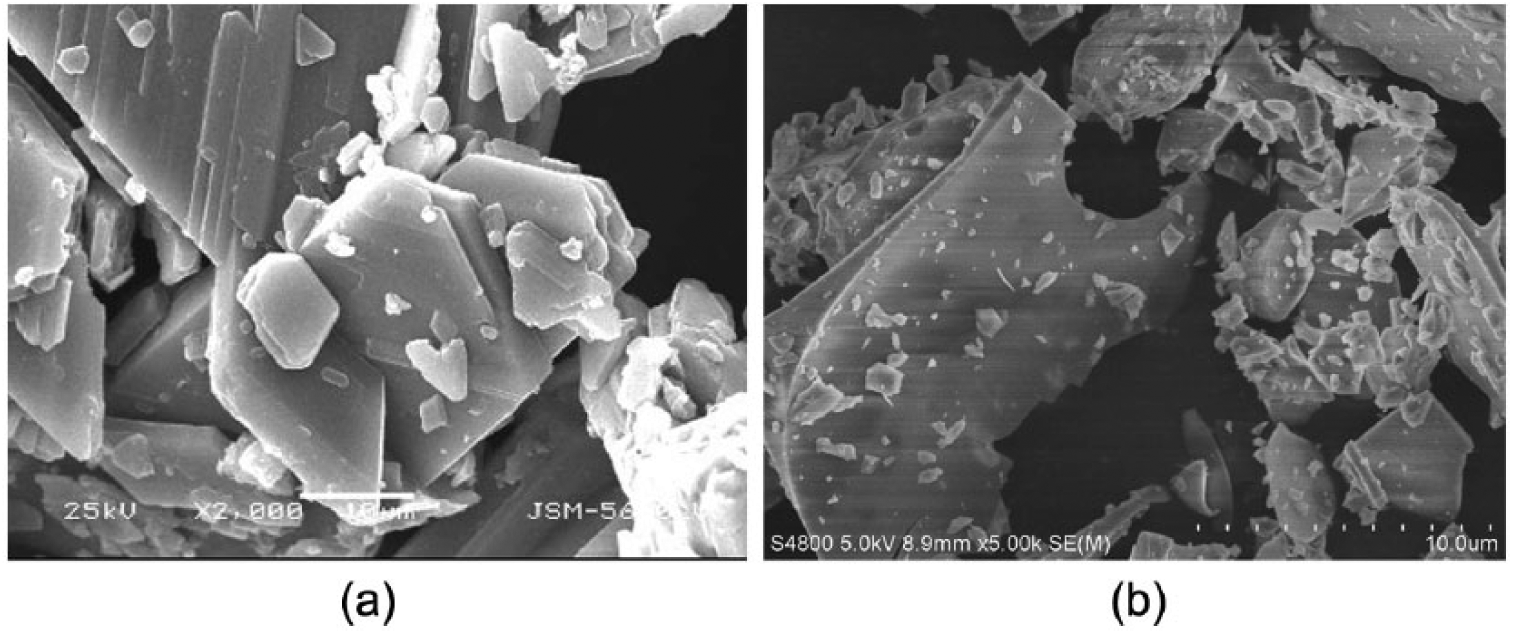
SEM image of phosphogypsum and vitrified microsphere.
Chemical composition of phosphogypsum, fly ash, and lime.
Fly ash, lime, and vitrified microspheres
Fly ash and lime were obtained from Huaneng Yangluo power plant in the city of Wuhan, Hubei, China. The chemical compositions are shown in Table 1. Vitrified microspheres were from Xinyang, Henan, China. The inner structure is shown in Figure 1.
Other materials
Three kinds of retarder were used: sodium citrate, sodium polyphosphate, and SC protein retarder. The purity grade of the sodium citrate and sodium polyphosphate were AR. The SC protein retarder was from Zhengzhou, Henan, China. Two kinds of superplasticizers were used: melamine and naphthalene. These were from Wuhan Huaxuan Co., Ltd. (Hubei, China).
Experimental methods
Macroscopic performance test methods
Setting time tests were performed in conformity with Chinese national standard GB/T 17669.4-1999. The compressive strength tests were performed in conformity with Chinese national standard GB/T 17671-2005. The softening coefficiency tests were performed in conformity with Chinese industry standard JC/T 698-2010.
Heat transfer coefficiency tests used the guarding heat-box method. The equipment and experimental setup are shown in Figure 2. The size of the heat box was 1.9 m × 1.9 m; the size of the specimen was 1.45 m × 1.45 m; the temperature range of the heat box was 15 °C to 50 °C; the temperature range of the cold box was −10°C to −20 °C; and the power range of the control system was 0–200 W.
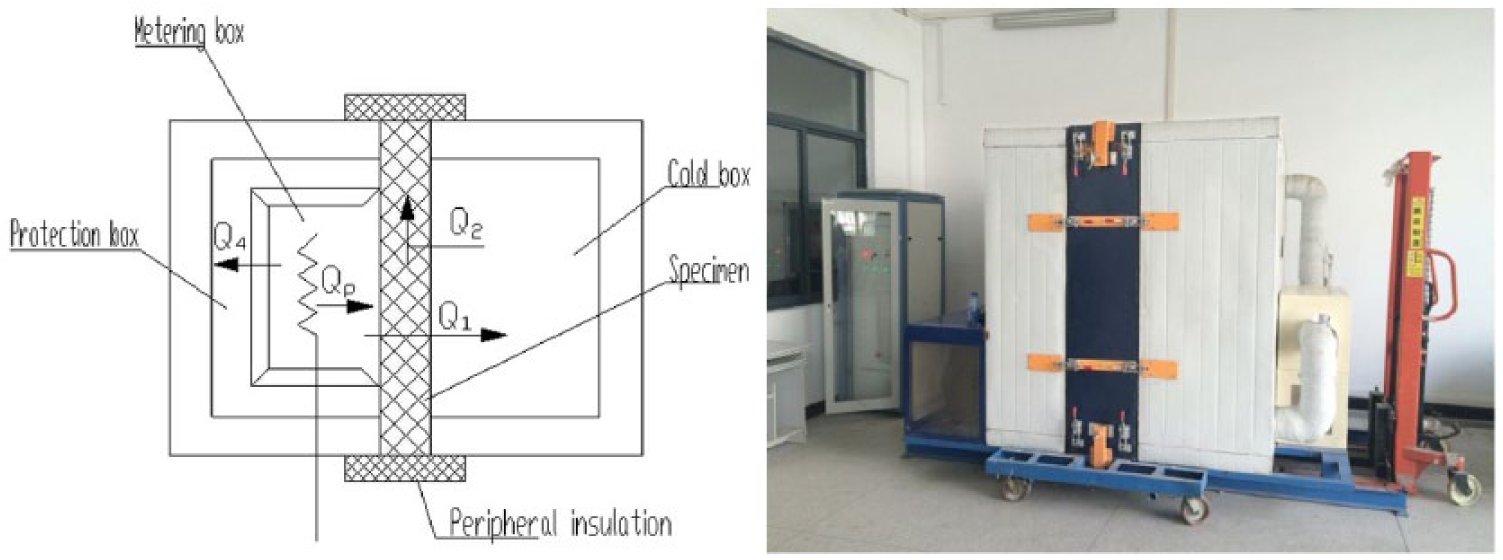
Images of the guarding heat-box method and device.
Microscopic performance test methods
The microstructure of specimens was tested by using scanning electron microscopy (FEI Quanta 450FEG scanning electron microscope, Jena, Germany). For X-ray diffraction we used the D/MAX-RB (RIGAKU Corporation, Japan); the test angle range was 5–70° and the test accuracy was controlled to less than 0.02° (∆2θ ≤ ± 0.02°).
Result and discussion
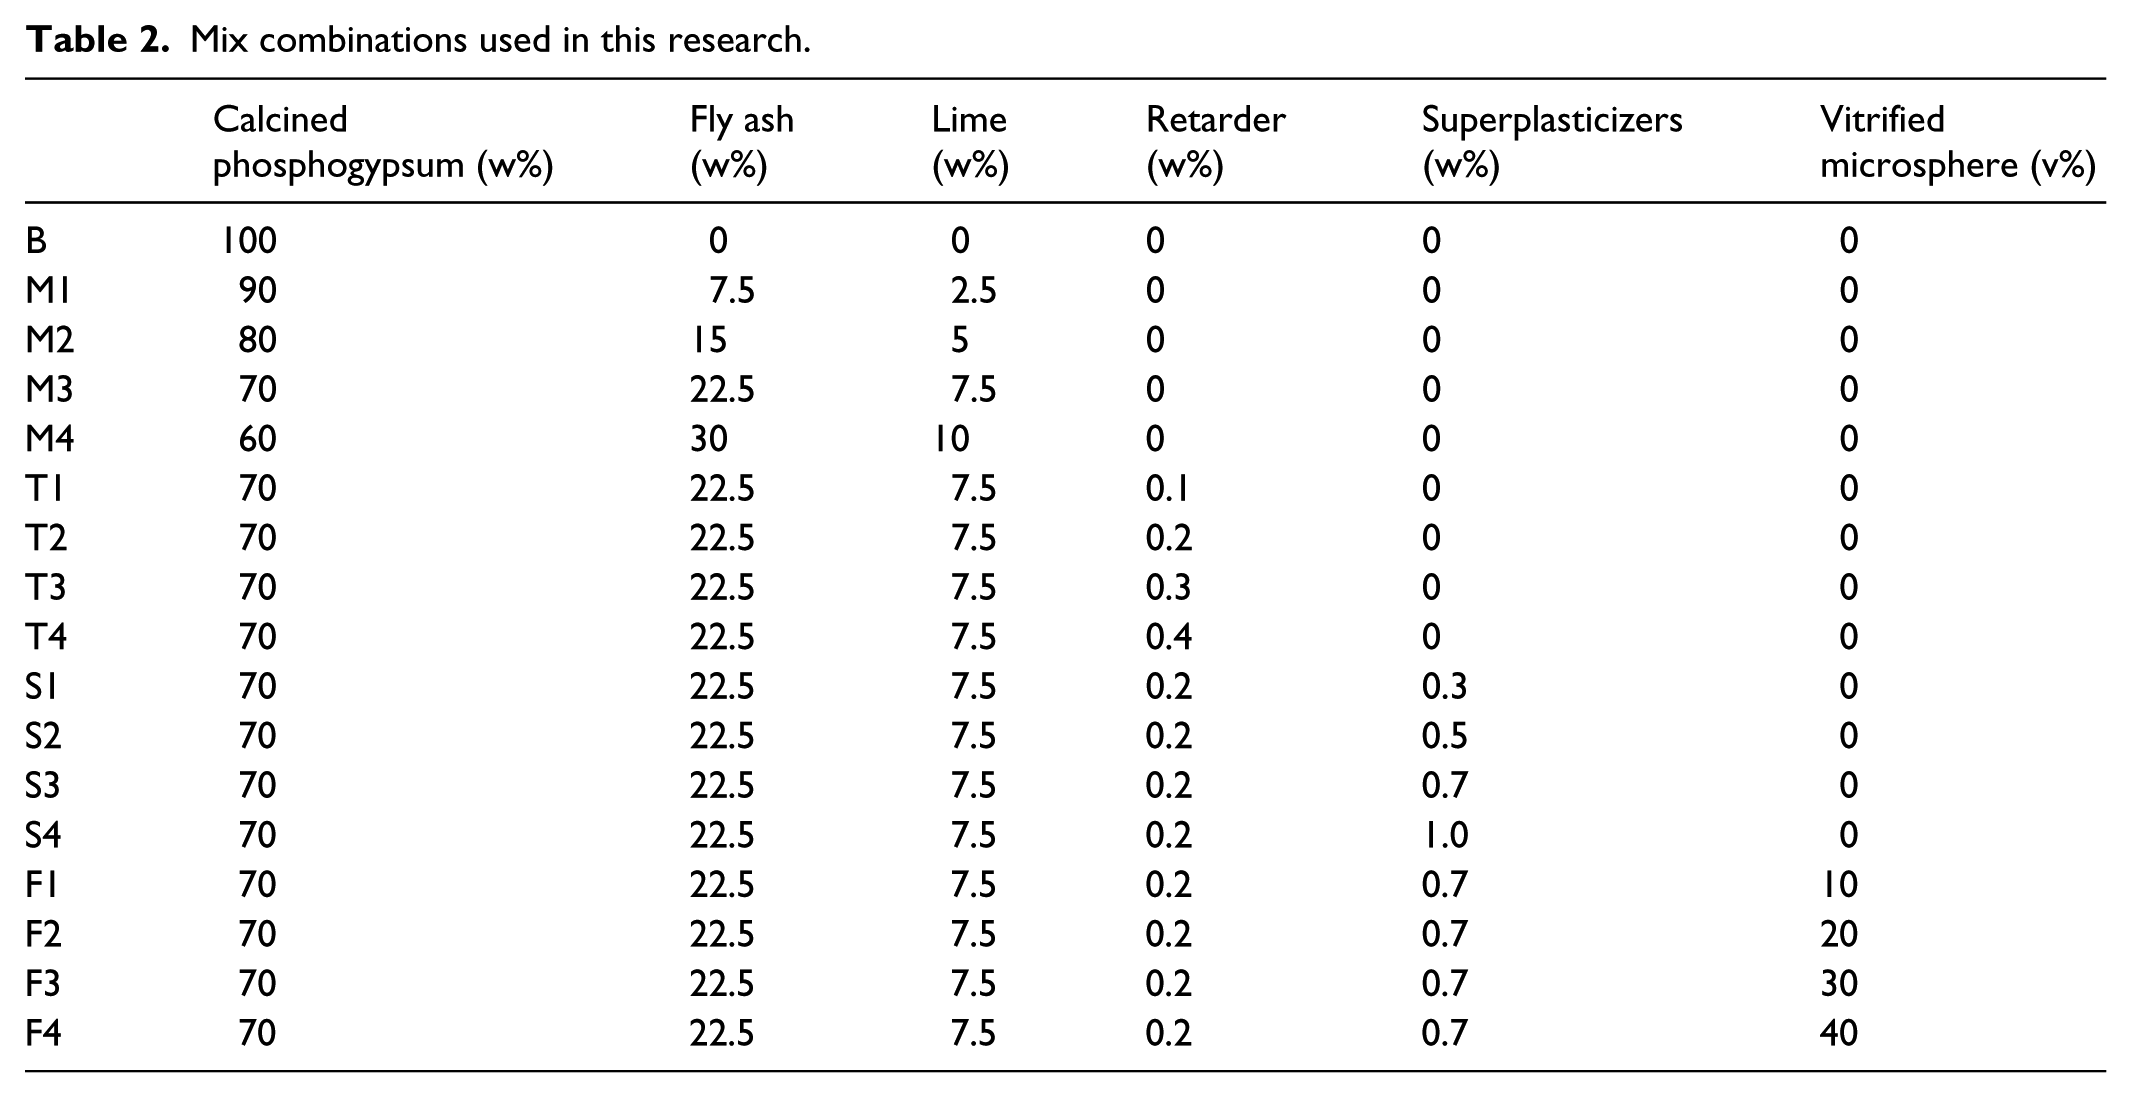
The experimental design is shown in Table 2. Four studies were investigated, covering: the properties of PFL (M1–M4); the influences of retarders to specimens (T1–T4); the influences of superplasticizers to specimens (S1–S4); and the properties of specimens mixed with vitrified microsphere (F1–F4). For comparison, various reagents were used for the study in the T and S series. Different dosages were used depending on the materials mix materials, based on existing research.15–21
Mix combinations used in this research.
Softening coefficiency and compressive strength of PFL
The results of softening coefficiency and compressive strength of specimens are shown in Figure 3. Softening coefficiency is always regarded as an indicator of the property of water resistance of materials, which is the ratio of the compressive strength in a water-saturated state to the compressive strength in a dry state. Gypsum is a gas-hard material and has poor water resistance. Yan and You 22 have testified that fly ash could improve the water resistance of gypsum. From the results shown in Figure 3, the softening coefficiencies of specimens increased with increasing fly ash content. The softening coefficiency of 7.5% fly ash was 0.64, which could meet the requirements for interior materials, which increased 10.3% compared to raw calcined phosphogypsum. The softening coefficiencies of specimens were improved most effectively when the content of fly ash reached 30%.
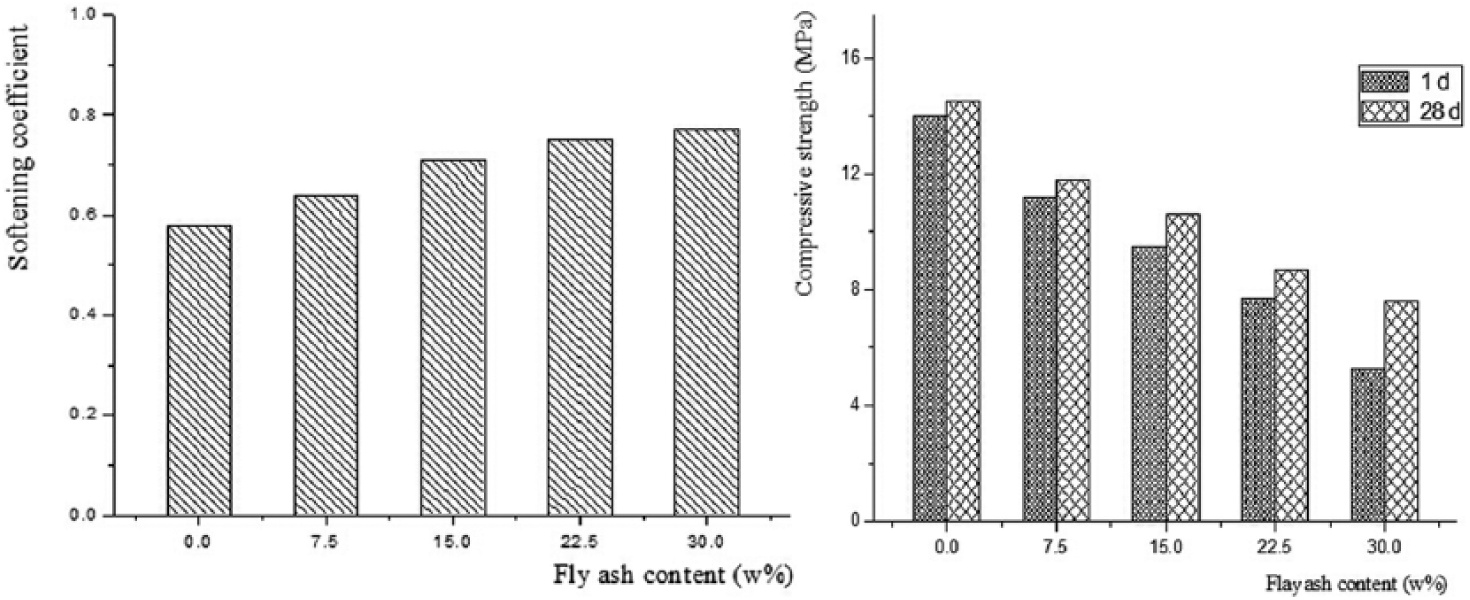
Softening coefficiency and compressive strength of specimens.
The compressive strength was reduced as the content of fly ash increased. The action of fly ash is relatively limited when the material is new. As the material ages, fly ash exhibits a pozzolanic reaction in the presence of calcium hydroxide (Ca(OH)2), which is formed during cement hydration. 23 The increment of 28-day compressive strength on day 1 increased as the fly ash content increased. The XRD image given in Figure 4 shows that the hydration products of PFL include calcium sulfate and ettringite. This verifies that the fly ash contributes to the development of compressive strength.
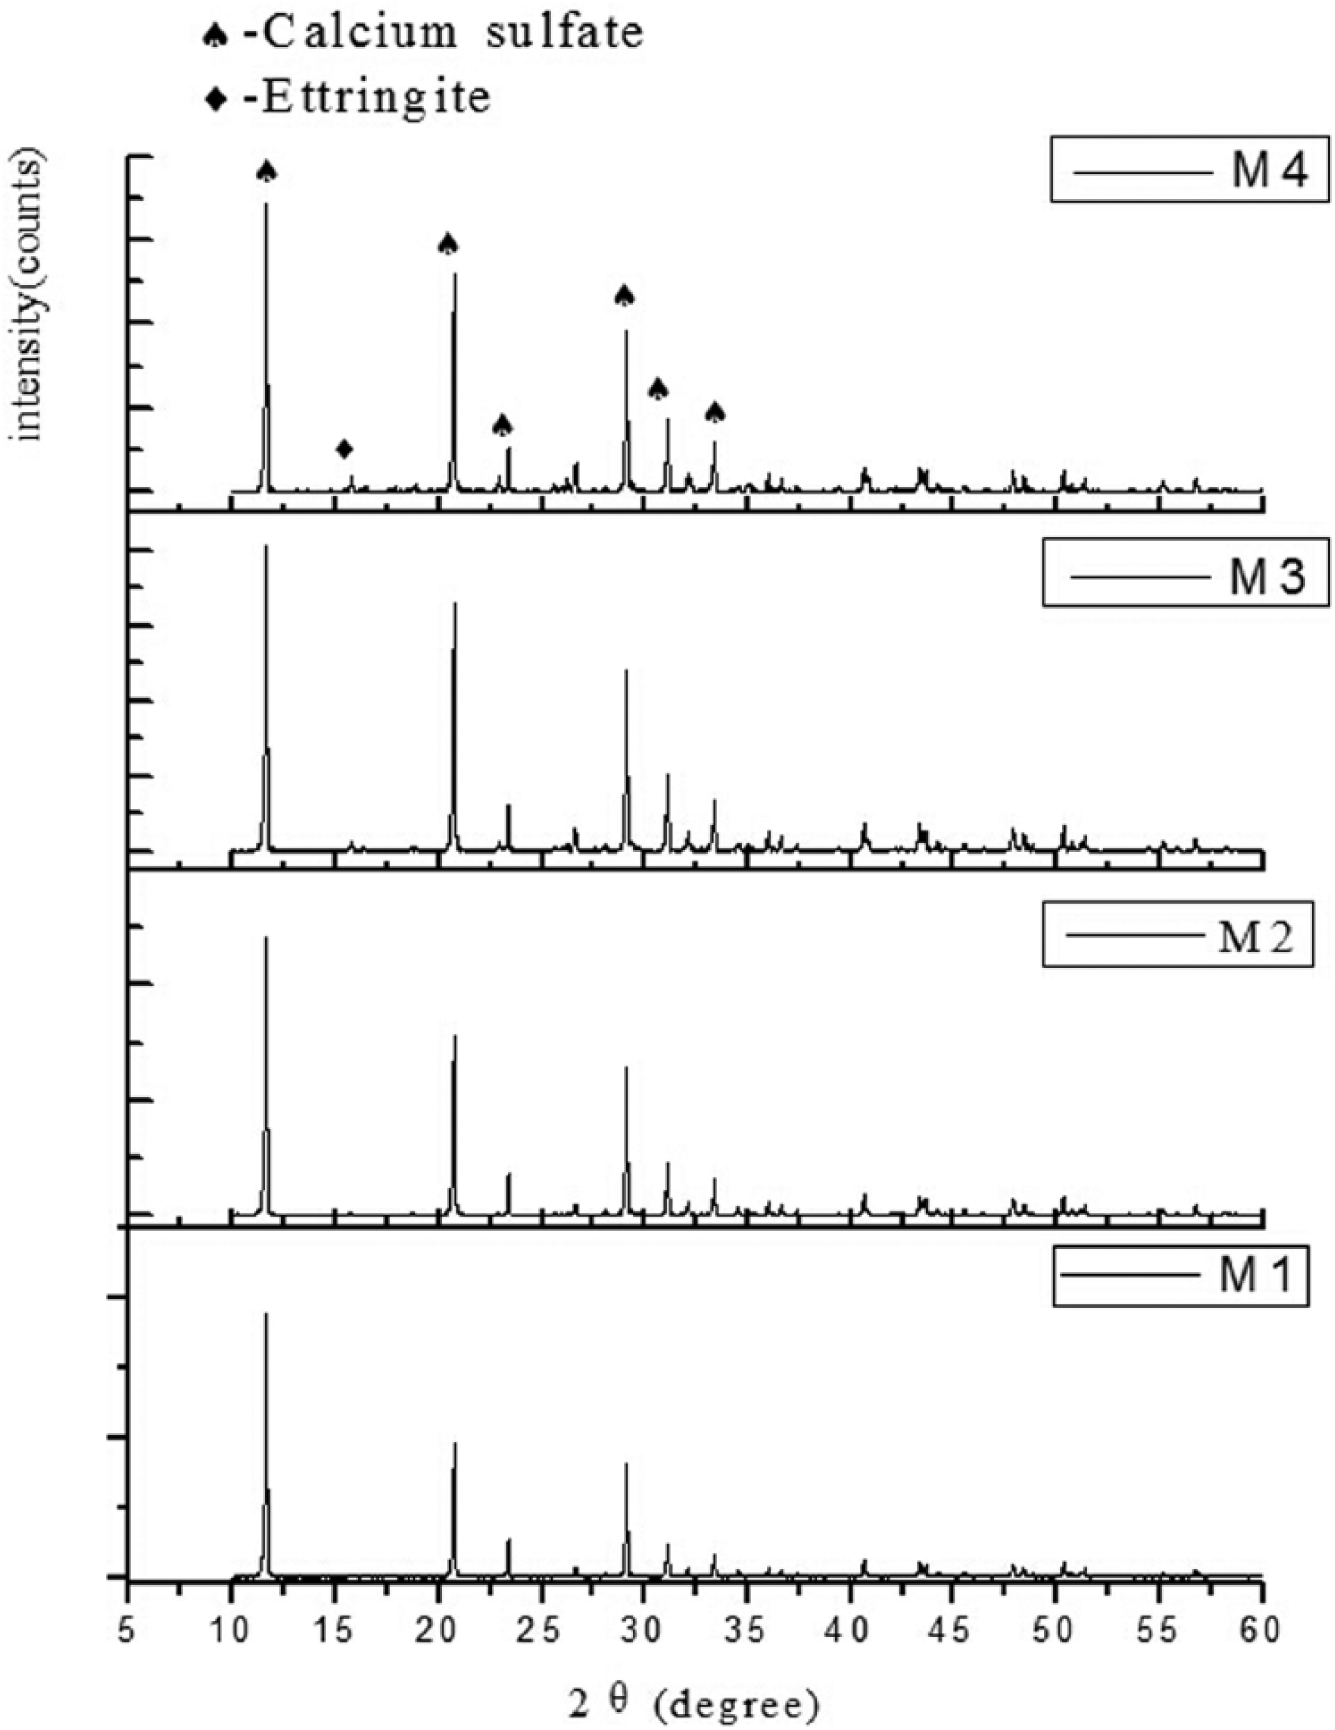
XRD images of the PFL material.
Considering the results of softening coefficiency and compressive strength, the fly ash and lime content should be in the range 20–30%.
Influences of retarders on PFL
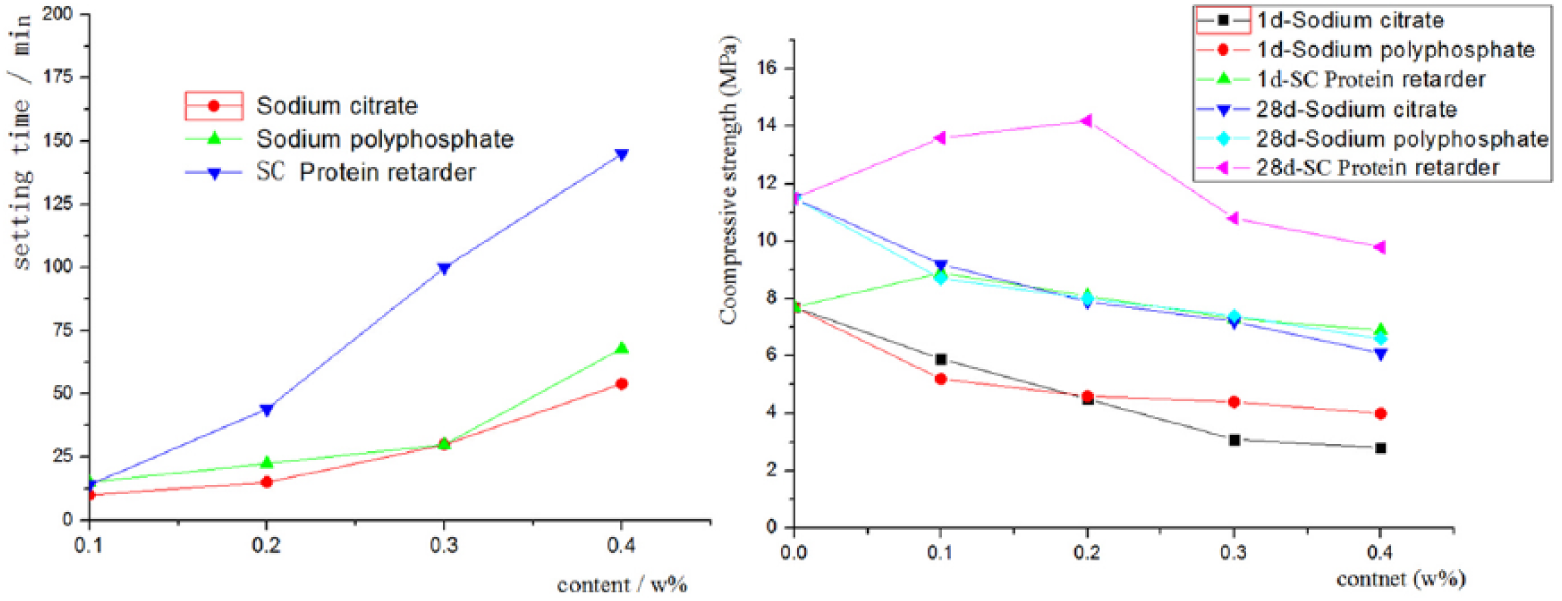
Figure 5 shows the setting time and compressive strength of specimens mixed with different retarders and Figure 6 shows the SEM picture of specimens with different retarders: sodium citrate, sodium polyphosphate, and SC protein retarder.
Setting time and compressive strength of PFL specimens mixed with variable retarders.
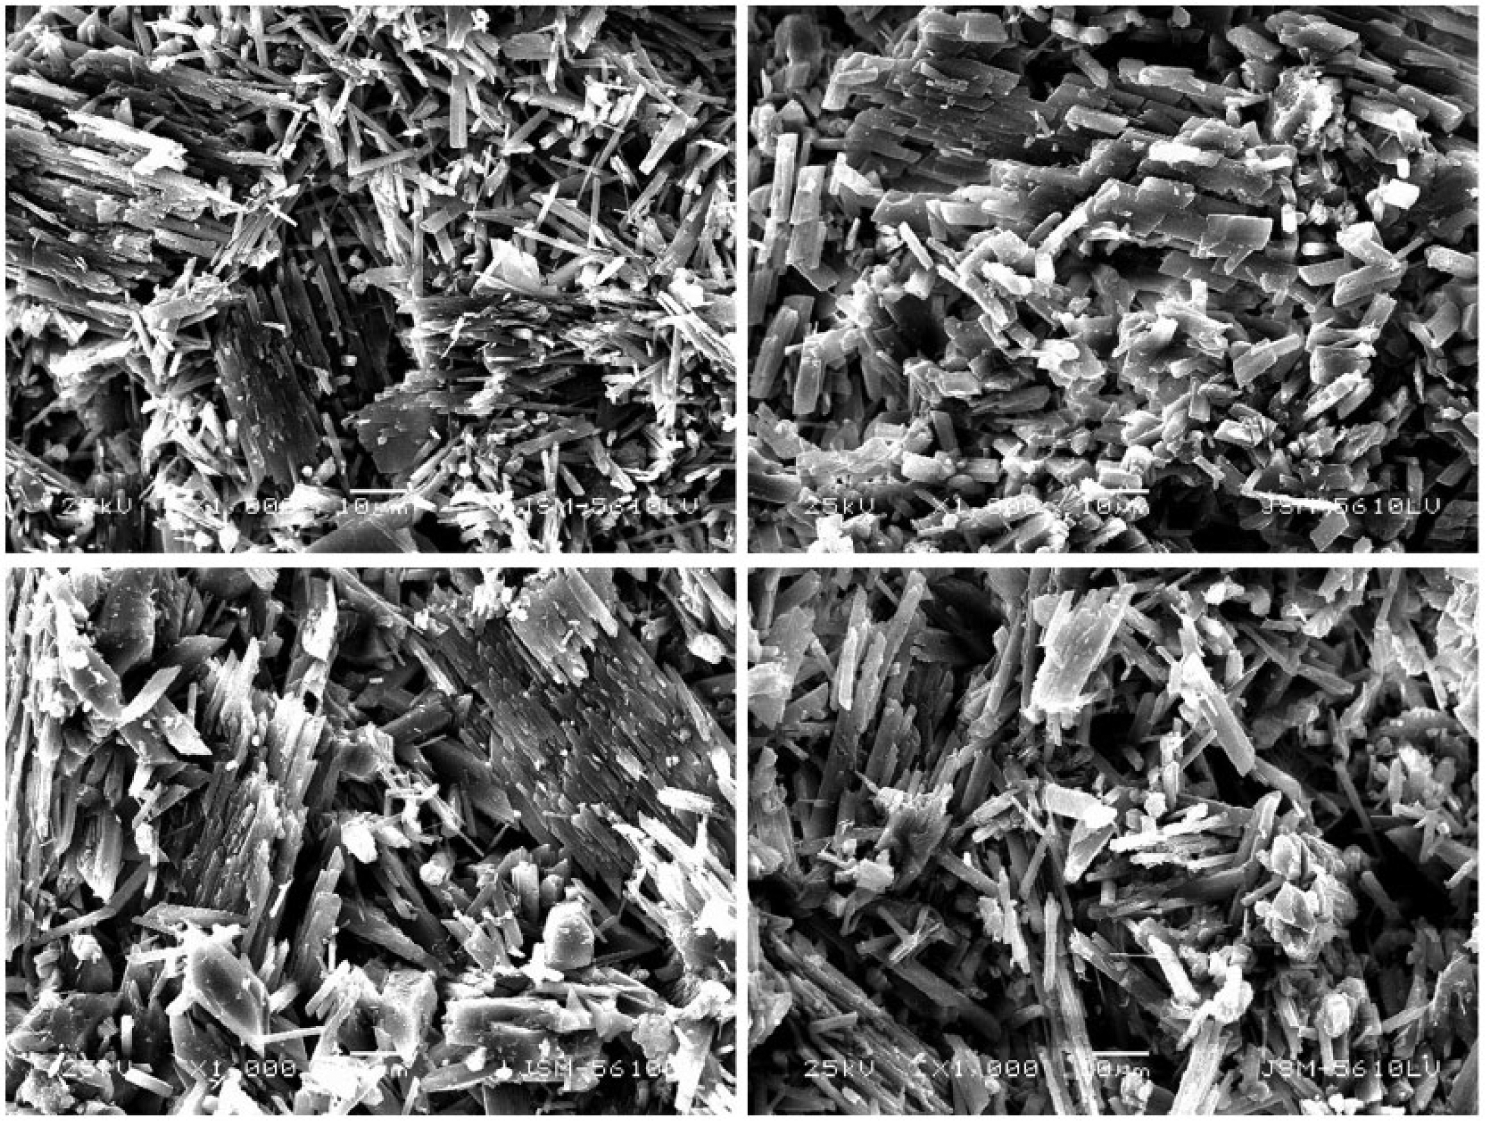
SEM analysis of PFL specimens mixed with variable retarders: (a) no retarder, (b) with 0.4% sodium citrate, (c) with 0.4% sodium polyphosphate, (d) with 0.4% SC protein retarder.
The three different retarders had the effect of delaying hydration, but the efficiency differed. Sodium citrate could extend the setting time of PFL, while the efficiency and compressive strength was the worst among them almost. Sodium citrate greatly reduced the strength, which is similar to the results of Camarini and colleagues. 24 The retarding mechanism of sodium polyphosphate mainly relies on the reduced binder dissolution rate and inhibition of the growth of dihydrate crystals. 25 The reduction in compressive strength of specimens mixed with sodium polyphosphate was significant compared to SC protein retarder. The protein retarder could combine with calcium ions on the surface of dihydrate gypsum crystals and formed a chemisorbent layer, thus inhibiting the growth of the crystal nuclei of dihydrate gypsum. 26 This had no negative effect on the dissolution rate of the binder, which may be why the compressive strength of PFL with SC protein retarder only suffered minimal reduction.
Considering the above results, SC protein retarder was used in this application and the dosage located in the range 0.2–0.3% for cementitious materials to meet the requirements of setting time ≥40 min.
Influences of superplasticizers on PFL
To meet the flow performance requirement of cast-in-situ wall, which require a flow value controlled at about 200 ± 20 mm, two kinds of superplasticizers were investigated. It was shown that the compressive strength decreased slightly after increasing, and the ratio of water to cementing material (W/C) was diminished with increased superplasticizer dosage (Figure 7). The compressive strength of specimens with melamine was higher than that of naphthalene. The water demand for the standard flow of the mixture with melamine was less than that of naphthalene.
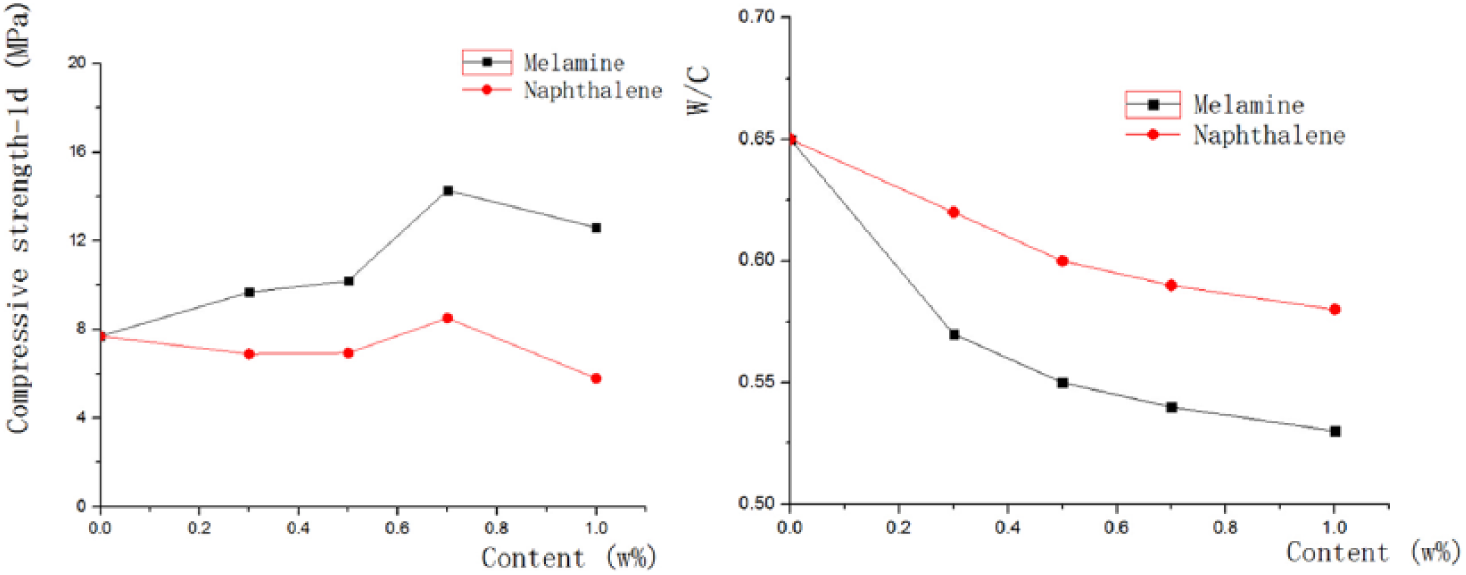
Compressive strength and W/C in standard flow value (180 mm) of mixture with different superplasticizers.
The adsorption of naphthalene in gypsum was physical adsorption, and the saturated adsorbed amount reached 12.67 mg/g; the adsorption is not stable. 27 The adsorption of melamine was chemical adsorption, which adsorbed on the gypsum surface in the form of monolayers under the influence of electronegativity of the functional ion groups. 28 This might be the reason that the compressive strength of naphthalene was lower compared to melamine. The water-reducing efficiency for plaster reaches a maximum of 20% at 1.0 w% melamine and 12.3% at 1.0 w% naphthalene; melamine was preferable. To meet the requirement of casting, the dosage of 0.7 w% melamine was optimal in this application.
Influences of vitrified microsphere
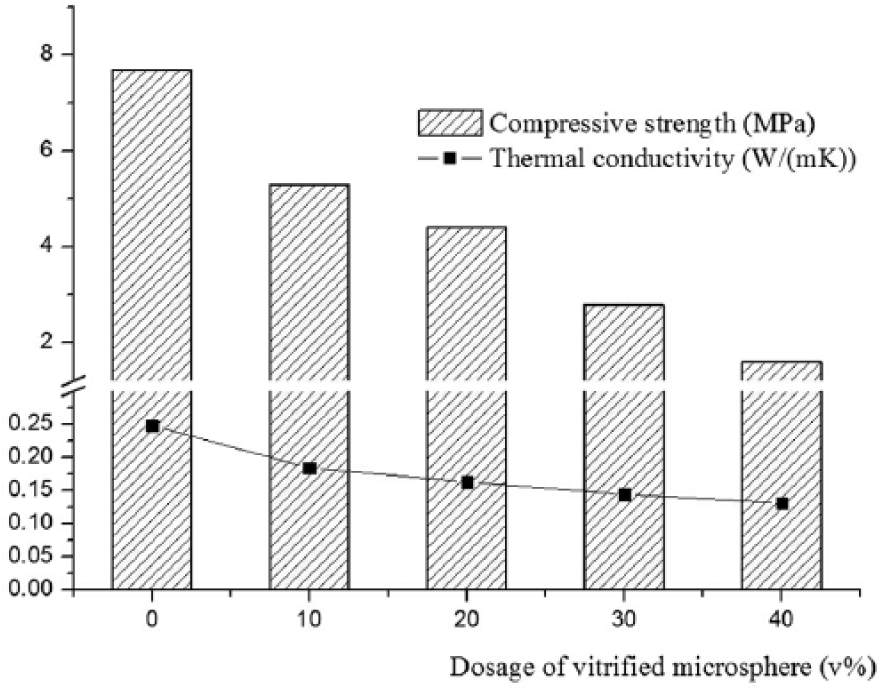
Vitrified microspheres (VM) were used as aggregates in the mortar to improve heat transfer properties. The thermal conductivity was clearly reduced with the increase of VM content, while the compressive strength was not ideal. 29
Figure 8 shows the compressive strength and thermal conductivity with variable vitrified microsphere content. Thermal conductivity was reduced by 47.3% and the compressive strength was reduced by 85.7% at 40 v% VM to paste. VM affected the mechanical properties of the mortars due to the hollow structure; this is also the reason for the thermal conductivity reduction. Further, the water demand of mortars increased with raised VM dosages, which is another reason for the reduction in strength.
Compressive strength and thermal conductivity with vitrified microsphere.
The thermal conductivity requirement of wall materials is ≤0.2 W/(m K) in green buildings. The thermal conductivity of raw plaster is 0.248 W/(m K). There were 0.184 W/(m K) and 0.163 W/(m K) mortars at 10 v% and 20 v% VM, respectively. Considering the results of thermal conductivity and compressive strength, the dosage of VM should be located in the range 10–20 v% for cast-in-situ wall applications.
Thermal insulation test
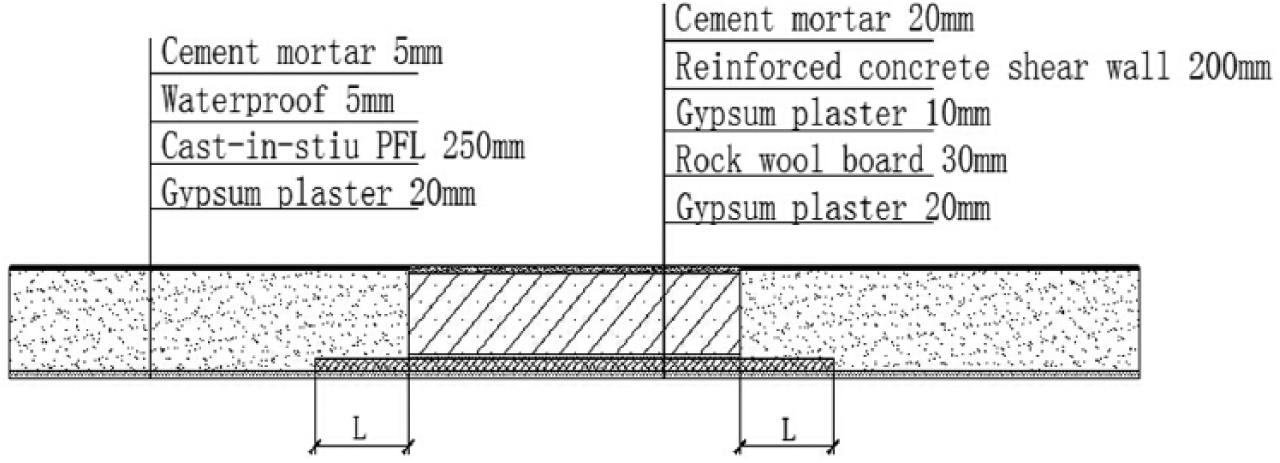
To compare the thermal insulation properties of materials, a traditional structure and an optimized structure were designed. The schematic diagram of the traditional structure and optimized structure were given in Figures 9 and 10. Filler walls and shear walls were designed in each part to explore the thermal properties of the composite structure.
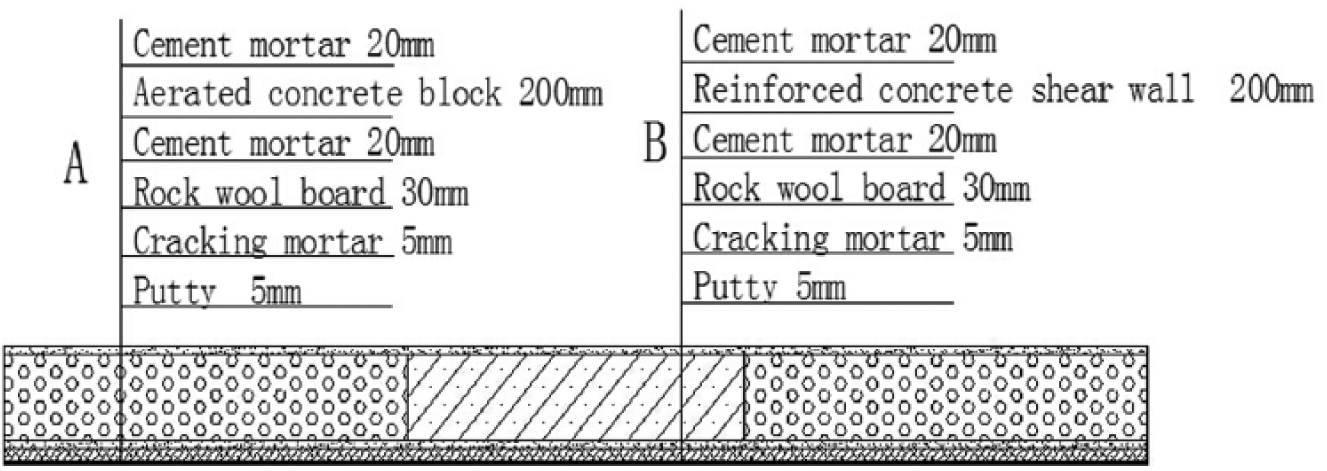
Structure of traditional walls for the thermal insulation test.
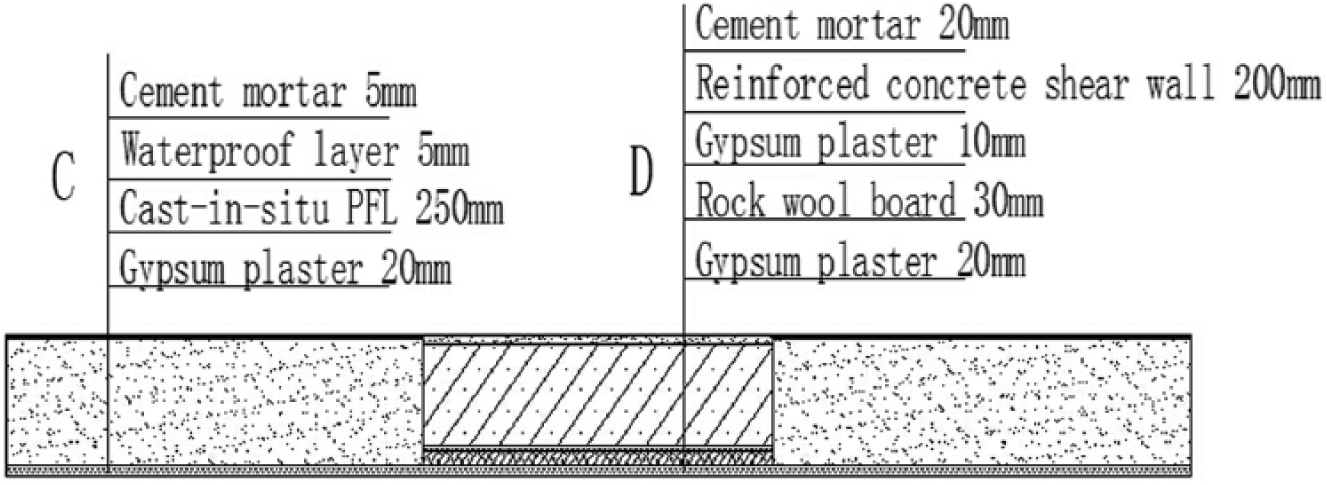
Structure of optimized walls for the thermal insulation test.
The calculation for the heat transfer coefficient is as follows:

where K is the heat transfer coefficient (W/(m2K)); Tni is the warm-side ambient temperature (K); Tne is the cold-side ambient temperature (K); Q is the heat flow through the specimen (W); and A is the heat transfer area (m2).
The prerequisites of K are Tni and Tne, which could be obtained through weighted calculation of surface temperature, ambient temperature, and average radiation temperature. Calculation of Tni and Tne are as follows:
where Tni is the warm-side ambient temperature (K); Tne is the cold-side ambient temperature (K); Tsai is the air temperature of the warm end (K); Tsae is the air temperature of the cold end (K); Tmi is the average radiation temperature of the warm end (K); Tme is the average radiation temperature of the cold end (K); Tsis is the surface temperature of the warm end (K); Tses is the surface temperature of the cold end (K); hi is the radiation heat transfer coefficient of the warm end (W/(m2K)); he is the radiation heat transfer coefficient of the cold end (W/(m2K)); and ε is the radiance, which was 0.85 in this test.
The h above could be obtained by calculating:

where h is the radiation heat transfer coefficient (W/(m2K)); σ is the Stefan–Boltzmann constant, 5.67 × 10⁻⁸ (W/(m2K4)); and Tm is the average radiation temperature (K).
K could be calculated through the measured Q, Tni, and Tne.
Table 3 shows the stability values of temperature and heat flow during tests. The calculation and analysis were carried out for the filler wall of the conventional structure. The stability values of Tsis, Tses, Tsai, Tsae, Tmi, Tme, Tjis, and Tjes were 299.40 K, 265.99 K, 302.89 K, 262.97 K, 301.24 K, 264.00 K, 303.20 K, and 303.20 K respectively, and the Qp was 33.98 W. It could be observed that the values of Tsai and Tmi were all greater than the value of Tsis; the values of Tsae and Tme were all greater than the value of Tses. This illustrates that most of the heat flow transfers from the hot end to the cold end, and a small part is lost from the metering box.
Stability value of temperature and heat flow.
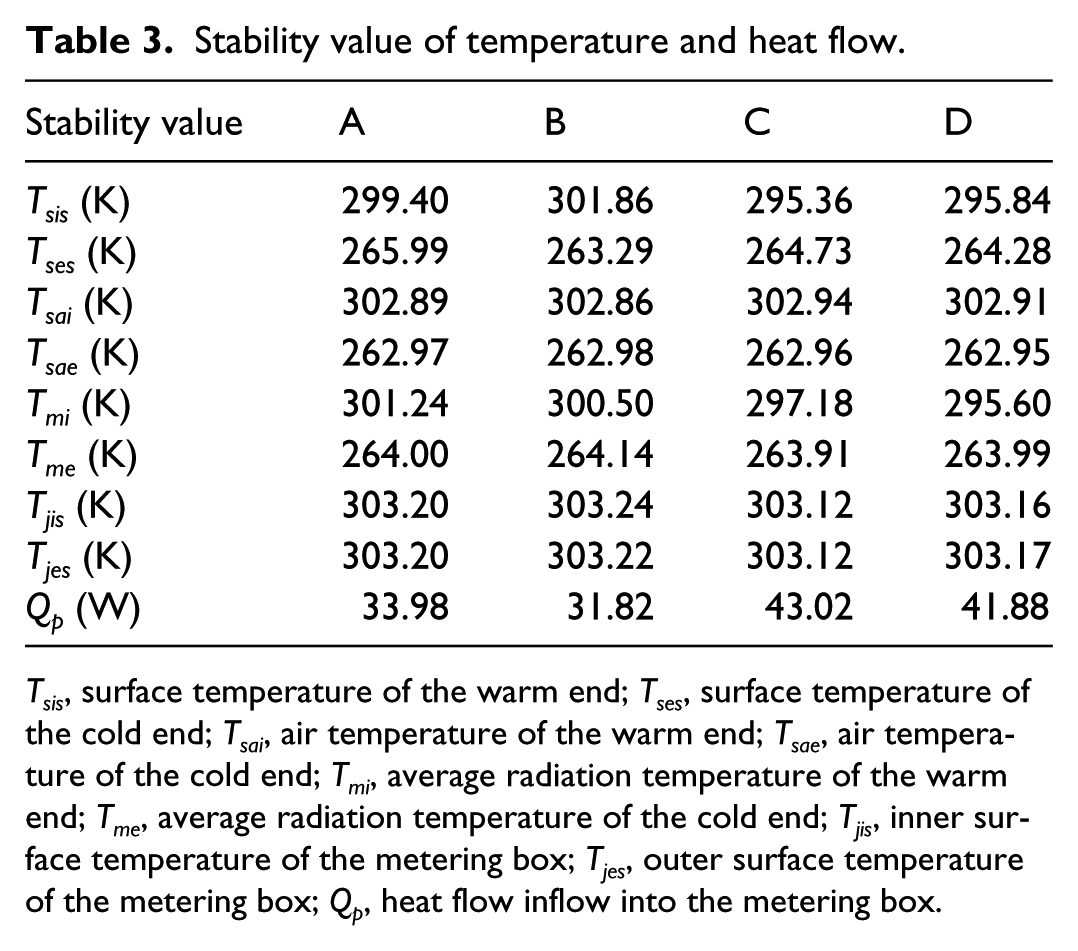
Tsis, surface temperature of the warm end; Tses, surface temperature of the cold end; Tsai, air temperature of the warm end; Tsae, air temperature of the cold end; Tmi, average radiation temperature of the warm end; Tme, average radiation temperature of the cold end; Tjis, inner surface temperature of the metering box; Tjes, outer surface temperature of the metering box; Qp, heat flow inflow into the metering box.
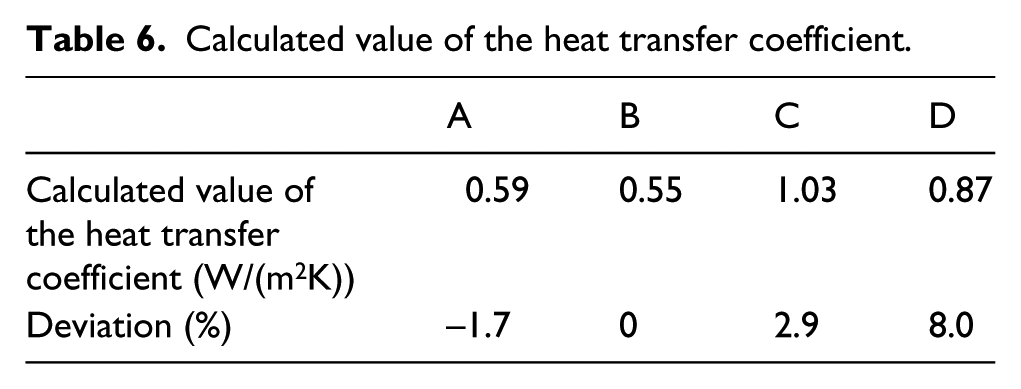
According to the above calculation method, the values of heat transfer coefficient of each groups were obtained and are given in Table 4. It can be seen that the value of the heat transfer coefficient of C was 0.55 W/(m2K), reduced by 5.2% compared to A. The value of the heat transfer coefficient of D was 0.94 W/(m2K), reduced by 11.3% compared to B. The insulation performance was improved for the filler wall and shear wall under the same thickness condition.
Test value of heat transfer coefficient.
Heat channel analysis
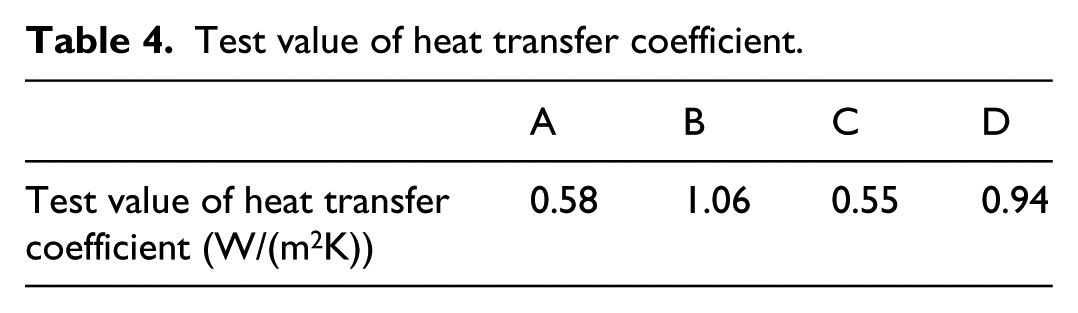
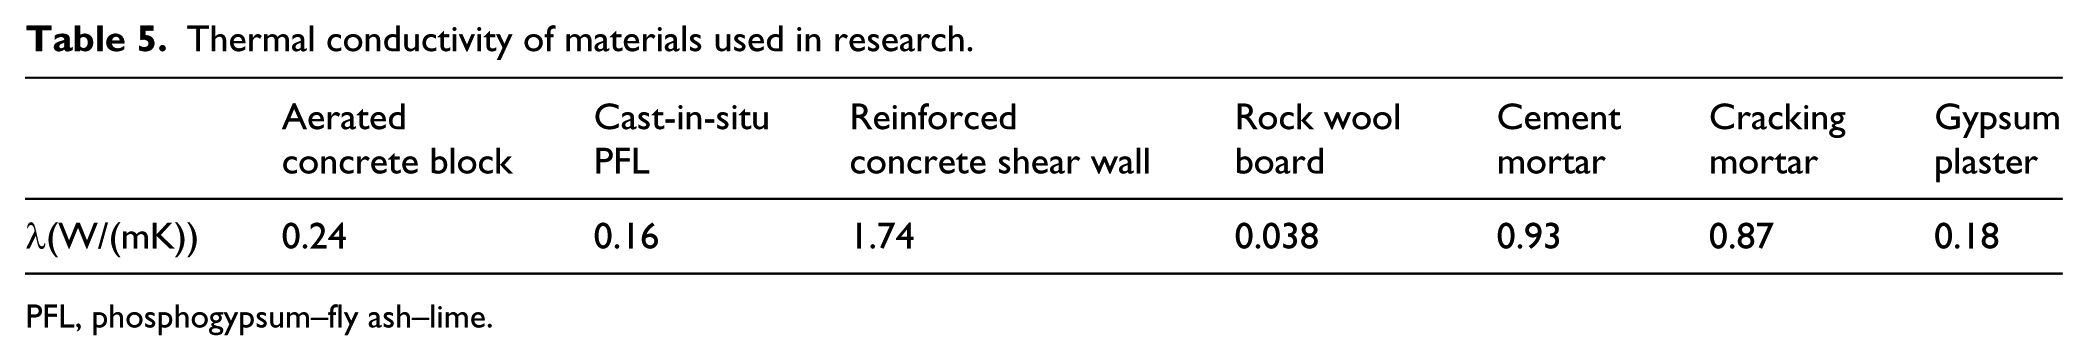
ANSYS was used to model the specimen. The size of the model was same as the specimens. The thermal conductivity of materials given in Table 5 was used. The finite element mesh size is 0.02 m. Because the model is symmetrical, half of the model was analyzed. The temperature and heat flux density of each structure could be obtained and are shown in Figures 11 and 12.
Thermal conductivity of materials used in research.
PFL, phosphogypsum–fly ash–lime.
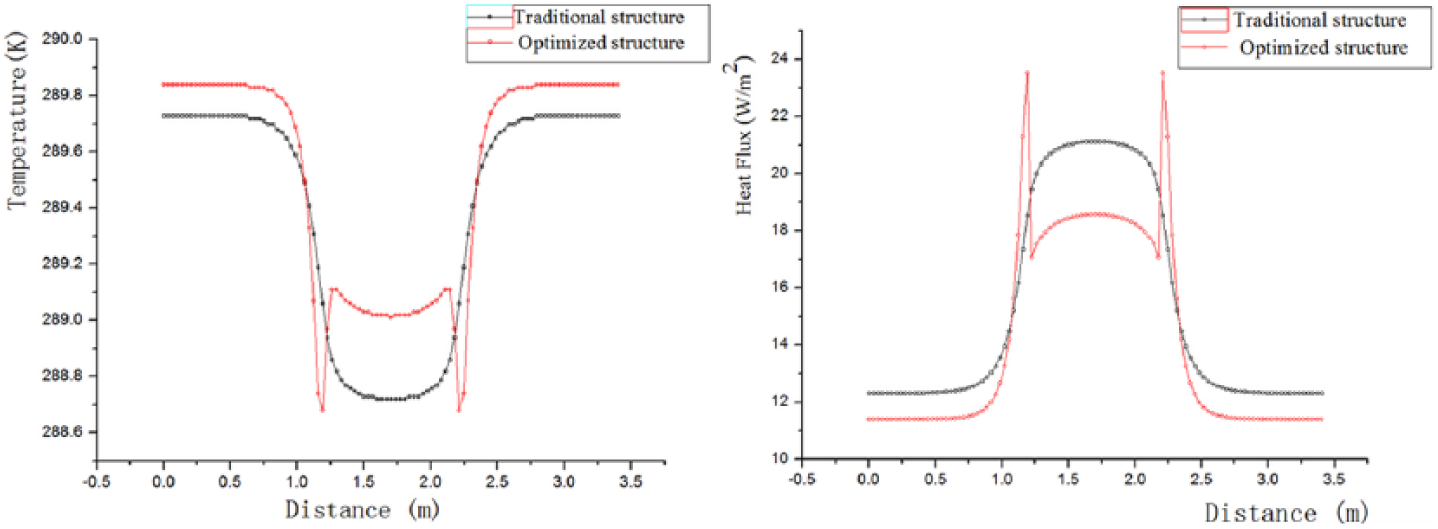
Temperature and heat flux density of the traditional structure.
Temperature and heat flux density of the optimized structure.
In Figure 13, the length of the combination structure is shown on the x-axis; the temperature and heat flux density are shown on the y-axis and take the leftmost point of the inner surface as the origin of the coordinates. The curves of temperature and heat flux density of each combination structure were established and are shown in Figure 13.
Temperature curve and heat flux density curve.
Compared to a traditional structure, the trends of temperature curves of the optimized structure were basically the same. The inner surface temperature of the traditional structure shear wall was 15.6 °C, that of the filler wall was 16.6 °C. The inner surface temperature of the optimized structure shear wall and filler wall were 15.9 °C and 16.6 °C, respective increases of 0.3 °C and 0.1 °C compared to the traditional structure. It was illustrated that the insulation performance was improved. There were sharp peaks at the junction of the shear wall and filler wall in the temperature curve, indicating that the insulation performance changes at the junction. The heat flux density curve corresponded to the change trend of the inner surface temperature curve; the heat flux density was small where the surface temperature was high and vice versa.
The calculated value of the heat transfer coefficient simulation was listed and the deviations compared to the test value of the heat transfer coefficient, which are shown in Table 6. It can be seen that the deviations between the test value and calculated value are less than 10%, which indicates that the accuracy of the tests is credible.
Calculated value of the heat transfer coefficient.
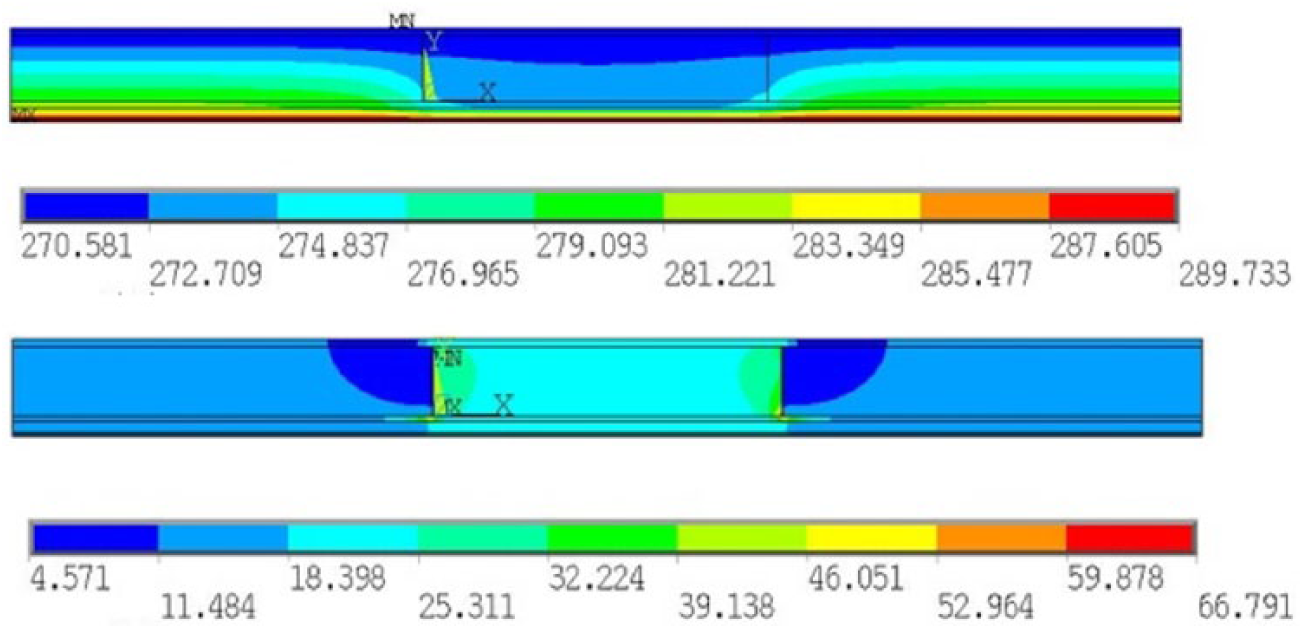
The sharp peak in the temperature curve indicates the existence of an insulation performance junction. It can be seen that the heat channel length of the shear wall–filler wall join was 280 mm in the simulation calculation. To optimize the structure better, the length of the insulation board was extended. As shown in Figure 14, the value of L was 280 mm.
Structure of the extended walls.
The temperature curve and heat flux density curve in Figure 15 show that the minimal value of the inner surface temperature was 15.9 °C in the extended structure wall, an increase of 0.3 °C compared to the optimized structure. The maximum value of the heat flux density in the extended structure was 15.7 W/m2, which decreased by 7.9 W/m2 compared to the optimized structure. The insulation performance was optimized again in the extended structure wall. There still exist peaks of temperature and heat flux density in Figure 16; these peaks indicating temperature rises and heat flux decrease, which was helpful for insulation.
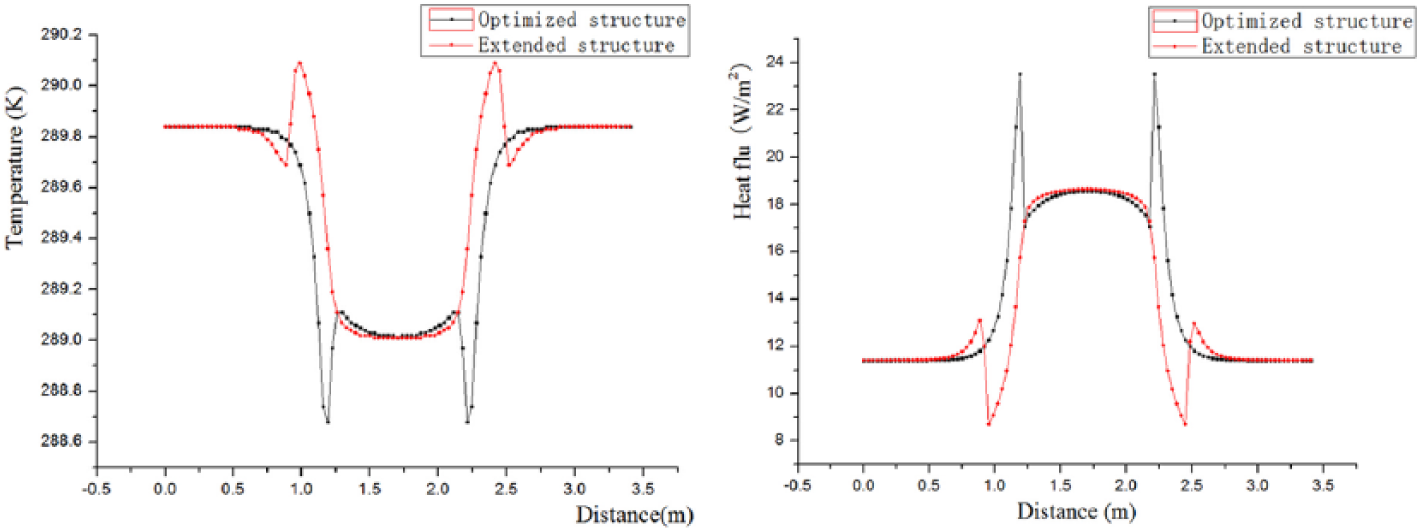
Temperature curve and heat flux density curve of the extended structure.
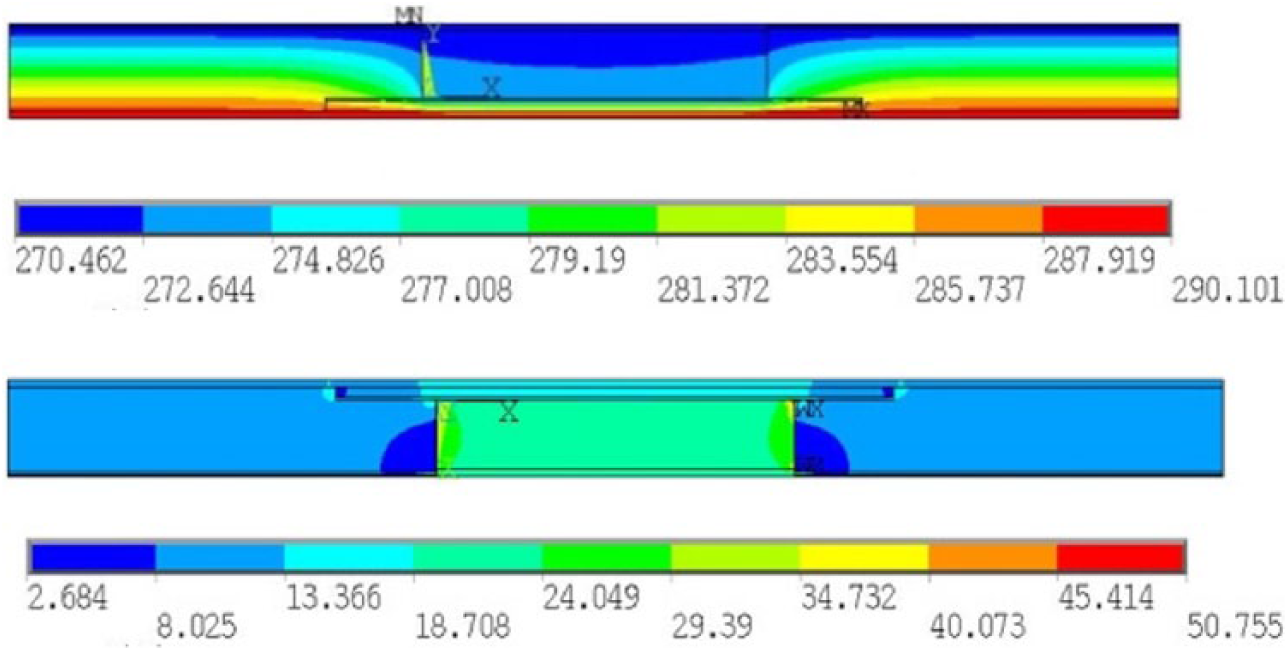
Temperature and heat flux density of the extended structure.
Theoretical analysis
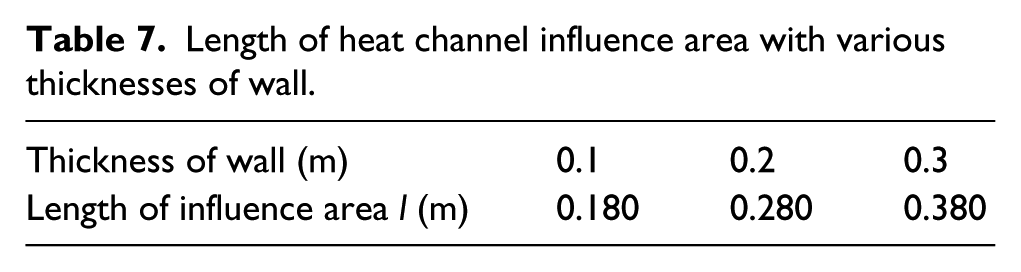
To find the optimal extended length of thermal insulation board, the influence of each factor (thickness of wall, thermal conductivity of cast-in-situ PFL, and thermal insulation board) on heat channel area were studied.
Influences of thickness of wall on heat channel area
We using the above model and the thermal conductivity value of cast-in-situ PFL at 0.16 W/(mK). Rock wool board was selected as the thermal insulation board. The values of thickness of the wall were 0.1 m, 0.2 m, and 0.3 m. The results of the finite element analysis are shown in Table 7.
Length of heat channel influence area with various thicknesses of wall.
Influences of thermal conductivity of cast-in-situ PFL on heat channel area
We using the above model and the thickness of wall at 0.2 m. Rockwool board was selected as the thermal insulation board. The values of thermal conductivity of cast-in-situ PFL were 0.14 W/(mK), 0.16 W/(mK), and 0.18 W/(mK) respectively. The results of the finite element analysis are shown in Table 8.
Length of heat channel influence area with various thermal conductivities of cast-in-situ PFL.
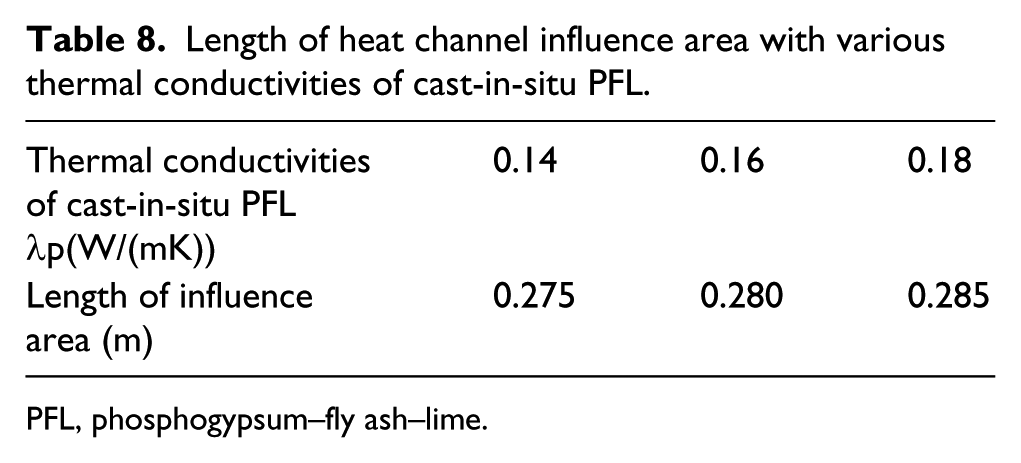
PFL, phosphogypsum–fly ash–lime.
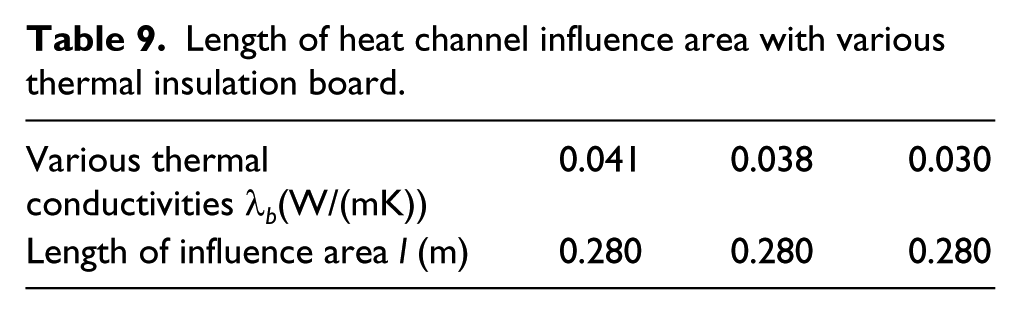
Influences of thermal conductivity of thermal insulation board on heat channel area
We use the above model and the thickness of wall at 0.2 m. The thermal conductivity value of cast-in-situ PFL was 0.16 W/(mK). The thermal insulation board included ESP board, rockwool board, and XPS board; the thermal conductivities were 0.041 W/(mK), 0.038 W/(mK), and 0.030 W/(mK) respectively. The results of the finite element analysis are shown in Table 9. It can be seen that thermal conductivity of thermal insulation board has no influence on heat channel area within this range.
Length of heat channel influence area with various thermal insulation board.
From the above analysis, it can be seen that the length of the heat channel influence area is affected by the thermal conductivity of the thermal insulation board and thickness of the wall. The results of the finite element analysis of the above factors are given in Table 10.
Length of heat channel influence area with various factors.
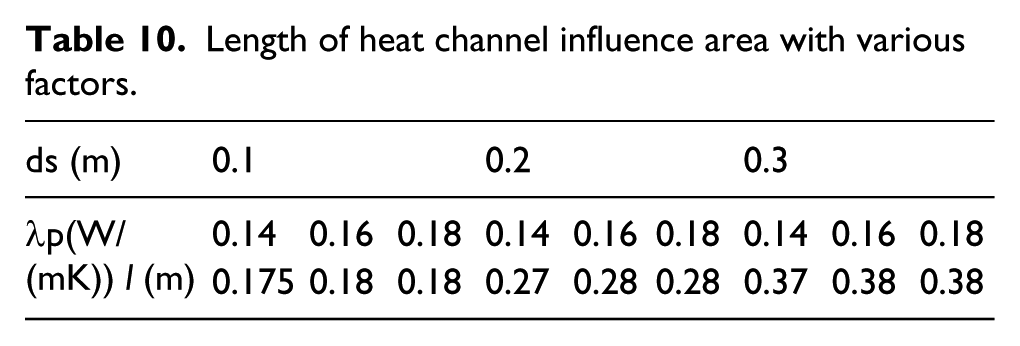
To fit the above result, the relationship between heat channel influence area and each factor is as follows:
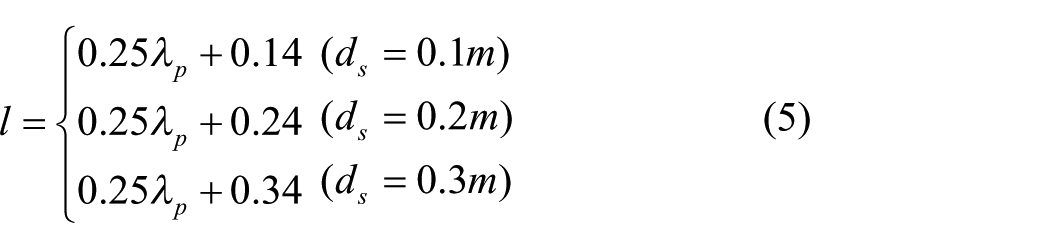
This can be simplified as:

The value range of c was 0.14, 0.24, 0.34, which depended on the thickness of the wall.
Conclusion
The preparation of cast-in-situ phosphogypsum wall was studied. Mixing with fly ash and lime improved the performance in terms of water resistance, but the compressive strength was adversely affected. SC protein retarder can adjust the setting time of PFL and the compressive strength is only slightly affected. Melamine could improve the compressive strength and reduce the water demand of PFL. Using VMs as aggregates could improve the thermal conductivity of the mortar, but the compressive strength is adversely affected. To satisfy the requirement of performance and operations of cast-in-situ phosphogypsum wall, the optimum mix is: calcined phosphogypsum 70 w%, fly ash 22.5%, lime 7.5%, SC protein retarder 0.2 w%, melamine superplasticizer 0.7 w%, and vitrified microsphere 20 v%.
The thermal insulation performance of cast-in-situ phosphogypsum wall was studied. Cast-in-situ phosphogypsum could meet the thermal insulation requirements of walling materials. The optimized structure and extended structure could improve the thermal insulation performance of walls, and the extended structure showed the best performance in this series. The extended length could be identified by a fitting formula.
Footnotes
Declaration of Conflicting Interests
The author(s) declared no potential conflicts of interest with respect to the research, authorship, and/or publication of this article.
Funding
The author(s) disclosed receipt of the following financial support for the research, authorship, and/or publication of this article: The work was supported by the “Research on preparation and application of high performance functional phosphogypsum material” (CXZD2017000110) (major innovation projects of Hubei Province) plan and “Crane meritocrat (urban construction) plan” (20161j0013).