
Abstract
Background:
Magnesium (Mg)-based alloys are considered to be promising materials for implant application due to their excellent biocompatibility, biodegradability, and mechanical properties close to bone. However, low corrosion resistance and fast degradation are limiting their application. Mg–Ca alloys have huge potential owing to a similar density to bone, good corrosion resistance, and as Mg is essential for Ca incorporation into bone. The objective of the present work is to determine the in vitro degradation and in vivo performance of binary Mg–xCa alloy (x = 0.5 or 5.0 wt%) to assess its usability for degradable implant applications.
Methods:
Microstructural evolutions for Mg–xCa alloys were characterized by optical, SEM, EDX, and XRD. In vitro degradation tests were conducted via immersion test in phosphate buffer saline solution. In vivo performance in terms of interface, biocompatibility, and biodegradability of Mg–xCa alloys was examined by implanting samples into rabbit femoral condyle for 2 and 4 weeks.
Results:
Microstructural results showed the enhancement in intermetallic Mg2Ca phase with increase in Ca content. Immersion tests revealed that the dissolution rate varies linearly, with Ca content exhibiting more hydrogen gas evolution, increased pH, and higher degradation for Mg–5.0Ca alloy. In vivo studies showed good biocompatibility with enhanced bone formation for Mg–0.5Ca after 4 weeks of implantation compared with Mg–5.0Ca alloy. Higher initial corrosion rate with prolonged inflammation and rapid degradation was noticed in Mg–5.0Ca compared with Mg–0.5Ca alloy.
Conclusions:
The results suggest that Mg–0.5Ca alloy could be used as a temporary biodegradable implant material for clinical applications owing to its controlled in vivo degradation, reduced inflammation, and high bone-formation capability.
Introduction
Applications of biomaterial-based implant systems have revolutionized treatment methods for damaged or diseased bone. The choice of material for orthopedic implantation is limited largely by biocompatibility, osteoconductivity, optimal biodegradation, mechanical strength, and stability.1,2 Magnesium (Mg), and its alloys, is good candidate for use as a temporary metallic implants owing to its osteoconductive, biodegradable, and resorbable properties. Its elastic modulus, compressive yield strength, and density values are also similar to those of natural bone. However, it encounters severe corrosion, and increase in pH and hydrogen development at the vicinity of the implant, which limits its applications.3–5 Several Mg-based alloy systems, such as AZ31, AZ91D, WE43, LAE442 etc.,6,7 have received attention due to their biocompatibility and long in vivo stability. However, there is always a risk of problems associated with the alloying element’s noncompliance in a living system.8,9 This has led to the development of alloy systems focusing on biological application without causing metal ion-induced toxicity.
Mg–Ca alloy is the most suitable alloy system made of elements that constitute the mineral phase of bone. Calcium (Ca), being the primary constituent in human bone and relatively inexpensive, is a favorable alloying element for Mg alloys. Also, the density of Ca (1.55 g/cm3) is close to Mg (1.74 g/cm3), which will retain its characteristics.10 –12 Therefore, the Mg–Ca binary alloy system fabricated by various processing techniques has attracted considerable attention among researchers.10,12–19 However, most of the studies have focused on microstructure, mechanical, or in vitro corrosion behavior using stimulated biological fluid (SBF) or Hank’s solution.10–13,19,20 There are many issues that prevent the use of such an alloy system in practical bone implant design. The rapid generation of hydrogen gas along with relatively higher degradation rate when exposed to body fluid can cause problems fatal to the patient.3,21 Hence, the controlled release of Mg alloy in vivo is still an extreme challenge for its active use as biodegradable implants. In vivo studies on the Mg–Ca system are fewer, and primarily report the Mg–Ca (0.8 or 1 wt% Ca) system to date.10,15 Due to the lack of correlation of in vitro and in vivo degradation studies, there is still a need to describe the influence of Ca alloying in Mg to ensure its effectiveness for implant applications.
In the present approach, the in vitro degradation behavior and the in vivo biological performance of Mg–xCa (x = 0.5 or 5.0 wt%) alloy systems are simultaneously investigated. The aim is to demonstrate the in vitro degradation model in phosphate buffer saline (PBS) solution and the in vivo environment at the implantation sites in a rabbit model. In addition, the microstructural evolution, phase structure, and chemical composition of Mg–xCa alloys were examined.
Methods
Alloy preparation
Commercial grade pure Mg ingot (99.8%, Dead Sea Magnesium Ltd., Israel) and pure Ca granule (99.5%, Anyang Metallurgical Materials Co. Ltd, China) were used as precursor materials for the preparation of Mg–Ca alloys. The Mg ingot was melted at 700°C in a graphite crucible using an induction furnace (Jeon Jin Co. Ltd, Korea) in an argon atmosphere. After addition of Ca to the molten metal, mechanical stirring was done with subsequent holding for 15 min. Metal casting was done in a mild steel mold through MgO ceramic foam filter. Four different alloys were made (0.5, 1.6, 3.8, and 5 wt% Ca), with Mg making the balance. The alloys are designated as Mg–0.5Ca, Mg–1.6Ca, Mg–3.8Ca, and Mg–5.0Ca in the following sections.
Sample preparation
Rectangular samples (8 × 3 × 2 mm) were prepared from as-cast alloy blocks for each of the four alloy systems. All samples were polished using SiC papers (up to 1200 grit), degreased with acetone for 10 min followed by rinsing with distilled water, and dried in air. The samples were further polished with 3 µm to 0.25 µm diamond paste. Etching solution was then prepared by mixing picric acid (4.2 g) in a solution made of distilled water (10 ml), acetic acid (10 ml), and ethanol (70 ml). All etching reagents were procured from Merck, Germany. Trends in characteristics were obviously related to compositional changes. Only two extreme ends of the alloy system (i.e. Mg–0.5Ca and Mg–5.0Ca) were mainly employed for all characterizations except for the in vitro degradation test.
Surface characterization
The microstructural and morphological features of the Mg–Ca alloys were investigated using optical (Olympus BX51M, USA) and scanning electron microscopy (SEM) (JSM-635F, JEOL, Tokyo, Japan), respectively. The chemical composition of alloys was analyzed by energy-dispersive X-ray spectroscopy (EDX) (Oxford Instruments, UK) equipped with SEM. Phases present in the Mg–Ca alloys before and after degradation were determined using X-ray diffraction (XRD) (D/MAX-250, Rigaku, Japan) with CuKα radiation. Diffraction patterns were recorded between 2θ values ranging from 20° to 60° with a scanning speed of 2°/min.
In vitro degradation test
Hydrogen evolution and pH change
Each set of Mg–0.5Ca and Mg–5.0Ca samples was maintained in 50 mm graduated tubes filled with PBS (Amresco, Korea, pH 7.4) solution and stored upside down to allow any gas that evolved to remain at the top. These tubes were clamped in a PBS jar to protect them from air entrainment and placed at 37°C. The solution level inside the tube was measured intermittently for 24 h. Gas evolution measurements were recorded for each sample in triplicate. Each sample set was kept inside a 15 ml tube containing PBS solution. The pH of the solution was measured with a pH meter (Thermo Scientific, Korea) for 72 h. PBS solutions were replaced by fresh ones after 12 h during the whole immersion period. A mean of three readings was considered for each sample.
Immersion test
To determine material stability of the Mg–Ca alloys in an aqueous environment, samples were immersed in PBS solution for 24 h. Mg–0.5Ca and Mg–5.0Ca samples were immersed in 20 ml of PBS solution. The temperature was maintained at 37±0.5°C during the test. The immersed samples were washed gently with deionized water, and air dried prior to further characterization. The change in surface morphology, chemical composition, and phase analysis of each sample after degradation was evaluated by SEM, EDX, and XRD, respectively.
In vivo test
Implantation of Mg alloy into rabbit femur
New Zealand white rabbits were employed for in vivo implantation of Mg–0.5Ca and Mg–5.0 Ca samples. The protocol for the care and use of laboratory animals was approved by the Animal Ethical Committee of Soonchunhyang University, South Korea and duly observed (SCH 16-0014). Three rabbits were used for each sample. Two time intervals (2 weeks and 4 weeks after implantation) were chosen for in vivo studies. Rabbits (weight: 3 kg) were housed individually in stainless-steel cages. Anesthesia was induced in rabbits at 5.0% isoflurane and oxygen flow rate of 800 ml/min using an induction chamber connected to an isoflurane vaporizer (Harvard apparatus, USA). Upon complete loss of consciousness and righting reflex, the surgical site along the lateral area of the rabbit’s right knee was shaved, cleaned with 70% ethanol, and disinfected with povidone-iodine solution. A 3–4 cm full thickness skin incision was made along the lateral surface of the knee joint to expose the underlying joint tissues. A small incision measuring 1–1.5 cm was made on the exposed ligament to reveal the lateral epicondyle of the distal femoral epiphysis. Using an 8.0 mm diameter trephine drill, an 8.0mm diameter by 3.0 mm deep defect was created on the femoral condyle. Similar sized Mg alloy plates containing either 0.5 wt% Ca or 5.0 wt% Ca were then placed in individual the defects. Surgical incision on ligament and skin was then repositioned and closed using sutures. Tramadol was given orally for pain management and Baytril antibiotic (Bayer Korea) was injected intramuscularly as a prophylactic. After 2 and 4 weeks, rabbits were sacrificed via isoflurane induction and air embolism. Implanted Mg alloy plates were then extracted from the surgical sites and fixed in 10% formalin prior to micro-CT scanning and histological preparation.
Micro-CT and histological analysis
Extracted tissue samples were scanned with Skyscan 1076 micro-CT (Bruker micro-CT, Belgium) scanner to generate relevant datasets containing mapped-out tissue densities. Micro-CT datasets were then reconstructed using NRecon software (Bruker micro-CT), after which the resulting reconstructed data was analyzed for bone volume/tissue volume (BV/TV%) in CTAn software (Bruker micro-CT) using a uniform volume of interest. Three-dimensional analysis of the analyzed data was then rendered using CTVox. Formalin-fixed tissue samples containing circular Mg implant were transversally cut along the axis of the implant using a diamond abrasive cutter (Topmet; R&B, Seoul, Korea). The cross-sectional area of the implant site was then exposed for closer observation. Micrographs of the exposed implant site were taken using a hand-held digital microscope (Dino-Lite pro; AnMo Electronics, Taiwan, New Taipei City). Tissue samples were then decalcified and dehydrated using alcohol series followed by xylene immersion. The xylene-treated samples were then immersed in molten paraffin wax prior to embedding. Tissue sections measuring 5.0 µm thick were then cut with a microtome (Thermo-Scientific, USA) from the blocks and attached on glass slides. The tissue slides were then deparaffinized and re-hydrated with xylene and an alcohol series for 3 min each, respectively. The slides were then washed with distilled water and finally stained with hematoxylin and eosin (H&E). Tissue sections were viewed using an optical microscope (BX53 Olympus, USA) equipped with a DP72 digital camera.
Results and discussion
Structural analysis
The microstructure and chemical composition of Mg–Ca alloy containing 0.5 wt% and 5.0 wt% Ca are shown in Figure 1. Optical images of Mg–0.5Ca alloy exhibited nearly equiaxed grain structure with α-Mg as primary phase and intermetallic Mg2Ca phase. Small precipitates of Mg2Ca phase were observed within grains as well as along grain boundaries (Figure 1(a)). On the other hand, the Mg–5.0Ca alloy showed typical dendritic structure with the presence of α-Mg dendrites and eutectic (α-Mg+Mg2Ca) phase (Figure 1(b)). In addition, discontinuous distribution of small precipitates was noticed along grain boundaries. High-magnification SEM images of Mg–Ca alloy with different Ca percentages at the tripole junction of grain boundaries further revealed that the content of the intermetallic Mg2Ca phase (black area) was increased with higher Ca addition (Figure 1(c, d)) as evident by EDX results (region q and s). The Mg–5.0Ca alloy showed higher amount of Mg2Ca with lamellar structure distributed in grain boundaries. Moreover, its grain boundary width seemed to be thicker than that of Mg–0.5Ca alloys (Figure 1(c, d)). These microstructural results were consistent with earlier reports. 10 The chemical behavior of the Mg–Ca alloy depended heavily on the composition of the alloy. Quantitative analysis of the α-Mg matrix (p region) of Mg–0.5Ca revealed the presence of primarily Mg phase with lower content of Ca precipitates (0.47 wt%) compared with grain boundary region (q region, 1.29 wt%). EDX analysis for the grain boundary of Mg–5.0Ca alloys (s region) confirmed that its grain boundaries were richer in Ca precipitates (12.5 wt%) at the junction with respect to α-Mg matrix (r region) which was Ca-deficient (1.26 wt%). The above phenomena were related towards the low solubility of calcium in the magnesium matrix. It has been reported that the maximal solubility of Ca in Mg is up to 1.37 wt%. After reaching the maximum solubility, the intermetallic Mg2Ca phase precipitated and distributed in the α-Mg matrix as well as along the grain boundary. 22
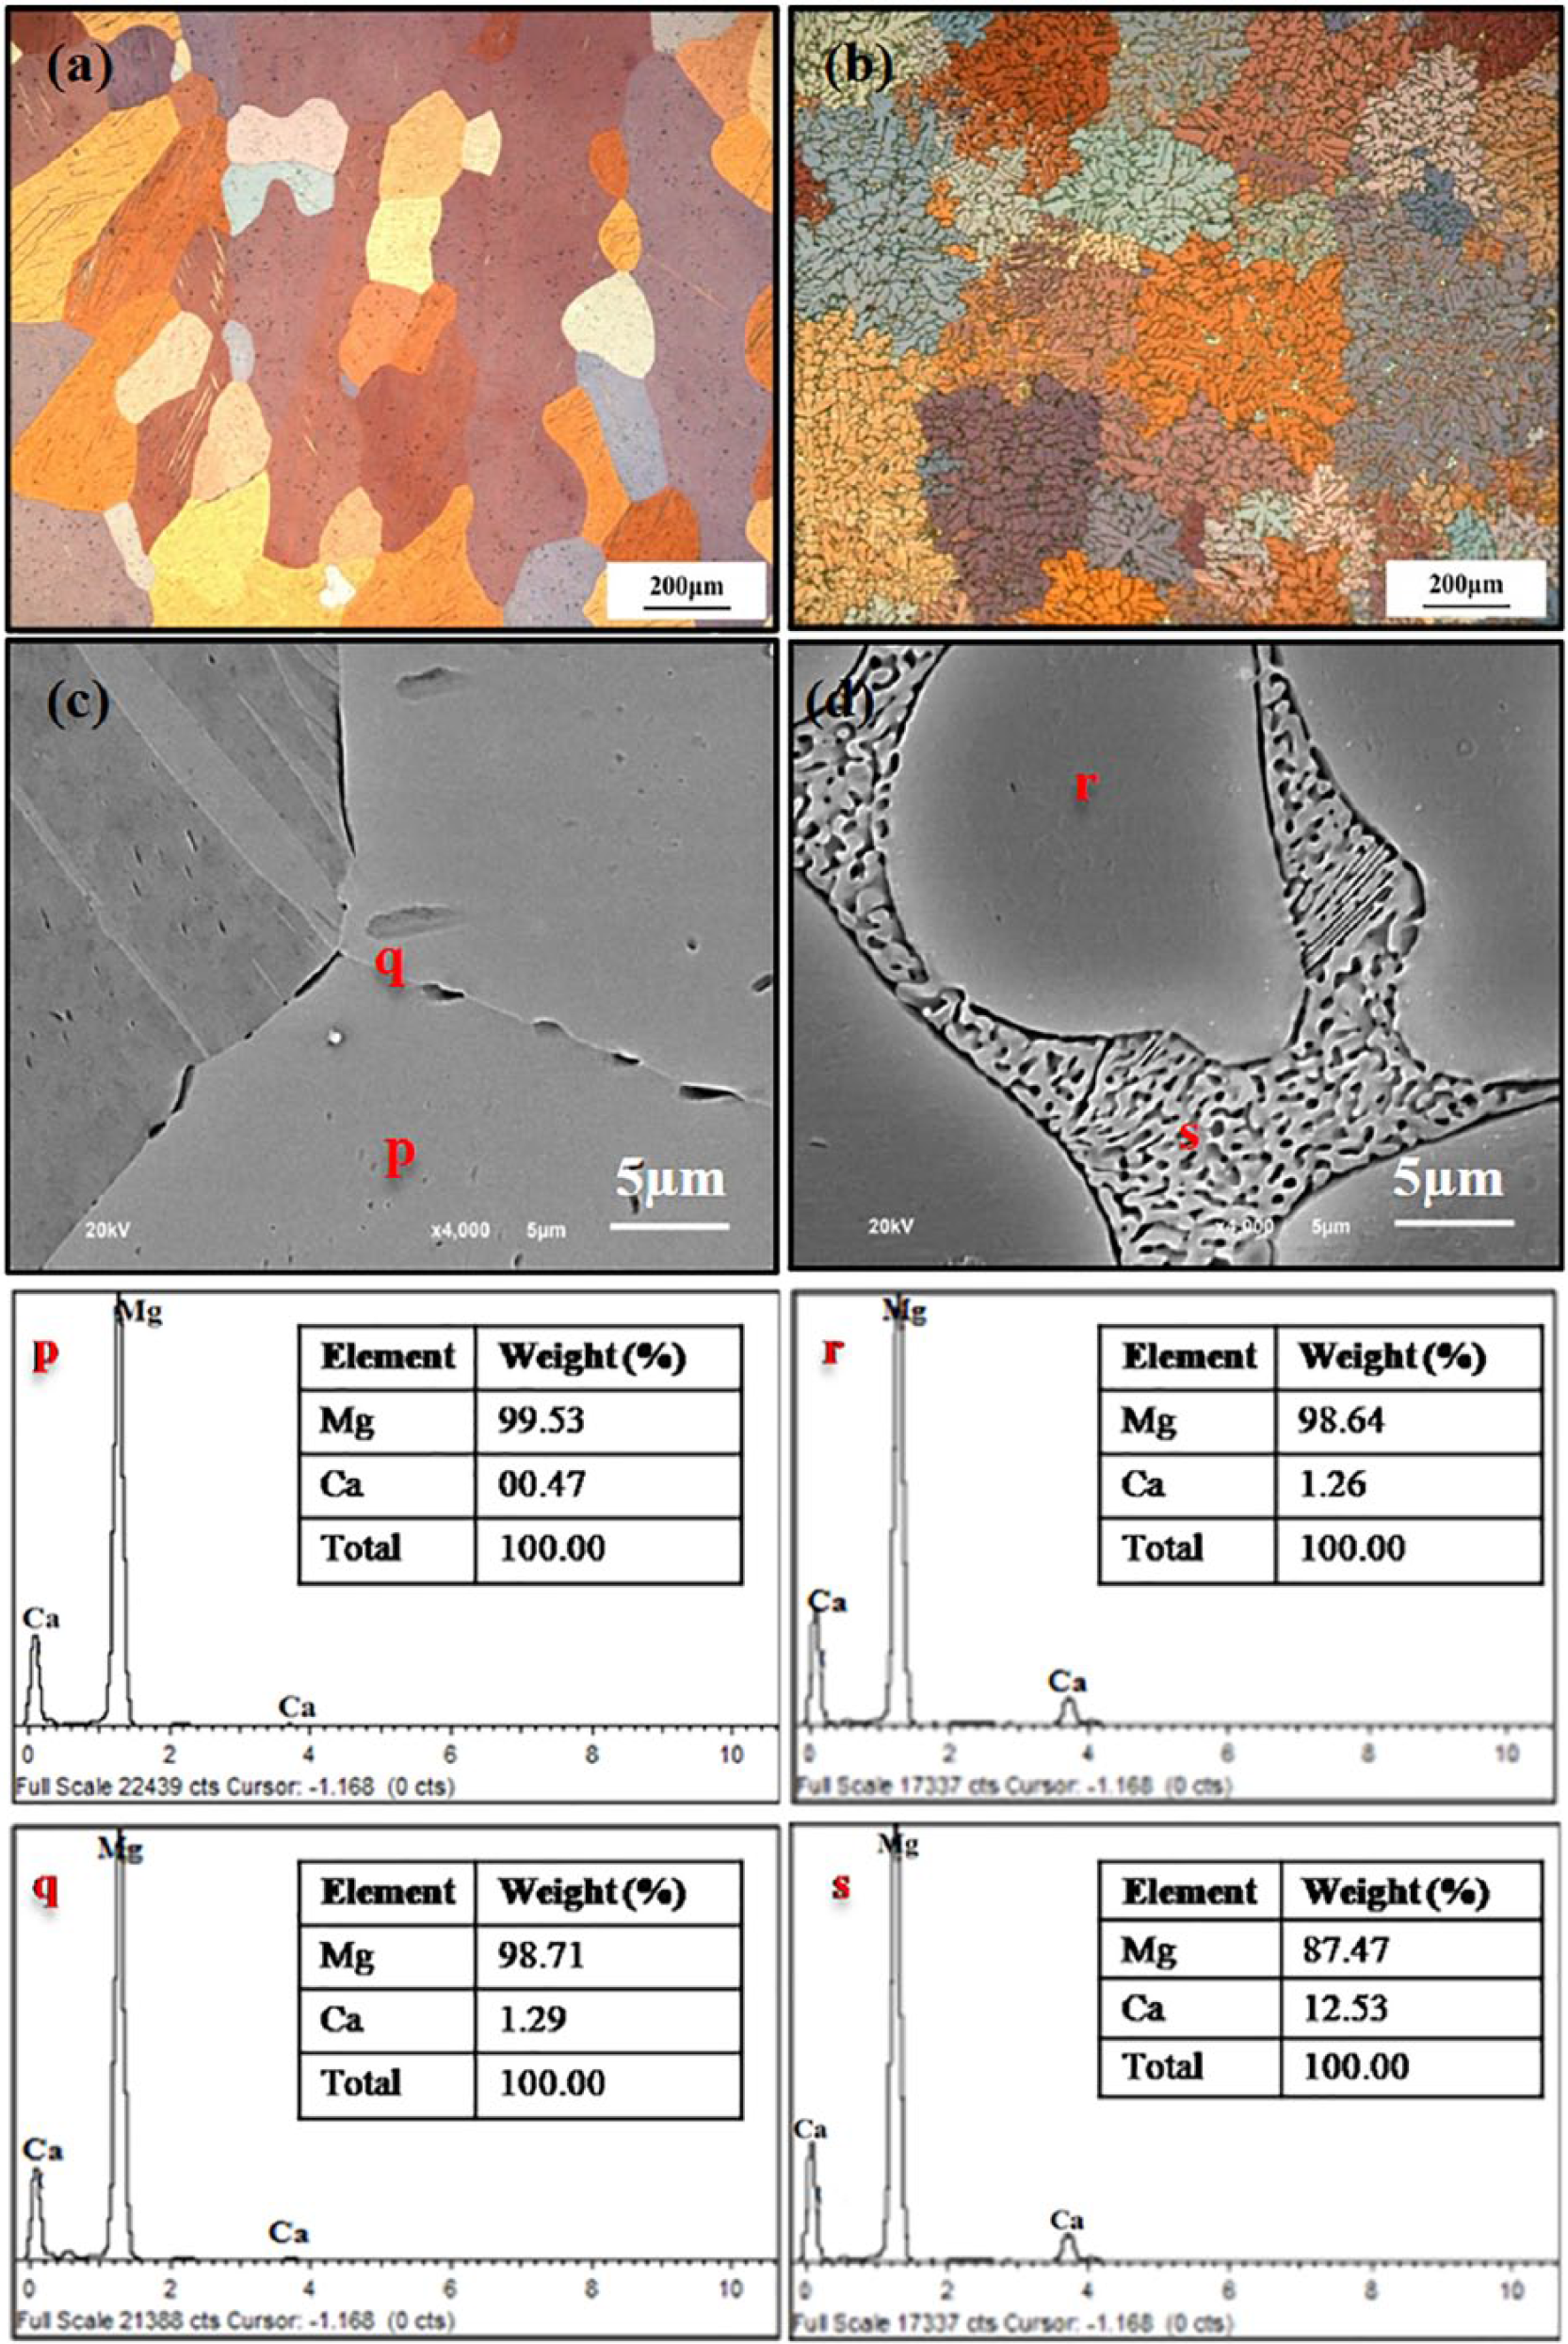
Optical images of the etched surface of (a) Mg–0.5Ca, (b) Mg–5.0Ca; High-magnification SEM images of (c) Mg–0.5Ca and (d) Mg–5.0Ca alloy along with EDX analyses of selected regions.
The XRD diffraction patterns of Mg–Ca alloys at different Ca contents are shown in Figure 2. XRD confirmed the presence of Mg2Ca phase (ICDD No: 01-073-5122) accompanied with dominant Mg phase (ICDD No: 01-089-4894) in both alloys. It was observed that the peak intensity of the intermetallic Mg2Ca phase increases with Ca content in the alloy (Figure 2). XRD results were in good agreement with morphology and chemical composition analyses which indicated the enriched precipitation of Mg2Ca phase with inclusion of higher Ca content in the Mg alloy.
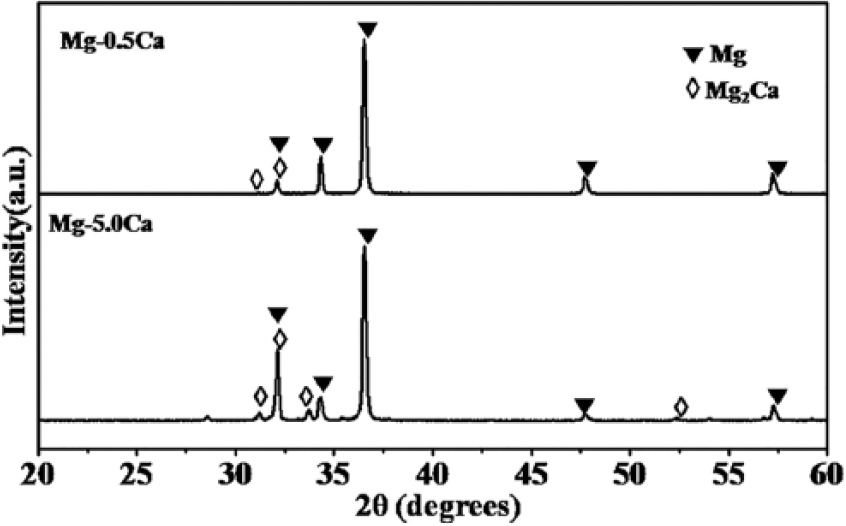
XRD analysis of (a) Mg–0.5Ca and (b) Mg–5.0Ca alloys.
In vitro degradation studies
pH change and hydrogen evolution
To analyze the detailed in vitro degradation behavior of alloys, hydrogen gas evolution and pH change behavior of Mg–xCa alloys with different Ca contents (0.5, 1.6, 3.8, 5.0 wt%) as a function of immersion time in PBS solution were determined. Results are shown in Figure 3. It was observed that the hydrogen evolution rate was increased when Ca content in the alloy was increased. The volume of released hydrogen was the least in the Mg–0.5Ca alloy compared with that in others (Figure 3(a)). It is known that gas evolution behavior is directly related to corrosion trend. 7 These results suggest that Mg–0.5Ca alloys are less prone to corrosion attack than alloys with other given compositions.
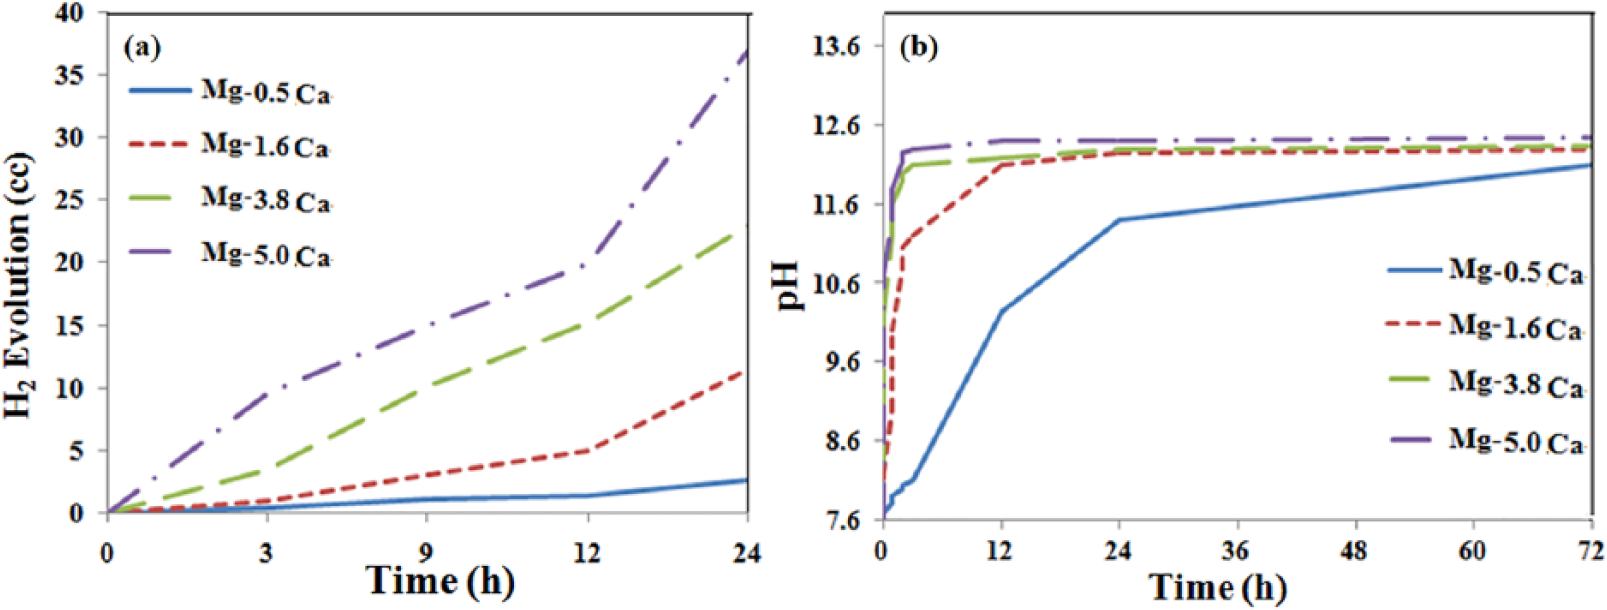
(a) Hydrogen evolution and (b) pH change behavior of varied Mg–Ca alloys as a function of immersion time in PBS solution at 37°C.
The pH value of a solution plays a crucial role during the immersion test. It has been well established that a rise in pH value is unsuitable for effective cell growth or cell proliferation. It can result in hemolysis of around 66%.4,23 Moreover, the pH of the solution is also directly related to the corrosion rate of the alloy.3,24 The results of pH changes in PBS after immersion of different alloy compositions (0.5, 1.6, 3.8, 5.0 wt% Ca) over 72 h are shown in Figure 3(b). It was clearly seen that the pH value of the solution was drastically increased initially with increased immersion time for all samples. Such initial pH rise for all alloy compositions was relatively rapid except for the 0.5 wt% Ca alloy (Figure 3(b)). In particular, pH value was rapidly increased to more than 12 after 3 h of immersion for alloy samples with high Ca contents (3.4 and 5 wt% Ca) and seemed almost stable afterwards. The pH of 1.6 wt% Ca alloy reached around 11.1 during the first 3 h of immersion. It continued to rise until 12 h, although this increase (up to pH 12) was less dramatic compared with the rise in the initial 3 h of immersion. On the other hand, the 0.5 wt% Ca alloy showed gradual increase in pH for the first 24 h (up to 11.2). It then slowly reached its equilibrium pH after 72 h of immersion. The initial spike in pH value after immersion was ascribed to accumulation of Mg(OH)2 on the surfaces of all alloy samples. However, the pH value stabilized after a longer immersion time.
It was observed that the pH value was higher when the Ca content in the alloy was higher. Higher Ca content influenced pH change in two ways. Firstly, Ca reacted vigorously in the presence of water and produced Ca(OH)2 with a higher equilibrium pH in solution. Secondly, as mentioned earlier, in the dendritic microstructure, the Mg2Ca phase was homogeneously distributed within the matrix and grain boundary. The higher Ca concentration near the grain boundary region might have provoked more active local electrochemical cells to activate the corrosion process with faster release of (OH)− ions in the form of Mg(OH)2, which in turn might have increased the pH of the solution. Compared with the others, Mg–5.0Ca exhibited the highest pH value, which was associated with a poor protection layer formed on its porous surface. It is concluded from hydrogen gas evolution and pH data that the degradation rate elevates with increase in Ca concentration. Our results also revealed that the degradation was massive in PBS solution compared with SBF or Hanks solution, as reported previously in Mg–Ca alloy systems. 10
Corroded surface studies
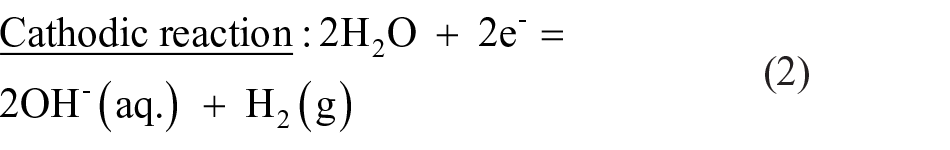
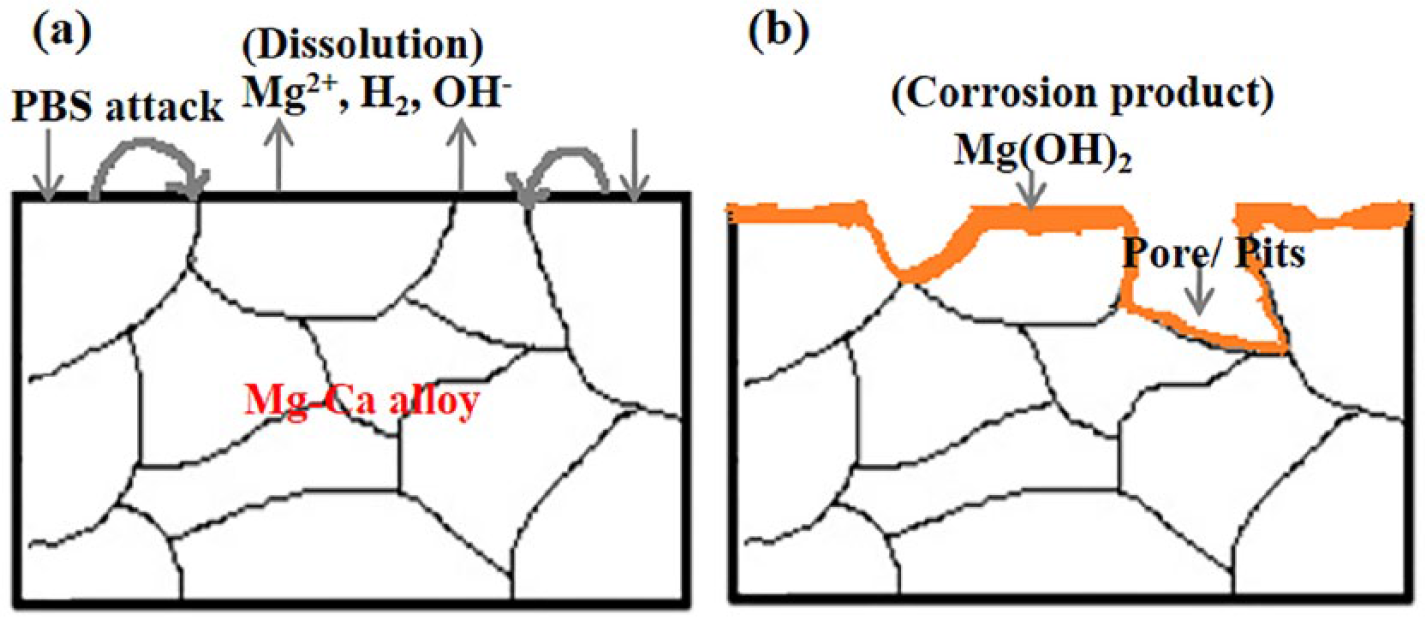
Morphological features, composition, and phase structure of Mg–0.5Ca and Mg–5.0Ca alloys immersed in PBS solution for 24 h are shown in Figure 4. The surface of Mg–0.5Ca seemed to be covered fully by a white corrosion film of insoluble Mg(OH)2 which was evident by EDX (Figure 4(c)) and XRD studies of the corroded surface (Figure 5). Apart from white precipitates, cracks were also seen on the surface which might be due to layer dehydration in air. The degradation occurred due to the following electrochemical reactions in aqueous solution: 24
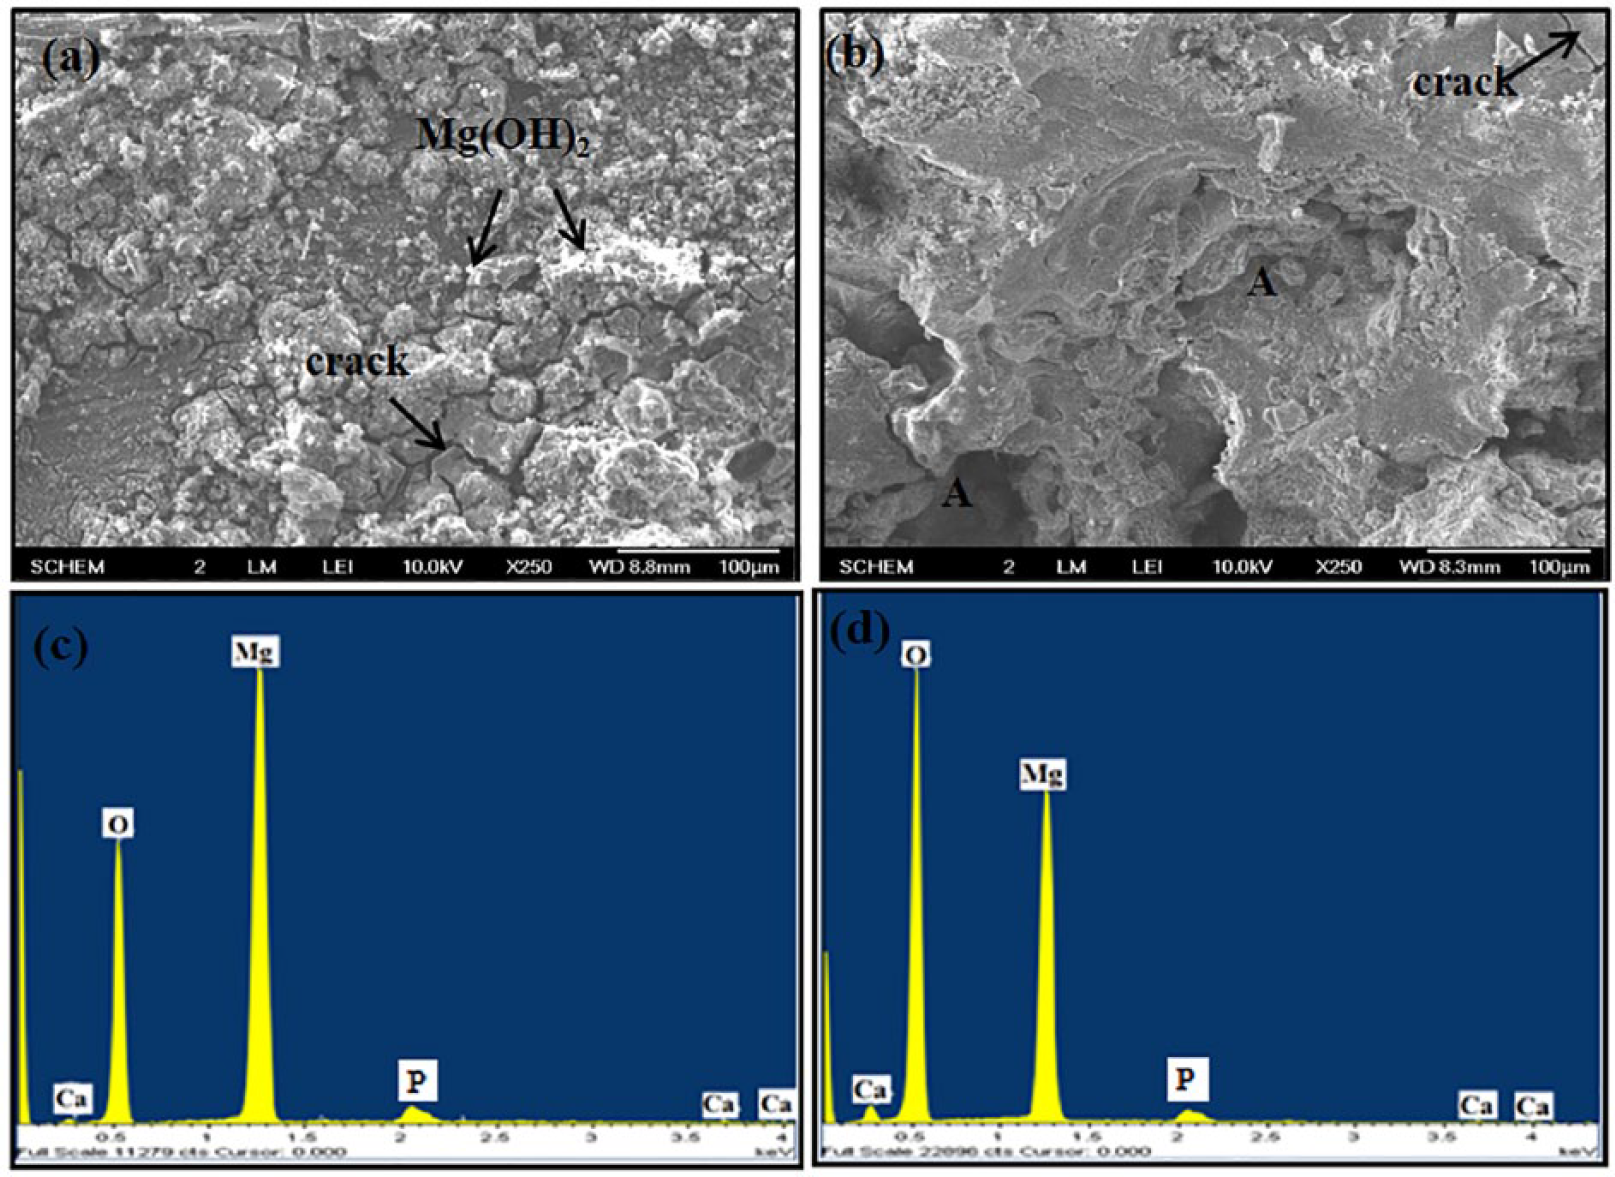
SEM images of corroded Mg–Ca alloy (a) 0.5 wt% Ca, (b) 5.0 wt% Ca after 24 h of immersion in PBS solution, along with their EDS profiles (c, d).
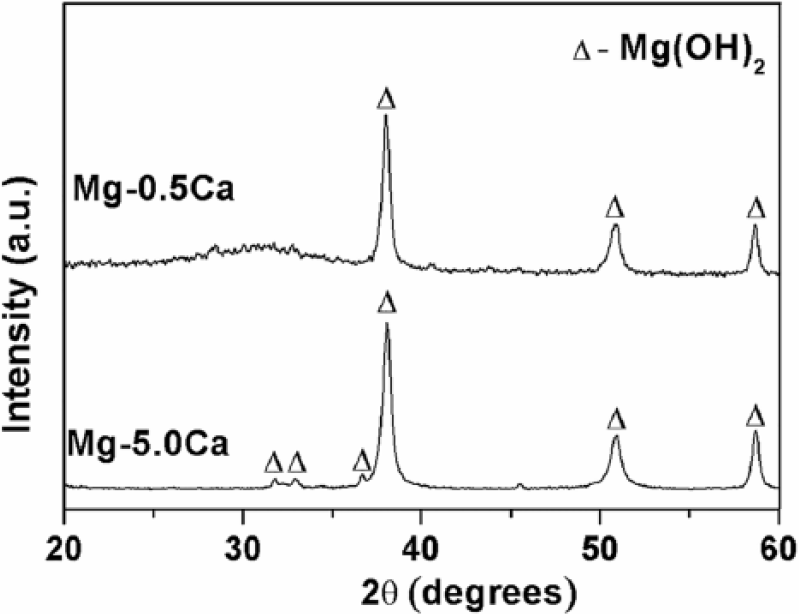
XRD of reaction products after immersion in PBS solution at 37°C for 24 h.

As a result of deposition of a protective layer of Mg(OH)2-xH2O, the corrosion rate was decreased notably afterwards, in agreement with the steady pH after long incubation time (Figure 3(b)). Also, the protective layer attracted PO3-4, CO2-3, and Cl- ions into the solution towards the surface of the sample, which in turn might have accumulated more OH- ions. On the contrary, the Mg–5Ca alloy showed a large number of deep corrosion pits (region A) along with cracks on its surface which signified higher dissolution rate of the alloy. EDX studies revealed the existence of O, P, Ca, and Mg elements in both Mg–0.5Ca and Mg–5.0Ca alloys (Figure 4(c, d)). The higher amount of oxygen further contributed to the higher degradation rate of Mg–5.0Ca alloys (Figure 4(d)). The highest corrosion rate might be attributed to the presence of an extensive amount of intermetallic Mg2Ca phase in the vicinity of the primary Mg phase, which was clearly seen in Figure 1(d). The Mg2Ca phase corroded more readily than Mg dendrite, leading to relatively faster degradation of the region around the primary Mg phase. The dissolution of this phase might have exposed the α-Mg phase, creating higher surface area with direct contact to PBS for enhanced reaction. Addition of up to 0.8 wt% Ca to the Mg matrix as a solid solution has been reported to lower the corrosion rate. 10 However, the presence of a non-homogeneous distribution of Ca with predominantly higher concentration along the grain boundary might have enhanced its degradation in PBS medium.
XRD patterns of Mg–0.5Ca and Mg–5.0Ca alloys after immersion in PBS for 24 h are shown in Figure 5. Results showed that Mg(OH)2 (ICDD No: 01-082-2453) was the main corrosion product in both alloys. In addition, peak intensities of Mg(OH)2 were much more pronounced in Mg–5.0Ca alloys compared with those of Mg–0.5Ca alloys. Such apparent difference might be due to the larger amount of reactive Mg2Ca phase associated with Mg–5.0Ca alloys compared with those associated with Mg–0.5Ca alloys (Figure 1). XRD results supported the results of the EDX studies (Figure 4(c, d)).
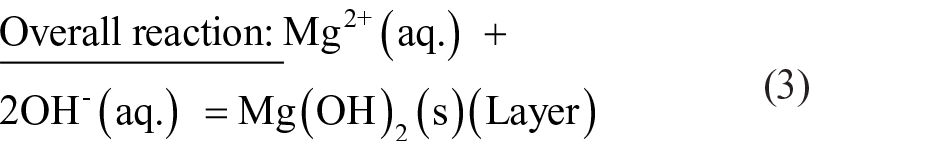
Figure 6 is a schematic diagram showing the corrosion model at the alloy/solution interface after exposure in PBS solution at 37°C for 24 h. The electrochemical mechanism occurred as mentioned in Equations (1)–(3). As soon as the surface of Mg–Ca alloy was exposed to the PBS solution, the intermetallic Mg2Ca phase served as a cathode and resulted in the hydrogen evolution (Equation (2)) due to its greater reactivity than the primary α-Mg phase. 13 The dissolution of Mg also occurred at the anode site (Figure 6(a)), as explained by Equation (1). The product layer of magnesium hydroxide (Mg(OH)2) was formed on the Mg–Ca surface (Equation (3)) because of the relevant alkalization in the vicinity of the surface (Equation (2)). The increase in corrosion rate of Mg–5.0Ca, as depicted by SEM images (Figure 4), could thus be explained by the increment in cathode to anode area due to the presence of a larger amount of Mg2Ca phase. Since the film on the surface of the Mg–Ca alloy was partially protective, as it was constituted of minute pores, the solution continuously penetrated via the film and reacted with the Mg–Ca alloy, resulting in an inward shifting of the reaction interphase. Simultaneously, the outward diffusion of dissolved Mg2+ ions occurred and produced Mg(OH)2 at the surface. Thus, the Mg(OH)2 layer growth was manifested by combined dissolution and precipitation mechanisms. The chloride ions present in solution disturbed this dissolution–precipitation process and transformed the insoluble Mg(OH)2 into soluble MgCl2 by combining with Mg2+ ions.25–27 Certain areas of the Mg(OH)2 film immediately dissolved resulting in pit formation, leaving the fresh alloy surface exposed to the solution. The same chemical reactions (Equations (1)–(3)) continued until the alloy was fully exhausted (Figure 6(b)). Hence, the severe non-uniform corrosion was revealed by the bulk Mg–Ca alloy until the Mg2Ca phase was depleted.
Schematic diagram showing the corrosion mechanism at alloy/solution interface (a) Early stage where galvanic corrosion initiates between Mg and intermetallic Mg2Ca phase on exposure in PBS solution; (b) Severe corrosion with pit formation after immersion in PBS solution for 24 h.
In vivo degradation and bone regeneration
Optical observation and micro-CT
After closing the defect site (femoral condyle) with suture, a gas pocket formed in the vicinity of the implant site in all rabbits. The size of the gas pocket increased rapidly in the initial 2 days but eventually stabilized within 1 week of implantation. Photographs of the surgical sites were taken prior to extraction of bone tissue containing the Mg–Ca alloy implants and are shown in Figure 7(A). A subcutaneous gas accumulation was seen after implantation of Mg alloys containing different contents of Ca into femoral condyle after 2 and 4 weeks. Tissue swelling was gradually reduced in all implants 2 weeks after the implantation and became significantly condensed after 4 weeks. However, a subcutaneous bulging or tissue swelling was observed to be smaller for the Mg–0.5Ca alloy than that of Mg–5.0Ca after implantation for 2 weeks (Figure 7(A,a), 7(A,c)) and 4 weeks (Figure 7(A,b), 7(A,d)). Upon extraction, the implant site was found to have accumulated high amounts of interstitial fluid. For in situ visualization of the implanted Mg–Ca alloys defect model, a transverse cut of the femoral condyle along the diameter of the implanted alloys was made. Figure 7(B) shows the optical images of implanted Mg–Ca alloys with different Ca contents after 2 and 4 weeks. In the Mg–0.5Ca alloy system, a gradual degradation was observed. A portion of the implant still remained after 2 weeks (Figure 7(B,a)) and 4 weeks (Figure 7(B,b)) of implantation. The degradation product (Mg(OH)2) was also found to be accumulated on the surface of the implants. Between host bone and the implant, a sheath of cellular deposition appeared as tissue response was increased in thickness from 2 weeks to 4 weeks. However, the Mg–5.0Ca alloy was seemed to be almost totally degraded in all observation periods (Figure 7(B,c), Figure 7(B,d)).
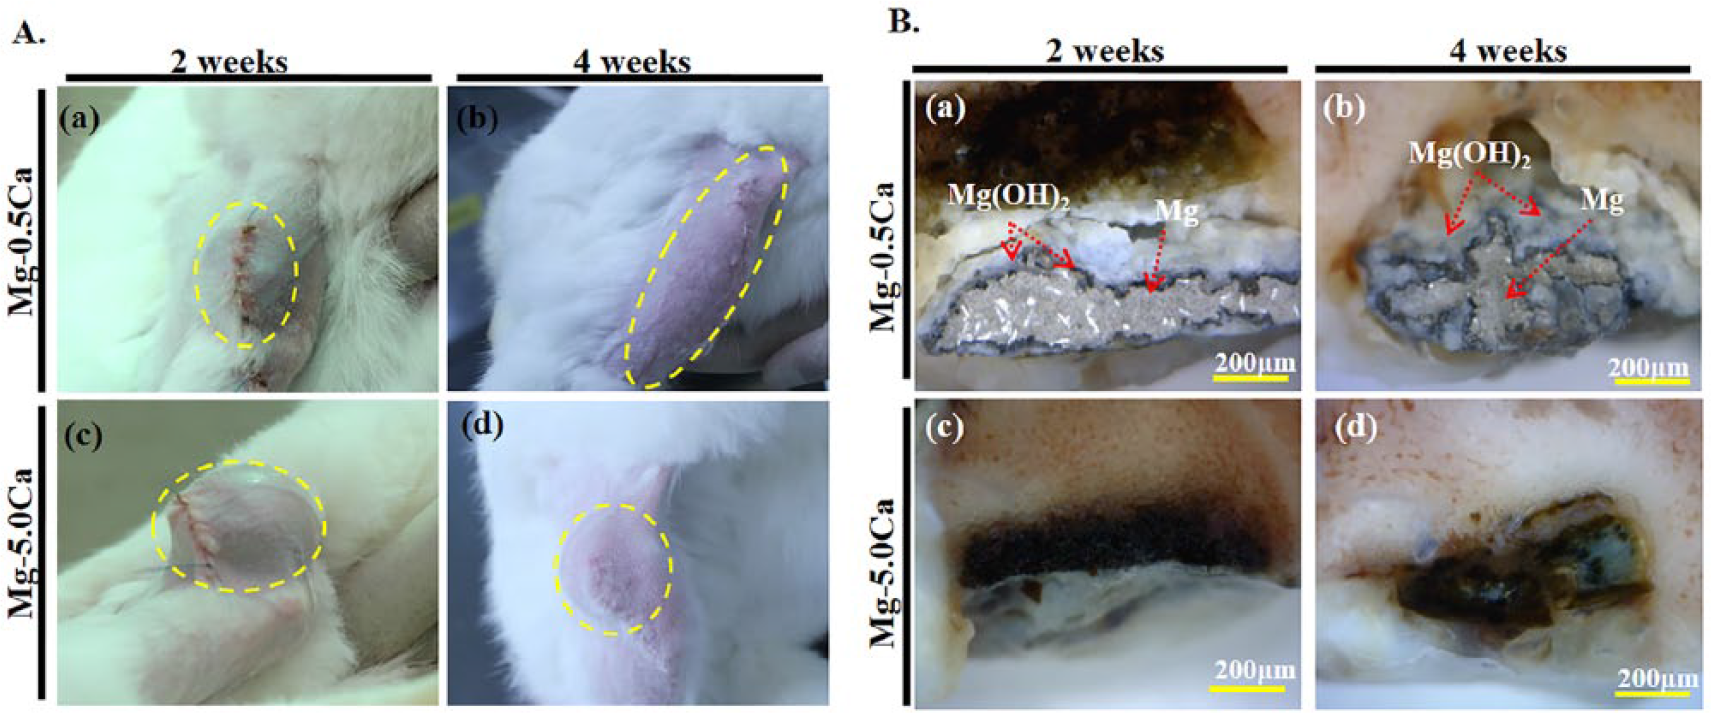
A. Photographs of subcutanious gas accumulation with the Mg–Ca alloy implanted femoral condyle after 2 (a,c) and (b,d) 4 weeks. B. Optical images for Mg–Ca alloy 0.5 wt% Ca (a,b) 5.0 wt% Ca (c,d) after 2 and 4 weeks.
Micro-CT images of varied Mg–Ca alloys implants after 2 and 4 weeks are shown in Figure 8(A). Both alloy types showed a decrease in defect size after 2 and 4 weeks. Minimal bone formation was observed in Mg–5.0Ca compared with that in Mg–0.5Ca after 2 weeks of implantation (Figure 8(A,a), Figure 8(A,c)). A single data slice taken from the micro-CT scans of the tissue samples showed that Mg–0.5Ca alloy implants resulted in visibly better bone formation compared with Mg–5.0Ca after 4 weeks (Figure 8(A,b), Figure 8(A,d)). Calculated BV/TV percent values as computed from micro-CT images are shown in Figure 8(B). After 2 and 4 weeks of implantation, BV/TV percent values for Mg–0.5Ca were found to be 1.57% and 34.13%, respectively. For Mg–5.0Ca, they were 0.79% and 4.88%, respectively. Although Mg–5.0Ca showed significant increase in bone formation after 4 weeks, Mg–0.5Ca was still extensively superior, having almost 10 times better bone formation at the same observation period. The higher bone formation by Mg–0.5Ca implantation might have resulted from its higher corrosion resistance, leading to significant reduction of degradation products and lowered inflammatory reaction. Figure 8(C) represents the overall degradation rate of Mg–0.5Ca and Mg–5.0Ca alloys after 2 week and 4 weeks of implantation. The percent degradation rate as obtained from micro-CT analysis for Mg–0.5Ca alloy was 63% and 49% after implantation of 2 and 4 weeks, respectively. However, due to the complete dissolution of Mg–5.0Ca alloys within 2 weeks, the degradation rate was found to be negligible (~1%) after 2 weeks and 4 weeks of implantation. The complete degradation of Mg–5.0Ca alloys may account for the severe corrosion that took place due to the existence of large quantities of intermetallic Mg2Ca phase in the alloy system, as evident from the morphology (Figure 4(b, d)) and XRD (Figure 5) results of the corroded alloy.
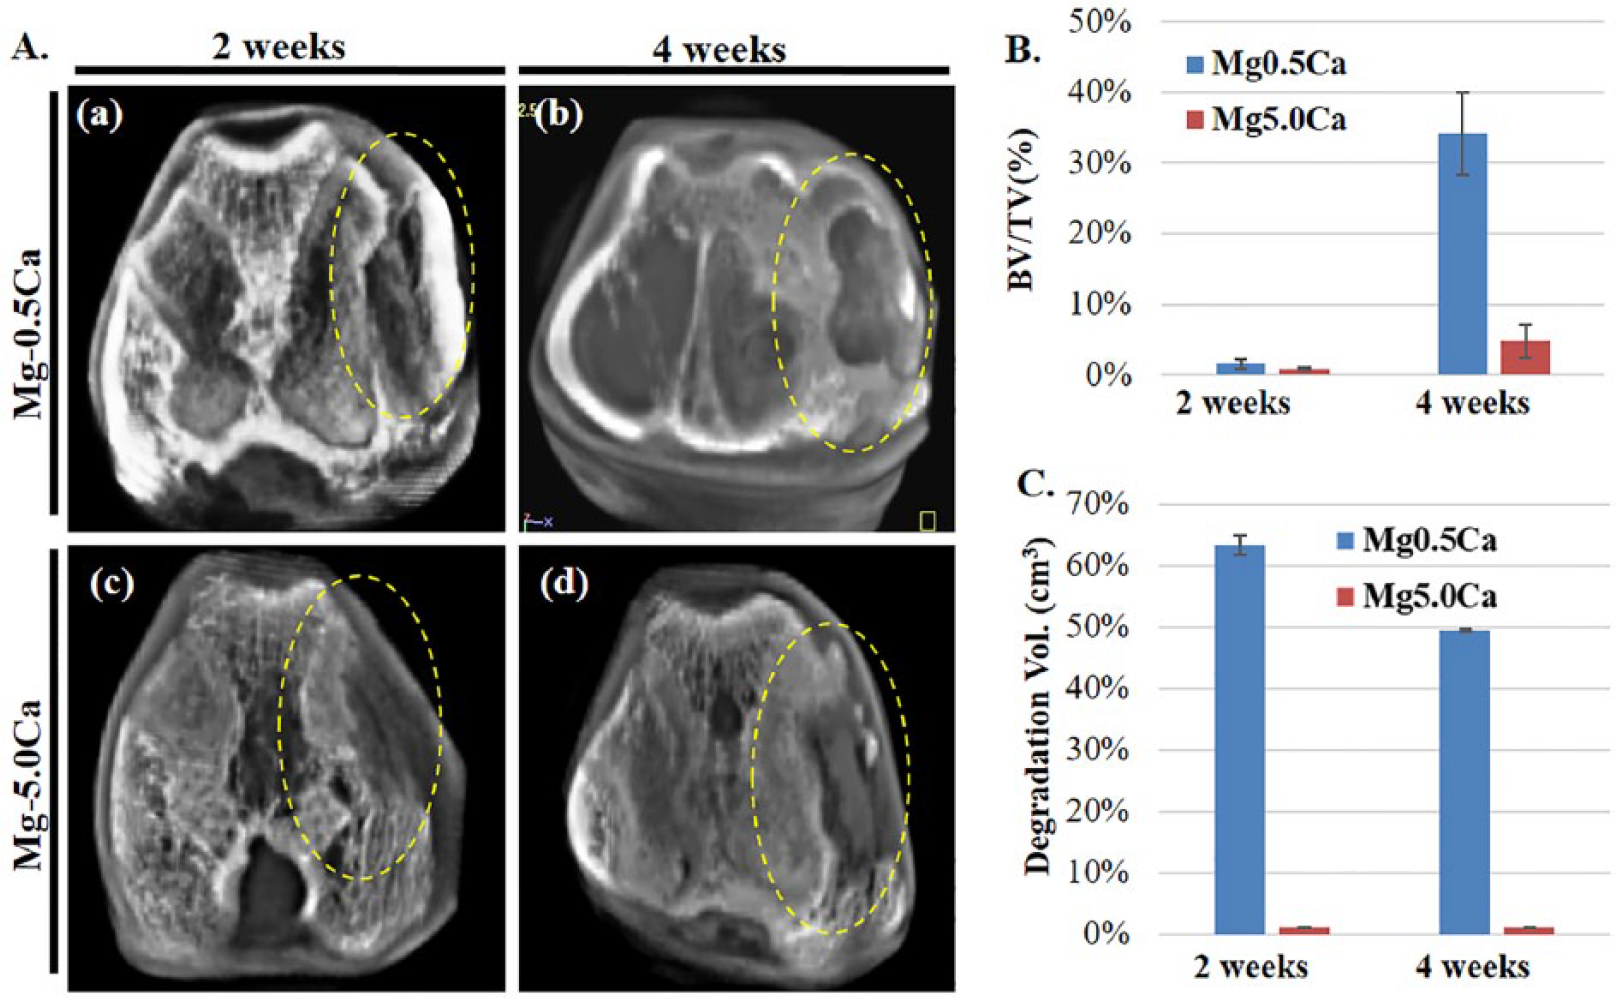
A. Micro-CT images of the Mg–Ca alloy implanted femoral condyle after 2 (a,c) and 4 (b,d) weeks, B. Percent bone volume (BV/TV), C. Degradation volume (percent) after implantation computed from micro-CT images.
Histological staining
Micrographs were taken from stained tissue sections to better visualize and analyze the corresponding tissue response. Results of histological analysis of varied Mg–Ca alloys implanted in femoral condyle for 2 weeks and 4 weeks after H&E staining are shown in Figure 9. No visible remnants of the alloy implants were found in the stained sections. Decalcification of the tissue samples in diluted nitric acid might have effectively dissolved all residual Mg and deposited Mg(OH)2 near the interface. Low-magnification images of the stained sections from Mg–0.5Ca and Mg–5.0Ca implants are shown in Figure 9(a) and Figure 9(d). A buffer interaction zone between the implant and host bone was observed. The blank space seen in the central region of Mg–5.0Ca is the space occupied by the alloy implant (Figure 9(d)).
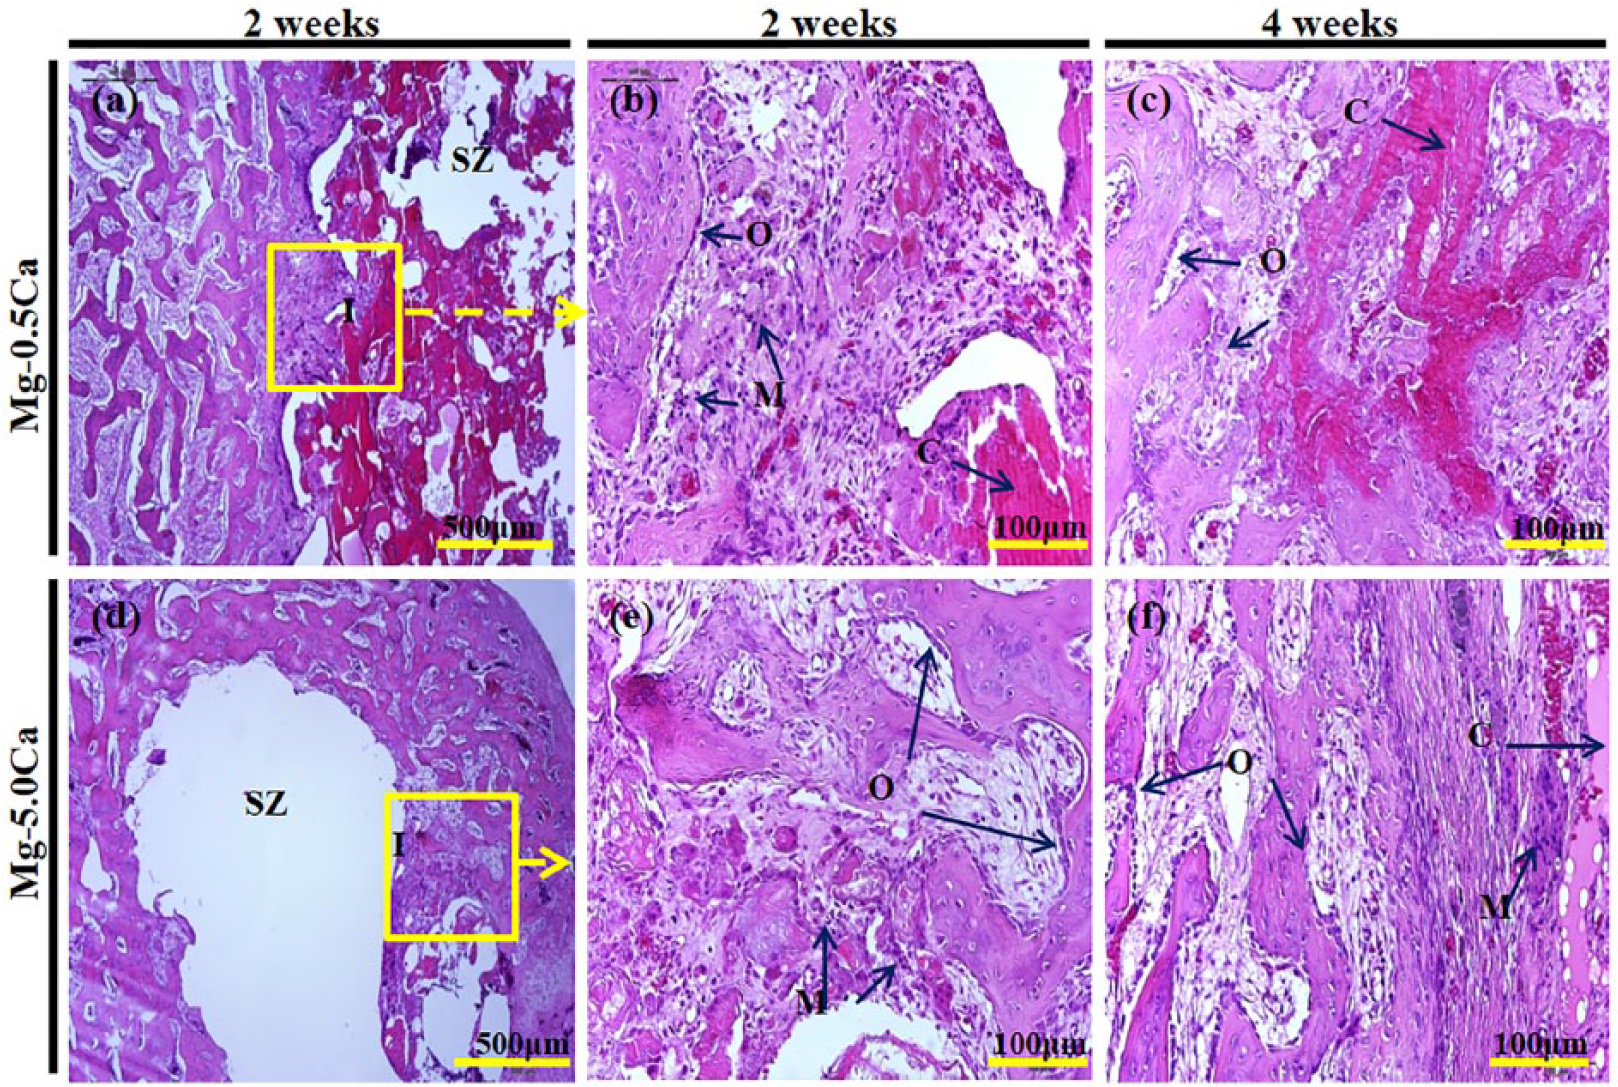
Histological analysis of varied Mg–Ca alloy implanted femoral condyle stained by hematoxylin and eosin after 2 weeks and 4 weeks.
Higher magnification micrographs of both implant types after 2 weeks are shown in Figure 9(b) and Figure 9(e). Copious macrophage cells were observed in Mg–0.5Ca and Mg–5.0Ca alloy implants (Figure 9(b, e)). However, active osteoblast cell linings can still be seen along the implant interface forming new bone. Interestingly, large highly basic particles can be seen along the interface of the Mg–0.5Ca predominantly occupied by dense fibrous tissue. Improved bone formation was observed in both samples 4 weeks after implantation (Figure 9(c, f)). Macrophage activity was present along the implant interface and near the host bone after 4 weeks. The initial immune response to the defect and the aggressive implant surface due to the release of Mg(OH)2 were subdued largely in a 4-week timespan with the 0.5 wt% Ca implant. The formation of these degradation products led to a heightened inflammatory response of the surrounding tissues. Prolonged inflammation was more pronounced in Mg–5.0Ca. Staining results showed that the Mg alloy with lower Ca content (Mg–0.5Ca) demonstrated better bone tissue regeneration compared with a similar sample with higher Ca (Mg–5.0Ca). In vivo degradation of this Mg alloy was also rather quick. Formation of the gas pocket observed at the beginning of the recovery period and the presence of accumulated interstitial fluid in the implant site is a direct response to the rapid build-up of corrosion byproducts. Although the tissue sections showed that the bone tissue along the margin of the defect was not considerably altered, bone formation did not substantially extend within the space occupied by the implants. Based on these results, bone formation was highly influenced by the stability of the alloy implant. The Mg–0.5Ca alloy was perceptibly more stable than the Mg–5.0Ca alloy, thus it was able to function as a support for bone formation.
Conclusion
The basic intent of the present work was to investigate the overall efficacy of Mg–0.5Ca and Mg–5.0Ca alloys by assessing their microstructural, phase, in vitro degradation, and in vivo biological responses. Microstructural and phase studies revealed that the intermetallic Mg2Ca phase was increased in grain boundaries with rising Ca content. In vitro degradation of Mg–Ca alloy system was found to be massive in PBS solution. The dissolution rate of the Mg–Ca alloy was increased notably with increasing Ca content, as shown by hydrogen evolution and pH studies. Morphological and phase studies during immersion tests suggested that Mg–0.5Ca was more corrosion resistant, with more uniform and lesser damage than the Mg–5.0Ca alloy. In vivo studies showed good biocompatibility and enhanced new bone formation for Mg–0.5Ca after 4 weeks of implantation compared with the Mg–5.0Ca alloy. Higher initial corrosion rate with prolonged inflammation and rapid degradation was noted for Mg–5.0Ca, whilst the Mg–0.5Ca alloy fared well with controlled degradation after 4 weeks of implantation. Hence, the Mg–0.5Ca alloy system might be a good candidate for biodegradable bone implant applications.
Footnotes
Declaration of Conflicting Interests
The author(s) declared no potential conflicts of interest with respect to the research, authorship, and/or publication of this article.
Funding
The author(s) disclosed receipt of the following financial support for the research, authorship, and/or publication of this article: This research was supported by Basic Science Research Program through the National Research Foundation of Korea (NRF) funded by the Ministry of Education (No. 2015R1A6A1A03032522) and partially funded by Soonchunhyang University, South Korea.