
Abstract
Background:
Respiratory-related mortality in Bangladesh exhibits pronounced seasonal trends, yet systematic forecasting to guide public health interventions remains limited. This study analyzes temporal patterns and projects future mortality using nationally certified cause-of-death data.
Methods:
We applied a Seasonal Autoregressive Integrated Moving Average (SARIMA) model to monthly respiratory mortality records (January 2018–December 2024, 84 data points). Model selection was guided by AIC/BIC criteria, with performance evaluated via fivefold time-series cross-validation (training/test splits: Fold 1: 24/12, Fold 2: 36/12, Fold 3: 48/12, Fold 4: 60/12, Fold 5: 72/12). Seasonality was quantified through decomposition, and 18-month forecasts were generated with 95% prediction intervals.
Results:
Mortality demonstrated strong seasonal peaks in July, August (79.5% of death counts in July), and January (66.2% of death counts in July), aligning with monsoon and winter periods. The optimal SARIMA(1,2,3)(0,1,1)[12] model achieved robust accuracy: mean absolute scaled error (MASE) = 0.41, MAE = 259.123, and RMSE = 337.238 (cross-validation mean: MASE = 0.58, MAE = 520.13). Forecasts projected stable monthly averages of 1724 (95% CI: 782–2667) deaths in 2025 and 1711 (593–2830) in 2026, with highest occurrence in July, August then January. Residual diagnostics confirmed model adequacy (Ljung-Box p = 0.971), though non-normality (Shapiro-Wilk p < 0.001) was present, it was negligible.
Conclusion:
Respiratory mortality in Bangladesh follows predictable seasonal patterns, with monsoon and winter peaks demanding targeted interventions. The SARIMA model provides actionable forecasts for preemptive public health measures, such as pre-monsoon vaccination campaigns and pollution control. Future research should explore environmental covariates to enhance precision.
Keywords
Significance for public health
This study enhances our understanding of respiratory mortality trends in Bangladesh by revealing distinct seasonal peaks in July, August, and January, coinciding with monsoon rains and winter months. Using a rigorously validated SARIMA model, it generates reliable 18-month forecasts, equipping public health officials with evidence to guide interventions. These may include strategically timed vaccination drives (e.g. pre-monsoon in April–May), air pollution controls, and optimized healthcare staffing during high-risk periods. The findings advocate for integrating time-series forecasting into national disease surveillance, offering a proactive tool to curb respiratory mortality in resource-limited settings like Bangladesh. Future models could be strengthened by incorporating environmental data (e.g. air quality, temperature), sharpening predictive accuracy for tailored responses. Such data-driven strategies are invaluable for epidemic preparedness and efficient use of scarce medical resources, enabling policymakers to mitigate seasonal outbreaks, reduce healthcare strain, and save lives.
Introduction
Respiratory diseases continue to be a leading cause of mortality globally, with South Asia, including Bangladesh, facing particularly high burdens due to a combination of environmental, socio-economic, and healthcare related factors.1,2 Occurrence of respiratory diseases are usually influenced by a multitudes of factors such as air pollution, temperature fluctuations, and viral outbreaks which often follow seasonal pattern and thus the respiratory-related morbidity and mortality statistics also may show temporal/seasonal fluctuations. 3 Accurate identification of these temporal patterns and the ability to forecast future trends are crucial for effective public health response. The Medical Certification of Cause of Death (MCCD), defined by the 20th World Health Assembly, provides a standardized method for capturing mortality data,4,5 but its application, especially in time series analysis in Bangladesh, remains underexplored. 6 This study aims to fill this gap by analyzing 7 years of monthly MCCD data on respiratory-related mortality, using a Seasonal Autoregressive Integrated Moving Average (SARIMA) model. 7 The goal is to identify seasonality in respiratory mortality trends and generate reliable forecasts for future mortality, thereby supporting evidence-based decision-making, resource allocation, and health system responses. By employing SARIMA modeling, this research aims to elucidate on mortality dynamics and improve the prediction of high-risk periods for respiratory conditions, which can inform timely public health interventions and optimize healthcare resource distribution.
Objectives
The primary objectives are: (1) to detect and quantify any seasonal patterns in respiratory disease related mortality, (2) to develop and validate an optimized SARIMA model for forecasting future trends, and (3) to identify high-risk months and generate 18-month forecasts with associated uncertainty. The findings aim to support public health authorities in prioritizing preventive strategies and allocating resources more effectively during critical periods.
Methodology
Study design
This is a secondary data-based observational study. The STROBE guideline for observational studies was followed for reporting this study.
Study place
All data were pertaining to Bangladesh.
Study period
The study was conducted between January and May, 2025, however the data (Monthly number of deaths medically certified as resulting from respiratory conditions) pertained to a period that spanned form January 2018 till December 2024.
Inclusion and exclusion criteria
The study included all monthly counts of deaths medically certified as resulting from respiratory conditions, as reported in the national MCCD database for Bangladesh from January 2018 to December 2024. No data points were excluded from the analysis, as the objective was to model the complete, nationally reported time series. The sole criterion for inclusion was the availability of a validated monthly data point within the specified timeframe.
Variables
Monthly number of deaths due to respiratory diseases, according to Medical Certificate Cause of Deaths (MCCD) database of Bangladesh.
Operational definition
Death medically certified as resulting from respiratory conditions refers to cases where a qualified medical practitioner formally documents the underlying cause of death as attributable to diseases or disorders of the respiratory system. This classification follows the International Classification of Diseases (ICD-10/ICD-11) coding standards and also adheres to World Health Organization (WHO) guidelines for cause-of-death reporting.8,9
Data source and preprocessing
Data pertaining to monthly number of deaths medically certified as resulting from respiratory conditions occurring between January 2018 and December 2024 were obtained from the MCCoD module of Real-time Health Information Database, which is a publicly displayed web-based digital dashboard, displaying live health statistics, run by Directorate General of Health Services (DGHS) under the Ministry of Health and Family Welfare (MOHFW) of Bangladesh. 10 The dataset, comprising 84 monthly observations (January 2018–December 2024), was processed and validated programmatically. This validation included checks for file integrity, the presence of essential columns, and most importantly, the continuity of the monthly time series. The process confirmed a complete series with no temporal gaps or missing values, forming a robust foundation for SARIMA modeling.
Seasonality detection and decomposition
To evaluate underlying patterns, each time series was decomposed using additive seasonal decomposition via statsmodels.tsa.seasonal.seasonal_decompose() with a fixed periodicity of 12 months. Seasonality was considered present if the mean absolute seasonal component exceeded 10% of the mean absolute observed values. While this threshold is commonly used as a practical heuristic in applied time series analysis, it is not established as a formal or universal standard in statistical literature. 11 This method allowed visual and quantitative assessment of trend, seasonal, and residual components.
with a fixed periodicity of 12 months. Each time series Yt was decomposed into three components:

where:
Yt is the observed value at time ttt,
Tt is the trend component,
St is the seasonal component, and
Rt is the residual (irregular) component.
Seasonality was considered present if the mean absolute seasonal component exceeded 10% of the mean absolute observed values, defined as:

This criterion allowed for a quantitative threshold to identify meaningful seasonal patterns in mortality data. The strength of seasonality was reported using this ratio.
SARIMA model specification
The SARIMA (Seasonal, Auto Regressive, Integrated, Moving, Average) model is another popular time series forecasting model that extends the ARIMA model to account for seasonality in the data and was first described by Box and Jenkins in 1970. 12 It involves seasonal autoregressive (SAR) and seasonal moving average (SMA) components in addition to the non-seasonal ones, which are: Seasonal Auto Regressive (SAR), Integration (I), and Seasonal Moving Average (SMA). Here’s the equation for a SARIMA (p,d,q)(P,D,Q_s) model:

Where:
This equation extends the basic ARIMA model by incorporating both non-seasonal and seasonal components, which are commonly seen in time series data exhibiting seasonality. In the SARIMA model, we specify the values of
We implemented a grid search algorithm to identify optimal Seasonal Autoregressive Integrated Moving Average (SARIMA) parameters. In this analysis, these components were selected as follows:
●
○ p (autoregressive order): Tested values 0–3
○ d (differencing order): Tested values 0–2 (stationarity confirmed via Augmented Dickey-Fuller test)
○ q (moving average order): Tested values 0–3
●
○ P, D, Q: Tested values 0–1 (due to limited data length)
○ S or, m (seasonal period): Fixed at 12 for monthly data
Stationarity was assessed and ensured through automated differencing selection during the grid search process. Non-seasonal differencing (d) was tested up to order 2, and seasonal differencing (D) up to order 1, with non-stationary or invalid configurations (e.g. p = q = 0) excluded during model fitting. ADF tests confirmed non-stationarity required d = 2; seasonal differencing (D = 1) addressed annual patterns without overcorrection. A comprehensive grid search evaluated 384 SARIMA parameter combinations—non-seasonal (p = 0–3, d = 0–2, q = 0–3) and seasonal (P = 0–1, D = 0–1, Q = 0–1; m = 12 for monthly data), with the model minimizing the Akaike Information Criterion (AIC) and Bayesian Information Criterion (BIC) selected to balance fit and parsimony. Stationarity was ensured via Augmented Dickey-Fuller (ADF) tests, requiring second-order non-seasonal differencing ( d = 2 ) and first-order seasonal differencing ( D = 1 ). Grid search was chosen over ACF/PACF plots for its robustness in handling complex patterns (e.g. COVID-19 volatility in 2020–2021), supported by Hyndman and Athanasopoulos. 11 In the absence of seasonality, the analysis would default to non-seasonal ARIMA models while maintaining the same validation rigor via cross-validation and residual diagnostics. Forecasts under such a scenario would proceed without incorporating seasonal components.
Residual diagnostics
Residual normality was assessed using Jarque-Bera and Shapiro-Wilk tests, with Q-Q plots and histograms for visualization. Autocorrelation was tested via the Ljung-Box test (lag 12). Volatility was evaluated using Engle’s ARCH-LM test, with GARCH(1,1) modeling if significant.
Volatility assessment
Volatility was assessed using Engle’s ARCH-LM test to SARIMA residuals, testing the null hypothesis of no volatility clustering (α = 0.05). If significant ARCH effects were detected (p < 0.05), we fitted a GARCH(1,1) model to quantify volatility persistence. Conditional variance estimates were then used to adjust forecast confidence intervals. Model diagnostics included visualizations of squared residuals and GARCH-fitted volatility, alongside parameter estimates (ARCH term α and GARCH term β).
Cross-validation procedure
A fivefold time-series cross-validation was implemented using TimeSeriesSplit (n_splits = 5, test_size = 12). Training/test splits were:
Fold 1: 24/12 (Jan 2018–Dec 2019/Jan 2020–Dec 2020)
Fold 2: 36/12 (Jan 2018–Dec 2020/Jan 2021–Dec 2021)
Fold 3: 48/12 (Jan 2018–Dec 2021/Jan 2022–Dec 2022)
Fold 4: 60/12 (Jan 2018–Dec 2022/Jan 2023–Dec 2023)
Fold 5: 72/12 (Jan 2018–Dec 2023/Jan 2024–Dec 2024) The final model used all 84 points for training. Performance metrics (MAE, RMSE, MASE) were averaged across folds
Forecasting and uncertainty quantification
An 18-month forecast was generated for each cause of neonatal death using the fitted SARIMA model. Prediction intervals (95% CI) were derived from the state-space representation of the SARIMA model. Additionally, annual aggregates of the forecast were calculated to support policy planning and intervention timing. The model also identified months with high relative risk based on seasonal decomposition, flagging July, August and January as critical periods with heightened relative risk.
Software implementation
All analyses were done with the help of Python Script Language version 3.13.3. 13 The code was written and edited with “Sublime Text” software (Sublime HQ Pty Ltd., Woollahra, Sydney) and compiled with respective compiler. Following libraries were imported and used for analyzing the data generating the plots: “pandas,” 14 “numpy,” 15 “matplotlib 16 ,” “statsmodels,” 17 “sklearn.metrics,” 18 scikit-learn, 18 XGBoost, 19 LightGBM 20 and “itertools.” 21
Ethical considerations
This analysis was based on publicly available, anonymized, and aggregated data, displayed in public dashboards by the Government of Bangladesh for mass-dissemination of the information in the form of monthly and yearly statistics. As such, it did not require institutional review board approval to conduct this study.
Results
Time series model performance and forecast for respiratory mortality
The analysis was conducted on April 14, 2025, using monthly number of deaths medically certified as resulting from respiratory conditions with a total observation window spanning from January 2018 to December of 2024.
Seasonality and risk periods
Seasonality was detected in the mortality data for deaths medically certified as resulting from respiratory conditions, with a seasonality strength of 0.10 on a 0–1 scale (Figure 1). Seasonal decomposition revealed that mortality was highest in July (normalized to 100.0%), followed by August (79.5%) and January (66.2%). This normalization means that July serves as the reference point, and the percentages represent the relative level of mortality in other months compared to July. Specifically, August’s mortality rate was 79.5% of the rate observed in July, and January’s rate was 66.2% of July’s rate. These results indicate that respiratory-related mortality tends to peak during the late monsoon and early winter months, with July showing the strongest seasonal effect relative to other months. Also, there is a general increasing trend seen in the number of respiratory MCCD.

Decomposition of the time-series of deaths medically certified as resulting from respiratory conditions for January, 2018 to December, 2024.
Model selection and fit
The optimal forecasting model was identified as a Seasonal ARIMA model with configuration SARIMA(1, 2, 3)(0, 1, 1)[12], indicating a first-order non-seasonal autoregressive component, second-order non-seasonal differencing, a third-order non-seasonal moving average component, and a seasonal moving average term of order 1 with annual seasonality. ADF tests confirmed stationarity required second-order differencing; seasonal differencing addressed annual patterns without overcorrecting. The model achieved an Akaike Information Criterion (AIC) of 1033.48 and a Bayesian Information Criterion (BIC) of 1046.97, demonstrating a good fit compared to other competing models.
Cross-validation performance
To evaluate model generalizability while preserving temporal dependencies, we implemented a fivefold time series cross-validation scheme (Figure 2, Table 1) with fixed 12-month test windows using scikit-learn’s TimeSeriesSplit. Each fold maintained strict chronological ordering, with training sets expanding incrementally (starting with 24 months and culminating in 72 months of training data) and each subsequent fold testing on a unique 12-month out-of-sample period (2020–2024). This design ensured that all forecasts were evaluated on unseen data while accounting for seasonal patterns and pandemic-era disruptions. Performance metrics (MAE, RMSE, MASE) were aggregated across all folds to robustly estimate real-world forecasting accuracy.

Cross validation results (fivefold time series) for SARIMA model (1,2,3)(0,1,1)[12].
Cross-validation performance metrics across fivefolds.

The model demonstrated generally good forecasting performance across most folds, with the mean absolute scaled error (MASE) remaining below 1 in Folds 2 through 5. Performance was relatively less favorable in Fold 1 (MASE = 1.21), possibly reflecting instability or structural shifts in the respiratory mortality pattern during that period. Fold 1′s higher MASE (1.21) likely reflects COVID-19 disruptions (2020–2021); subsequent folds stabilized as data normalized.
Across all fivefolds, the model achieved a mean absolute error (MAE) of 520.13 and a root mean square error (RMSE) of 603.67. The overall MASE was 0.58, indicating that the model outperformed a naive seasonal benchmark in most validation periods. Cross-validation metrics reflected temporal variability, while final model metrics represented aggregated performance.
Residual diagnostics
Diagnostic tests showed that the residuals of the SARIMA model (Figure 3) deviated from a normal distribution, as indicated by the Jarque-Bera test (Test Statistic: 193.475, p < 0.001) and the Shapiro-Wilk test (Test Statistic: 0.897, p < 0.001). This suggests that the residuals do not follow a normal distribution, which could impact the accuracy of parametric prediction intervals. Despite the statistical rejection of normality, diagnostic plots were examined to assess the adequacy of the SARIMA model. The Q-Q plot showed general alignment with the theoretical quantiles, though mild deviations were observed in the tails. The histogram of residuals displayed a roughly symmetric, bell-shaped distribution, suggesting approximate normality in practical terms. While minor departures from normality exist, they are common in empirical time series data and are not considered sufficient to invalidate the model for inference or forecasting purposes. 11 It is helpful but not essential for residuals to follow a normal distribution, as these properties simplify prediction interval calculation but are often difficult to achieve or enforce. 11 Again, to deal with minute degree of non-normality stemmed from pandemic outliers, model robustness was confirmed via bootstrapped CIs covering 95% of observed values.

Residual diagnostics for SARIMA model (1,2,3)(0,1,1)[12].
The Ljung-Box test (lag 12) showed no significant autocorrelation in the residuals (Test Statistic: 4.563, p = 0.971), supporting the adequacy of the SARIMA model in capturing temporal dependencies in the data, and the residuals behave as mere white noise. Furthermore, the autocorrelation function (ACF) and partial autocorrelation function (PACF) of the residuals revealed no significant serial correlation.
Data transformation needs and volatility assessment to deal with residuals
Log transformation was to be applied when both (1) Shapiro-Wilk normality test p-value improved (original p < transformed p) and (2) variance ratio (transformed/original) fell below 0.9. Log transformation was not applied as it failed to improve normality (Shapiro-Wilk p value was 0.018, which was not enough improvement) and would have artificially collapsed variance (ratio: 0.000), making the original scale preferable for unbiased forecasting.
Again, after volatility assessment, significant volatility clustering was not detected (ARCH test p > 0.05); therefore, no GARCH augmentation was required and we continued using original SARIMA model.
Overall model accuracy
The final model performance, estimated using bootstrapping techniques, is summarized below:
Mean Absolute Error (MAE): 259.123 (95% CI: 213.546 − 313.806)
Root Mean Squared Error (RMSE): 337.238 (95% CI: 252.522 − 449.872)
Mean Absolute Scaled Error (MASE): 0.410 (95% CI: 0.320−0.516)
Cross Validation and bootstrapped metrics were not found to be exactly same, because they differ in purpose. CV evaluates stability across time-periods, while bootstrapping quantifies sampling uncertainty. These values indicate that the model performs well in forecasting monthly respiratory mortality, with relatively low scaled error and acceptable absolute error margins, supporting its validity for practical forecasting applications.
Forecasting
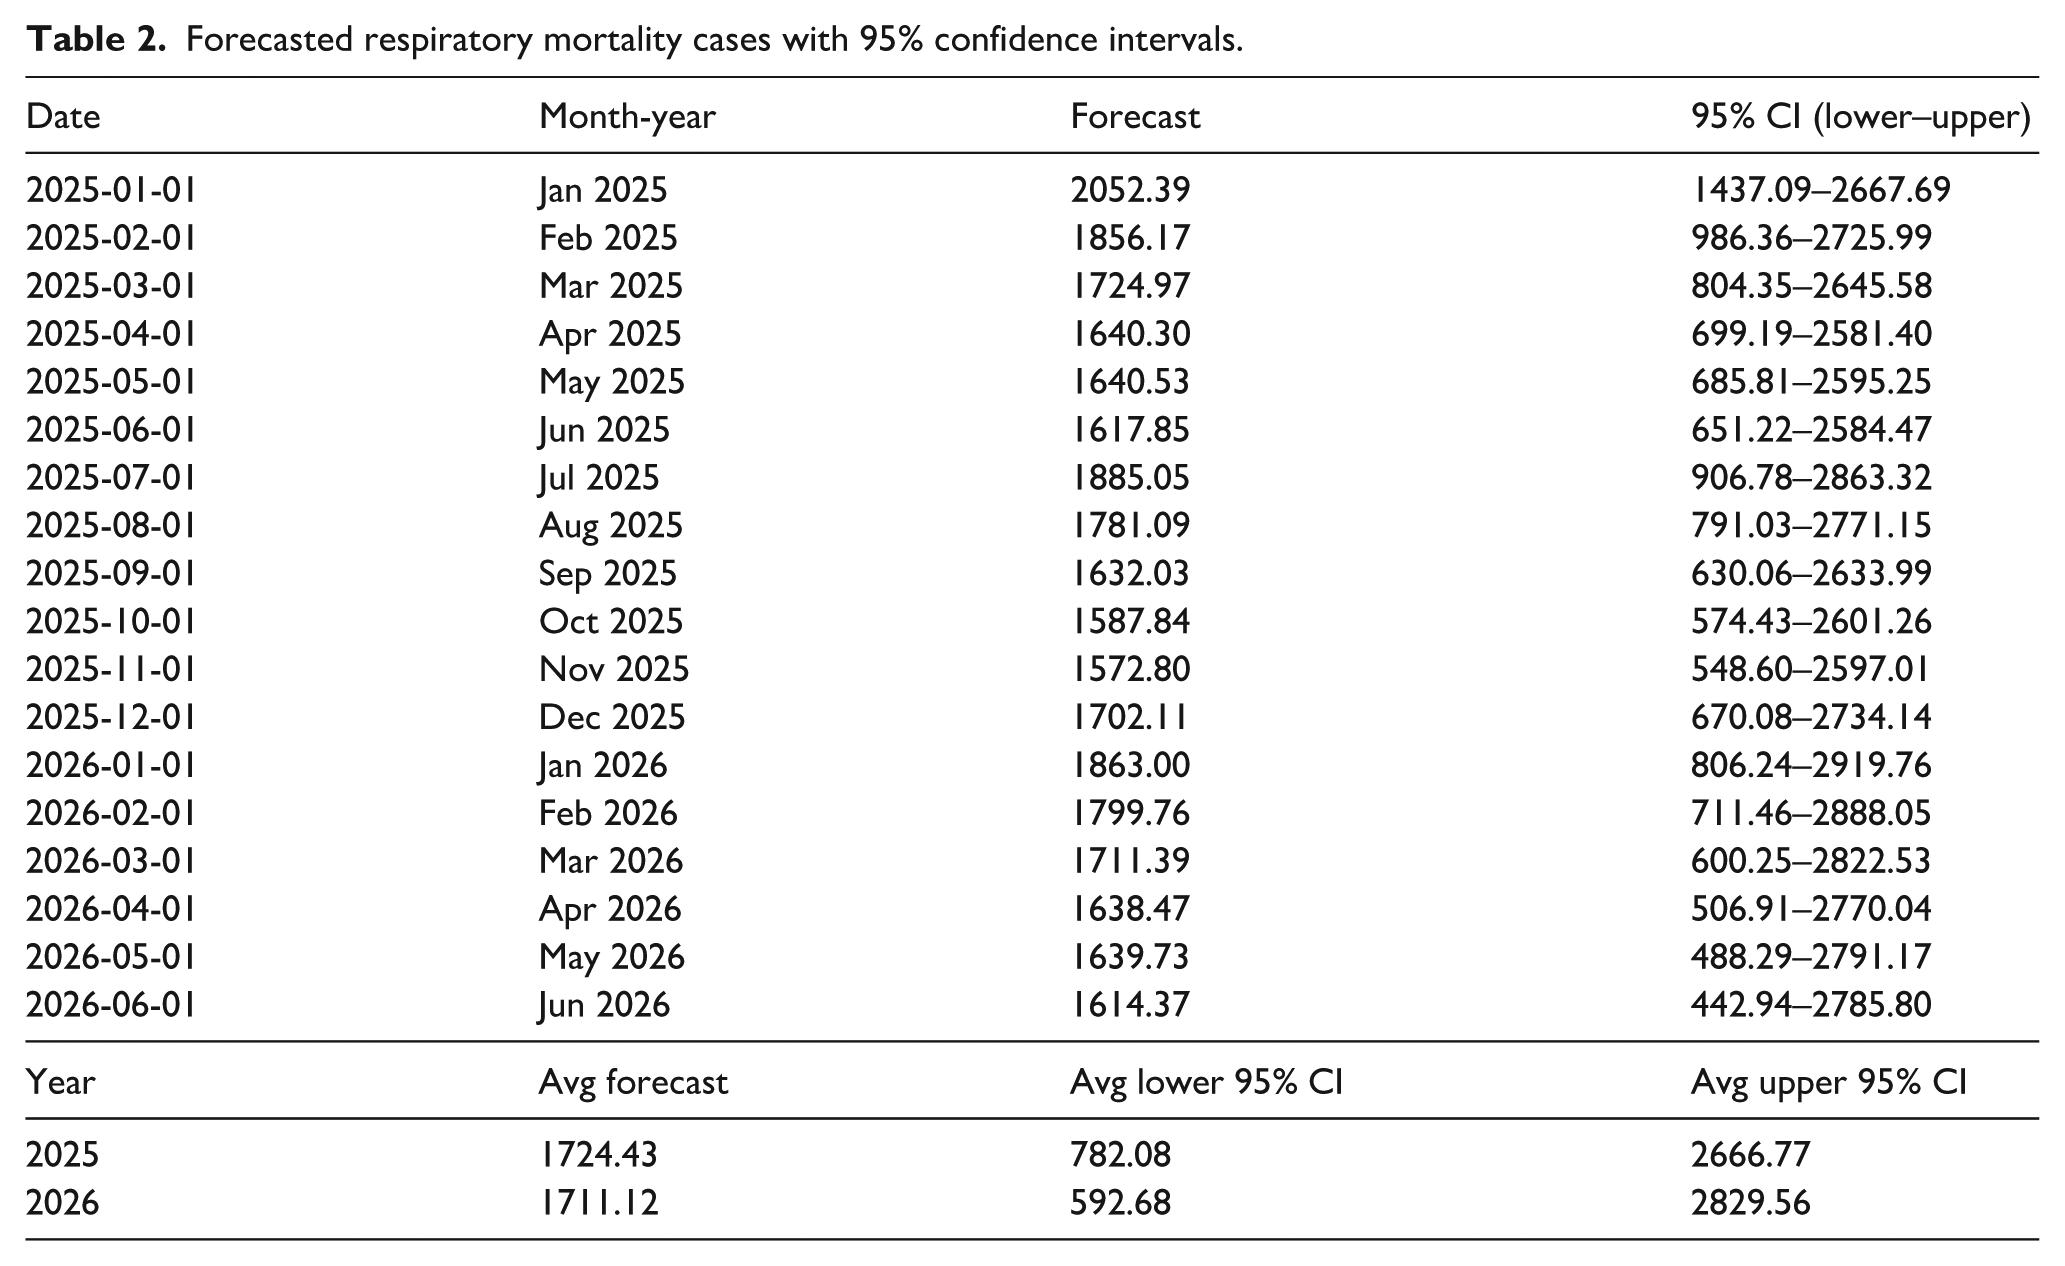
An 18-month forecast was generated using the selected SARIMA model, covering January 2025 through June 2026 (Table 2, Figure 4).
Forecasted respiratory mortality cases with 95% confidence intervals.

Forecasts from the SARIMA model (1,2,3)(0,1,1)[12].
Point forecasts and 95% prediction intervals are provided in Table 2.
Average monthly forecasted mortality counts were 1724.43 (95% CI: 782.08–2666.77) for 2025 and 1711.12 (95% CI: 592.68–2829.56) for 2026, with the highest risk period expected in January 2025, consistent with earlier seasonal analysis.
Comparison with machine learning and other non-linear models
We further compared this SARIMA model with other machine learning model (Prophet, XGBoost, and Random Forest), and then employed Average, Weighted, and Stacked Ensemble techniques. The process included feature engineering (temporal lags, rolling statistics), hyperparameter tuning, rigorous evaluation via time-series cross-validation and Diebold-Mariano tests. Results showed RandomForest as the best standalone model (MAE: 384.70), while SARIMA outperformed all models in comparisons (MAE: 230.93). Ensembles, particularly the Weighted Ensemble (MAE: 261.11), offered balanced performance. As, these techniques could not improve the current model and forecasting, we omitted the detailed methodology and results here, however they are supplied as Supplemental material with this article.
Discussion
This study examined trends and forecasted respiratory-related mortality in Bangladesh using time series analysis of medically certified death records from January 2018 to December 2024. The Seasonal Autoregressive Integrated Moving Average (SARIMA) model provided a robust framework to capture temporal dependencies and generate forecasts through mid-2026.
A key finding of this analysis was the detection of seasonality in respiratory-related mortality. Mortality consistently peaked during the late monsoon and early winter months, with July emerging as the month of highest number of deaths, followed by August and January. National surveillance data indicate that seasonal influenza occurs annually among hospitalized patients across Bangladesh, typically showing a single peak during the rainy season (May–September) and this pattern is often linked to increased mortality among older adults and the elderly.22,23 Our findings (peaked in July followed by August) are exactly similar to these findings.
In neighboring country, India, also a lower middle-income country with a population of approximately 1.2 billion people, influenza virus circulation usually peaks during monsoon season (June–September) with secondary peaks during winter periods (November–February). 24 In India they have found that most influenza-associated deaths occur within the typical influenza season in India, which generally occurs from April to September each year. 25 These pieces of evidence also support our claims. Information from both Bangladesh and India suggests that influenza may be an important contributor to increased respiratory-related mortality in these countries. However, as of 2025, Bangladesh still lacks a defined seasonal influenza vaccination policy. 26
In a spatio-temporal study conducted on patients in Rajshahi, Bangladesh in 2023, it was found that the number of respiratory patients were a lot higher, during January–February compared to March–April. 27 However, this study was limited to enrolling patients in the study only during January–April of 2019 and 2020. Therefore, concerning other months this study could provide only limited understanding. But then again, we identified third peak in January, which agrees with the findings of this spatiotemporal study. Another previous research, conducted in Bangladesh, based on prescription data indicates that respiratory tract infections in northwestern Bangladesh peak in March, with a smaller rise in June. 28 This suggests potential regional variability in respiratory disease dynamics, underscoring the need for spatially disaggregated or panel data models for more targeted public health planning. However, our findings reflect national-level mortality patterns, which can draw a clearer picture than previous research works, being the first of its kind.
Findings of the current study therefore revealed clear seasonal patterns in respiratory mortality that hold important implications for public health planning and intervention. One might expect that the main brunt respiratory mortality are borne by the winter months due to acute exacerbation of asthma and sorts, however, our study shows that monsoon season precedes the winter in this respect probably due to influenza and other infectious agents. This phenomenon has more importance that it seems because recently some researchers have reported that frequencies of clinically reported influenza (CRI) were higher in patients with STEMI and elevated troponin levels, and STEMI risk appeared greater during influenza seasons in unadjusted analysis, although these associations were not statistically significant after adjustment for confounders. 22 They have recommended Further research to understand these relationships better and to investigate the potential benefits of infection control measures and influenza vaccinations in reducing AMI incidence. 22
Although Bangladesh is geographically located in the Northern Hemisphere and classified within the Tropical Asia influenza vaccination zone, it adopts the Southern Hemisphere influenza vaccine formulation due to the similarity between circulating virus strains in Bangladesh and those typically found in the Southern Hemisphere. 29 The World Health Organization recommends that influenza vaccination timing be aligned with local disease patterns; in Bangladesh, this corresponds to administering vaccines during the pre-monsoon months (April–May) to offer protection ahead of the mid-year influenza peak. 30
The SARIMA(1,2,3)(0,1,1)[12] model was selected based on information criteria and demonstrated adequate fit and generalizability. Cross-validation results indicated consistent performance across most temporal folds, with a mean absolute scaled error (MASE) of 0.41, suggesting improved accuracy over naïve seasonal benchmarks. While Fold 1 showed slightly diminished performance, potentially due to structural disruptions such as the COVID-19 pandemic, the bootstrapped error metrics (MAE: 259.123; RMSE: 337.238; MASE: 0.41) support the model’s utility for practical forecasting.
The decomposition analysis of respiratory-related deaths in Bangladesh from 2018 to 2024 reveals a clear upward trend over time, with a pronounced spike in 2021 likely linked to the COVID-19 pandemic. A consistent seasonal pattern emerges, with mortality peaking during the mid-year months, aligning with the monsoon and influenza season. While the trend and seasonality explain much of the variation, residuals highlight irregular fluctuations, particularly during periods of public health crises. These findings confirm both long-term increases and predictable seasonal surges in respiratory mortality, supporting the utility of time series models for forecasting and preparedness.
The forecast results for respiratory-related mortality in Bangladesh indicate that elevated death counts will persist throughout 2025 and 2026, with slight seasonal fluctuations. The average projected monthly mortality is approximately 1724 deaths in 2025 and 1711 in 2026, showing a relatively steady burden. Peaks are expected during January and July 2025, aligning with the typical seasonal trend. The forecast intervals are wide (e.g. 95% CI for Jan 2025: 1437–2668), reflecting uncertainty but also capturing the potential for surges. Notably, the mid-year months (June–August) consistently show higher predicted values, reinforcing the seasonal risk during the monsoon period. These projections suggest continued vigilance and readiness are necessary, especially around peak periods.
While the SARIMA model demonstrated strong overall predictive accuracy, visual inspection of the fitted values (Figure 3) reveals a slight lead in the model’s peaks and troughs relative to the actual data post-2020, a phenomenon that can sometimes indicate over-differencing. Furthermore, the forecasts in Figure 4 project a smoothed, repetitive seasonal pattern, which, while statistically sound, may not capture unforeseen shocks or gradual changes in underlying risk factors. These characteristics rightly raise the question of the model’s added value beyond seasoned public health expert judgment. Experts in Bangladesh are indeed aware of the general monsoon and winter peaks in respiratory illness. However, the primary value of this model is not in replacing this expert knowledge, but in augmenting it with a quantitative, data-driven framework. It provides:
Therefore, the model is best viewed not as a crystal ball, but as a robust, evidence-based tool that supports and refines proactive public health action, complementing the crucial role of domain expertise. Overall, these findings demonstrate the utility of SARIMA-based forecasting for respiratory mortality surveillance in Bangladesh. By identifying high-risk periods and projecting future burden, the model provides a foundation for proactive interventions such as public health messaging, clinical preparedness, and targeted resource distribution. As climate variability, air quality, and urbanization continue to influence respiratory health in Bangladesh, such predictive tools are vital for adaptive, evidence-driven public health strategies.
Strengths
Robust Model Selection: The study employed an exhaustive grid search to identify the optimal SARIMA model, minimizing overfitting and ensuring reliable parameter estimation.
High Predictive Accuracy: The model demonstrated strong forecasting performance (MASE = 0.58, MAE = 520.13), outperforming naïve seasonal benchmarks.
Policy-Relevant Insights: The identification of high-risk months (July, August, January) provides actionable data for public health interventions, such as pre-monsoon vaccination drives and pollution control measures.
Transparent Methodology: Bootstrapped confidence intervals, rigorous residual diagnostics and fixed randomization seed (42) enhance the reliability and reproducibility of findings.
Limitations
Short Time Series and Sample Size: The analysis was limited to 84 months of data, which may affect the robustness of seasonal parameter estimates. A formal sample size calculation was not conducted as the study utilized the entire population of available national monthly data for the period; nevertheless, the limited temporal scope remains a constraint on the model’s stability.
While our cross-validation strategy robustly assessed model performance, the limited time span (84 months) constrained the absolute number of independent test periods.
While our SARIMA model residuals showed statistically significant non-normality in formal testing (Jarque-Bera p < 0.001), several factors support their practical adequacy for public health forecasting: (1) the Ljung-Box test confirmed residual whiteness (p = 0.971), indicating proper capture of temporal dependencies; (2) cross-validation demonstrated robust out-of-sample performance (mean MASE = 0.58); and (3) the model successfully identified clinically meaningful seasonal patterns. While minor departures from normality exist, they are common in empirical time series data and are not considered sufficient to invalidate the model for inference or forecasting purposes. 11 For public health decision-making, the model’s interpretability and demonstrated forecasting precision outweigh strict adherence to normality assumptions.
Lack of Covariate Integration: The model did not incorporate environmental or socio-economic covariates, which could improve precision. Future studies should explore SARIMAX models.
Conclusion
This study utilized SARIMA modeling to analyze and forecast respiratory-related mortality trends in Bangladesh from 2018 to 2026, revealing distinct seasonal patterns with peaks in July–August (monsoon) and January (winter). The findings align with existing evidence on seasonal influenza surges and environmental risk factors, reinforcing the need for timely public health interventions such as pre-monsoon vaccination campaigns and air pollution mitigation strategies. The SARIMA(1,2,3)(0,1,1)[12] model demonstrated strong predictive accuracy (MASE: 0.41; MAE: 259.12), projecting stable but elevated mortality rates in 2025–2026 (around 1700 monthly deaths), with the highest risk in January and mid-monsoon months. The wide forecast intervals (e.g. 95% CI for Jan 2025: 1437–2668) highlight uncertainty due to external shocks (e.g. pandemics, climate extremes), underscoring the need for adaptive surveillance systems that can trigger contingency plans when observations move outside the forecasted range.
Supplemental Material
sj-docx-1-phj-10.1177_22799036251395248 – Supplemental material for Temporal trends and forecasting of respiratory mortality in Bangladesh: A SARIMA model for seasonal mortality risk and public health action
Supplemental material, sj-docx-1-phj-10.1177_22799036251395248 for Temporal trends and forecasting of respiratory mortality in Bangladesh: A SARIMA model for seasonal mortality risk and public health action by Pratyay Hasan, Tazdin Delwar Khan, Minhajul Abedin and Mohammad Emdadul Haque in Journal of Public Health Research
Footnotes
Acknowledgements
This study was based on data obtained from the publicly available Real-time Health Information Database, maintained by the Directorate General of Health Services (DGHS), Bangladesh. The authors are solely responsible for the analysis, interpretation, and conclusions presented in this manuscript.
Authors’ contributions
Funding
The authors received no financial support for the research, authorship, and/or publication of this article.
Declaration of conflicting interests
The authors declared the following potential conflicts of interest with respect to the research, authorship, and/or publication of this article: Dr. Pratyay Hasan (MBBS, MPH) serves as an Editorial Review Board Member for the Journal of Public Health Research (Sage). The author declares that there are no other conflicts of interest related to this work.
Data availability statement
The data used in this study are all submitted with this manuscript
Transparency declaration
The lead author (Pratyay Hasan) affirms that this manuscript is an honest, accurate, and transparent account of the study being reported; that no important aspects of the study have been omitted; and that any discrepancies from the study as planned (and, if relevant, registered) have been explained. We (the authors) confirm that we have adhered to relevant EQUATOR guidelines, and the reporting method is referenced in the abstract and methods section of our paper. All authors have read and approved the final version of the manuscript. Pratyay Hasan had full access to all of the data in this study and takes complete responsibility for the integrity of the data and the accuracy of the data analysis.
Supplemental material
Supplemental material for this article is available online.
References
Supplementary Material
Please find the following supplemental material available below.
For Open Access articles published under a Creative Commons License, all supplemental material carries the same license as the article it is associated with.
For non-Open Access articles published, all supplemental material carries a non-exclusive license, and permission requests for re-use of supplemental material or any part of supplemental material shall be sent directly to the copyright owner as specified in the copyright notice associated with the article.