
Abstract
Background:
Insulin resistance (IR) is a key driver of type 2 diabetes mellitus and cardiovascular diseases. Traditional methods for IR diagnosis are costly, highlighting the need for accessible alternatives like anthropometric indices. However, their accuracy in developing countries remains underexplored. This study aimed to assess the diagnostic accuracy of anthropometric indices for assessing IR and to analyze the association of key anthropometric variables with IR in a Peruvian population.
Design and methods:
A cross-sectional analysis was conducted on 908 participants from the PERU MIGRANT cohort. IR was defined using the Homeostatic Model Assessment for Insulin Resistance. Anthropometric indices, including waist circumference (WC), skinfold measurements, and fat mass index (FMI), were evaluated. Diagnostic accuracy was assessed using ROC curves. Subsequently, adjusted logistic regression models were used to assess the association between key anthropometric indices and IR.
Results:
FMI exhibited the highest diagnostic accuracy (AUC: 0.80; 95% CI: 0.75–0.84 in women, 0.81; 95% CI: 0.74–0.87 in men), with high sensitivity (>80%) and specificity (>70%) for both sexes. Sex-specific FMI cut-offs were 11.70 kg/m2 for women and 7.52 kg/m2 for men. Adjusted logistic regression revealed strong associations with IR: FMI in men (OR: 11.70; 95% CI: 4.37–31.31) and upper limb skinfold in women (OR: 4.25; 95% CI: 1.84–9.79).
Conclusion:
FMI and upper limb skinfold are reliable anthropometric measures for assessing IR in the Peruvian population. These findings support their application in public health interventions aimed at early IR detection, especially in resource-limited settings.
Introduction
Insulin resistance (IR) is a pathological condition characterized by a reduced biological response to insulin in target tissues, such as skeletal muscle, adipose tissue, and the liver. 1 This dysfunction disrupts glucose and lipid homeostasis, leading to compensatory hyperinsulinemia and metabolic disturbances. 1 Furthermore, IR clinical relevance lies in its central role in the pathogenesis of type 2 diabetes mellitus (T2DM),2,3 cardiovascular diseases, and nonalcoholic fatty liver disease, 4 and certain types of cancer, including colorectal 5 and endometrial cancer 6 ; conditions that collectively contribute significantly to global morbidity and mortality. Although the causal relationship between IR and T2DM remains debated, IR is widely recognized as preceding hyperglycemia, underscoring its clinical importance as an actionable marker for identifying individuals at risk.2–4
The hyperinsulinaemic–euglycaemic clamp (HEC) technique is considered the gold standard for assessing IR. However, this method is impractical for routine use due to its complexity and cost. 7 The Homeostatic Model Assessment for Insulin Resistance (HOMA-IR) is a surrogate measure of insulin sensitivity that offers a simpler and more practical alternative and is highly correlated to HEC. 8 Nevertheless, as this measure requires both glucose and insulin fasting blood samples, its applicability in resource-limited settings may be constrained. Conversely, anthropometric measurements such as body mass index (BMI), waist circumference (WC), skinfolds among other specific body composition indicators provide non-invasive, cost-effective tools that are easier to implement in both clinical and epidemiological contexts, particularly in resource-constrained settings.
Previous studies have explored the association between BMI, WC, and other anthropometric indicators with the HOMA-IR index, primarily in Asian and Caucasian populations9–11 However, as IR varies across ethnicities, 12 population-specific data are crucial for accurate risk stratification, especially in high-risk groups such as the Latin American population.13,14 Despite this need, data on Latin Americans remain limited. Furthermore, other anthropometric indicators including fat mass index, fat mass percentage, and fat-to-lean mass ratio, could provide a more nuanced assessment of body composition15,16 yet their utility for evaluating IR has not been thoroughly explored.
The primary objective of this study was to assess the diagnostic accuracy of various anthropometric indices for identifying IR in a Peruvian population. Additionally, we aimed to identify and assess the association of key anthropometric indexes and IR that could inform public health strategies and clinical decision-making in resource-limited settings.
Design and methods
Study design
This analytical, cross-sectional study used data from the PERU MIGRANT cohort study collected from November 2007 to April 2008.
Population and sample
The PERU MIGRANT study enrolled participants of both sexes aged 30 years and above, excluding individuals with a history of mental illness or those who were currently pregnant, and residing in Peru. Participants were recruited from both rural and urban settings using a single-stage random sampling method based on the 2006 and 2007 censuses. Rural residents were selected from San Jose de Secce, Huanta, Ayacucho, while urban residents and rural-to-urban migrants were chosen from Las Pampas de San Juan de Miraflores, Lima. Migrants were defined as individuals born in Ayacucho who had resettled permanently in Las Pampas de San Juan de Miraflores at the time of data collection, while urban participants were those born and continuously residing in this urban area. Comprehensive details on eligibility criteria, variables assessed, sampling procedures, and response rates have been previously described in the original study protocol. 17
For the present study, participants without glucose-impaired metabolism were included (n = 930). A fasting glucose ≥ 126 mg/dL or glycosylated hemoglobin ≥6.5% or Type-2 diabetes mellitus diagnosed by a physician was the criterion for defining glucose-impaired metabolism. Those with missing data on any of the variables of interest were excluded (n = 22). Finally, data from 908 participants were analyzed.
Variables and measurements
Outcome variable
The main outcome variable was insulin resistance (IR). IR was defined using the Homeostatic Model Assessment Index (HOMA-IR) as the clinical reference standard considering its wide use in the epidemiological field. 18 HOMA-IR was computed as [Glucose (mmol/L) * Insulin (uU/L)]/22.5 18 and a cut-off ≥ 2.80 was chosen for IR diagnosis as previously reported in the Peruvian population. 19
Index tests
Various anthropometric indicators were assessed as index tests. These tests were based on waist circumference, and skinfold thickness measurements as well as DXA regression equations. Different cut-off values by sex and for each anthropometric index test were analyzed. Then using the specific cut-off values obtained, each index test was dichotomized as high or low separately according to sex. All anthropometric indexes tested are shown in Table 1.
Various anthropometric indexes tested for insulin resistance diagnosis.

Laboratory measurements
All laboratory assessments were performed by trained personnel. Morning venous blood samples were obtained following a minimum fasting period of 8 hours. Plasma glucose and whole blood insulin concentrations were subsequently analyzed to determine fasting glucose and insulin levels, respectively. 17
Anthropometric measurements
Waist circumference (WC) was measured with a precision of 1 mm, at the midpoint between the lower rib and the iliac crest using an anthropometric tape (SECA 201). Height was measured with a precision of 0.1 cm using a stadiometer and standard stools and with the participant in the Frankfurt plane. Weight was recorded with a precision of 0.05 kg, considering the individual lightly dressed, using an electronic scale (SECA model 940).
All skinfolds were measured three times and recorded in millimeters by the same trained fieldworker using a Holtain Tanner/Whitehouse Skinfold Caliper calibrated to the nearest 0.2 mm. 20 The protocol measurement procedure began by firmly grasping the skinfold between the thumb and index finger to include all subcutaneous fat layers. The skinfold caliper, held in the right hand, was applied approximately 1 cm distal to the pinch site. Once correctly positioned, the observer released the right-hand fingers, allowing the caliper to exert full pressure, while maintaining the fold with the left hand. The caliper remained in place for 2 s prior to each reading to ensure consistency. All skinfolds were measured in a circuit, and repeated three times, ensuring consecutive measurements were not of the same skinfold to prevent potential bias or errors. The mean value of the three measurements of each skinfold was computed for the following estimations. Specific anatomical landmarks guided skinfold placement were as follows:
Tricipital: Measured at the midpoint between the acromion and olecranon on the posterior triceps muscle surface, with the arm relaxed, slightly flexed, and the palm facing forward. The measurement was taken approximately 1 cm above the marked reference point.
Bicipital: Assessed on the anterior arm surface at the same height as the triceps skinfold.
Subscapular: Measured with the individual standing upright, back exposed, and arms at ease by their sides. The fold was taken at a slightly oblique angle, approximately 1 cm below the inferior angle of the right scapula.
Supra spinal: Located 2 cm above the left iliac crest, along the mid-axillary line.
Anthropometric indicators fat mass and lean mass, were estimated using DXA regression equations previously validated regression equations. These models included sex, age, weight, height, and waist circumference as predictor. 21 The equations demonstrated high predictive capacity, with a coefficient of determination (R2) of 0.91 and 0.85 for lean mass in men and women, respectively. As described by Lee et al., 21 lean body mass excluded bone mineral density content, total fat mass, and total percent fat. The coefficient of determination for fat mass prediction was 0.90 in men and 0.93 in women, respectively. 21 The fat mass index (FMI) was computed as the fat mass (kg) divided by the squared height, while the fat mass percentage (FMP) was calculated by dividing the fat mass (kg) by the participant weight (kg) and multiplying by 100. Finally, the fat-to-lean mass ratio (FLMR) was computed as the quotient between the fat mass (kg) and the lean mass (kg). The standardization of anthropometric measurements involved calculating the average of all observations by the same observer. Monthly standardization sessions, conducted before the study commenced, required each fieldworker to measure a minimum of 10 subjects in duplicate. This index was assessed considering previous findings of the association with cardiometabolic abnormalities. 15
Covariates included age (years), migration status (urban, rural, or migrant), current smoking status (yes vs no), alcohol consumption (high vs low), physical activity level (low, moderate, or high), educational level (none/incomplete primary, complete primary, incomplete/complete secondary), and wealth index (lowest, middle, and highest). Migration status was categorized at baseline according to participants’ place of origin and residence, and classified as rural, migrant, or urban. Smoking and alcohol consumption were reported using a piloted and culturally adapted Spanish version of the WHO STEPS questionnaire,17,22 while physical activity levels were defined following the International Physical Activity Questionnaire (IPAQ) short form.23,24 Alcohol consumption was categorized based on participants’ responses to the question: “In the past 12 months, how often have you consumed six or more drinks on a single occasion?” allowing identification of patterns of heavy episodic drinking. Those reporting this behavior at least once per month were classified as having “high” alcohol consumption (Supplemental material).
Statistical analysis
STATA v17.0 was used for all analyses. Participants with missing data for any variables of interest were excluded from the analysis. Descriptive analyses were presented as absolute frequencies and percentages for categorical variables and median and interquartile ranges for numerical, not normally distributed variables. Differences in frequency distribution between the participants’ characteristics and sex were conducted using a Chi-squared test for categorical variables and the Mann–Whitney test for numerical variables, respectively. The diagnostic accuracy of each anthropometric index was assessed using receiver operating characteristic (ROC) curves calculating the area under the curve (AUC) and its corresponding 95% confidence intervals (CI). The ROC curves were stratified according to sex. Sensitivity, specificity, positive and negative predictive values, as well as positive and negative likelihood ratios, were calculated. The sex-specific optimal cut-off point for each anthropometric index was determined using the Youden Index.
For examining the association between the best anthropometric indexes and insulin resistance, separate forward stepwise logistic regressions were conducted stratified by sex considering p < 0.05 and p ≥ 0.10 as the threshold for including and excluding the variables from the model, respectively. All anthropometric indexes (categorized as high or low based on previously determined cut-offs), along with covariates (age, migration status, smoking, alcohol intake, physical activity level, educational level, and wealth index), were included as candidate variables in the forward stepwise logistic regression. Model performance was assessed through the Hosmer–Lemeshow test and Nagelkerke R2. Unadjusted and adjusted odds ratios (OR) with their respective 95% confidence intervals (CI) were calculated. Only variables meeting the p-value criteria were retained in the final models. The selection was fully automated, and no covariates were forced into the models. The final set of covariates varied by sex, with only educational level retained in men, and no sociodemographic variables retained in women.
Ethical considerations
Ethical approval was obtained from the Universidad Peruana Cayetano Heredia (Ethics Committee approval number 60014). Participants were provided with comprehensive information regarding the study objectives, and written informed consent was obtained prior to enrollment. The ethical standards of the Helsinki Declaration 25 were adhered to. As this study involved a secondary analysis of openly accessible data, 17 no direct participant contact occurred, and the potential for ethical risk was substantially minimized.
Results
A total of 908 participants were included in the analysis. The detailed exclusion process of the missing data on interest variables is shown in Figure 1.

Flow diagram of participant selection.
The female sex represented 52.97% of the sample. The median age was 46 years, and the median BMI was 25.95 kg/m2. IR prevalence was 15.31%. More than half pertained to the migrant group, had a secondary educational level and the wealth index was equally distributed. Smoking (11.23%) and alcohol intake (8.92%) were infrequent, while most of the participants exhibited a moderate/high physical activity level.
Table 2 presents the descriptive and bivariate characteristics of the sample according to sex and insulin resistance status. In women, migration group (p-value < 0.001) and wealth index (p-value = 0.015) were differently distributed according to IR status, while in men, migration group (p-value < 0.001), educational level (p-value = 0.010), smoking (p-value = 0.028), and physical activity level (p-value < 0.001) had a different prevalence between those with and those without IR. Notably, BMI exhibited statistically significantly different values between those with and without IR in both sexes. Similarly, all the anthropometric indexes tested followed this pattern except the trunk-to-upper limb skinfold ratio in men, which did not differ between those with and without IR.
Descriptive and bivariate characteristics of the sample according to sex and insulin resistance status.

BMI: body mass index; FLMR: fat-to-lean mass ratio; FMI: fat mass index; FMP: fat mass percentage; WC: waist circumference in cm; WHR: waist to hip ratio; WHtR: waist to height ratio.
Presented as median (pp. 25–75). Analyzed with Mann–Whitney test.
Analysis performed with the Chi-square test.
The ROC analysis revealed that the FMI had the highest AUC in both sexes for IR diagnosis (AUC: 0.80, 95% CI: 0.75–0.84 in women, and AUC: 0.81, 95% CI: 0.74–0.87 in men; Table 3). The sex-specific cut-offs for the FMI were 11.70 kg/m2 in women and 7.52 kg/m2 in men. Sensitivity was found to be higher than 80% for both sexes (Sensitivity: 85.4%, 95% CI: 77.1–91.6 for women and sensitivity: 83.3%, 95% CI: 67.2–93.6 for men). Similarly, specificity was higher than 70% for both sexes (Specificity: 73.5%, 95% CI: 66.8–77.9 for women, and specificity: 77.7%, 95% CI: 73.3–81.8 for men).
Diagnostic accuracy of the anthropometric indexes for insulin resistance diagnosis, stratified by sex.
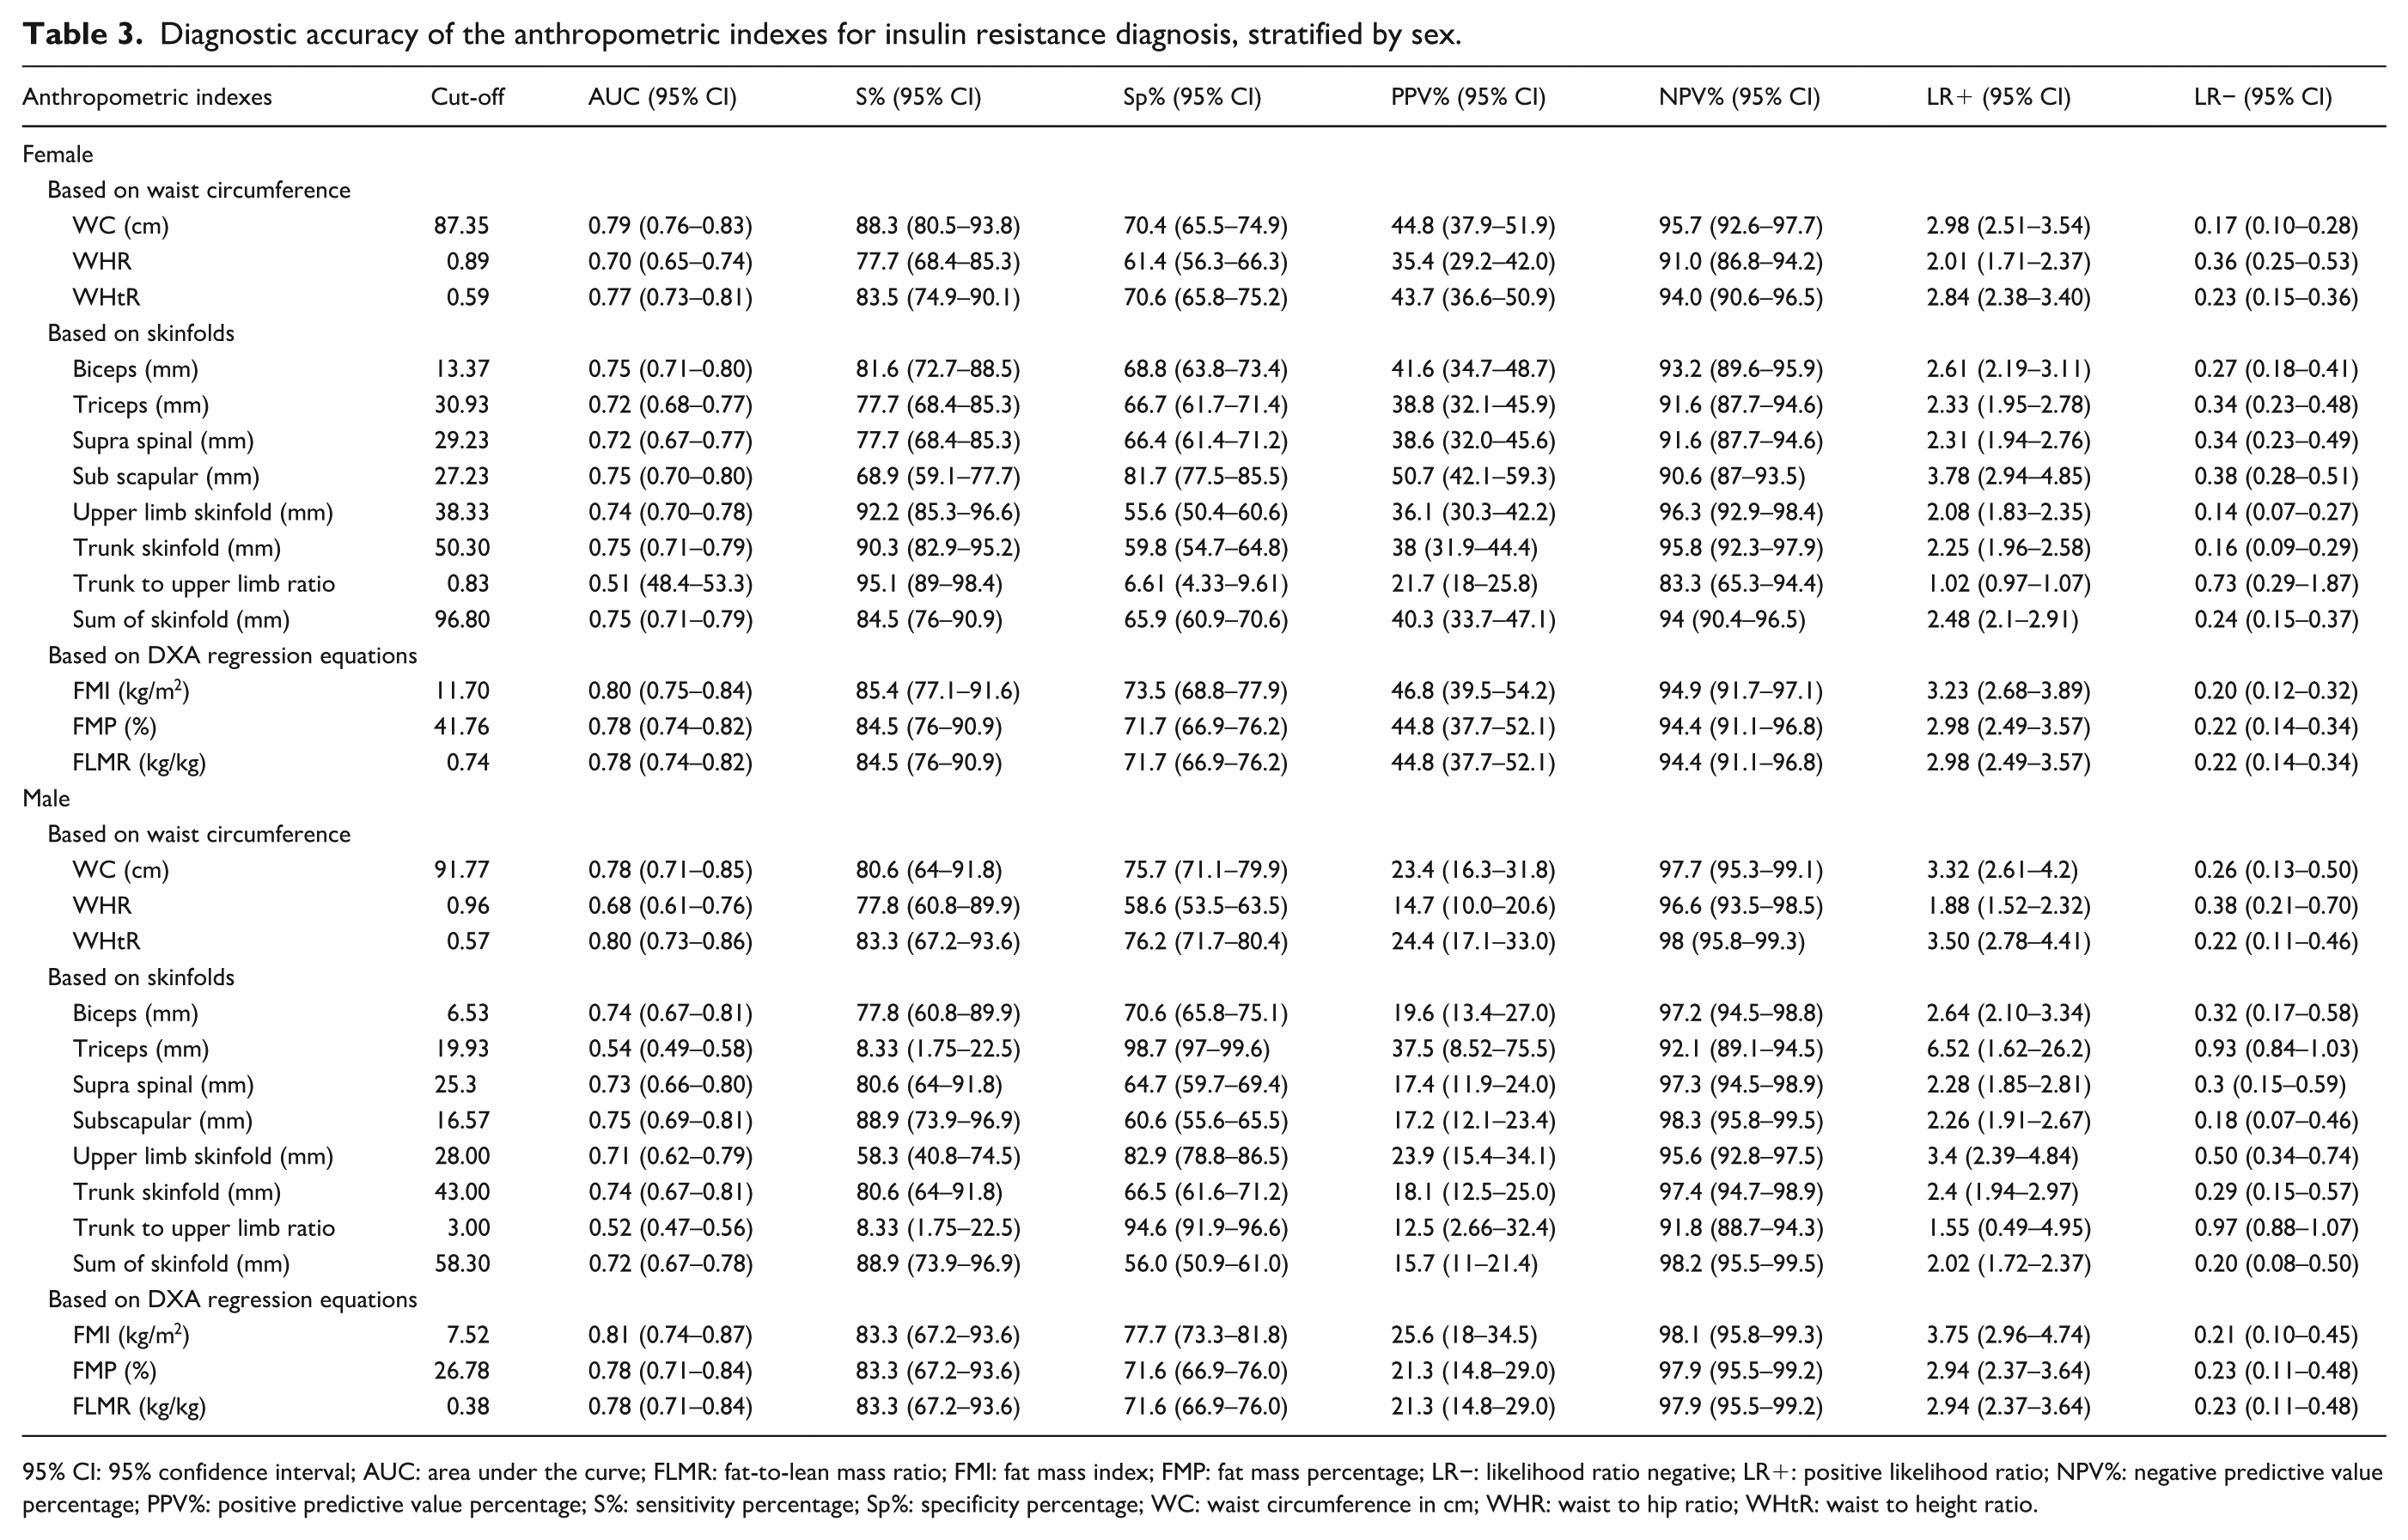
95% CI: 95% confidence interval; AUC: area under the curve; FLMR: fat-to-lean mass ratio; FMI: fat mass index; FMP: fat mass percentage; LR−: likelihood ratio negative; LR+: positive likelihood ratio; NPV%: negative predictive value percentage; PPV%: positive predictive value percentage; S%: sensitivity percentage; Sp%: specificity percentage; WC: waist circumference in cm; WHR: waist to hip ratio; WHtR: waist to height ratio.
The stepwise forward logistic regression analysis in women revealed that upper limb skinfold, WC, subscapular skinfold, and FMI were significant predictors in the model for IR (Hosmer–Lemeshow test p = 0.416, Nagelkerke R2 = 0.458). No sociodemographic covariates were retained in the final model for women. Whereas in men, subscapular skinfold, FMI, and educational level were the best predictors of the model (Hosmer–Lemeshow test p = 0.975, Nagelkerke R2 = 0.317).
Adjusted logistic regression analysis identified significant associations between IR and various anthropometric measures in women and men. Among women, high WC was associated with an odds ratio of 3.12 (95% CI: 1.24–7.85), while high subscapular skinfold thickness and high upper limb skinfold thickness were associated with odds ratios of 2.50 (95% CI: 1.40–4.48) and 4.25 (95% CI: 1.84–9.79), respectively. High FMI also showed a significant association with IR, with an OR of 3.24 (95% CI: 1.38–7.60; Table 4). In men, high subscapular skinfold thickness and high FMI were strongly associated with IR, yielding odds ratios of 3.75 (95% CI: 1.17–11.97) and 11.70 (95% CI: 4.37–31.31), respectively (Table 5).
Crude and adjusted logistic regression models for insulin resistance in female.

Adjusted by all anthropometric variables presented in the table.
Crude and adjusted logistic regression models for insulin resistance in male.
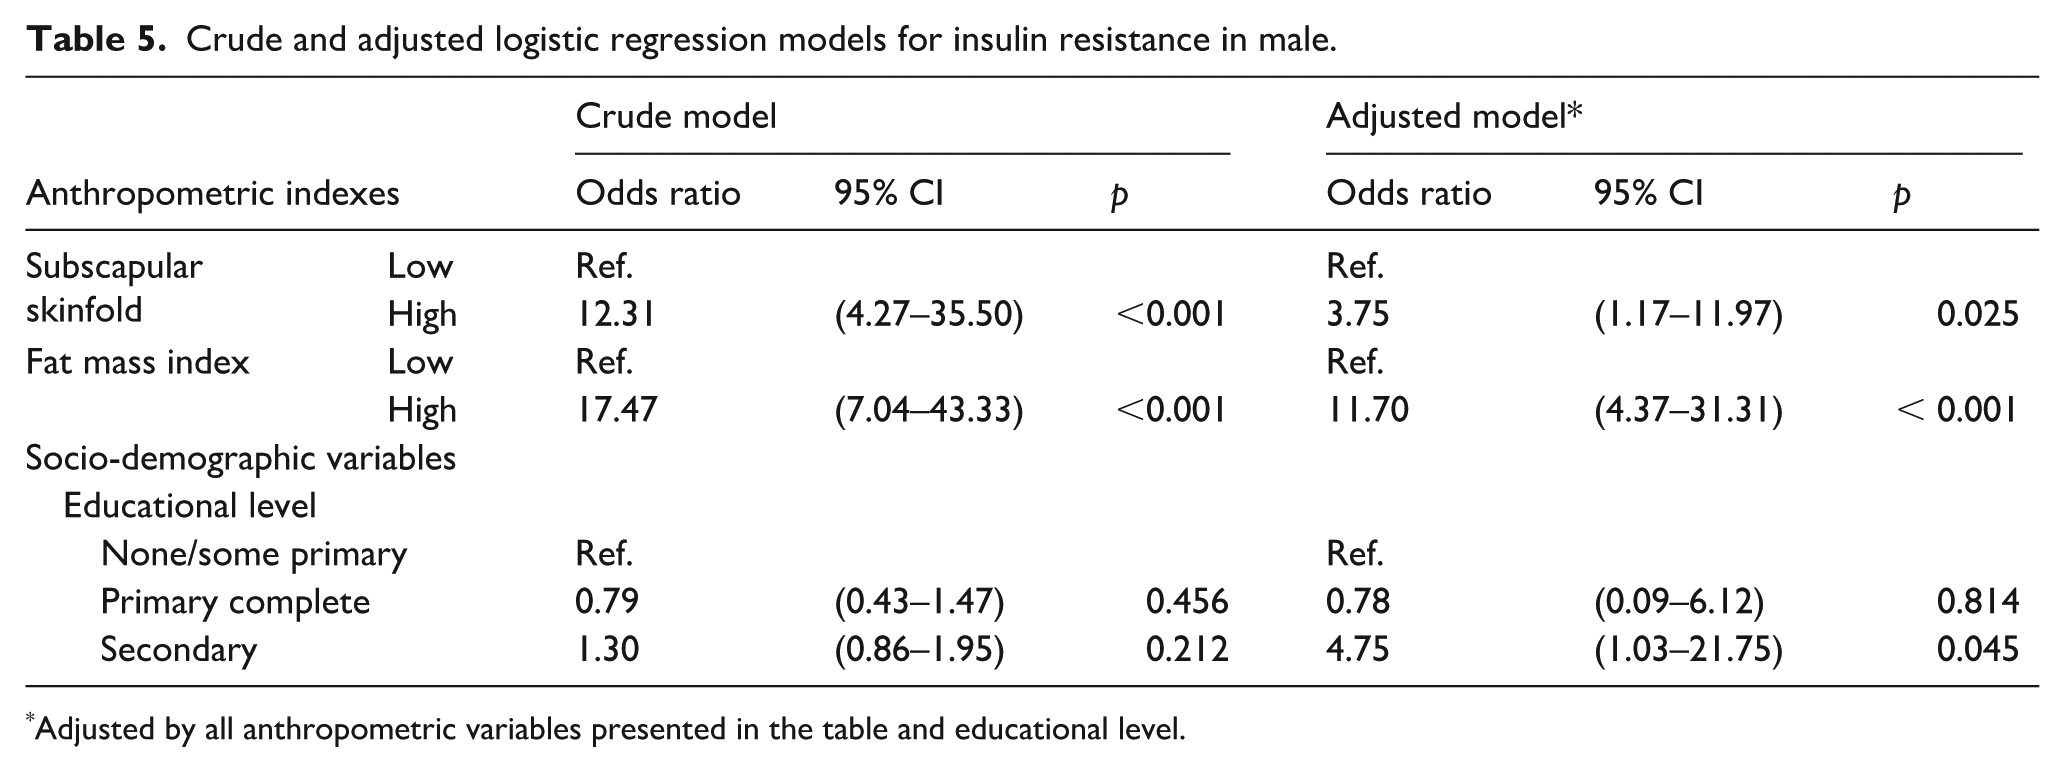
Adjusted by all anthropometric variables presented in the table and educational level.
Discussion
Main findings
The present study analyzed the diagnostic accuracy of various anthropometric measurements for IR, providing insights that extend beyond traditional indicators like BMI, which fails to differentiate between fat and lean mass. Our findings highlight the FMI as the most accurate measure, with AUC values above 0.80 for both sexes, offering robust sensitivity and specificity. Moreover, high WC, subscapular skinfold, upper limb skinfold, and FMI were significantly associated with IR with odds ratios ranging from 2.50 to 4.25. Among men, subscapular skinfold and FMI showed even stronger associations, with odds ratios of 3.75 and 11.70, respectively. These findings underscore the importance of incorporating diverse and precise anthropometric indicators tailored, allowing for a more comprehensive and tailored assessment of IR risk.
Comparison with other studies
The prevalence of IR reports contrasts among countries. The overall IR prevalence in this study was lower than reported in the USA and Mexico. Using a HOMA-IR cut-off of ≥2.5, these studies found a prevalence of 39.60% and 22.3% respectively.9,26 Also, in urban regions of Venezuela, the prevalence of IR reached 46.70%. 27 These variations may be explained by the fact that populations in different countries are undergoing distinct stages of epidemiological and nutritional transition. 28
Our study revealed some differences between men and women. Findings showed higher IR prevalence among women, this result is consistent with diabetes mellitus prevalence over the years in Peru, where a higher proportion of women have been diagnosed with this condition. 29 In addition, it is noteworthy that the highest prevalence of IR was observed in urban residents, aligned with evidence that urbanization promotes sedentary lifestyles and dietary patterns rich in energy-dense foods, which diminish insulin response. 30 These findings are similar to Brazilian results that showed that people with poor diet quality and limited physical activity had a higher risk of IR. 31 These disparities underscore the interplay between environmental and behavioral factors in the manifestation of IR.
Our data found statistically significant differences in nearly all anthropometric indicators between participants with and without IR. Similar findings have been reported globally, as most of these indicators assess adiposity. 10 Excess adiposity, particularly visceral fat, contributes to systemic inflammation and metabolic disruption by releasing adipokines and free fatty acids. These factors impair insulin receptor signaling, thereby reducing glucose uptake in peripheral tissues. 4
Some studies have previously assessed the association and accuracy of anthropometric indicators for IR,9–11 revealing variations across ethnic groups. 10 Most of these investigations have used more traditional measures, such as BMI and WC. A study conducted using data from the United States National Health and Nutrition Examination Survey (NHANES) and the Korea National Health and Nutrition Examination Survey (KNHANES) revealed that the ability of BMI and WC to diagnose IR and diabetes was highest in Whites (BMI AUC = 0.8324, 95% CI: 0.8322–0.8325; WC AUC = 0.8468, 95% CI: 0.8467–0.8469), in comparison to other ethnicities such as Hispanics (BMI AUC = 0.7998, 95% CI: 0.7995–0.8001; WC AUC = 0.8012, 95% CI: 0.8009–0.8015). 10 In our study, WC demonstrated a similar AUC, which was among the highest AUCs. However, the FMI was the anthropometric measurement that exhibited the highest AUC among the evaluated indicators with AUCs of 0.80 in women and 0.81 in men. In contrast to other anthropometric measurements, FMI incorporates in its calculation both fat mass and squared height, offering a more precise assessment of adiposity relative to body structure. Interestingly, FMP and FLMR also performed well, with slightly lower AUC values. This suggests that indicators incorporating both fat and lean mass may be valuable for IR detection, as they reflect the metabolic impact of excess adiposity and the protective role of lean mass for cardiometabolic diseases. 32
Sex-specific FMI cut-offs of 11.70 kg/m2 for women and 7.52 kg/m2 for men demonstrated high sensitivity (>80%) and specificity (>70%). These thresholds align closely with previous findings in a Colombian population for detecting FMI and metabolic syndrome, which reported cut-offs of 11.8 kg/m2 for women and 6.9 kg/m2 for men. 33 Notably, although the Colombian study sample consisted of younger individuals (18–35 years), their reported cut-offs are comparable to those observed in our study. This similarity might be explained by the fact that the Colombian thresholds were developed for metabolic syndrome—a condition associated with more advanced metabolic complications than insulin resistance alone. It is possible that higher fat mass accumulation acts as a precursor, exacerbating metabolic disturbances and triggering these complications, which could explain the close alignment of cut-offs across studies. This idea is further supported by population-based analyses, such as those using NHANES data, which identified higher FMI thresholds for obesity classification: 13 kg/m2 for women and 9 kg/m2 for men. 34 However, ethnic differences should also be considered when interpreting these results. For instance, a cross-sectional study in a Chinese population reported significantly lower FMI cut-offs for metabolic syndrome diagnosis in women, at 7.9 kg/m2. 35 These discrepancies may reflect underlying ethnic differences in fat distribution. For instance, East Asian populations tend to exhibit a higher proportion of visceral fat relative to subcutaneous fat, even at lower levels of total fat mass.36,37 Visceral fat is more strongly associated with insulin resistance and metabolic dysfunction compared to subcutaneous fat. 38 This pattern might explain the need for lower FMI thresholds for diagnosing metabolic dysfunctions in these populations. Altogether these findings underscore the importance of tailoring FMI thresholds to the specific condition and population under study. Furthermore, it is noteworthy that although the equations for FM used in this study were originally developed in a different population, 21 our results demonstrate their strong diagnostic performance in the Peruvian context. This suggests that these equations could be appropriate and useful in Latin American settings where direct access to DXA measurements is limited.
The results from the tests used to evaluate the logistic regression model indicate a good model for both sexes, with women showing a slightly higher ability to explain the variability in insulin resistance. Furthermore, the adjusted logistic regression demonstrated significant associations between several anthropometric indicators and IR, varying by sex. Among women, WC, subscapular skinfold thickness, upper limb skinfold thickness, and FMI remained significantly associated with IR after adjustment. Notably, the upper limb skinfold exhibited the strongest association, suggesting the relevance of peripheral adiposity as a key factor in this population. Central and total adiposity, as indicated by WC and FMI, also demonstrated significant associations, though their magnitudes were comparatively smaller. Subscapular skinfold, reflecting trunk fat distribution, showed a moderate association, further emphasizing the role of adiposity distribution in women. In men, FMI and subscapular skinfold thickness remained significantly associated with IR after adjustment. FMI exhibited the strongest association, highlighting the importance of total adiposity in this population. The subscapular skinfold also remained significant, emphasizing the role of central fat distribution in men. The higher odds ratio observed for FMI in men compared to women suggests potential sex differences in how overall adiposity influences IR risk. However, the wider confidence intervals observed in men, particularly for FMI, reflect greater variability in the data, which should be considered when interpreting these associations. Notably, while educational level was retained in the final model for men, it was not retained for women. This sex-specific pattern aligns with findings from a Peruvian subsample of a large urban health study, which reported no significant association between education and diabetes among women, but a positive association in men. 39
Beyond the associations, the diagnostic performance of these indicators provides further insights into their utility. While FMI demonstrated the highest diagnostic accuracy for IR in both sexes, highlighting its potential as a reliable diagnostic tool for identifying IR at a population level, the relatively wide confidence intervals observed in the logistic regression models, particularly in men, suggest some variability in the association estimates. However, this variability does not negate the strength of the diagnostic performance but rather emphasizes the need for cautious interpretation when using FMI in individual-level analyses. Taken together, these findings suggest that FMI and other anthropometric indicators are valuable tools for identifying IR in both sexes. However, their application should balance the observed strengths with the limitations in variability and sample-specific differences. Sex-specific strategies and larger studies with more diverse populations are needed to strengthen the evidence base for these indicators as practical tools in clinical and public health contexts.
Implications of the findings
Our findings hold significant public health and clinical implications, particularly for middle-income countries like Peru. IR is widely recognized as a precursor to a range of cardiometabolic conditions, including type 2 diabetes, cardiovascular disease, and non-alcoholic fatty liver disease. 40 In Peru, as in other developing countries, the economic and healthcare systems face a high-cost burden of diabetes and cardiovascular diseases linked to IR. Therefore, early detection and monitoring of IR are critical for preventing these associated conditions, especially in resource-limited settings where laboratory-based methods could be costly or difficult to access for the entire population. Our study demonstrates that anthropometric indicators, such as waist circumference, fat mass index, and upper limb skinfolds, are strongly associated with IR. Compared to laboratory-based measures like HOMA-IR, anthropometric parameters are non-invasive, cost-effective, and readily available, making them valuable tools for screening and monitoring IR at the population level, as demonstrated in studies assessing other health outcomes. 26
The relevance of these findings is amplified by their focus on the Peruvian population, contributing evidence from a developing country, where the prevention of IR is vital. While other indicators, such as biochemical markers, 41 are currently being proposed as components of models predicting insulin resistance, tailored interventions that use simple, accessible measures like FMI and WC could help mitigate the progression of IR and its related diseases. Such strategies are essential for reducing healthcare costs and improving population health outcomes in countries like Peru, where the double challenge of rising non-communicable diseases and limited resources demands innovative, preventative approaches. By integrating these measures into routine healthcare processes, clinicians and policymakers can effectively identify at-risk individuals early and implement targeted interventions to alleviate the burden of IR and its complications.
Limitations
Naturally, our study has some limitations. First, as both the exposure and the outcome variables were assessed at the same time, this study adds little evidence of a casual association between the variables. This is a common limitation of cross-sectional studies. In addition, there was no information available on the family history of IR and certain socio-economic factors that may introduce residual confounding. Also, information on physical activity, alcohol consumption and smoking were self-reported that may lead to information bias. Regarding alcohol consumption, the categorization was based on the frequency of heavy episodic drinking, which may not fully capture other relevant consumption patterns potentially associated with insulin resistance. The threshold values for HOMA-IR reported in the literature vary significantly, which, combined with the lack of standardization in insulin measurement, complicates the accurate assessment of the relationship between anthropometric parameters and IR. 42 Following the WHO’s recommendations, IR is typically defined as HOMA-IR values above the 75th percentile. 43 Based on recent studies, a HOMA-IR value of 2.8 has been adopted as the cut-off for diagnosing IR in the Peruvian population. It is worth noting, however, that this cut-off was established specifically to predict type 2 diabetes risk. Different thresholds—both lower and higher—have been reported in other ethnic groups and clinical contexts, particularly when assessing risks for instance cardiovascular disease, 44 cancer and mortality. 45 Therefore, while 2.8 is appropriate for Peruvian population, it may be limited to type 2 diabetes mellitus. Additionally, the use of data collected between 2007 and 2008 may not fully reflect the current epidemiological landscape or recent demographic shifts. However, in the absence of substantial changes in the determinants of insulin resistance, the magnitude of its association with body composition indicators, and the diagnostic accuracy of anthropometric measures, is expected to remain consistent over time. Furthermore, the PERU MIGRANT study remains one of the few population-based sources in Peru that includes both anthropometric and biochemical markers, which underscores the value and relevance of this analysis despite the time gap. As this was a secondary analysis of the PERU MIGRANT study, no formal sample size calculation was performed for the present research question. Nonetheless, the available sample was sufficient to detect statistically significant associations. However, it should be acknowledged that the diagnostic performance and optimal cut-off points of anthropometric indicators may vary across age groups. Given the sample size and the distribution of participants, the study lacked sufficient statistical power to conduct stratified analyses by age, which precludes drawing age-specific inferences. Finally, the study population consisted of participants from Lima and Ayacucho provinces, thus, the results may not be generalizable for the overall Peruvian population.
Conclusion
The findings that fat mass index serves as an excellent predictor of IR in Peruvian adults without glucose metabolism disorders, may offer an alternative option to predict IR for low-resource settings in not only the Peruvian but also Latin American population that will help to identify people at risk of future diabetes early. Future prospective cohort studies may provide further insight on the accuracy and reliability of our results in the Peruvian population and may provide an opportunity to explore whether a similar accuracy can be achieved in other Latin American populations.
Supplemental Material
sj-doc-2-phj-10.1177_22799036251377581 – Supplemental material for Diagnostic accuracy of various anthropometric indexes for assessing insulin resistance in the Peruvian population: An analytical cross-sectional study
Supplemental material, sj-doc-2-phj-10.1177_22799036251377581 for Diagnostic accuracy of various anthropometric indexes for assessing insulin resistance in the Peruvian population: An analytical cross-sectional study by Jamee Guerra Valencia, Noël C. Barengo, Diego Torres-Quispe and Lorena Saavedra-Garcia in Journal of Public Health Research
Supplemental Material
sj-docx-1-phj-10.1177_22799036251377581 – Supplemental material for Diagnostic accuracy of various anthropometric indexes for assessing insulin resistance in the Peruvian population: An analytical cross-sectional study
Supplemental material, sj-docx-1-phj-10.1177_22799036251377581 for Diagnostic accuracy of various anthropometric indexes for assessing insulin resistance in the Peruvian population: An analytical cross-sectional study by Jamee Guerra Valencia, Noël C. Barengo, Diego Torres-Quispe and Lorena Saavedra-Garcia in Journal of Public Health Research
Footnotes
Acknowledgements
We express our gratitude to “CRONICAS Centro de Excelencia en Enfermedades Crónicas” for generously sharing the PERU MIGRANT study database for public access.
Ethical considerations
As this study involved a secondary analysis of openly accessible data, there was no direct interaction with participants, mitigating potential risks. The original research received ethical approval from the Ethics Committee of the Universidad Peruana Cayetano Heredia (approval number 60014).
Consent to participate
Comprehensive information about the study objectives was presented to participants, and written informed consent was obtained prior to enrollment. The study’s objectives were clearly communicated, and informed consent was appropriately obtained from participants.
Author contributions
Conceptualization: JGV and NCB; Data curation: JGV and NCB; Formal Analysis: JGV and NCB; Investigation: JGV, NCB, DT-Q, and LS-G; Methodology: JGV and NCB; Project administration, Resources, Software, Supervision: JGV and LS; Validation: JGV, NCB, and LS-G; Visualization: JGV, NCB, DT-Q, and LS-G; Writing – original draft: JGV, DT-Q, and LS-G; Writing – review & editing: JGV, NCB, DT-Q, and LS-G. All the authors reviewed the article and approved manuscript submission.
Funding
The authors received no financial support for the research, authorship, and/or publication of this article.
Declaration of conflicting interests
The authors declared no potential conflicts of interest with respect to the research, authorship, and/or publication of this article.
Data availability statement
Supplemental material
Supplemental material for this article is available online.
References
Supplementary Material
Please find the following supplemental material available below.
For Open Access articles published under a Creative Commons License, all supplemental material carries the same license as the article it is associated with.
For non-Open Access articles published, all supplemental material carries a non-exclusive license, and permission requests for re-use of supplemental material or any part of supplemental material shall be sent directly to the copyright owner as specified in the copyright notice associated with the article.