
Abstract
Objective
To evaluate how body mass index, waist circumference, waist-to-hip ratio, and waist-to-height ratio reflect visceral adipose tissue as measured by dual-energy X-ray absorptiometry and how these associations differ by sex and age in a Qatari adult population.
Methods
In this cross-sectional study of 5897 Qatari adults aged 18–88 years from the Qatar BioBank, we assessed the correlation between anthropometric indices and dual-energy X-ray absorptiometry–derived visceral adipose tissue percentage. Analyses included sex-stratified Spearman’s correlations and linear regression models adjusted for age. Model performance was assessed using standardized beta coefficients, R2, adjusted R2, Akaike Information Criterion, and Bayesian Information Criterion.
Results
Among females, waist circumference and waist-to-height ratio had the strongest correlations with visceral adipose tissue (r = 0.70), followed by waist-to-hip ratio (r = 0.68), whereas body mass index showed a moderate correlation with visceral adipose tissue (r = 0.54). Among males, waist-to-hip ratio showed the highest correlation with visceral adipose tissue (r = 0.71). Regression analyses confirmed waist-to-hip ratio as the strongest predictor in males and waist circumference as the strongest in females. Interaction models showed that associations between central adiposity indices and visceral adipose tissue strengthened with age.
Conclusion
Anthropometric indices reflecting central adiposity, waist-to-hip ratio, waist circumference, and waist-to-height ratio outperformed body mass index in predicting visceral adipose tissue in a sex- and age-specific manner. These findings may support the clinical utility of incorporating waist-based measures for visceral adipose tissue risk assessment.
Keywords
Introduction
Obesity rates in Qatar are among the highest in the Middle East, posing a growing public health concern.1,2 As of 2019, using international body mass index (BMI) definitions, over 40% of Qatar’s adults have obesity, a figure projected to rise to 52% by 2035.1–4 This trend poses a major public health and economic burden to the healthcare system due to the high rates of obesity-related complications. The five noncommunicable diseases with the greatest projected impact on disability-adjusted life years in Qatar are cardiovascular diseases (CVDs), mental health disorders, cancer, respiratory diseases, and type 2 diabetes mellitus (T2DM).5,6 These diseases share common lifestyle-related risk factors such as tobacco use, diets high in low-quality fats and refined carbohydrates, and physical inactivity. 5 Given obesity’s disease risks and associated healthcare costs, population-specific screening tools may prove to be critical for disease prevention efforts.
BMI, defined as weight (in kilograms) divided by height (in meter squared), is commonly used to classify individuals with obesity. However, it falls short in identifying the types or location of adipose tissue or even differentiating between fat and fat-free mass on an individual basis.7–9 This is important because visceral adipose tissue (VAT), compared with subcutaneous adipose tissue (SAT), is more metabolically active and a major contributor to chronic diseases such as CVD and T2DM. VAT induces an inflammatory response that drives insulin resistance; lipid dysregulation, which leads to dyslipidemia; and hypertension, making it a stronger predictor of metabolic dysfunction than total adiposity alone.10–12 This key limitation makes BMI a less reliable indicator of metabolic health as individuals with similar BMIs can have vastly different risks depending on their VAT levels, some of which may be influenced by ethnicity, sex, and age, which are factors that BMI does not account for.13–15
There are notable ethnic, sex-, and age-related disparities in VAT.16–19 South and East Asian populations may have a higher amount of VAT at lower BMIs than those of African or European descent.17,20,21 Sex-based differences also play a critical role as females typically have a higher proportion of SAT,22–24 whereas males often have higher amounts of VAT, especially in the abdominal region.25,26 Aging further exacerbates these differences, as VAT increases in both sexes over time. In postmenopausal females, fat may redistribute to the abdominal region, and males will continue to store more VAT as overall muscle mass decreases in both sexes, contributing to their overall metabolic disease risk.24,27,28
Alternative anthropometric indices, including waist circumference (WC), waist-to-hip ratio (WHR), and waist-to-height ratio (WHtR), may be better predictors of central adiposity and metabolic risk.29,30 WC, in particular, has outperformed BMI in predicting metabolic risk in various populations.31–33 However, the accuracy of these metrics may vary across populations, highlighting the need for tailored cut points to improve diagnostic precision. Although gold standard imaging methods such as magnetic resonance imaging (MRI) and computed tomography (CT) provide the most precise measurements of adiposity, their high cost and limited accessibility make them impractical for routine clinical use.34,35
Given the high burden of obesity and related diseases in Qatar, it is essential to determine which clinically feasible and pragmatically conducted anthropometric indices most accurately reflect VAT. This study aimed to identify anthropometric measures most strongly correlated with VAT, as measured by dual-energy X-ray absorptiometry (DXA), in a Qatari population. We also examined sex- and age-specific differences, given the well-documented impact of aging on VAT accumulation. The findings will help improve risk assessment strategies and inform public health and clinical interventions tailored to Qatar’s population.
Methods
Study sample and design
Data for this analysis were obtained from the Qatar BioBank (QBB) cohort study, a prospective population-based study examining a population sample of Qatari nationals and long-term Qatari residents. 36 Further details about the QBB exclusion and inclusion criteria, as well as sampling method, have been previously published. 36
In this study, a cross-section of QBB data was analyzed. According to data use agreements and policies between the QBB and Qatar University, a random subset of the QBB data (n = 6000) was selected. Based on previous publications, our sample is similar in male to female ratio, average age, and disease outcomes to the published, preliminary findings (n = 17,065) from the QBB cohort study. 37 Our study excluded pregnant women and non-Qatari nationals, yielding an analytic sample of 3169 females and 2831 males. Throughout this paper, we refer to Qatari nationals as Qataris.
The protocols of the QBB were approved by the Hamad Medical Corporation Ethics Committee. 36 All participants provided informed consent, ethical approval for the use of these data was obtained from the institutional review board (IRB) of the QBB (QF-QBB-RES-ACC-00217), and an IRB exemption was obtained from the University of North Carolina at Chapel Hill (#23-2942). This study adheres to the ethical guidelines set forth in the Declaration of Helsinki of 1975 that were revised in 2024. 38 The reporting of this study conforms to Strengthening the Reporting of Observational Studies in Epidemiology (STROBE) guidelines. 39
Variables
Baseline characteristics and general health
Sociodemographic data such as age were collected through a self-administered questionnaire. A trained nurse was available to assist participants with completing the questionnaire, if needed. Age groups were defined as follows: 18–24, 25–34, 35–44, 45–54, 55–64, and 65 years and older, similar to the age categories used in the National Health Interview Survey. 40
Anthropometrics
Anthropometrics were measured once by a trained registered nurse using standard techniques. Body weight (in kilograms) and height (in centimeters) were recorded using a calibrated scale and a wall-mounted Seca 217 stadiometer (Seca GmbH, Hamburg, Germany).41,42 WC (in centimeters) was measured halfway between the lower ribs and the iliac crest, whereas hip circumference (HC; in centimeters) was measured at the largest circumference around the buttocks. 41 BMI (kg/m2), 8 WHR (WC/HC), 19 and WHtR (WC/height) were calculated. 43
Dual-energy X-ray absorptiometry
Body composition was measured using a full body General Electric Lunar DXA scan (GE Healthcare, Madison, Wisconsin, USA). 44 Participants were instructed to lay flat and still on the scanning table while wearing a light gown and no jewelry. 41 CoreScan software was used to estimate VAT from the DXA scan. 45 A previous study conducted on a similar population found that VAT estimates from CoreScan were comparable to those obtained from the gold standard MRI or CT scan.35,36,46–48 In this study, VAT was analyzed as an independent DEXA-derived value and then represented as a relative percentage of total body fat as follows: (VAT (kg)/(body fat (kg)) × 100).
Statistical analysis
We compared baseline characteristics including age, anthropometric measures, and body composition variables stratified by sex using the statistical analyses indicated in Table 1. A significance level of P < 0.05 was set for all analyses in this study and conducted in StataSE 18.5 (College Station, Texas, USA). 49
Characteristics of males and females from a Qatar BioBank cohort study sample (n = 5897).
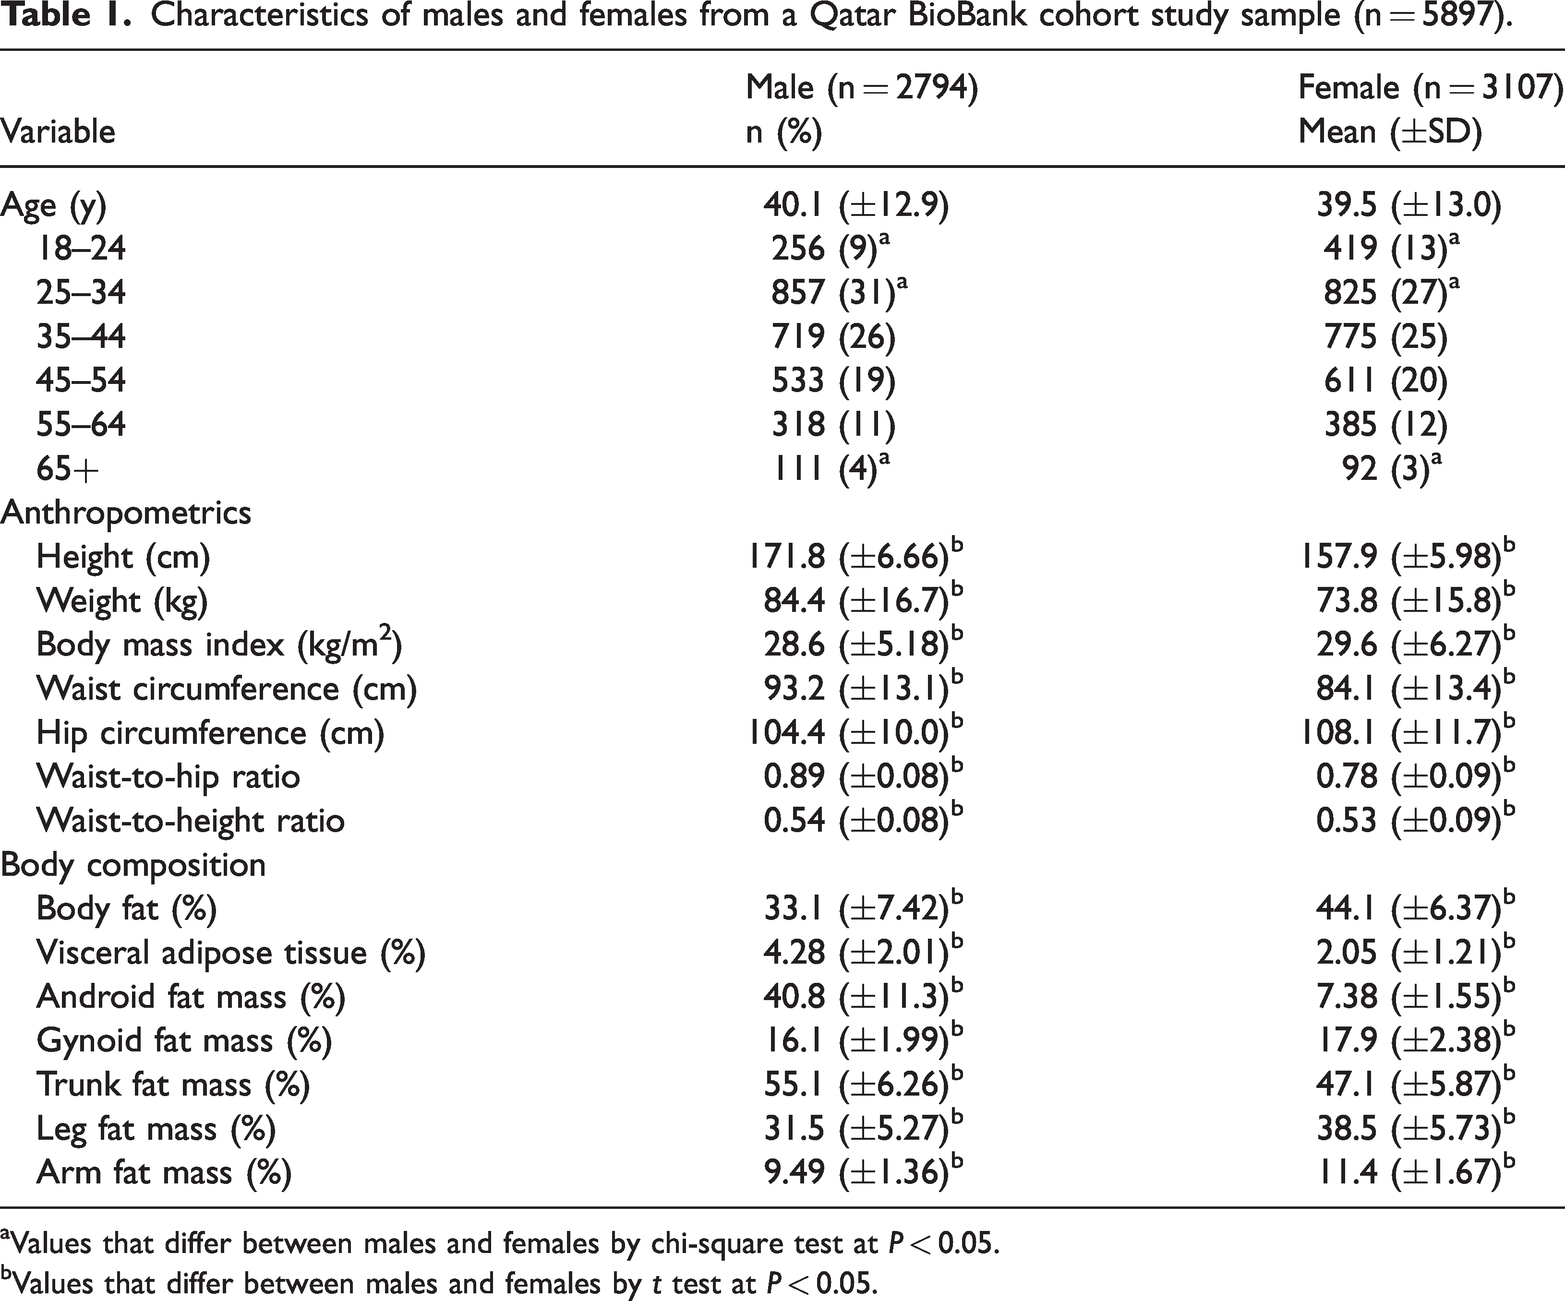
Values that differ between males and females by chi-square test at P < 0.05.
Values that differ between males and females by t test at P < 0.05.
Spearman’s rank correlation was selected to assess the strength and direction of the relationship between anthropometric indices (BMI, WC, WHR, and WHtR). Spearman’s rank correlation was used because it makes no assumptions about the underlying distribution of the variables. This is particularly relevant in our study, where the distribution of VAT and some anthropometrics may not follow a normal distribution. We conducted Fisher Z-test to identify significant differences between the anthropometric correlations using a 0.05 significance level.
There was a nonlinear relationship between VAT and BMI. To address this, BMI was categorized by rounding to the nearest whole number. To ensure sufficient cell sizes at the extremes of the distribution, BMI values below 17 were grouped as 17, and those above 40 were grouped as 40, similar to how quantile-based categorization or age grouping has been performed in other studies. 50 After addressing nonlinearity, we conducted separate linear regression models for each anthropometric index, stratified by sex. Interaction terms were included to test whether age modified these associations. Standardized beta coefficients were calculated to facilitate direct comparisons across regression models. Finally, we assessed the strength of associations and model fit using metrics, such as R2; adjusted R2; Akaike Information Criterion (AIC); and Bayesian Information Criterion (BIC), to identify the anthropometric index that provided the strongest prediction of VAT in this population.
Our final analytical cohort included 5897 participants with complete anthropometric and DXA data. Complete case analysis was performed, and only participants with VAT data were included in the primary analysis. Other variables were not considered as part of this criterion for inclusion. The sociodemographic characteristics of those missing anthropometric and DXA-derived data were not different from those included in our analytic sample.
Results
Baseline characteristics
The average age between males and females was comparable, but there were more females in the youngest age group (18–24 years) and more males in the older (65+ years) age group (Table 1). Males had significantly higher BMI, WC, WHR, and WHtR and higher percentages of VAT and android and trunk fat compared with females. Females had significantly higher total body fat (percentage) and more gynoid and peripheral fat (Table 1).
Spearman’s rank correlation
Among females, VAT was most highly correlated with WC (r = 0.70) and WC ratios (WHtR, r = 0.70 and WHR, r = 0.68), whereas BMI showed a moderate positive correlation (r = 0.54) with VAT (Supplementary Material Table S1). Among females, the correlation coefficients for WC, WHtR, and WHR were statistically similar, whereas the correlation with BMI (r = 0.54) was significantly lower than the others. Among males, VAT was most highly correlated with WHR (r = 0.71) compared with WHtR (r = 0.57), WC (r = 0.54), and BMI (r = 0.34). All correlation coefficients were significantly different from one another for males (Supplementary Material Table S1).
Linear regression and age interaction
The interaction models stratified by sex revealed significant age-specific associations between anthropometric measures and VAT. Among females and males, there were limited significant main effects (Figure 1) and age-by-BMI effects on VAT (see Supplementary Material Figure S1). WC, WHR, and WHtR use different units, and their raw slopes should not be directly compared across Figure 2. To address this, we present standardized beta values in Table 2, ensuring comparability across metrics. In the interaction model, WC had the strongest association with VAT among females aged 35–54 years, as shown in Table 2. Figure 2(a) visually supports this trend, such that the marginal effect of WC on VAT peaks in midlife before tapering off in older age groups. Unlike WC, WHR remained significantly associated with VAT even in later life (Table 2), and Figure 2(b) reflects this pattern, in which the association of WHR with VAT peaked in the 45–54 years age group and remained significant, though slightly attenuated, in individuals aged ≥65 years. WHtR demonstrated consistent associations across age, peaking in middle-aged females before declining in older groups. For males in the interaction model, both WC and WHtR had a steady increase in association strength across age groups, with the strongest effects observed in older adults (Table 2). WHR had the most pronounced increase with age, becoming the strongest predictor of VAT in the oldest age category. In Figure 2, the steep age-related strengthening of WC and WC ratio’s effect among males 65 years or older is displayed (Table 2, Figures and 2).

Main effects of body mass index (BMI) and age categories on visceral adipose tissue (VAT), stratified by sex. The figure displays standardized beta coefficients and 95% confidence intervals from linear regression models evaluating the association between BMI and VAT across different age categories (reference group: 18–24 years). Results are presented separately for females (blue lines) and males (red lines) marked by circles for BMI categories and diamonds for age categories. The x-axis represents the standardized beta coefficients, whereas the y-axis lists the grouped BMI and age categories.

Marginal effects of WC, WHR, and WHtR on visceral adipose tissue (VAT) by age and sex. This multipanel figure illustrates the marginal effects of three anthropometric measures; WC, WHR, and WHtR, on VAT across different age categories and stratified by sex. (a) Both males and females show an increase in the marginal effect of WC on VAT with age, peaking in middle age groups (35–54 years). Males exhibit a sharper increase in older age groups (65+ years), whereas females show a more gradual and modest rise across all ages. The interaction effects for WC with age are statistically significant for most age groups, particularly among males in the oldest category. (b) The marginal effect of WHR on VAT is higher in males compared with females across all age groups. Males demonstrate a steep increase in VAT associated with WHR from ages 25–34 years, peaking sharply in the older age group (65+ years). In contrast, females show a more gradual increase, peaking between ages 45–54 years, followed by a decline in the oldest age group. The interaction effects for WHR and age are significant in both sexes, with a stronger association observed in males, especially in older age categories and (c) both sexes display a similar trend in which the marginal effect of WHtRon VAT increases with age but is consistently higher in males. The highest effect is observed in males aged 65+ years, whereas females show a peak around age 35–44 years, followed by a slight decline. The interaction effects for WHtR and age are significant, with stronger associations in males, indicating that WHtR becomes a more influential factor for VAT in older males. Overall, the figure demonstrates that sex and age modify the relationship between anthropometric measures and VAT. Males tend to show stronger associations, particularly for WHR and WHtR in older age groups, whereas females exhibit more gradual changes across the lifespan. WC: waist circumference; WHR: waist-to-hip ratio; WtHR: waist-to-height ratio.
Associations between WC; WHR; WHtR; age categories; and VAT, stratified by sex. The table presents standardized βs, SEs, and model fit metrics (R2, adjusted R2, AIC, and BIC) derived from linear regression models. Interaction terms between anthropometric indices and age categories (reference group: 18–24 years) were included to assess whether the relationship between WC and VAT (%) varies across different age groups in both males and females. BMI was not included in the linear regression models due to its nonlinear relationship with VAT; however, as a categorical variable, model fit metrics for BMI are presented in the table to allow comparison with the other anthropometric indices.

AIC: Akaike Information Criterion; β: beta coefficient; BIC: Bayesian Information Criterion; BMI: Body mass index; VAT: visceral adipose tissue; WC: waist circumference; WHR: waist-to-hip ratio; WtHR: waist-to-height ratio.
P < 0.05.
P < 0.01.
P < 0.001
Model fit
The evaluation of model strength and fit across age-interaction models revealed that WHR demonstrated the strongest association with VAT for both males and females (Table 2). WHR models accounted for the highest proportion of VAT variance, as shown by the highest R2 and adjusted R2 values, and had the highest standardized beta coefficients across sexes compared with other indices. Additionally, WHR had the lowest AIC and BIC values, indicating that they provided the best fit to the data with the least complexity. For females, WC and WHtR were very close competitors to WHR, whereas BMI had the weakest relationship with VAT. For males, WHR remained the most robust predictor, followed by WHtR, with WC and BMI showing comparatively weaker associations.
Discussion
The present study compared the ability of several widely used anthropometric measurements to predict VAT in a large sample of Qatari males and females based on the strength of their association, variance explained, and model fit. Our results found that WC and WC ratios exhibited the strongest correlations with VAT in females, supporting prior research that central adiposity measures are more reflective of VAT compared with BMI.29,51,52 Similar findings were observed in several studies,53–56 which suggested that WC, WHR, or WHtR are better predictors of VAT than BMI across diverse populations and age groups.29,51,52 Unlike other metrics, WC directly measures abdominal girth, capturing VAT, whereas WHtR normalizes this measure to body size, enhancing its ability to capture central adiposity.19,29 WHR performed similarly to WC and WHtR in terms of the strength of association but had slightly better model fit with lower AIC/BIC values. This metric captures fat distribution by accounting for both abdominal fat (WC) and hip girth, which may make it particularly effective in reflecting VAT.
In contrast, among the anthropometric indices, WHR had the highest strength of association and overall model fit with VAT percentage in males. A potential biological explanation for the higher correlation of WHR with VAT could be attributed to sex-specific fat distribution patterns. Males generally accumulate more central or android fat, which includes VAT, compared with females, who are predisposed to store fat peripherally, such as in the hips, thighs, and arms.26,36,57 The male tendency for central adiposity means that changes in WC relative to HC (WHR) could be reflecting the accumulation of VAT. This is in contrast to females in our sample, in whom WHR may capture the accumulation of central and peripheral fat, potentially diluting its correlation with VAT.
BMI had the lowest correlation with VAT and did not show statistically significant age interactions, likely explained by its inability to differentiate fat distribution. At higher BMI levels (>35 kg/m2), VAT plateaus as a proportion of total body fat, as excess adiposity redistributes to other depots. This limitation, widely documented in the literature, underscores BMI’s poor performance in detecting VAT, a key driver of CVD risk (He et al. 58 and Neeland et al. 59 ). Although BMI estimates total adiposity well, central adiposity measures such as WC, WHR, and WHtR showed stronger associations with VAT, particularly with increasing age. Age-interaction models confirmed that these measures become more predictive of VAT over time, likely reflecting physiological and hormonal changes, reinforcing the need for age-tailored approaches in evaluating VAT-related health risks.
As individuals age, fat distribution shifts toward VAT accumulation, even if total body weight or BMI remains stable. 26 This process is largely driven by hormonal changes, including declining estrogen in postmenopausal women, which promotes central fat storage. These changes are further compounded by age-related declines in physical activity, loss of muscle mass and strength (sarcopenia), leading to additional VAT accumulation; therefore, selecting appropriate anthropometric measures is crucial when assessing obesity-related risk in aging populations. Our findings suggest that WC and WC ratios may be stronger predictors of VAT than BMI in middle-aged and older women, likely due to age-related fat redistribution. Unlike BMI, WC and WHtR more accurately capture central adiposity.7,22,27,60 VAT is metabolically active, triggering inflammation and insulin resistance, which increases the risk of T2DM, dyslipidemia, and CVD.61–63 These metabolic consequences highlight the importance of considering sex-based differences in fat distribution. Although VAT accumulation also increases with age in males, its pattern differs due to declining testosterone levels, which have been linked to greater central adiposity. This suggests that WC and WC ratios may remain useful indicators of VAT in older men.26,28,57 However, as our study did not directly measure hormonal changes, these interpretations should be considered in the context of prior research.
VAT naturally increases with age, and our findings show that the association between anthropometric indicators and VAT also strengthens with advancing age. This pattern highlights the critical need for early interventions to mitigate the progressive accumulation of VAT over the lifespan. Intervening early, particularly during younger adulthood, may help delay or reduce the age-related increase in VAT and its associated cardiometabolic risks. Anthropometric measures such as WC or WC ratios may be valuable tools for identifying at-risk individuals and tailoring early prevention strategies. Although these indicators may be most strongly associated with VAT in older adults, using them proactively in younger populations could help target central adiposity before it becomes a significant health concern. By addressing central fat accumulation early, health practitioners may better prevent the compounding effects of VAT on chronic disease risk as individuals age.
BMI is widely used to classify obesity and assess disease risk; however, its limitations in capturing fat distribution and metabolic health have led to growing calls for redefining obesity. 9 Our findings reinforced this argument by demonstrating that WC and WC ratios were more strongly associated with VAT compared with BMI, highlighting their potential as better indicators of metabolic risk. Given that VAT-driven metabolic dysfunction is more relevant to disease progression compared with excess weight alone, obesity classification should prioritize measures that reflect central adiposity and metabolic health rather than BMI alone. This aligns with recent recommendations that advocate for shifting obesity definitions beyond weight-based metrics to incorporate metabolic and functional health indicators. 9 This shift in focus could improve early identification of at-risk individuals and inform more precise public health strategies that intervene before metabolic dysfunction progresses into clinical disease.
Implications
WC remains a widely used and practical metric in clinical settings due to its simplicity, ease of measurement, and strong association with VAT. As a direct measure of abdominal girth, WC is straightforward to acquire and interpret, making it an accessible tool for assessing central adiposity and associated health risks.20,21,64–66 Although WHtR has been suggested in the literature as a complementary metric, particularly for studies involving diverse populations, the simplicity of WC gives it distinct advantages in many clinical and public health contexts.29,51,52 Unlike WHtR, WC does not require height measurements or additional calculations, making it especially useful in resource-limited settings. In our population, WHtR demonstrated similar performance to WC in females, but our findings do not provide conclusive evidence that WHtR offers substantial advantages over WC. Instead, WHtR may be a useful alternative when comparing populations with different body sizes or when universal thresholds are needed because it standardizes WC relative to height. 29 For males, WHR demonstrated stronger associations with VAT, suggesting that it may be a more appropriate indicator of central adiposity in this group. However, additional validation in diverse populations is needed to determine its broader applicability and whether it should be prioritized over other metrics in clinical or research settings.
Challenges and strengths
One of the key challenges in this study is the reliance on DXA scans for estimation of VAT, which, although effective, is not the gold standard.46,67 Although DXA has been validated against more accurate imaging techniques such as CT or MRI, particularly in populations similar to ours,35,47 it may still present limitations in estimating VAT accurately in certain demographics. For example, DXA can sometimes report a VAT value of zero in younger, leaner individuals, particularly females, leading to potential misclassification when compared with the more precise measurements typically provided by MRI or CT scans. In our study, 13 participants recorded zero VAT mass (kg), which is unlikely to be correct. Despite this, we chose to include these values to better reflect the variability encountered in real-world epidemiological settings using DXA and inclusion of these participants did not change our study results. 54 Anthropometric measurements were taken only once, rather than averaging multiple readings, which may introduce measurement variability and affect the precision of BMI, WC, and WHR assessments. Furthermore, as with any cross-sectional design, causality cannot be inferred. Moreover, due to the original sampling methods used in the QBB cohort study, our sample lacks representativeness of the broader Qatari population, and findings should be interpreted with caution. 37
A major strength of this study is the large and relatively homogenous sample size from the Qatari population, which provides high-quality, detailed data and allows for the robust evaluation of the relationship between anthropometric indices and VAT. To our knowledge, this is one of the first studies in this region to comprehensively assess the relationship between VAT and widely used anthropometric indices. Although the relatively young age of our sample may limit generalizability to older populations with typically higher VAT levels, it also provides a unique advantage. The significant associations observed between anthropometric indices and VAT in younger individuals emphasize the importance of early prevention strategies. Although homogeneity limits generalizability, it also offers the advantage of reducing confounding by genetic and cultural variability, ensuring that the observed associations are more reflective of the studied population.
Conclusion
This study provided evidence for the utility of anthropometric indices in relation to VAT in a Qatari population. Our findings indicated that in this population, WC and WC ratios may be the best predictive measure of VAT in females, whereas WHR demonstrates predictive ability in males. These differences highlight the need to account for sex-specific fat distribution patterns when evaluating VAT-related health risks. Future research should explore the longitudinal utility of these anthropometric indices in predicting VAT changes over time and their implications for cardiometabolic outcomes. Additionally, validating these findings in diverse ethnic populations could enhance their generalizability and inform more tailored public health strategies.
Supplemental Material
sj-pdf-1-imr-10.1177_03000605251371603 - Supplemental material for Assessing the relationship between anthropometric indices and visceral adipose tissue: A cross-sectional study in a Qatari population
Supplemental material, sj-pdf-1-imr-10.1177_03000605251371603 for Assessing the relationship between anthropometric indices and visceral adipose tissue: A cross-sectional study in a Qatari population by Rawan Ajeen, Karam I Turk-Adawi, Alice S Ammerman, John A Batsis, Shu Wen Ng and Linda S Adair in Journal of International Medical Research
Supplemental Material
sj-pdf-2-imr-10.1177_03000605251371603 - Supplemental material for Assessing the relationship between anthropometric indices and visceral adipose tissue: A cross-sectional study in a Qatari population
Supplemental material, sj-pdf-2-imr-10.1177_03000605251371603 for Assessing the relationship between anthropometric indices and visceral adipose tissue: A cross-sectional study in a Qatari population by Rawan Ajeen, Karam I Turk-Adawi, Alice S Ammerman, John A Batsis, Shu Wen Ng and Linda S Adair in Journal of International Medical Research
Footnotes
Acknowledgments
The authors would like to thank Qatar University and the Grant Office for funding this work and the Qatar BioBank for providing the data used in this study. The authors are appreciative for the insightful comments by reviewers.
Author contributions
RA made substantial contributions to the conception and design of the study, led data analysis and interpretation, and drafted the manuscript including the development of tables and figures. KIT-A was responsible for data acquisition and contributed to the study design and methodology. LSA contributed to the study design, methodology, and interpretation of results. SWN, ASA, and JAB contributed to the conceptualization of the study and provided critical input on methodological approaches. All authors (RA, KIT-A, LSA, SWN, ASA, and JAB) critically reviewed the manuscript for important intellectual content, approved the final version for submission, and agreed to be accountable for all aspects of the study.
Consent to participate
Prior to enrollment, all participants provided informed consent to partake in the study. The research was carried out in compliance with the principles outlined in the Declaration of Helsinki.
Data availability statement
The data that support the findings of this study are available from the Qatar BioBank, but restrictions apply to the availability of these data, which were used under license for the current study, and so are not publicly available. Data are available upon request with prior permission from the Qatar BioBank because authors do not have the permission to share the data.
Declaration of conflicting interest
The authors declared no potential conflicts of interest with respect to the research, authorship, and/or publication of this article.
Ethical considerations
The study protocol received an approval from the Institutional Review Boards at the Qatar BioBank (QF-QBB-RES-ACC-00217) and an exemption from the University of North Carolina at Chapel Hill (#23-2942).
Funding
The authors would like to thank Qatar University for funding this project. Rawan Ajeen received funding as a predoctoral trainee from the National Heart, Lung, and Blood Institute of the National Institutes of Health (#5T32HL129969).
Supplementary material
Supplementary material for this article is available online.
References
Supplementary Material
Please find the following supplemental material available below.
For Open Access articles published under a Creative Commons License, all supplemental material carries the same license as the article it is associated with.
For non-Open Access articles published, all supplemental material carries a non-exclusive license, and permission requests for re-use of supplemental material or any part of supplemental material shall be sent directly to the copyright owner as specified in the copyright notice associated with the article.