
Abstract
Background:
The implementation of Indonesia’s food-based dietary guidelines (FBDG) through an index should be simulated to provide a concise overview of the diet quality of the Indonesian adult population. This study aimed to (1) develop a quality eating index to depict diet quality and (2) evaluate the performance of the instrument used to assess the association between diet quality and nutritional status among the Indonesian adult population.
Methods:
The quality eating index was developed based on the FBDG. The index was developed through a multi-step workflow: (1) literature review and expert panel discussion, (2) pilot study, (3) final testing and score weighing, (4) cut-off score determination, and (5) construct and criterion validation for the body mass index (BMI) and biochemical parameters such as fasting blood glucose (FBG), total cholesterol, high- and low-density lipoprotein (HDL and LDL), and triglyceride. A total of 415 subjects were randomly recruited using proportional stratified random sampling in the urban and rural communities.
Results:
The quality eating index was constructed of 12 food groups with a cut-off score of ≥60 indicating good and <60 showing poor/needing improvement. A low score on the quality eating index was associated with a 1.6-fold greater risk of overweight/obesity and tended to be associated with a 1.5-fold higher risk of dyslipidemia.
Conclusions:
The development of the quality eating index was only significantly associated with BMI. The quality eating index could potentially be used for screening for diet quality and risk of overweight/obesity among adults in urban and rural areas.
Introduction
The National Health Survey of Indonesia reported an increase in the prevalence of non-communicable diseases (NCDs) between 2013 and 2018, including diabetes mellitus (0.5%), cancer (0.4%), and hypertension (8.3%).1,2 Dietary choices, which shape diet patterns, have been identified as a primary cause of NCDs in many adult populations. 3 A healthy or unhealthy dietary pattern is influenced by self-management factors and environmental impact resulting from food system transformations.4 –6 Diet quality can be assessed to evaluate the adequacy of food consumption as well as improve targeted nutrition intervention.3,7 This can be achieved by using dietary indices that consider both food groups and nutrients.7,8 Several dietary indices have been developed for this purpose, including the Healthy Eating Index-2015 (HEI-2015), Dietary Approaches to Stop Hypertension (DASH), Alternative Healthy Eating Index (AHEI), and Dietary Quality Index (DQI). 8
Most of the existing indices were developed based on the Dietary Guidelines for Americans (DGA), emphasizing recommended food groups such as grains, vegetables and fruits, protein, dairy and its products, and fats from nuts, seeds, and fish.9,10 For instance, Healthy Eating Index (HEI) 2015 consisted of 13 food groups, of which 9 groups are highly recommended to be consumed adequately, and 4 groups are highly suggested to be consumed moderately or even restricted. The adequacy components include total fruits, whole fruits, total vegetables, green and beans, whole grains, dairy, total protein foods, seafood and plant proteins, fatty acids, while the moderation components are refined grains, sodium, added sugars, and saturated fats. 10 When applied to the Indonesian population, certain food groups and portions should be adjusted to align with Indonesia’s Food-Based Dietary Guidelines (FBDG).11 –14 Staple food for example, instead of whole grains, the population share more carbohydrate sources from rice, corn, and root and tubers, while dairy is part of total protein sources due to less likely to be consumed.15,16 Therefore, some new dietary indices have been developed or adapted to be more suitable for the Indonesian population.
A previous study reports the development of an alternative Balanced Diet Index (BDI) specifically designed for women in Indonesia. 16 The alternative BDI was developed by Perdana et al. and involved two models. 16 The first model, BDI-4, was constructed using 11 food groups with a four-level scoring system (0, 4, 7, and 10 points). The study found that BDI-3 was the simplest and most valid measurement. However, BDI-3, which comprised six food groups (carbohydrate sources, animal protein, plant protein, vegetables, fruits, and milk), did not account for risk-related food groups such as fats, saturated fats, cholesterol, and sodium. 16 Furthermore, the study did not establish cut-off points to interpret whether the scores indicated good, needing improvement, or poor diet quality.
The impact of diet quality to nutritional status, inflammation, and health outcomes has been extensively reported in the literature. A systematic review conducted among Chinese adult shows that diet quality is associated with body weight, nutritional status (both undernutrition and overnutrition), and obesity-related outcomes. 17 Additionally, a cross-sectional survey involving 28,000 adults in the United States reports that higher scores on the Healthy Eating Index-2015 (HEI-2015) and the Healthy Plant-Based Dietary Index (PDI) are associated with lower inflammation. Conversely, an unhealthy plant-based diet is linked to higher inflammation, as indicated by elevated levels of high-sensitivity C-reactive protein (hs-CRP). 18 A recent study conducted among Iranian adults also finds that better diet quality, indicated by higher global diet quality scores (GDQS), is associated with a lower risk of developing metabolic syndrome (MetS). 19
Considering the challenges in adapting dietary indices to align with national FBDG, it is crucial to design a diet quality index specifically tailored to the Indonesian population. Moreover, it is essential to assess diet quality in relation to nutritional status and health-related outcomes. Therefore, this study aims to develop the Quality Eating Index (QEI) to represent diet quality for the Indonesian population and evaluate the performance of this instrument in measuring the association between diet quality and nutritional status.
Methods
This study consisted of several steps, which are described in Figure 1. 20

Flow chart of the study.
Item generation and the Quality Eating Index (QEI) development
A literature review and expert panel discussion were conducted as the first step in developing a list of questions related to the food groups commonly consumed by the adult population in the study area. A comprehensive literature search was performed using electronic databases, including PubMed, Wiley, Google Scholar, and Cochrane Reviews, with the following keyword string: (questionnaire OR index* OR instrument* OR tool) AND (“diet quality” OR “dietary” OR “healthy eating” OR “dietary eating” OR “quality eating”). This search aimed to identify the constructs related to the key indicators of weight loss and preexisting validated questionnaires. Based on the literature, an initial set of questionnaire items was developed, comprising 21 food groups, and was formatted into multiple-choice questions. The initial set of questionnaire items was then equipped with the recommended portion sizes based on the Indonesia’s FBDG as shown in Table 1. 21
Comparison of food group based on the Indonesian FBDG and the quality eating index.

Quality eating index comprised of 21 questions.
Food based dietary guidelines.
According to the Indonesia’s FBDG, released by the Ministry of Health of Indonesia 2014.
In Indonesia, according to the decree of the Ministry of Health of Indonesia number 41 (2014) for Balanced Nutrition Guidelines, the recommended daily intake of vegetables and fruits is 300–400 g/person for young children and school-aged children, and 400–600 g/person for adolescents and adults. Approximately two-thirds of the recommended intake consists of vegetables.
The set of questions was then discussed during an expert panel meeting to determine the components that would constitute the QEI. Additionally, the discussion aimed to evaluate the feasibility and relevance of the index components through a rational analysis conducted by the experts. The meeting, which lasted approximately 60–90 min, was held via an online platform due to distance constraints. Experts participating in the focus group discussion (FGD) were required to meet the following criteria: (1) having expertise in nutrition, dietetics, or public health, (2) working as an academic or practitioner, and (3) having a focused research background or strong interest in dietary assessment and public health. Table 1 presents the experts’ evaluation of the adjustments made to the food groups in the QEI, which consists of 21 questions with multiple-choice answers, in alignment with Indonesia’s FBDG.
The 21 questions were subsequently tested on 30 adults aged 18–60 years living in the urban and rural areas of Yogyakarta Province. Pregnant or breastfeeding women and illiterate adults were excluded from the study. The participants were interviewed by a nutritionist using a multiple-choice questionnaire. The reliability of each question was assessed using the Cronbach’s alpha if the item was deleted. The criteria for reliability were as follows: Cronbach’s alpha ≥0.90 indicating excellent reliability, 0.70–0.89 high reliability, 0.50–0.69 moderate reliability, and <0.50 low reliability. A Cronbach’s alpha based on the standardized items was calculated to assess the reliability of the 21-question set. This value was then compared to the r-table (0.361), with a question being considered reliable if Cronbach’s alpha > r-table. The final testing of the Quality Eating Index was conducted using the 21 revised questions.
Of the 30 subjects, 56.7% were female, and the mean age was 42.5 ± 11.9 years. The Cronbach’s alpha for the set of 21 questions was calculated based on the standardized items and compared to the r-table value (0.361). The result indicated that the instrument was highly reliable (0.829 vs 0.361). Finally, the 21 questions were retained and used in the finalization step after rewording and review. For the dietary intake data, each food or dish was recorded using a 2-day food recall (2DFR), estimated by a nutritionist. The food or dish was then categorized into the 21 available food groups by converting household serving sizes into portions per day. The conversion factors for foods or dishes were based on the Balanced Diet Guidelines from the Ministry of Health (MoH) of Indonesia and the Indonesian food database. For example, the consumption of three different protein sources in a day—1.5 pieces of fried chicken and 1 boiled egg—was categorized as animal-based proteins, with a total amount of 2.5 portions/day.
The food recall data were used to answer the 21 questions by converting grams per day into portions per day, following the Indonesian FBDG and the Indonesian food database from the MoH (Table 2). Each question represented one food group, allowing for the calculation of the minimum, maximum, mean, and standard deviation of the consumption for each food group (in portions per day). Regarding the food groups consumed at <1 portion/day, the investigators decided to merge these groups with the similar ones. The merging process considered the median consumption values (Table 2), the typical consumption patterns of the subjects and their population, and the significance of each food group for assessing the dietary quality in adults. For instance, milk and dairy products were merged into the animal-based protein group, while nuts and legumes were combined with tempeh and tofu. Consequently, nine food groups that were less commonly consumed were merged into other similar groups. Ultimately, the remaining 12 food groups formed the components of the Quality Eating Index, as shown in Table 3.
Distribution of food consumption based on the quality eating index components (in portions/day, n = 30).

Scoring standards of the quality eating index among adult populations.
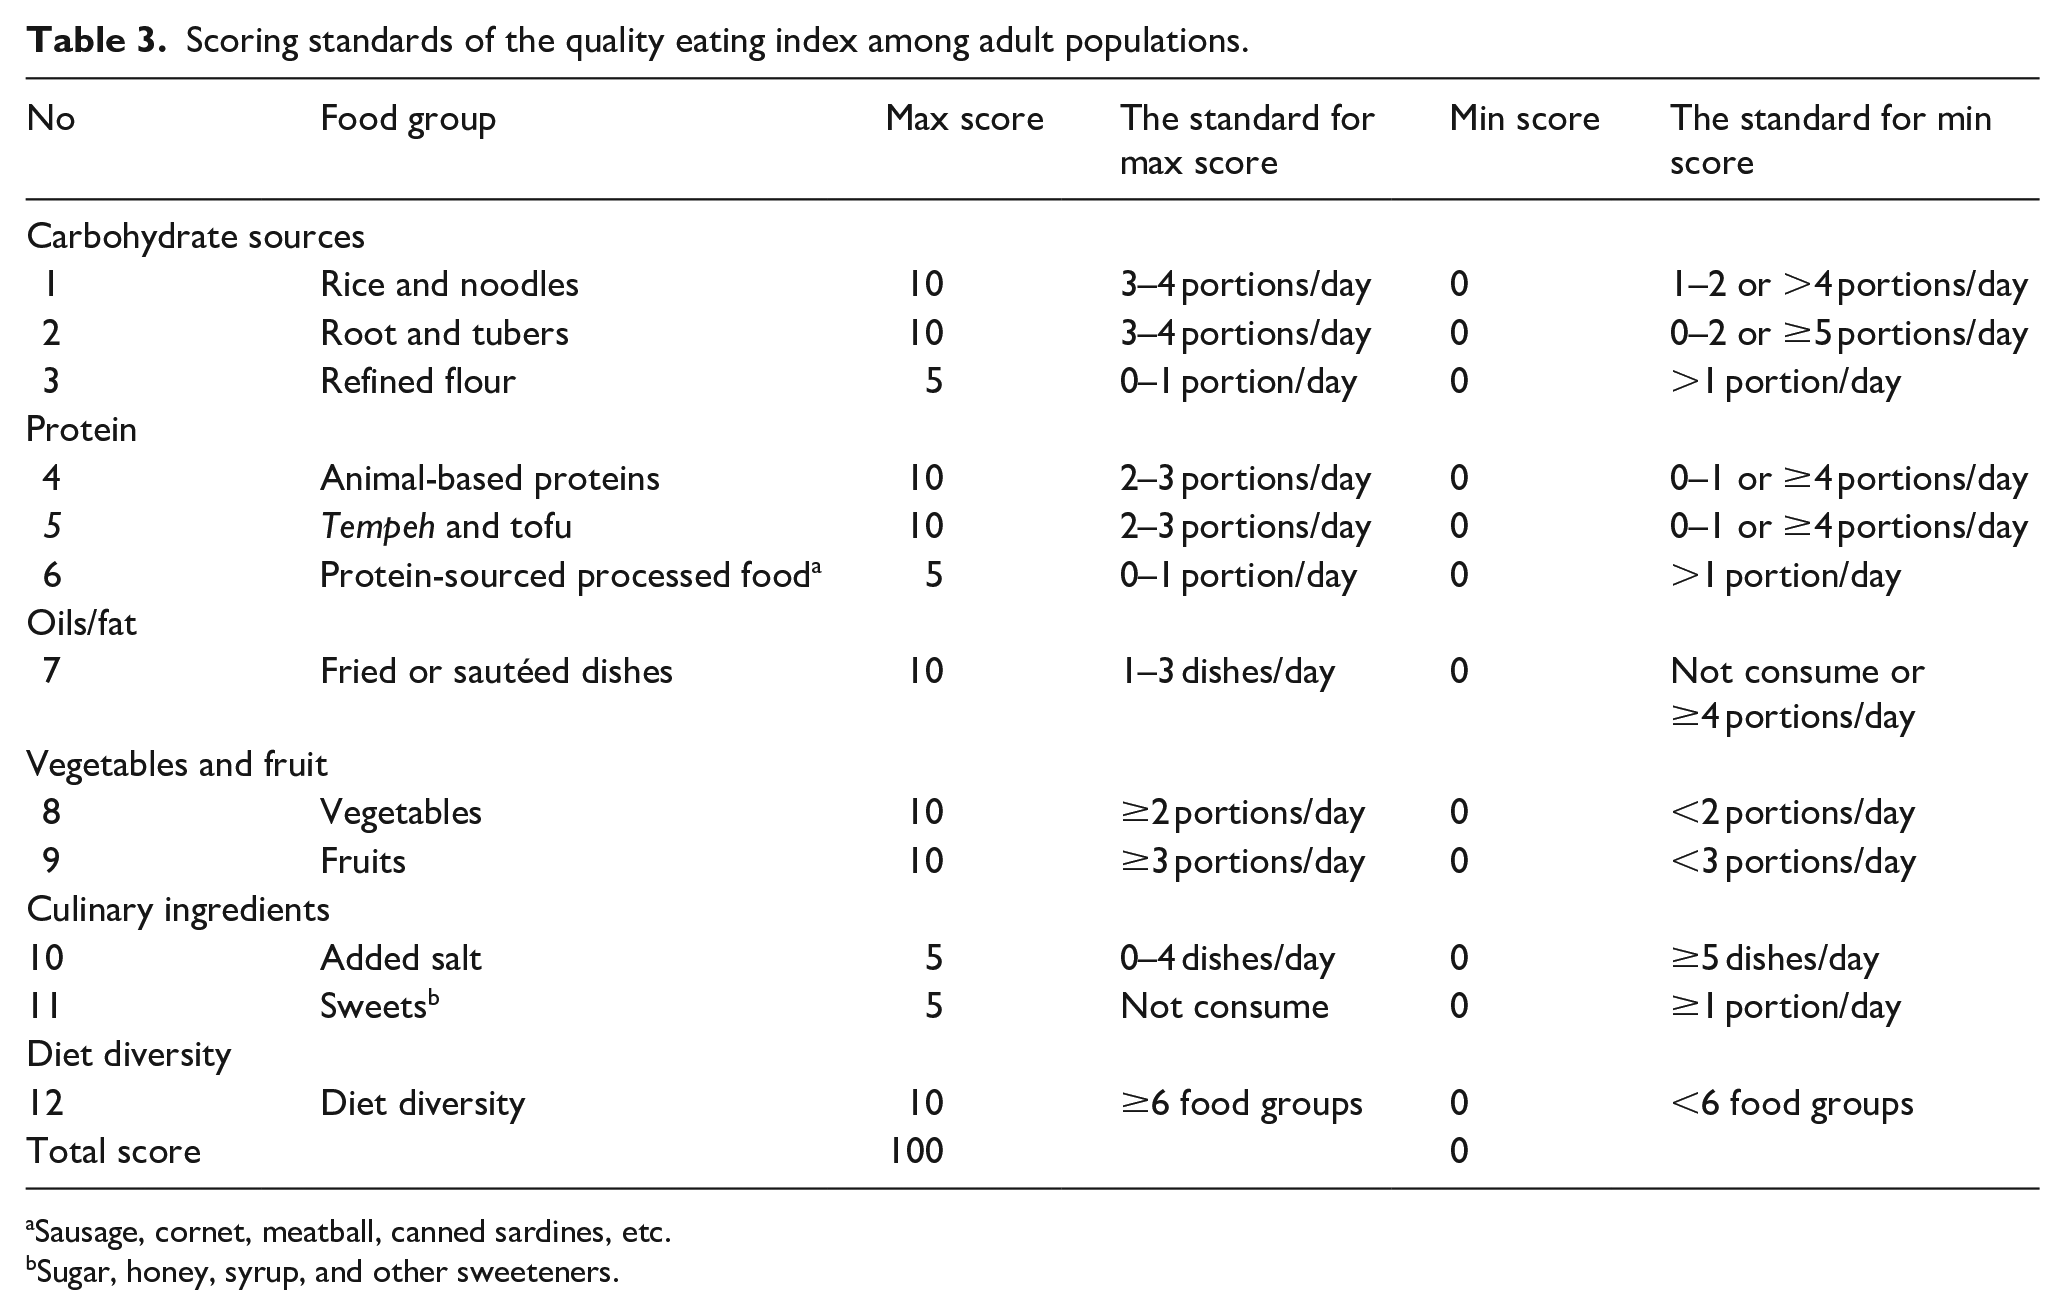
Sausage, cornet, meatball, canned sardines, etc.
Sugar, honey, syrup, and other sweeteners.
The scoring system was determined using points of 0, 5, and 10 for each food group (Table 3). The total score ranged from 0 to 100, with 0 indicating poor dietary quality and 100 representing excellent dietary quality. The scoring system was adapted from the development of the HEI and a previous study on the alternative BDI designed for women in Indonesia. 16 The steps to determine the scoring system were as follows: (1) translating the standard portion of each food group based on the Indonesian FBDG, (2) estimating the upper and lower limits of the standard portion for each food group, and (3) assigning scores of 0, 5, or 10 points to each food group, where higher points indicated better intake for adequacy components (e.g., vegetables, fruits, nuts, and legumes) or lower intake for moderation components (e.g., added salt and sweets), which were reverse-scored. Table 3 details the score weights for each index component. The food groups frequently consumed by Indonesian adults, such as rice and noodles, animal-based proteins, tempeh and tofu, and fried or sautéed dishes, were assigned a maximum score of 10. Similarly, vegetables and fruits were weighted as 10 due to their critical role as nutrient-rich foods, with recommended daily consumption of two to five portions to meet fiber, vitamin, and mineral requirements. The total score, with a maximum of 100, reflects the subject’s diet quality, where a higher score indicates better dietary quality.
Determining the total score and cut-off of the quality eating index
The cut-off determination was conducted by analyzing the sensitivity (Se), the specificity (Sp), and the area under the receiver operating characteristic (ROC) curve (AUC). The cut-off point was determined based on the highest AUC value and/or the combined summary of Se and Sp values. 22 Once the cut-off for the QEI was established, the criterion validity was assessed to evaluate the performance of the index against BMI, which is considered the gold standard for identifying individuals at increased risk of adiposity-related adverse health outcomes. 23 BMI has long been recognized as a reliable measure in this context. Furthermore, in sensitivity analyses, prior studies have indicated that diet quality can be effectively linked to epidemiological outcomes when BMI is employed as the reference standard. 24 This underscores the importance of BMI in validating diet quality indices.
The study was conducted in Yogyakarta province between June 2020 and June 2022. The study sites included both urban and rural areas, with the rural areas representing coastal, lowland, and mountainous regions. The participants were recruited using proportional stratified random sampling from the community. A total of 415 volunteer adults participated in the final phase of the study. The urban-to-rural ratio was set at 2:1, with the participants being proportionally assigned based on gender and age distribution for each site. Yogyakarta Province was selected as the sampling area for two main reasons: (1) it had the fifth-highest prevalence of obesity and metabolic diseases in Indonesia (2018) and (2) its diverse living areas represented various lifestyle and dietary patterns. The inclusion criteria were healthy adults aged 18–64 years, with no history of metabolic diseases, who were permanent residents of Yogyakarta Province. The exclusion criteria included pregnant or breastfeeding women and illiterate adults.
Variables related to diet quality
Blood samples were collected from all the participants via venous sampling after an overnight fast of at least 8 h, performed by a trained laboratory worker. The fasting blood glucose (FBG) levels were classified as pre-diabetes if the blood glucose concentrations ranged from 100 to 125 mg/dL. 25 Dyslipidemia was defined based on the following criteria: (1) high total cholesterol: ≥200 mg/dL, (2) high LDL: ≥130 mg/dL, (3) high triglycerides: ≥150 mg/dL, and (4) low HDL: <40 mg/dL.26,27 The metabolic syndrome was diagnosed using the National Cholesterol Education Program-Adult Treatment Panel III (NCEP-ATP III) criteria.19,27 A diagnosis was made when three or more of the following components were met: (1) FBG ≥110 mg/dL, (2) triglycerides ≥150 mg/dL, (3) HDL <40 mg/dL (men) or <50 mg/dL (women), (4) blood pressure ≥130/85 mmHg, and (5) waist circumference (WC) ≥102 cm (men) or ≥88 cm (women).
The protocol for blood pressure measurement was as follows: (1) the subject was asked to sit and rest for 5–10 min before the measurement and (2) the blood pressure was then measured using the OMRON M2 Basic – Digital Automatic Blood Pressure Monitor. The measurements were taken twice, with a 5-min interval between readings. According to the seventh meeting of the Joint Committee on Prevention, Detection, Evaluation, and Treatment of High Blood Pressure (seventh JNC), blood pressure is categorized as pre-hypertension if: (1) systolic blood pressure (SBP) is 120–139 mmHg or (2) diastolic blood pressure (DBP) is 80–89 mmHg. The body mass index (BMI) was classified according to the World Health Organization (WHO) standards as follows: (1) underweight: <18.5 kg/m2, (2) normal weight: 18.5–24.9 kg/m2, (3) overweight: 25.0–29.9 kg/m2, (4) obesity: ≥30.0 kg/m2. 28 The central obesity was defined by a waist circumference (WC) of ≥88 cm for female and ≥102 cm for male.
Ethical approval
The ethical approval was granted by the Institutional Review Board (or Ethics Committee) of the Faculty of Medicine, Public Health, and Nursing, Universitas Gadjah Mada, in March 2020, with the protocol code KE/FK/0492/EC/2020. Informed consent was obtained from all the participants before the interview and assessment began. The consent was provided in a paper-based form in Indonesian language, and it explained the study aim and procedures, the case report form used in the study, the data collection process, the benefits, including laboratory test result, nutritional status, and diet quality of each participant, confidentiality assurances, potential side effects, and the availability of medical treatment if needed.
Statistical testing
All the statistical analyses were performed using the Statistical Package for the Social Sciences version 20 (SPSS, Inc., ver. 20), licensed by Universitas Gadjah Mada. The normality of the numerical data was tested using the Kolmogorov-Smirnov test with a significance level of 0.05. The participants’ characteristics regarding the socio-demographic data were presented as frequency (%). The descriptive statistics for each food group was provided as mean and median values (portions/day). The cut-off for the Quality Eating Index was determined by analyzing the Sensitivity (Se) and Specificity (Sp), while the area under the curve (AUC) was calculated to identify the optimal cut-off score. The construct validity of the Quality Eating Index was assessed by comparing it to BMI and other parameters using the Chi-square (χ2) analysis with prevalence ratios (PR).
Results
As presented in Table 4, the socio-demographic characteristics of the 415 subjects were as follows: 60.7% were female and 51% were middle-aged adults (aged 29.1–49.0 years). The physical activity data showed that most of the participants were engaged in sedentary activities, as indicated by the higher prevalence of low and moderate activity levels (36.1% and 47.5%, respectively) compared to high activity level (16.4%).
Socio-demographic profile of the subjects (n = 415).

Urban area, including suburbs, and rural areas, including mountainous, coastal, and lowland areas.
No school means subject did not completed their formal education but can still read and write well. Primary school is Elementary schools, secondary school is junior and senior high schools, and tertiary school is universities or college.
Housewives and retired (unemployed), governmental and private employees (office employees), drivers, personal assistants, laborers, cadre, village apparatus, and farmers (others).
Physical activity is defined as Metabolic Equivalent of Task (METs) of 1.5–3.0 is low activity (light intensity activities, such as slow walking or typing), METs 3.0–6.0 is moderate activity (brisk walking or mopping), and METs >6.0 METs is high activity (vigorous activities, such as running or competitive sports).
Table 5 presents an analysis of the cut-off determination for the index, including sensitivity, specificity, MSS, and AUC, using BMI as the standard. The score gradation was simulated in intervals of 10, with two categories: (1) Poor or needing improvement and (2) Good diet quality. The results showed that the lower the poor cut-off score, the higher the sensitivity, and vice versa, as the score distribution was weighted toward only one category in extreme intervals, such as 10:90 and 20:80. In this case, the sensitivity and specificity were 100% and 0%, respectively. The distribution of 40:60 and 50:50 was a combination where sensitivity and specificity were not at the extremes. In the 40:60 combination (with a score of 60 for good diet quality), the cut-off score resulted in good sensitivity but poor specificity, and it performed better in terms of AUC than the 50:50 combination. Considering the highest AUC value, the 40:60 combination was chosen as the cut-off for the QEI, with a total score of <60 indicating poor (needing improvement) diet quality and ≥60 indicating good diet quality.
Cut-off determination of the quality eating index against body mass index as a gold standard.
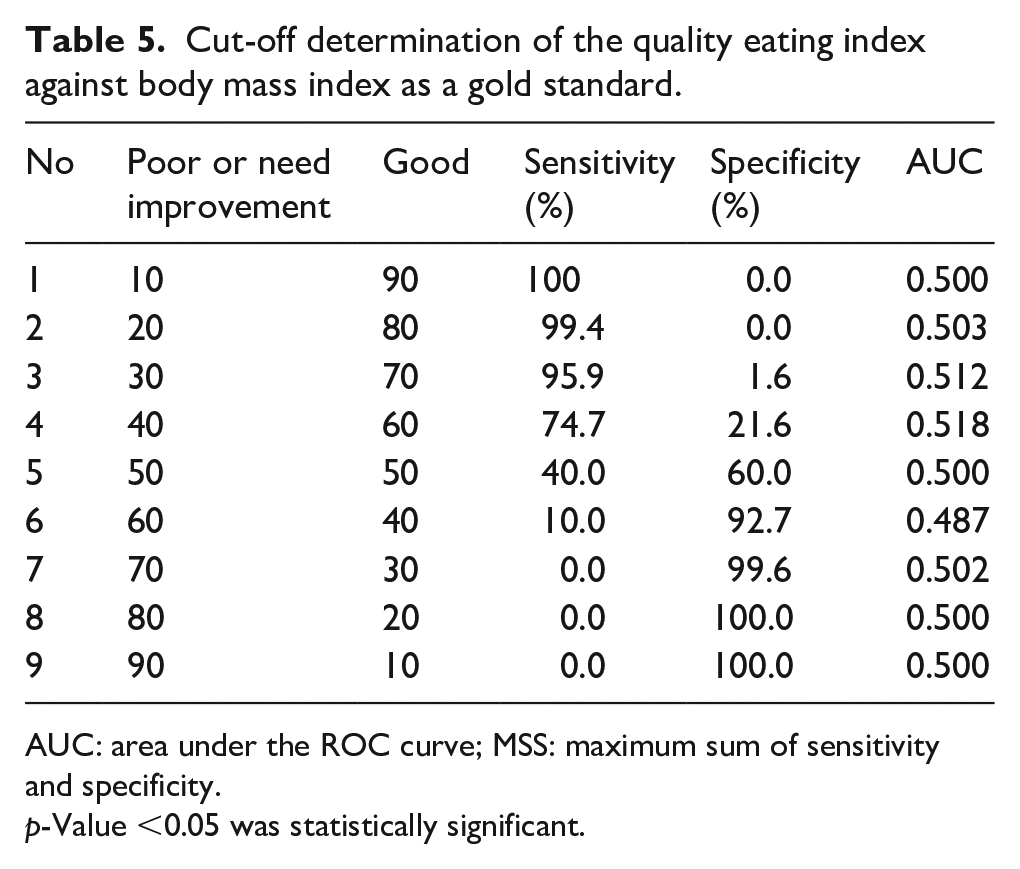
AUC: area under the ROC curve; MSS: maximum sum of sensitivity and specificity.
p-Value <0.05 was statistically significant.
Table 6 shows that the prevalence of good diet, assessed using the QEI with the 40:60 cut-off determination, was only 122 participants (29.4%), while 293 (70.6%) had a poor (needing improvement) diet. The criterion validity was assessed by analyzing the association between the diet quality and the gold standard (BMI), which revealed a significant relationship (p = 0.037, OR 95% CI = 1.6 (1.1–2.5)). The construct validity was also evaluated, showing that the diet quality tended to be associated with dyslipidemia (p = 0.083, OR 95% CI = 1.5 (1.0–2.3)). Although the diet quality did not demonstrate significant associations with other markers, including FBG, blood pressure, total cholesterol, LDL, HDL, triglycerides, and metabolic syndrome, all the odds ratio (OR) values indicated that the diet quality could be a potential risk factor for health outcomes.
Quality eating index compared with the BMI as a gold standard and against blood markers to assess nutritional and health status (n = 415).

95% CI: 95% confidence interval; OR: odds ratio.
Quality eating index was defined based on the total score: ≥60 is good and <60 is poor or needs.
Overweight and obesity is defined as BMI of ≥25.0 kg/m2 and normal is defined as BMI of 18.5–24.9 kg/m2.
Prehypertension is defined as a systolic blood pressure of 120–139 mmHg or diastolic blood pressure 80–89 mmHg.
Dyslipidemia is defined as total cholesterol of ≥200 mg/dL, LDL ≥130 mg/dL, HDL of <40 mg/dL, and triglyceride ≥150 mg/dL.
Metabolic syndrome is defined if ≥3 components are met, as follows: (1) FBG ≥110 mg/dL, (2) triglyceride ≥150 mg/dL, (3) HDL of <40 mg/dL (men) and <50 mg/dL (women), (4) blood pressure of ≥130/85 mmHg, and (5) WC of ≥102 cm (men) and ≥88 cm (women).
p < 0.05.
Discussion
Recent studies have increasingly focused on developing dietary indices in both developed and developing countries. 20 However, constructing and validating such indices while considering different types of living areas—urban, suburban, and rural—remains uncommon, particularly in Indonesia, where food consumption patterns are highly diverse. The main finding of our study reveals that the QEI was based on 12 food groups, aligned with Indonesia’s FBDG, and tailored to the habitual intake of the population. The food group components of the QEI differed from some existing dietary indices as carbohydrate sources were categorized into three distinct food groups, named rice and noodles, root and tubers, and refined flour. More importantly, protein-processed foods were included as an independent group, dairy and seafood were merged into animal proteins, and beans were combined with tempeh and tofu as plant proteins.
Some food groups were consumed below the recommended guidelines, particularly vegetables and fruits, whereas the consumption of oils from fried and/or sautéed dishes was excessive. A previous study describes that 27% of the Indonesian adult population, according to the Indonesia Food Consumption Survey (IFCS) 2014, consumed fat beyond the recommended limit (>67 grams/day or more than five tablespoons of oil per day, as outlined in the guidelines). 29 Analyzing the consumption patterns among adults, only the carbohydrate intake (approximately eight portions per day) met the guideline recommendation of three to eight portions per day for total carbohydrate sources, including rice, corn, whole grains, roots, tubers, and flour. This is reasonable since many carbohydrate sources are widely available and affordable for most of the Indonesian population.16,30 However, despite their affordability, such foods as corn, roots, and tubers are consumed far less than rice, noodles, and flour.31,32 White rice remains the primary carbohydrate staple food in Indonesia, followed by noodles, especially instant noodles, as the second most consumed carbohydrate source.30,33 Reports indicate that around 70%–80% of Indonesian adults consume instant noodles one to six times per week, making this ultra-processed food a significant contributor to carbohydrate intake.2,33 The variation in food consumption patterns, including differences in the types of food consumed by the adult population in Indonesia, highlights the challenges in applying existing dietary indices effectively.
On the other hand, it was not surprising that vegetable and fruit consumption was significantly lower (<1–1 portion/day) than the recommended amount of 2–5 portions/day.16,21 This finding aligns with prior studies, which report that the vegetable consumption among the Indonesian population ranges from 0.4 to 1 portion/day, while the fruit consumption ranges from 0.3 to 1.6 portions/day.16,34,35 A national report also reveals that only 23% of the adult population (≥20 years) consumes adequate portions of vegetables and fruits, which are the main sources of fiber. 2 The insufficient vegetable and fruit consumption among Indonesia’s adult population can be attributed to various factors. The internal factors include low motivation, low self-efficacy, and preferences for certain foods (food choice motives). Such external factors as the high availability of fast foods, limited availability of vegetables and fruits in the market, and purchasing power constraints also play a role.36,37 To address this issue, the Indonesian Ministry of Health (MoH) has launched a national movement called “GERMAS,” which stands for Gerakan Masyarakat Hidup Sehat or the Healthy Living Community Movement in English terminology. The movement aims to promote health as well as encourage individuals and communities to improve healthy living through several activities, including physical activity, consumption of fruits and vegetables, regular health check-ups, maintaining environmental cleanliness, avoiding smoking and alcohol consumption, and ensuring proper waste management.38,39 Interestingly, Indonesians often consume other sources of fiber, such as cassava, tubers, corn, and tempeh. Roots and tubers, for instance, provide 1.3–1.8 g of fiber/100 g. 40 Meanwhile, tempeh – a fermented soybean product and a key plant-based protein source for Indonesians – contains 3.1–4 g of fiber/100 g. 41
A systematic review suggests that dietary indices based on national dietary recommendations are useful for in-country comparisons and trend analysis as well as for considering the availability of foods and cultural dietary preferences. 42 As the Ministry of Health (MoH) of Indonesia has established the dietary recommendations through the balanced diet guidelines, the DQI must align with these guidelines, particularly regarding the components and standard portions of foods. It is noteworthy that indices developed in Indonesia may have different components and lower standard portions compared to existing indices (e.g., HEI, HLI, and DQI), such as the quality eating index. As demonstrated in many studies, dietary indices adopted for the Indonesian population should be adjusted according to the local guidelines to reflect differences in food components and portion sizes, given that Indonesians tend to consume fewer whole grains, milk and dairy products, nuts and legumes, seafood, red meat, and alcohol.11,35
The finding shows that 70.6% participants had poor diet quality and needed improvement. A previous study supports this finding as the mean of the diet quality score among the female population in Indonesia remains poor (31.0 ± 12.1), assessed by the developed balanced diet index (BDI). 16 However, diet quality is reported as a risk factor for BMI, in which a lower diet quality equates to a greater risk of overweight or obesity.10,24,29 In conclusion, the poorer the diet quality, determined by a lower score of diet quality, the higher the risk of dyslipidemia compared to the good diet quality.
Given that the quality eating index may serve as a screening tool to predict diet-related health outcomes, particularly overweight and obesity, BMI was used as the standard reference for validation. Epidemiological studies have demonstrated a direct correlation between obesity and inflammation, as evidenced by alterations in insulin resistance, hypertension, and atherosclerosis. 43 Serum concentrations of inflammatory markers, including high-sensitivity C-reactive protein (hs-CRP), tumor necrosis factor-α (TNF-α), and interleukin-6 (IL-6), are elevated in overweight and obese individuals. 43 Consequently, both obesity and visceral obesity are now considered inflammatory diseases. Additionally, men and women with a BMI of 30 or higher are classified as obese and are generally at higher risk for adverse health outcomes compared to those who are overweight (BMI 25.0–29.9 kg/m2) or lean (BMI 18.5–24.9 kg/m2). 44 Therefore, BMI is widely recognized as the gold standard for identifying individuals at increased risk of adiposity-related adverse health outcomes.
As a result of criterion validity, the quality eating index was only significantly associated with BMI, while the null hypothesis was rejected for the biochemical parameters. A consistent finding emerges from a study in the Philippines, where the Phil-HEI demonstrates the ability to establish an association between Phil-HEI scores and BMI scores. 24 However, another study examining diet quality and nutritional status also shows non-significant results. 45 Several factors can explain this. For instance, certain components, such as milk and legumes, are rarely consumed by the population, resulting in low portion sizes and scores for these foods.7,45 Additionally, the scoring system may have been overestimated as good dietary quality is determined by a total score of ≥80, while the average total score is 32–55.10,25 The fact that no associations were found should not be seen as a disincentive to the healthy diet implementation.
In contrast, a lower score on the quality eating index would indicate a 1.6-fold increased risk of being overweight or obese and a 1.5-fold greater risk of dyslipidemia. This finding is supported by previous studies, which show that the total scores of some indices (HEI, AHEI 2010, and DQI) have an inverse association with obesity.9,10,35,46 The quality eating index reflects the dietary patterns of most Indonesians, which are generally characterized by a high intake of refined carbohydrates and total fat and a lower intake of protein, vegetables, and fruits. Therefore, our findings highlight the importance of improving dietary quality by increasing dietary variety, reducing refined carbohydrate and total fat intake, and enhancing the intake of plant-based proteins, vegetables, and fruits to manage obesity and prevent cardiovascular diseases.
Our study has several strengths and limitations. First, we used several biomarkers, such as FBG, lipid profile, and blood pressure, which were related to different sample sizes. However, 415 adults might not be sufficient to capture the insignificant associations with such biomarkers as FBG, lipid profile, and blood pressure. Additionally, the sample was disproportionate in terms of gender. Another potential limitation was that other lifestyle factors, such as physical activity, should have been considered as a non-diet factor to the health outcomes. On the other hand, the strengths of this study include being the first study conducted in Indonesia to develop a quality eating index for assessing dietary quality in a quick and straightforward manner using only 12 simple questions. Furthermore, the trial phase of the index involved participants from both urban and rural areas, thus representing the diverse living environments of Indonesian citizens.
Conclusions and recommendations
The quality eating index was developed with 12 food group components, aligned with Indonesia’s balanced diet guidelines. The cut-off for good diet quality was ≥60, and for poor or needing improvement, it was <60. The criterion validity showed a strong agreement between the quality eating index and BMI as the gold standard, where poor/needing improvement diet quality was associated with a 1.6-fold higher risk of overweight or obesity compared to good diet quality. However, the construct validity revealed that poor/needing improvement diet quality was only marginally associated with dyslipidemia. The quality eating index has the potential as a useful tool for screening the diet quality among the Indonesian adult population.
We recommend that future studies be conducted in other regions with larger sample sizes, including various age groups such as the elderly and adolescents, to further evaluate the ability and applicability of the quality eating index in assessing diet quality. Additionally, enhancing the QEI by incorporating questions related to lifestyle factors such as physical activity, alcohol consumption, smoking habits, and sleep habits can improve its utility. In terms of its components, the quality eating index can become a valuable tool for assessing the dietary quality in the adult population in Indonesia.
Significance for public health
The quality eating index among the Indonesian adult population needs to develop and evaluate. The HEI-2015, as the most used eating index for Indonesian, still needs adjustment for some of the food groups and portions. A modification from existing eating indices is essential to precisely examine the quality of the diet consumed by adults, involving local food groups, and accommodating the Indonesian FBDG to fill the gap. Therefore, this study aims to: (1) develop the quality eating index to depict diet quality and (2) evaluate the performance of the instrument to assess the association between diet quality to nutritional status among the Indonesian adult population. Government and health professionals, including nutritionists and dietitians, will use the quality eating index from our study to assess the diet of the Indonesian adult population.
Supplemental Material
sj-docx-1-phj-10.1177_22799036251329420 – Supplemental material for Development of a quality eating index and its relationship with nutritional status in adults
Supplemental material, sj-docx-1-phj-10.1177_22799036251329420 for Development of a quality eating index and its relationship with nutritional status in adults by Susetyowati Susetyowati, Emy Huriyati, Farah Faza, Nadira D�mas Getare Sanubari and Ahmad Syauqy in Journal of Public Health Research
Footnotes
Acknowledgements
We would like to acknowledge the valuable team of the research, including nutritionists and administration team from the Department of Nutrition and Health, Universitas Gadjah Mada who genuinely assisted our team to handle this study. We also thank all subjects who participated in this study.
Author contributions
Conceptualization and validation were performed by Susetyowati. Methodology, investigation, and supervision were carried out by Susetyowati, Emy Huriyati, Nadira D’Mas Getare Sanubari, Farah Faza and Ahmad Syauqy. Data curation and formal analysis were executed by Nadira D’Mas Getare Sanubari, Farah Faza, Susetyowati. Project administration was handled by Nadira D’Mas Getare Sanubari. Writing-original draft was done by Farah Faza, while Writing–review and editing was performed by Susetyowati and Ahmad Syauqy. All authors have read and agreed to the published version of the manuscript.
Declaration of conflicting interests
The author(s) declared the following potential conflicts of interest with respect to the research, authorship, and/or publication of this article: The correspondent author and the team officially declare that there is no conflict of interest in this study. The funding had no role in the design of the study; in the collection, analyses, or interpretation of data; in the writing of the manuscript, or in the decision to publish the results.
Funding
The author(s) disclosed receipt of the following financial support for the research, authorship, and/or publication of this article: This research was funded by the Directorate General of Higher Education, Research, and Technology, Ministry of Education, Cultural, Research, and Technology. The grant number was 6598/UN1/DITLIT/DIT-LIT/PT/2021 and the APC was funded by the Faculty of Medicine, Public Health, and Nursing, Universitas Gadjah Mada.
Supplemental material
Supplemental material for this article is available online.
References
Supplementary Material
Please find the following supplemental material available below.
For Open Access articles published under a Creative Commons License, all supplemental material carries the same license as the article it is associated with.
For non-Open Access articles published, all supplemental material carries a non-exclusive license, and permission requests for re-use of supplemental material or any part of supplemental material shall be sent directly to the copyright owner as specified in the copyright notice associated with the article.