
Abstract
Background:
Pandemic fatigue emerged early during the COVID-19 pandemic and remains a concern as new variants emerge and ongoing public health measures are needed to control them. A wide range of factors can affect pandemic fatigue, but empiric research indicating which may be most important to adherence in specific populations is lacking.
Design & Methods:
We conducted a longitudinal study of changes in physical distancing in two cohorts: adults living with children <18 years and adults ≥50 years old. Six types of non-work, non-household contacts were ascertained at six times from April to October 2020. We used generalized estimating equations Poisson regression to estimate the one-week change in contact rate and how this differed based on sociodemographic characteristics.
Results:
The rate of all contact types increased during the middle of the study period and decreased toward the end. Changes in contact rates over time differed according to several sociodemographic characteristics, including age, gender, race/ethnicity, education, household composition, and access to transportation. Furthermore, the factors influencing the rate of change in contact rates differed by the type or setting of the contact, for example contacts as a result of visiting another person’s home versus during a retail outing.
Conclusions:
These results provide evidence for potential mechanisms by which pandemic fatigue has resulted in lower physical distancing adherence.
Significance for public health
Pandemic fatigue negatively impacted the adherence to protective measures against the COVID-19 pandemic, and it is likely to arise in future outbreak and pandemic situations. Understanding the onset of pandemic fatigue can provide insight into triggering factors and circumstances that precipitate declines in adherence. This paper identifies multiple sociodemographic subgroups who reduced physical distancing practices more quickly than others for specific types of contacts. The specific mechanisms at work likely involve both psychological and material motivators, emphasizing that strategies to support long-term adherence to public health control measures need to consider both facets of behavior. Variation in the importance of sociodemographic characteristics across contact types can be leveraged to more effectively target public health messaging, identify opportunities for mitigating pandemic fatigue, and ultimately better control future outbreaks.
Introduction
Pandemic fatigue emerged early in the COVID-19 pandemic,1–3 and global analyses have demonstrated its existence to be widespread.4,5 Indeed, popular media have depicted declines in adherence to public health guidelines as related to and perhaps caused by a form of exhaustion related to the effortful work proceeding from changing one’s behavior in the face of pandemic infection.6,7 Attribution of fatigue as a cause of behavior change implies that reduced adherence results from complex relationships between cognitive dispositions, attitudes, and behaviors.
The World Health Organization (WHO) has defined pandemic fatigue as the “demotivation to follow recommended protective behaviors,” manifesting as declining risk perception, avoidance of pandemic-related information, and incomplete adherence to public health recommendations. 8 Pandemic fatigue compromises an individual’s safety and a community’s ability to respond effectively to new waves of infection as novel variants evolve. It has been identified as a contributing factor in reinfections 9 and excess mortality. 10
Ongoing public health measures to avoid spikes in COVID-19 mortality, including repeated vaccine boosters and periodic mobility restrictions necessitate sustained public responsiveness; with an understanding of the factors most important to pandemic fatigue, governments can support such responsiveness through targeted programs and public health messaging. WHO has conceptualized the factors underlying pandemic fatigue using a COM-B (Capability, Opportunity, Motivation, and Behavior) framework, indicating the importance of characteristics such as awareness and health literacy (Capability), income and cultural norms (Opportunity), and risk perceptions and experienced hardship (Motivation). 8 However, empiric research on the factors influencing pandemic fatigue have been limited in depth.3,4,11–15 Few have studied the question longitudinally14,15 and none of have clearly quantified adherence, providing scant guidance on which of the 20 or more potential factors 8 would be most useful to act upon. Moreover, the factors most important to pandemic fatigue likely vary by setting, given differences in governments’ pandemic response measures, social structure, and cultural norms. Studies examining pandemic fatigue in the U.S. have been especially limited,3,15 and it remains unclear which factors most influence changes in adherence to public health guidelines over time in this setting.
The aim of this analysis was to identify sociodemographic factors related to motivation and/or opportunity to adhere to physical distancing during initial community containment measures for the COVID-19 pandemic, thus providing insight into the beginnings of pandemic fatigue. The COVID-19 Preparedness & Response Study followed two Midwestern cohorts from April to October 2020 to track changes in physical distancing over time. Non-work, non-household contact rates increased progressively through the first 3 months (mid-April to mid-July) of pandemic control measures, potentially reflecting pandemic fatigue, but declined again in the latter half of the study period (coinciding with the end of summer and the start of the second COVID-19 wave). We found that changes in contact rates over time differed according to several sociodemographic characteristics, with meaningful effects emerging along lines of age, gender, education, household composition, and access to transportation. These results provide evidence for potential mechanisms by which pandemic fatigue resulted in lower adherence to physical distancing.
Design & methods
Study population
Participants were enrolled into one of two cohorts of the COVID-19 Preparedness & Response Study between April 16, 2020 and June 9, 2020. Cohort 1 (C1), the “family cohort,” included adults living in households with children <18 years old, studied because of the anticipated additional challenges to long-term adherence children could present. Cohort 2 (C2), the “older adult cohort,” included adults ≥50 years old, one-third of whom had Parkinson’s disease; this cohort was studied to incorporate the effect of elevated risk of severe disease on long-term adherence. C1 was a convenience sample recruited from the general public via social media (Facebook, Twitter) and limited to residents of Minnesota and Iowa. C2 was recruited from an established registry of Minnesota residents for the study of Parkinson’s disease, which included individuals with Parkinson’s disease and controls recruited from fairs, clinics, and support groups. We invited all individuals on the registry to participate.
This study was approved by the University of Minnesota Institutional Review Board (IRB) under STUDY00009362. Informed consent was obtained via an online form or verbally over the phone with approval of the IRB.
Survey
The baseline survey was conducted during a period of stay-at-home orders, non-essential business and school closures, and other similarly restrictive public health guidance, which was relaxed over time. The first four follow-up surveys were conducted at 2, 4, 8, and 12 weeks after the baseline survey. Participants completed their final survey in late August to early September for C2 and late September to early October for C1(to ascertain behaviors once school had resumed). Most participants completed surveys online using REDCap 16 ; 7.4% (25/339) of participants in the older adult cohort requested to complete the initial survey by telephone, and trained interviewers entered their data into a REDCap form.
We gathered sociodemographic information on the baseline survey. This included information about personal identity (age, gender, race, ethnicity), socioeconomic status (education level, income, home ownership and type, employment status), and household characteristics (number in household, household members with pre-existing conditions, owning a vehicle). For analysis, gender was collapsed into three categories for C1, man, woman, or non-binary; only the first two designations were used in C2, as there were too few non-binary individuals to analyze. Participants could select multiple race and ethnicity designations; to enable analysis, race and ethnicity were combined and dichotomized as only white or racial/ethnic minority. Education levels included “less than high school” and “high school or GED,” which were combined in analysis; “post high school, including trade school”; “4 year college degree”; and “masters/doctorate.” Participants indicated their household income according to range, from <$20,000 to ≥$80,000 in $20,000 increments; categories <$60,000 were combined for analysis. For home type, we distinguished homes that could share communal space, such as apartments, townhomes, duplexes, and trailer homes, from single-family homes; for C2, congregate living facilities, such as nursing homes, were distinguished from other home types.
To measure adherence to physical distancing, participants were asked to report the frequency of visits to retail, dining, residential, outdoor, and other locations during non-work outings in the 7 days before the survey. Participants indicated their number of outings for the previous week for each type as 0, 1, 2, 3, or more than 3. To align with relaxing public health guidelines, on surveys 4–6 participants indicating “more than 3” were prompted to specify the exact number of outings. Retail outings explicitly excluded curbside pick-up that occurred without entering the store. Dining explicitly referred to staying at the establishment to eat or drink. “Other” outings included gyms and salons, which were asked about explicitly on surveys 4–6 after they were reopened and added into the “other” category for analysis. The “other” category excluded medical and caregiving facilities, which were asked about explicitly on all surveys but excluded from this analysis.
For each type of outing made in the past 7 days, participants reported the number of non-work, non-household contacts they had on their most recent outing. They also provided the number of visitors to their homes during the prior 7 days. Contacts were defined as “interactions” to improve recall, and participants were provided with the following examples, “having a conversation, making a purchase, or standing closer than 6 feet to another person for a few minutes.” Outdoor contacts explicitly excluded passing someone on the street without stopping to talk. Participants indicated the number of contacts for each outing type, as well as visitors, as 0, 1, 2, 3, 4, or more than 4, and a prompt to enter the exact number of contacts when “more than 4” was indicated was added to surveys 4–6.
Analysis
We analyzed the cohorts separately, a priori, due to fundamental differences in sampling frames and methodologies. All individuals from each cohort were analyzed.
We used censored Poisson models adjusted for age, gender, and state (C1) or Parkinson’s disease status (C2) to estimate the true value of “greater than 3” outings and “greater than 4” contacts on surveys 1–3. The “greater than” values were set to censored, and all other values were treated as uncensored. Based on the model coefficients and combination of covariates, we then calculated the likely value based on a Poisson distribution and rounded to the nearest integer. The value for the most recent contact was multiplied by the number of outings for the previous 7 days to obtain an average number of contacts for the previous week for each contact type.
We visually examined overall trends in contacts using plots of the average number of contacts for each contact type and used this assessment to determine whether to include a quadratic term for week in multiple regression models. Main effect terms for multiple regression models included sociodemographic characteristics identified as most likely to alter individuals’ contact rates during the pandemic and terms for week. Each contact type was modeled separately as a Poisson-distributed count. To account for repeated measures on individual participants, we used generalized estimating equations with an exchangeable correlation structure and the sandwich estimator for standard errors.
We used a multi-step process to determine which interactions with week to test. Personal demographic characteristics age, gender, and race/ethnicity were tested for all contact types. For all other sociodemographic characteristics, we first generated descriptive interaction plots between the characteristics and week, averaging the number of contacts for each week and for each factor level of the particular sociodemographic characteristic. Two authors (KJM, GAMT) independently reviewed the plots and determined which appeared to indicate interactions based on visible trends; for any variables lacking consensus, all authors reviewed the plots and voted on their inclusion. Any sociodemographic characteristics tested as interactions for one contact type for a particular cohort were included in the initial model for all contact types for that cohort so that all initial models within the cohort evaluated the same set of interactions. From this full model, an ANOVA was used to determine whether the addition of each interaction contributed significantly to the overall fit of the model, using a cutoff of p < 0.10. Removing any interactions with p-values above this cutoff, a final model was fit for each contact type.
Average values of all covariates for the cohort were used to predict the weeks when contacts would have been highest and lowest during the study period. Using these average values, we generated figures comparing different levels of the interaction terms using the interactions package 17 in R Core Team. 18 Each interaction coefficient from the final models was exponentiated to provide a ratio of rate ratios (RRs) of the effect of week. Each RRweek is a ratio of contact rates for a 1-week change. Therefore, the interaction ratio of RRsweek is the increase or decrease in the per-week change in contact rates associated with a one-unit difference in the interacting variable.
Sensitivity analysis
We assessed the sensitivity of our results to the assumptions of the censored Poisson model applied to the outings and contacts from the first three surveys by inferring the values from surveys 4 to 6 as though participants had not been asked for explicit numbers of outings ≥4 and contacts ≥5. We compared histograms of true and inferred counts and repeated the primary analyses using the inferred counts for all surveys.
Results
Our primary goal was to determine whether factors believed to affect motivation and opportunity in pandemic fatigue 8 influenced adherence to physical distancing during a period of widespread containment measures. On six occasions, we ascertained non-work, non-household contacts for the previous week among our two cohorts and modeled changes in different types of contact rates as affected by sociodemographic characteristics. We estimated several interactions between sociodemographic factors and week in the association with type-specific contact rates.
Of 997 participants in C1 and 339 in C2 who completed the baseline survey, 972 (97.5%) and 305 (90.0%), respectively, provided sufficient sociodemographic information for inclusion in the analysis. Not all participants completed all follow-up surveys, yielding 4198 contacts in C1 and 1684 in C2 for analysis. Contacts with unrealistic values were removed, for final totals of 4189 and 1681, respectively.
The age of C1 participants ranged from 25 to 74 years (mean 40.6, SD 6.5), and the cohort included 859 women, 106 men, and 4 individuals identifying as non-binary (Table 1). In C2, participants ranged from 52 to 89 years (mean 68.0, SD 7.2), and the cohort included 154 women and 151 men. Demographic representativeness relative to the Minnesota and Iowa populations has been reported previously. 19
Sociodemographic profile of the study cohorts.

GED: general educational development test; SD: standard deviation.
Racial/ethnic totals add to >100%, because participants could select more than one category.
Average weekly contacts varied over time, by contact type, and by cohort
In both cohorts, retail contacts produced the greatest number of average contacts per week over the study period (Figure 1). The rate of all contact types increased during the middle of the study period and decreased toward the end. Outdoor contacts in C1 appeared to increase more sharply than any other type during the middle of the study period, which coincided with the summer months.

Average weekly contacts by cohort and contact type. Dot size is proportional to the number of surveys that were submitted on a particular week. Vertical blue dashed lines correspond to important days with the potential to influence social distancing. In order from left to right, they are: March 25, Minnesota’s stay-at-home order was issued; May 17, Minnesota’s stay-at-home order ended; May 25, George Floyd was murdered, spurring widespread protests; June 1, non-essential businesses reopened in Minnesota at 50%; and July 24, Minnesota’s mask mandate began. Iowa did not institute a stay-at-home order, non-essential businesses were reopened in phases, and did not institute a mask mandate until November 2020; thus, only Minnesota’s policy dates are shown by the vertical lines.
We modeled statistically significant non-linear changes over time in the rate of contacts for all contact types in both cohorts (column 1 in Figures 2 and 3), except for “other” contacts. Significant non-linear changes in contact rates were all modeled with a positive linear term and negative second-degree polynomial term for week. For example, the coefficients for the per-week change in retail contacts in C2 were 0.376 for the linear term and −0.007 for the squared term (Table S1).

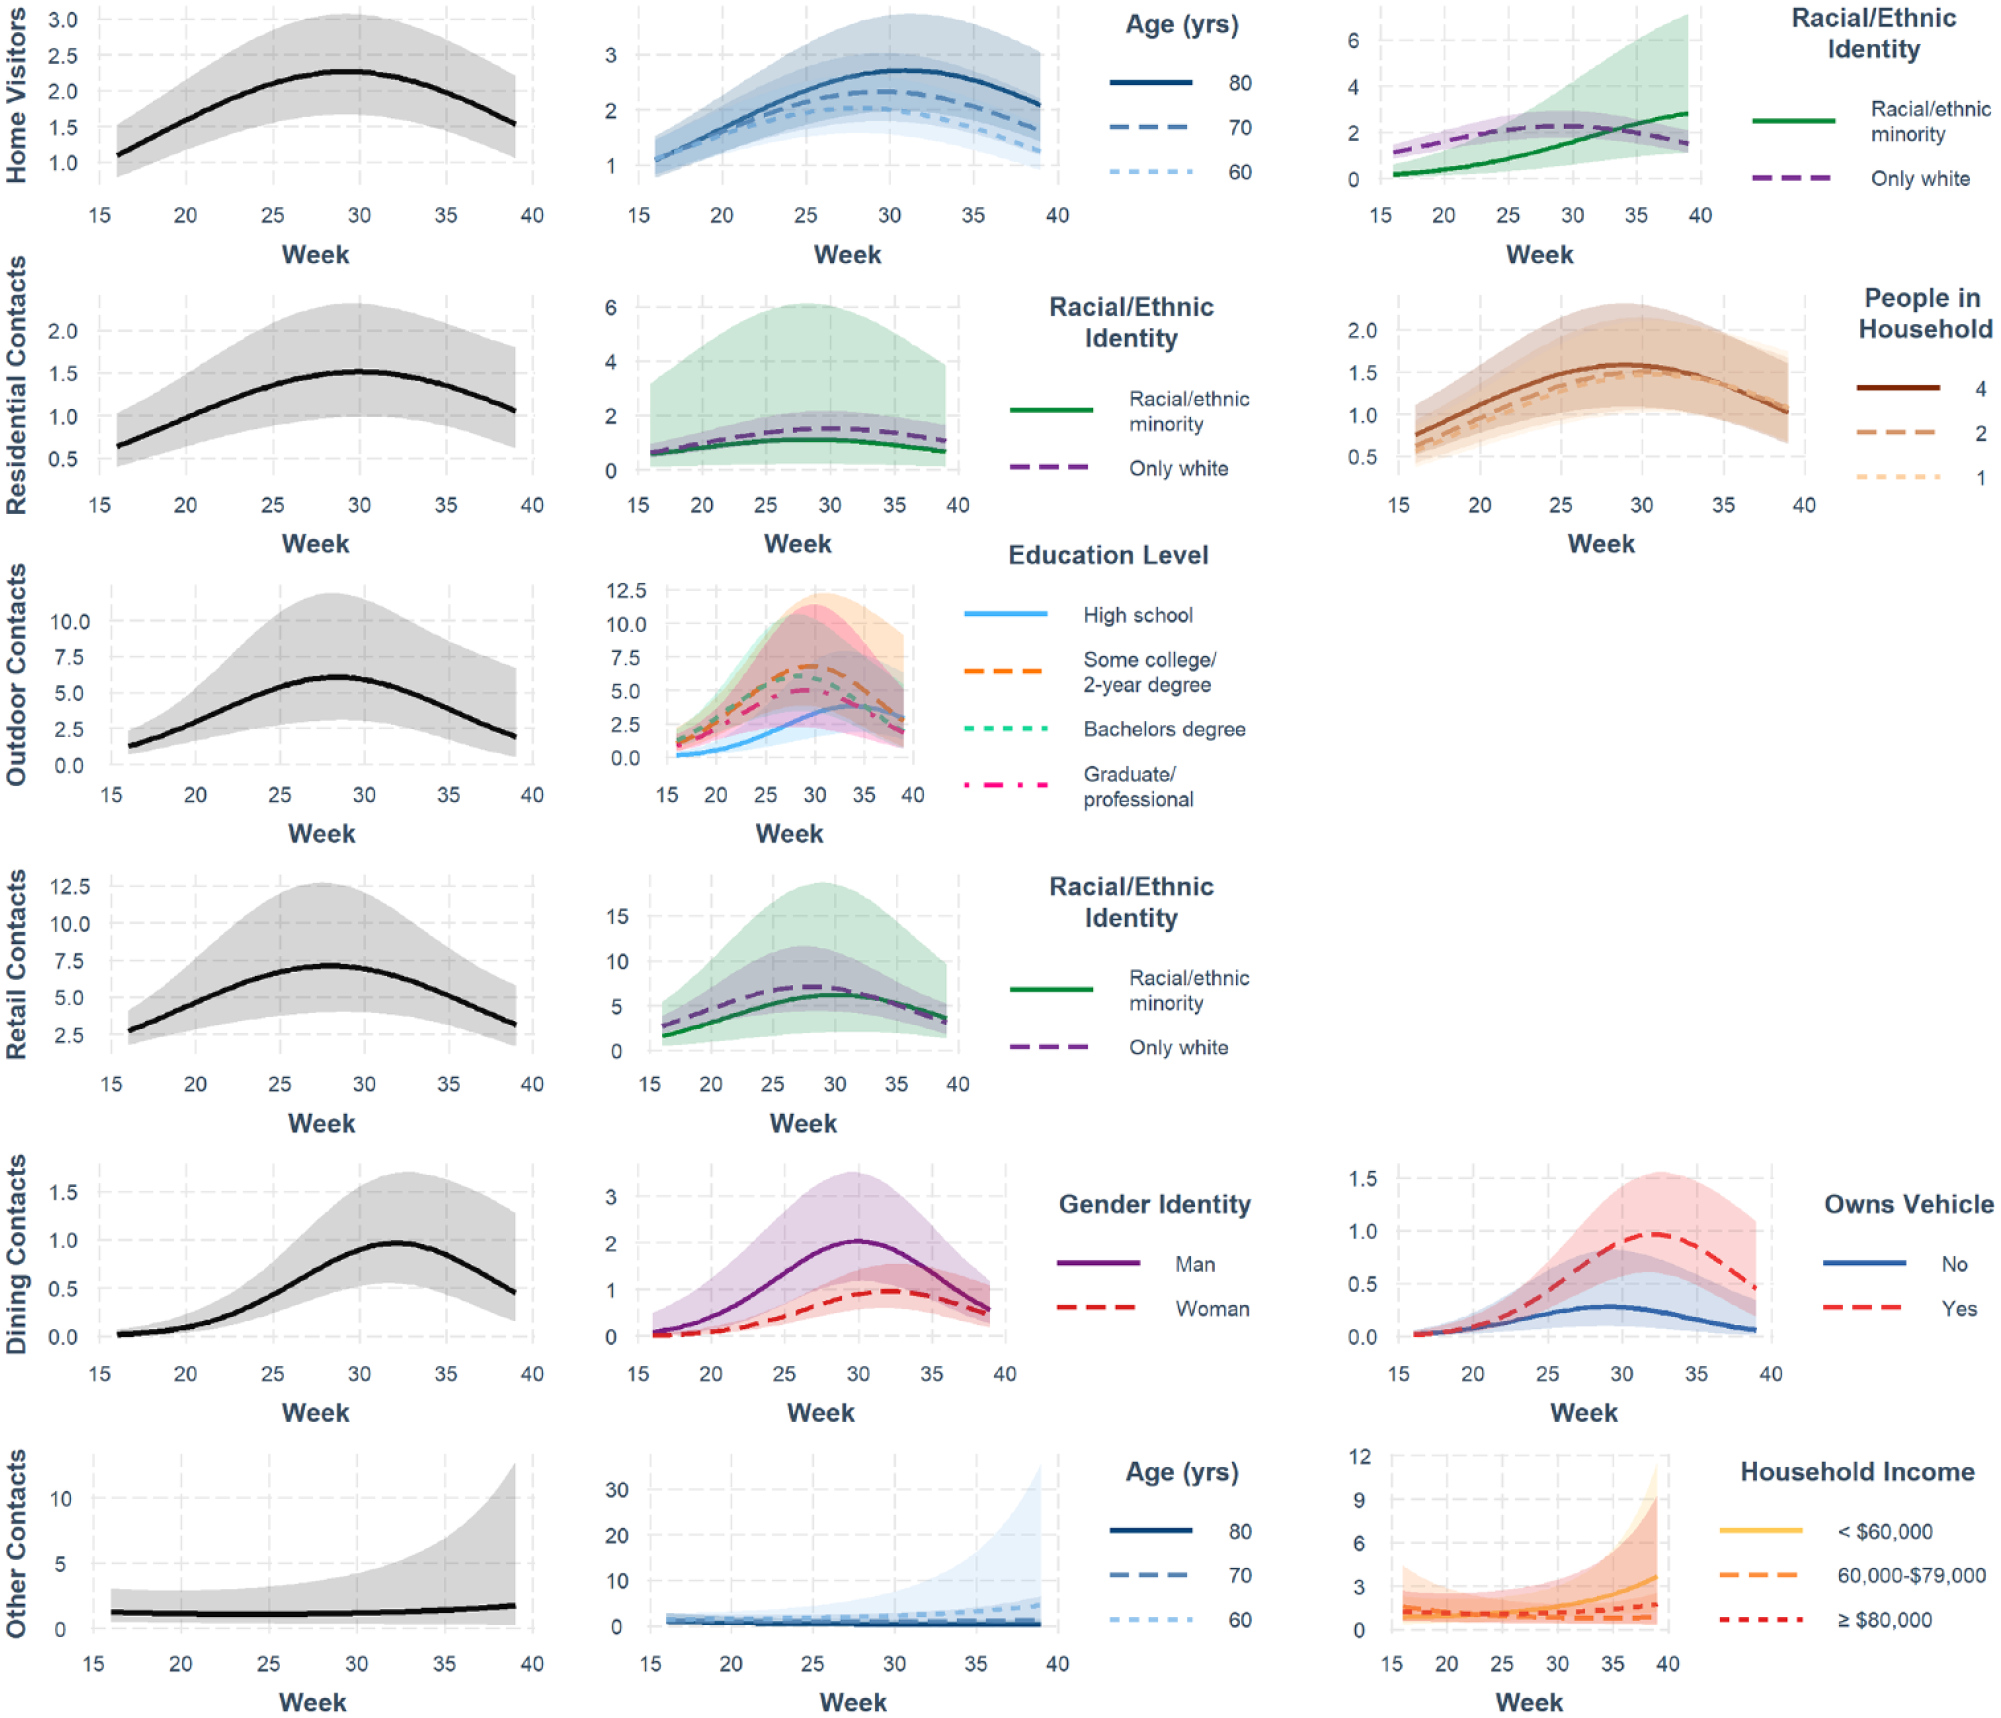
Changes in contact rates over time among adults with children. Curves depict the predicted contacts for an average individual in Cohort 1 based on final Poisson multiple regression models. Models included interactions between week and the covariates graphed for each contact type. Additionally, all models included main effects terms for age, gender, race/ethnicity, employment, income, education, having a household member with a high-risk condition, home type, number of people in the household, owning a vehicle, week, and week. 2
Changes in contact rates over time among adults over the age of 50. Curves depict the predicted contacts for an average individual in Cohort 2 based on final Poisson multiple regression models. Models included interactions between week and the covariates graphed for each contact type. Additionally, all models included main effects terms for age, gender, race/ethnicity, employment, income, education, having a household member with a high-risk condition, home type, number of people in the household, owning a vehicle, Parkinson’s disease status, week, and week. 2
However, while almost all models estimated the lowest contact rate in week 16 (the week beginning April 13, 2020), the first week of data collection, the timing of peak contact rates differed between the two cohorts. For an average individual in C1, all contact types were predicted to peak between weeks 30 (July 20) and 32 (August 3) based on our final models. The number of peak weekly contacts predicted for an average C1 participant ranged from 2.1 for dining contacts to 9.1 for retail contacts (Table S2). Predicted contact rate peaks in C2 occurred for retail and outdoor contacts in week 28 (July 6), followed by visitors and residential contacts in weeks 29 and 30, respectively. Predicted dining contacts peaked in week 32, and “other” contacts did not peak until week 39 (September 22). C2 predicted peak contact rates were lower for every contact type compared to C1, ranging from 1.0 predicted dining contact per week to 7.1 predicted retail contacts per week for an average C2 participant during peak weeks. These findings show that the older adult cohort returned to non-work, non-household contacts across a range of settings in a more staggered pattern and at a lower level than the family cohort.
Factors associated with changes in the rates of visitors and residential contacts differed
We examined the sociodemographic characteristics interacting with week for each contact type to understand which factors motivate more rapid declines in adherence in different settings, as expressed as higher contact rates. Visitors to participants’ homes and contacts during participants’ visits to the homes of others (“residential contacts”) both occur in the same setting, but changes over time in these contact rates were associated with different factors. At baseline when there were substantial shutdowns, C1 participants without a personal vehicle had more visitors (Table S3), but the rate of visitors increased faster among vehicle owners (ratio of RRs 1.04; 95% CI 1.00, 1.08), with higher predicted rates in that group by the end of the study (row 1 in Figure 2). In C2, every 10-year increase in age was associated with a 1% increase in visitors RRweek (ratio of RRs 1.01; 95% CI 1.00, 1.02) (row 1 in Figure 3). The visit rate among individuals in this cohort from racially or ethnically marginalized groups was significantly lower at baseline than among white participants (main term RR 0.03; 95% CI 0.00, 0.19) and increased over time, with the change in visit rate per week 11% higher than among white participants (ratio of RRs 1.11; 95% CI 1.07, 1.16).
Conversely, for residential contacts in C2, there were no initial racial/ethnic differences, but white participants had a larger weekly increase in the residential contact rate relative to racially/ethnically marginalized individuals (row 2 in Figure 3), though this became non-significant in the final model (Table S4). The only other factor influencing the change in rate of residential contacts in this cohort was household size, with each additional person in the household reducing the residential contact RRweek by 1% (ratio of RRs 0.99; 95% CI 0.99, 1.00). The effect of household size was opposite in C1, with each additional person increasing the residential contact RRweek by 1% (ratio of RRs 1.01; 95% CI 1.00, 1.02) (row 2 in Figure 2). Individuals with some college or a 4-year degree had higher baseline residential contact rates than those with up to a high school degree (Table S4). With each additional week of the pandemic, their residential contact rates both decreased 5% relative to individuals with up to a high school degree (ratios of RRs 0.95; 95% CIs 0.91, 1.00 and 0.91, 0.99, respectively), till the average contact rate of individuals with up to a high school degree became higher than either other group at approximately week 30. Overall, these results indicate that although visitor and residential contacts arise from interactions in the same setting, changes over time in their frequency are likely motivated by different factors.
Changes in outdoor contact rates varied with education level
Similar to the effect of education on residential contacts in C1, outdoor contact rates were initially lower among participants with up to a high school education and then increased 1%–5% more quickly than among the other groups (Table S5), again exceeding the others’ estimated contacts at approximately week 30 (row 3 in Figure 2). Age also had a small effect on outdoor contacts in this cohort, with each 10-year increase in age associated with a 1% decrease in the RRweek (ratio of RRs 0.99; 95% CI 0.97, 1.00). The education effect observed in C1 was also seen in C2, with individuals with up to a high school education having proportionally much lower outdoor contact rates initially, increasing 8%–11% more quickly than the other groups (Table S5). However, on average, individuals with up to a high school education did not exceed the outdoor contact rate of the other groups by the end of the study period in this cohort (row 3 in Figure 3). The observed dynamics of individuals with up to a high school degree across cohorts suggests there may be a common effect of education level on outdoor contact rates.
Demographic characteristics were the only factors associated with differences in changes in retail contact rates
Individuals in C1 identifying as non-binary had fewer retail contacts at baseline than those identifying as men (Table S6). However, our model indicated the 1-week relative change in retail contact rate was 9% greater for non-binary individuals compared to men (ratio of RRs 1.09; 95% 1.04, 1.14), exceeding those of both men and women by the end of the study period (row 4 in Figure 2). In C2, the weekly change in retail contacts was 3% greater for racially/ethnically marginalized individuals than for white individuals (ratio of RRs 1.03; 95% 1.00, 1.06) (row 4 in Figure 3). No other variables emerged as significant modifiers of the rate of change of retail contacts in either cohort.
Dining and “other” contact rate changes differed across several characteristics
The cohorts differed markedly in the characteristics that modified changes in dining and “other” contact rates, which encompass the most discretionary non-work, non-household contacts we examined. The dining contact RRweek increased 14-15% faster among C1 participants with up to a high school education compared to the other education level groups (row 5 in Figure 2; Table S7), similar to what was seen with residential and outdoor contacts. It decreased by 2% (ratio of RRs 0.98; 95% 0.95, 1.00) for each 10-year increase in age. In C2, women’s dining contact rate was significantly lower than that of men’s (Table S7); however, neither the interactions with gender nor vehicle ownership were significant in the final model, though either effect would have been small due to the low average dining contacts in this cohort (row 5 in Figure 3). While changes in “other” type contacts over time were minimal, individuals in C1 with a household member with a condition that would predispose them to severe COVID-19 outcomes (row 6 in Figure 2) and individuals in C2 reporting a household income <$60,000 (row 6 in Figure 3) experienced greater increases in this contact type relative to other groups (Table S8). Taken together, the results for dining and “other” contacts demonstrate that a wide variety of factors may be driving changes in these particularly discretionary contact types.
Sensitivity analysis
Comparing histograms of reported counts of outings and contacts with inferred counts from the censored Poisson for participants reporting ≥4 outings or ≥5 contacts, outdoor outings stood out as the only count that was markedly underrepresented by the inferred counts (Figures S1, S2). In repeating our analysis using only inferred counts for all surveys, the effect of week was lower to varying degrees in C1 for all contact types and in C2 for retail and outdoor contacts. However, interaction terms changed only marginally, if at all. The “other” contact type was an exception to this, with significant changes in interaction terms.
Discussion
Our analysis addresses the lack of empirical evidence on the complexities of pandemic fatigue in the U.S. and its relationship to adherence to public health guidelines. Our findings illustrate both general trends in contact behavior over time and substantial heterogeneity in how individuals relaxed their adherence to physical distancing guidelines. Older adults and adults with children increased their non-work, non-household contacts according to different patterns, which would imply both decreased adherence to public health guidelines and increased risk of spread. Factors related to access, risk, support, and socioeconomic status emerged as important to timing changes in contact rates. The important factors were specific to particular contact types, indicating that people have different reasons for reducing physical distancing in different contexts.
Pandemic fatigue is most commonly framed as a psychological phenomenon.1,11,20,21 Others have argued that non-adherence and perceived pandemic fatigue may be due more to practical reasons than psychological. 22 By contrast, we would argue that the associations we identified between changes in adherence and sociodemographic characteristics reveal both material and motivational causes of behavior change. Factors such as socioeconomic status and household composition are central to many practical concerns affecting the opportunity to adhere to physical distancing over time, and also affect the mental and emotional experience of extended or repeated public health measures.
The material and psychological motivators for pandemic fatigue were evident, for example, in the factors associated with differences in the week-to-week changes in residential contacts. The association between fewer household members and faster increases in the residential contact rate among older adults could be driven by a greater need for social contact in this subgroup. Loneliness has been recognized as a particular concern for mental health during the pandemic,23–28 and living alone has been documented as a risk factor for loneliness among older adults in the pandemic context. 29 Among adults with children, the association with household size was opposite. Higher residential contact rates associated with more household members could imply more social obligations (e.g. play dates) or a greater likelihood to need to access informal childcare (e.g. at a friend’s home) in order to return to work, reflecting a more opportunity-oriented motivation. 8 Middle-aged adults have reported less loneliness than young or elderly adults 30 ; however, other investigators have reported greater levels of psychological stress associated with larger households, 31 so it is possible that the sharper increase in residential contact rate in this group is also serving as an emotion-focused coping strategy.
Our findings also highlight distinct motivations for residential contacts and visitors. Among older adults, racial/ethnic identity had opposite associations with the two contact types, and visitors were the only contact type we assessed for which older age was associated with greater week-to-week increases in contact rate. Although previous studies of pandemic fatigue have examined differences in physical distancing adherence by age,3,4 they have not examined differences in behavior within this older age group. While it is possible the increase was due to caregiving needs, we anticipate these needs to have been relatively consistent during the study period, as they were for Parkinson’s disease patients in the study. Instead, family and friends may have felt it safer to visit the eldest populations in their homes to reduce their risk of exposure in public settings.
Among adults with children, none of the factors influencing differences in changes in residential contact rates were associated with changes in visitor rates; however owning a vehicle was. Individuals without vehicles received more visitors early in the pandemic when restrictions were the most stringent; we cannot determine from our survey results whether these visits were for principally material purposes (e.g. someone dropping off groceries) or motivated by social reasons. Regardless, this initial period was followed by individuals with vehicles catching up to similar levels once restrictions lowered and/or adherence levels began to drop. That the number of people in the household was not associated with changes in visitor rates as it was with residential contact rates suggests that the mechanisms underlying these changes may differ.
Gender and racial/ethnic identity were associated with weekly changes in select contact types, particularly retail contacts. Retail contacts were the most common type of contact we measured in both cohorts. We estimated a four-fold increase in average weekly retail contacts between the lowest and peak contact weeks among adults with children, and an almost two-fold increase among older adults, providing substantial potential for contact prevention. The interactions of non-binary gender and marginalized racial/ethnic identity with week that we identified in C1 and C2, respectively, suggest pandemic fatigue may have accelerated these groups’ return to retail contacts. However, it is notable that both subpopulations initially had significantly lower retail contact rates than their comparator groups. This is concordant with national literature showing racially or ethnically marginalized populations reduced activity more than white populations early in the pandemic,32,33 followed by larger rebounds in activity after physical distancing policies were lifted. 33 The interaction we observed for race/ethnicity in C2 evened out retail contact rates by the end of the study period (Figure 3). We hypothesize that had retail contacts not been suppressed in these subpopulations early in the pandemic, there may not have been an observable rebound in these groups, which is consistent with a previous study of pandemic fatigue identifying compensation for previous self-isolation. 13
While there were few common effects across contact types, younger age and up to a high school education level among adults with children were associated with faster increases in weekly outdoor, residential, and dining contact rates (the same education effect was observed for outdoor contacts in older adults). Notably, these were often seen in the context of initially being much lower than their comparators; for example, older individuals and those with Bachelor’s degrees were estimated to have had much higher initial dining and residential contacts, respectively. The pronounced elevation of outdoor and dining contacts depicted in Figure 2 among participants with up to a high school education during the latter half of the study period also lacks substantial statistical certainty. Our results thus do not provide clear evidence for education affecting changes in adherence in these groups, although age and education level are commonly associated with health literacy,34,35 a potential component of pandemic fatigue. 8
Notably, our study period encompassed summer and the protests in Minnesota in response to George Floyd’s murder. Both events could have differentially increased non-work, non-household contact rates, and we see limited related fluctuations in our data. Outdoor contacts increased at the outset of summer, and decreased at the end, somewhat more than other contact types; however, the differences we identified in the change in outdoor contact rates, particularly by education level, do not appear to correspond to this timing. We observed a steady increase in contact rates into summer 2020, suggesting that signs of pandemic fatigue emerged within the first 3 months of physical distancing guidelines in Minnesota and Iowa, after which contact rates began to decline again. Among adults with children, our findings show all contact types peaking during a 3-week span in the middle of summer, which coincided with a relatively low period in COVID-19 incidence, indicating a return to most activities involving the contacts we measured around the same time. However, this was much more staggered among older adults, with retail and outdoor contact, the most essential and safest forms of contact we examined, respectively, peaking earliest. Older adults also had uniformly lower predicted peak contact rates, consistent with a previous study that reported greater levels of pandemic fatigue in individuals <50 years old. 3 Given that we did not measure contacts pre-pandemic, it is possible that older individuals in this study population had lower baseline contact rates. It is also possible that the greater risk of severe outcomes to individuals in the older community 36 led to greater reluctance to reenter society, particularly before vaccines were available, as others have observed less pandemic fatigue among those with greater perceived risk or fear.3,11,13 Another reason for the greater contact rates among adults with children may be the additional burden on parents and other caregivers to provide care and attention to children,37,38 and the need to relieve the associated mental health strain through social connectedness potentially leading to an increase in contact-intensive activities (e.g. visiting a friend).39–42
Our study provides one of the most nuanced investigations into drivers of pandemic fatigue to date. Most studies that have been conducted on pandemic fatigue have relied on measures subject to considerable bias, for example, extended recall about how much respondents’ adherence has changed over time,3,11 or on their intent to comply with guidelines in the future.12,13 One multi-national repeated cross-sectional study ascertained recent adherence to physical distancing, but they could not investigate important potential determinants of pandemic fatigue such as education or income. 4 We believe the longitudinal design of our study was necessary to understand motivations behind changes in adherence, as opposed to adherence at different time points, given that pandemic fatigue is a demotivation to adhere. This affected sample sizes at each time point, however, the trade-off in quality and depth of information was felt to be worthwhile.
This analysis was limited to fixed covariates established at baseline and did not account for time-varying confounding, including mental health status and changes in employment. Incorporating these factors will be an important next step in further understanding the complex development of pandemic fatigue. As the pandemic progressed and individuals became less restricted, we found it necessary to change our survey methods to allow for greater outing and contact inputs. It is possible that participants had higher outings and contacts earlier in the pandemic but that our earlier methods were not capturing them. We attempted to handle this analytically. Additionally, sensitivity analyses yielded similar results to our primary analysis (Supplement). As the survey was developed and implemented in the early weeks of the pandemic control measures in the U.S., the questions were developed by the authors and were not drawn from a validated survey instrument.
Conclusion
In conclusion, we identified several sociodemographic characteristics that defined subgroups who reduced physical distancing practices more quickly than others for select types of contacts. These characteristics may be impacting adherence by modifying the factors WHO has proposed as underlying pandemic fatigue, such as experiences of hardship, risk, inconvenience, and health literacy. 8 The specific mechanisms at work likely involve both psychological and material motivators, emphasizing that strategies to support long-term adherence to public health control measures need to consider both facets of the behavior. Moreover, the variation across contact types in which sociodemographic characteristics were important to changes in adherence underscores the need for a targeted approach. Taking a 10,000-foot view of pandemic fatigue by asking whether an individual limited their social contacts or plans to follow the latest public health guidance may obscure or provide an incomplete picture of the mechanisms at work, because people appear to have different motivations for adherence. By associating the specific forms of contact with the behavior of specific groups within the population, we can more effectively target public health messaging, and ultimately better control the pandemic.
Supplemental Material
sj-docx-1-phj-10.1177_22799036231189308 – Supplemental material for Sociodemographic effects on pandemic fatigue are multifaceted and context-specific: A longitudinal analysis of physical distancing adherence
Supplemental material, sj-docx-1-phj-10.1177_22799036231189308 for Sociodemographic effects on pandemic fatigue are multifaceted and context-specific: A longitudinal analysis of physical distancing adherence by Damon Leach, Keeley J Morris, Mark B Fiecas and Gillian AM Tarr in Journal of Public Health Research
Footnotes
Acknowledgements
We would like to acknowledge the entire COVID-19 Preparedness & Response Study Team, particularly Marizen Ramirez and Sato Ashida, for their contributions throughout the life of this study. We would also like to acknowledge Daniel Emery for reviewing an early version of this manuscript.
Declaration of conflicting interests
The author(s) declared no potential conflicts of interest with respect to the research, authorship, and/or publication of this article.
Funding
The author(s) disclosed receipt of the following financial support for the research, authorship, and/or publication of this article: This work was supported by the University of Minnesota Office of the Vice President for Research [Grant-in-Aid of Research, Artistry, and Scholarship #498749]; University of Minnesota Office of Academic Clinical Affairs [COVID-19 Rapid Response Research Grant]; University of Minnesota Informatics Institute [MnDRIVE Updraft Grant]; and Minnesota Population Center [COVID Research Seed Fund Award, funded through NICHD grant P2C HD041023]. REDCap was funded by the National Institutes of Health’s National Center for Advancing Translational Sciences [UL1TR002494]. The content is solely the responsibility of the authors and does not necessarily represent the official views of the sponsors.
Supplemental material
Supplemental material for this article is available online.
References
Supplementary Material
Please find the following supplemental material available below.
For Open Access articles published under a Creative Commons License, all supplemental material carries the same license as the article it is associated with.
For non-Open Access articles published, all supplemental material carries a non-exclusive license, and permission requests for re-use of supplemental material or any part of supplemental material shall be sent directly to the copyright owner as specified in the copyright notice associated with the article.