
Abstract
Background:
Apnea disorder is influenced by social and environmental factors. By assessing its hot spots and geography, the foci of this disorder and its at-risk groups can be identified for health interventions. This study was conducted to investigate the spatial pattern of apnea disorder using GIS in the Kermanshah metropolis.
Methods:
In cross-sectional study was conducted in kermanshah, the statistical population were 119 people (73.95% male and 26.05% female) of Kermanshah residents, which referred to the sleep center from 2012 to 2018 due to apnea disorder. Information was collected from the records of patients referred to the Sleep Disorder Center of Farabi Hospital, which is the only service center in the west part of Iran. The statistical tests were the mean center, standard distance, Getis-Ord Gi * index, nearest neighbor index, and kernel density estimation test in GIS software.
Results:
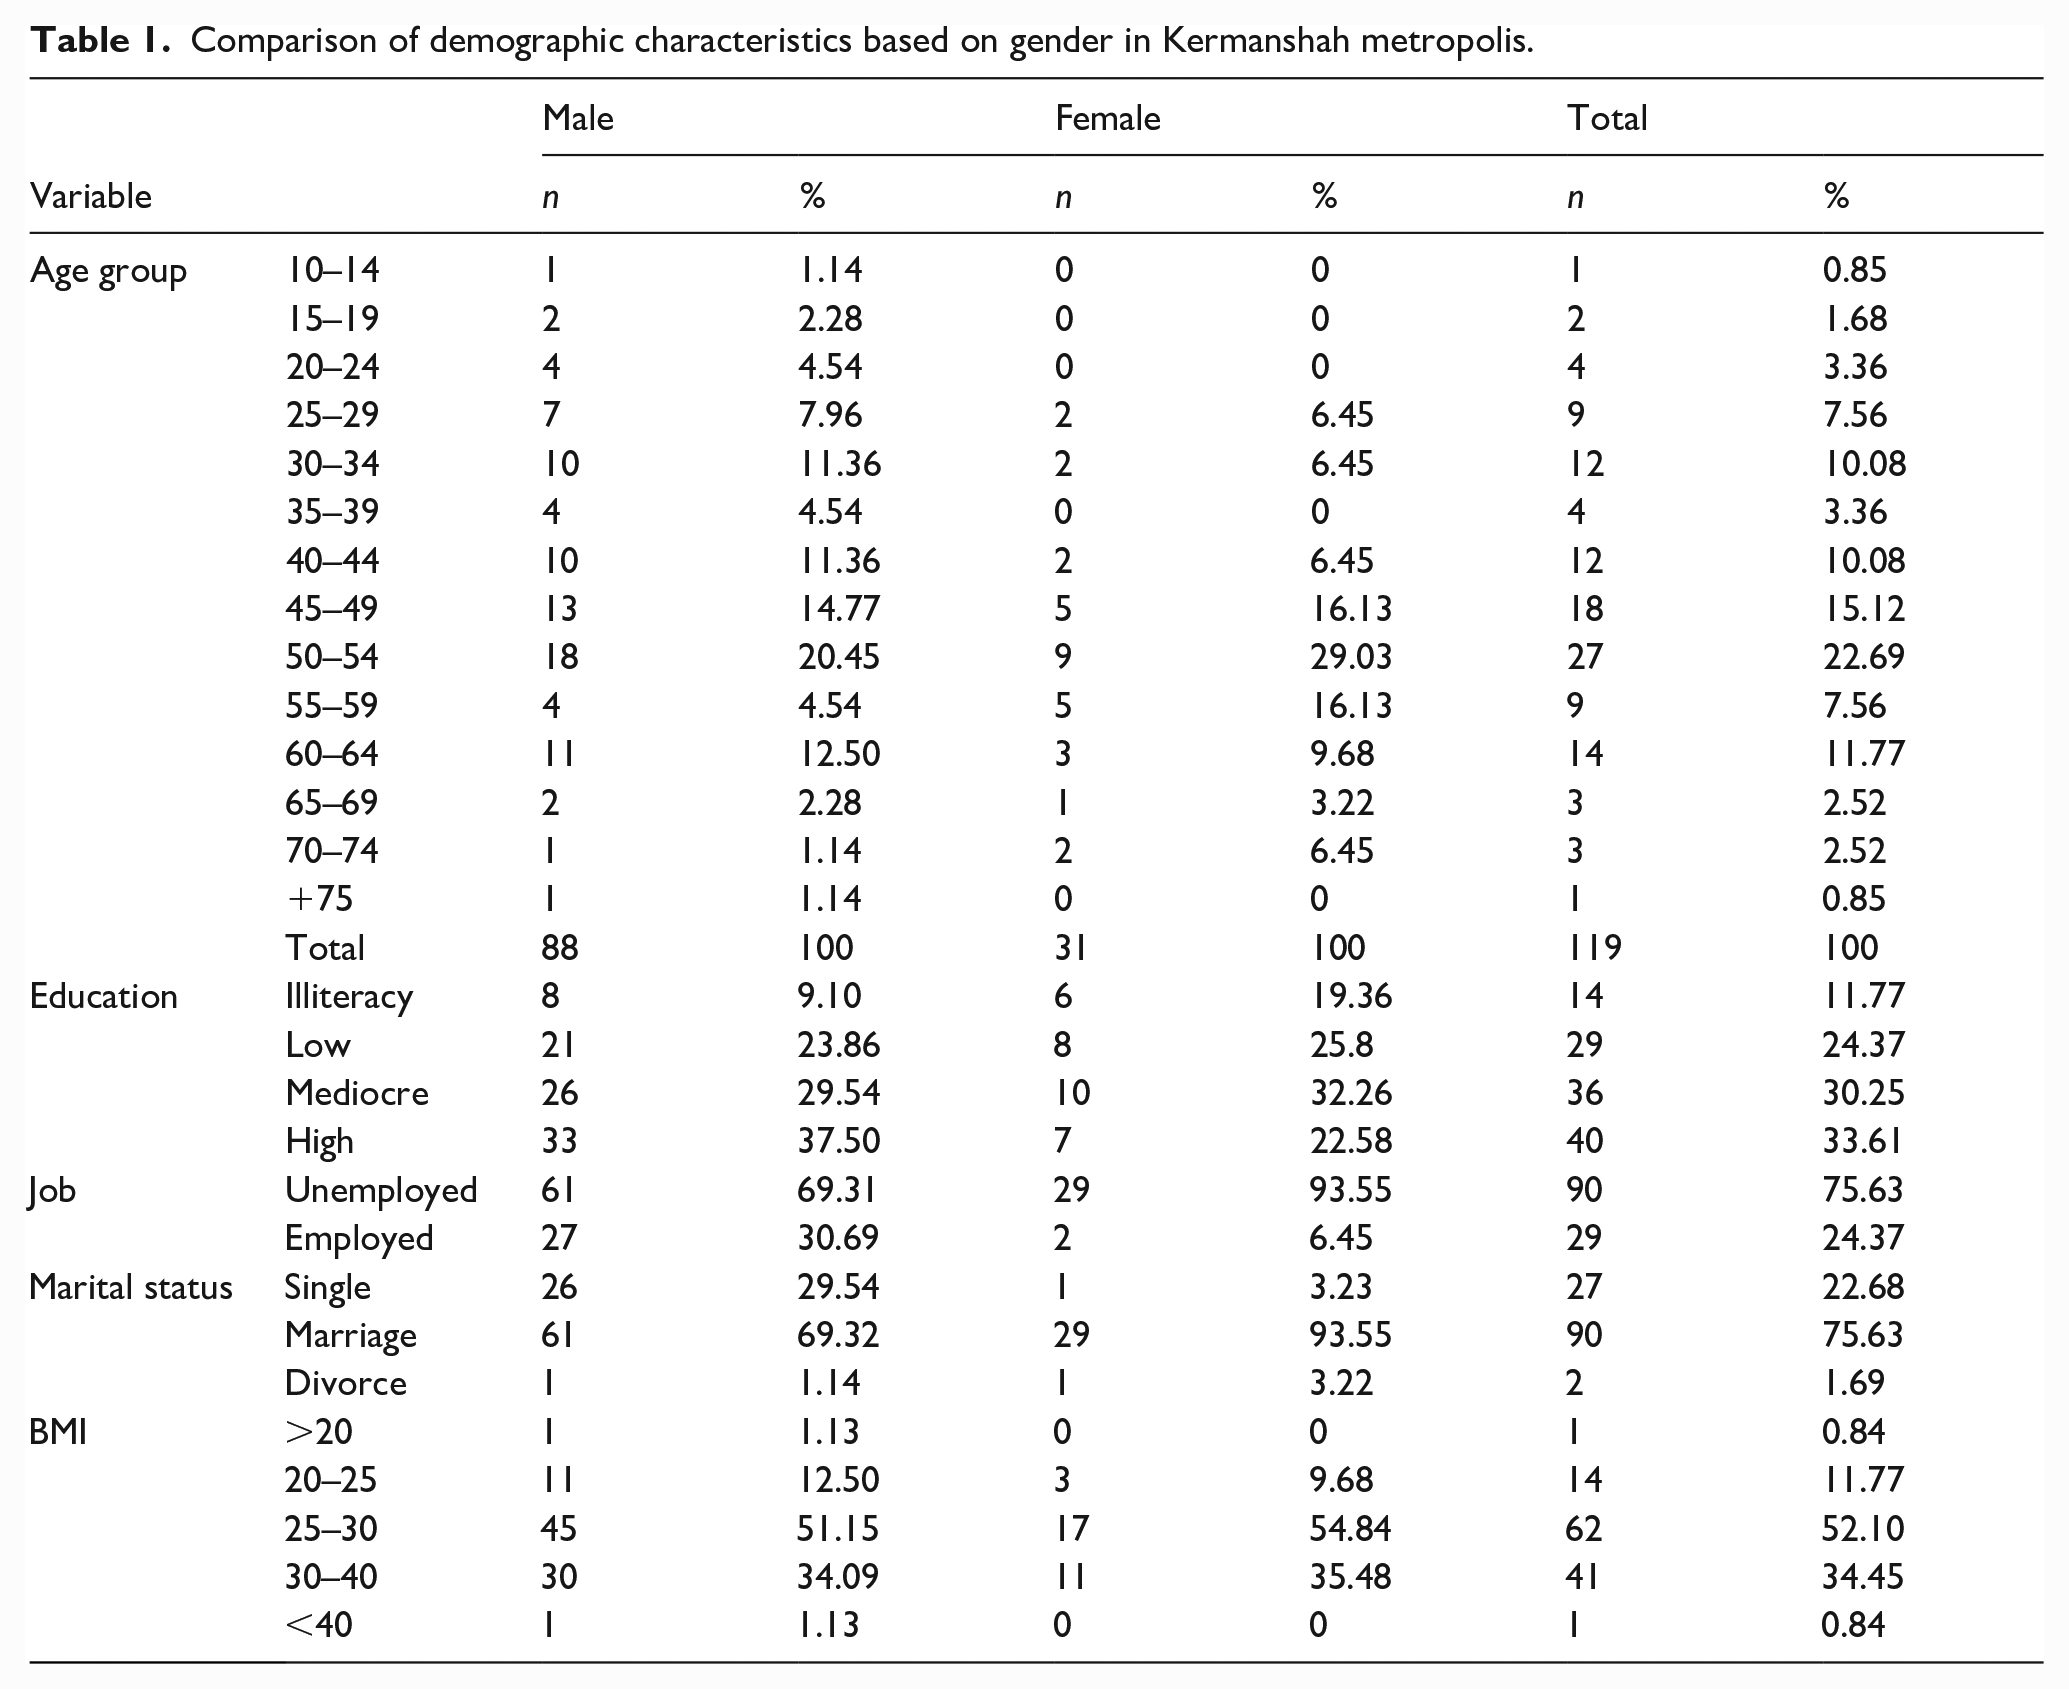
The spatial pattern of patients with apnea disorder has cluster formation in the Kermanshah metropolis. The age group of 50–54 had more apnea disorder than other age groups. In this age group, women were more prone to apnea than men. In terms of education, people with high education are more affected by this disorder; So that with the increase in education level, apnea disorder had also increased. Also, the findings showed that the disorder was more common in unemployed, married, overweight people with BMI (25–30), and obese people (30–40).
Conclusion:
The spatial pattern of patients with apnea disorder was clustered and does not correspond to the high population density centers located in the marginal and slum areas of the city. These can be used by stakeholders, including governmental organizations and health authorities at the national-regional level.
Significance for public health
Sleeping has long been considered an important factor in human health. Inadequate sleep is increasingly recognized as an important public health issue. GIS has been a good tool that helps us to describe and improve our understanding of disease distributions. This work is created a paradigm of next studies and used by stakeholders, including governmental organizations and health authorities at the national-regional level. The age group of 50–54 had more apnea disorder than other age groups. In this age group, women were more prone to apnea than men. the disorder was more common in unemployed, married, overweight people with BMI (25–30), and obese people (30–40). The spatial pattern of patients with apnea disorder was clustered and does not correspond to the high population density centers located in the marginal and slum areas of the city.
Introduction
Sleeping has long been considered an important factor in human health. 1 Sleeping is an important physiological process, the experience of which has been different in individuals, in a way that has different effects on the health and well-being of individuals. 2 Disruption of the sleep-wake cycle has affected other physiological functions of the body such as loss of appetite, feeling tired, lack of concentration, exacerbation of diseases, and physical problems. 3 Sleep disorders can manifest as poor sleeping and insomnia; poor sleeping is a disorder of sleeping, including difficulty in falling asleep, and staying asleep, intermittent waking up, waking up too early in the morning, or a combination of these problems. 4 Insomnia also includes excessive sleep, insufficient sleep, poor quality sleep, difficulty falling asleep, frequent awakenings, and respiratory problems during sleep. 5
The results of studies indicate the prevalence of sleep disorders among the general population. 6 Thus, between 30–45% of the world’s population suffer from insomnia and poor sleeping. 7 Inadequate sleep is increasingly recognized as an important public health issue. 8 Population-based studies have shown that insufficient sleep may cause an increased risk of various diseases for many people.9,10 Lack of early diagnosis can lead to a range of serious complications, including pulmonary and systemic hypertension, cardiovascular disease, stroke, cognitive impairment, and psychiatric symptoms such as irritability, depression, and anxiety.11,12 The results of other studies have shown that to solve these problems, it is necessary to examine the social and environmental factors caused by lack of sleep.13,14
Obstructive Sleep Apnea (OSA) has been a usual sleep-related breathing disorder. OSA syndrome was not a life-threatening condition in itself, but it can result in severe problems such as cardiovascular and cerebrovascular diseases. The disease can affect the quality of life. 1 In this regard, physical and social environmental features may lead to alterations in the timing, duration, and quality of sleep and contribute to the most prevalent sleep disorders: insomnia, sleep apnea, and circadian rhythm disorders. 15
On the other hand, as stated in other studies, the determinants of inadequate sleep have been many social and environmental factors. 16 Numerous studies have examined the effects of the social environment on sleep.17,18 One of the factors that are less considered in this regard is the geographical location. The results of other studies indicate that insufficient sleep has been an important health risk factor, but very few studies have been done on its geographical distribution. The geographical assessment of sleep disorder focus centers can identify new groups at risk and thus pave the way for the intervention of public health policymakers. As the results of other studies have shown, the determinants of the geographical diversity of sleep disorders should be considered, which can be useful for the development of public health campaigns. 16 Urban populations with lower socio-economic status are especially vulnerable to stressors such as: noise and air pollution. these results confirm for our study location that populations on the lower end of the socio-economic spectrum and minorities are disproportionately exposed to traffic and air pollution and at higher risk for adverse health outcomes. Scientific evidence indicates that there is a significant relationship between exposure to both air and noise pollution problem and socio-economic status, largely associated with resident location in geographical areas, with road traffic the major source. Other urban areas/environmental pollution stressors can contribute/exacerbate health impacts in low socio-economic status groups, including lifestyle factors and occupational exposure, and vulnerable individuals within low socio-economic status groups exposed to air and noise pollution are be able to experience increasing health impacts. There is some scientific evidence to suggest that there is an environmental injustice socio-economic issue regarding emissions generation, but little evidence regarding the ability of more wealthy individuals to avoid pollution, except with regard to choice over resident relocation. 14
Advances in geographic statistical methods and geographic information systems (GIS) has provided powerful tools that help us to describe and improve our understanding of geographic distributions. 19 For many reasons, GIS has been a potentially powerful resource for community health, including their ability to integrate data from a variety of sources to generate new information and inherent visualization (mapping) applications. It can have durable effects on people’s lives by solving problems creatively.20,21 These findings will help to focus on public health and guide how to use limited resources to diagnose the consequences of sleep disorders about geography. 16 In this regard, the results of other studies have emphasized the use of GIS to investigate OSA disorder. 22
Studies in the United States have shown that certain areas in a state are prone to sleep problems. Studies on the correlation between neighborhood characteristics and sleep have also shown that geographical patterns are formed locally. Even, no information was available recently to address the question of what pattern of insufficient sleep follows locally. 16
On the other hand, sleep apnea syndrome is a relatively common sleep-related disorder with a high prevalence characterized by recurrent episodes of partial or complete upper airway obstruction during sleep. 23 Obstructive sleep apnea and insomnia are both the most common types of sleep disorders in the communities. These disorders cause detrimental effects on a person’s health and work performance. 24 Inadequate sleep quality can have serious consequences for the community’s health. This can lead to poor function in school or daily work, increase the risk of vehicle traffic or occupational accidents, increase medical and psychological costs, and ultimately reduce people’s quality of life. 25 Therefore, identifying its centers and estimating the prevalence and distribution in the general population in the metropolis of Kermanshah that unequal economic, social and cultural opportunities have led to differences between its inhabitants, 26 and the burden of disease 27 and deaths by traffic accidents 21 is also have been increasing, can provide important information for general and mental health.
Materials and methods
Study area
In cross-sectional study was conducted in Kermanshah. The statistical population of the study in this study was 119 (88 people, 73.95%) male and 31 people (26.05%) female) residents of Kermanshah who were referred to the sleep center from 2012 to 2018 due to apnea disorder. Information from the records of patients referred to the Sleep Disorder Center of Farabi Hospital, which is the only service center in the west of Iran, was gathered. The statistical tests were the mean center, standard distance, Getis-Ord Gi * index, nearest neighbor index, and kernel density estimation test in GIS software.
Measures
Due to the spatial and geographical nature of this study, GIS was used to determine the spatial distribution of apnea disorder. At first, documents of people with apnea disorder were evaluated. In the next step, the documents related to each patient were studied and information was extracted, which was stored in the Arc/GIS10.6 software environment as a database. After creating the database in Arc/Catalog environment, the considered layers were created, and the information related to each patient was digitized in Arc/Map software. Finally, by testing, the spatial pattern was analyzed, and the output was mapped to a better understanding of this disordered pattern. The tests used in Arc/GIS10.6 included the following:
Determining the spatial pattern: Given unaware of the type of pattern that the data sets follow, spatial autocorrelation coefficients are often suitable for studying spatial patterns (35,34). In this study, the spatial patterns of apnea disorder in the Kermanshah metropolis were evaluated using the statistical parameters of the mean center, standard distance, Getis-Ord Gi * index, nearest neighbor index, and kernel density estimation test.
Mean center
The mean center is the average longitude and latitude coordinates of all features in the study area, which is calculated to follow the changes in the distribution and spatial distribution of features and to compare them as well. The mean center is calculated by the following equation28,29:
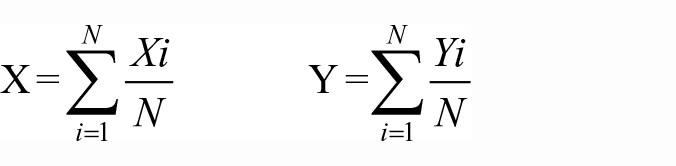
Where xi and Yi are the coordinates of complication, i, and n equal to the total number of features and complications.28,29
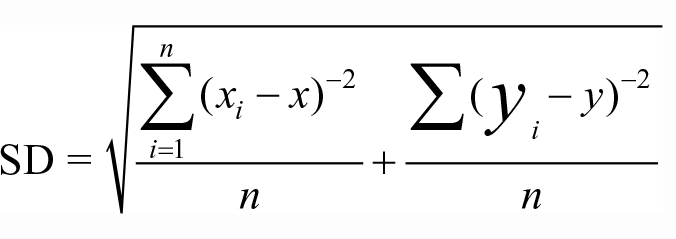
Standard distance
The standard distance is a way to measure the concentration or scattering of geographic features around the center. Which can be calculated by the following formula.28,29
Getis-Ord Gi* index: The statistical equation for calculating Gi* is as follows:

Wij is a spatial weight vector with values for all j cells in the distance of d from the I cell. W* i is the sum of the weights of S*1i, the sum of the squares of the weights and s* the standard deviation of the data in the cells.28,29
Average nearest neighbor
The nearest neighbor index is based on measuring the distance of every land uses to the nearest neighbor and is used to determine the convergence and divergence of different types of land use. The purpose of this type of analysis is to determine whether the distribution of points is random or not, as well as the type of distribution pattern. 28 In the nearest neighbor index method, the distance from each land use to its closest neighbors is calculated based on the average distance. The nearest neighbor index is expressed as the ratio of the average observed distance to the expected distance. The expected distance in this method is obtained as a result of Z quantity analysis. So that if this value is between 1.96 to ~1.96, there is no significant difference between the observed distribution and the random distribution; otherwise, the distribution will be clustered or monotone.
The nearest neighbor index is obtained from the following relation:

So that

The expected average distance for the index obtained is a random pattern:
The equation
Results
In this study, 119 referred people from Kermanshah had apnea disorder, of which 73.95% were male and 26.05% were female. The mean age of patients with apnea was 13.83 ± 46.28, the mean age of women and men was 13.73 ± 50.41, and 13.56 ± 44.82 respectively. The age group of 50–54 were more affected than the other age group and women of this age group had more apnea disorder than men. Educated people were more affected and the disorder showed increasing trends with the increase of educational level. The finding further showed that the disorder was more prevalent in the unemployed, married, overweight and obese group, (Table 1).
Comparison of demographic characteristics based on gender in Kermanshah metropolis.
Investigation of the spatial pattern of apnea disorder
Findings of the study showed that the mean center of apnea disorder in Kermanshah metropolis was consistent with the geographical center of the city and its standard distance was the most concentrated in the central, western and northern parts of the city. The standard distance in men tended to the north, east, and northeast; But in women, it was more focused on the center and northwest (Figure 1).

Spatial distribution of apnea disorder, mean center and its standard distance in Kermanshah metropolis.
The results of the nearest neighbor index regarding the study of the spatial pattern of apnea disorder showed that the nearest neighbor index was 0.66 and the value was Z = −7.02, which indicates the cluster formation of apnea disorder in the Kermanshah metropolis. Also, the calculated values about the spatial distribution of apnea disorder for Gi * Getis-Ord were statistically significant and indicated the formation of clusters of this disorder (Figure 2).
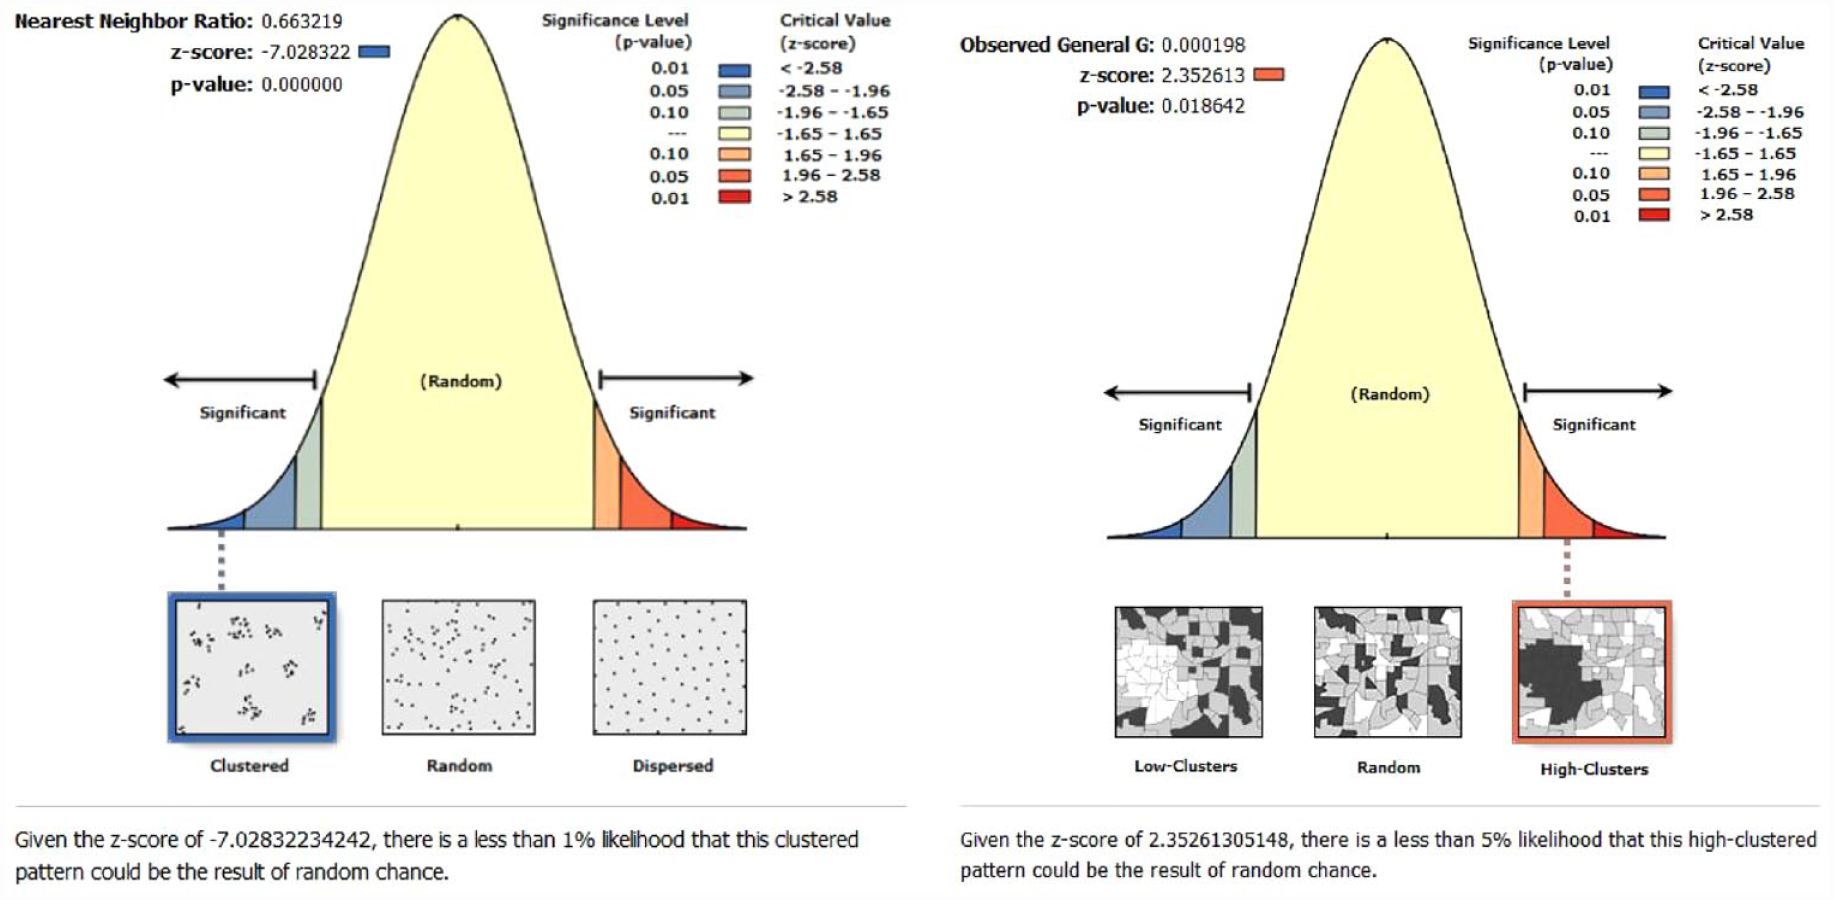
Spatial pattern of apnea disorder based on the nearest neighbor index and Gi* Getis-Ord in Kermanshah metropolis.
Findings from kernel density estimation test to identify foci of apnea disorder showed that three centers were formed in Kermanshah metropolis, which two were hot spots in which the concentration of apnea disorder was observed more than other parts of the city. The following are the characteristics of hot and cold foci of apnea disorder:
• In focal and non-focal areas, the prevalence of the disorder was higher in men than in women.
• People with higher education were more likely to have apnea. The situation was similar inside and outside the centers.
• Apnea disorder was more common among the unemployed than the employed.
• Married people are more likely to develop apnea disorder.
• Apnea disorder was more common in people with overweight body mass index (25–30) and obese (30–40)
Discussion
Inadequate sleep is one of the most important health risk factors; However, concerning its geographical distribution, few studies have been conducted in some developed countries. According to the authors’ reviews by the time of this study; In Iran, a study was not found that examined the spatial pattern of apnea disorder. Therefore, this study was conducted to investigate the spatial pattern of apnea disorder using GIS in Kermanshah metropolis—west of Iran.
The results showed that the mean center of apnea disorder corresponded to the geographical center of the city and its standard distance was the most concentrated in the central, western, and northern parts of the city. The standard distance in males tended to the north, east, and northeast; But in females, it was more focused on the center and northwest (Figure 1). This difference is probably due to the difference in the sex ratio of males and femals in these areas of the city. In this study, we identified three foci of apnea disorder. Its main focus was formed in Nobahar, Bargh, and Golestan neighborhoods (Figure 3). The results of other studies have shown that these neighborhoods are rich in Kermanshah. some characteristics of these neighborhoods are good economic situation, low population density, high level of education, and good access to medical centers.30,31 On the other hand; The findings of our study indicated that, in the centers of apnea disorder, most patients had higher education. But in non-focal areas, most patients were illiterate and with low literacy (Table 2). This was in contrast to the results of other studies conducted in the United States. In their studies, low level of education, poor economic situation, unemployment, inadequate access to medical sleep clinics, and lack of infrastructure in this area were mentioned as effective factors.16,32 This difference was probably because of unfavorable socio-economic conditions in the Kermanshah metropolis people living in poor and middle-class neighborhoods of Kermanshah did not refer to the disorder centers. 33 They may not have been able to pay for polysomnography and its medical equipment including Auto CPAP.BiPAP, which are not covered by insurance. In addition, hapless people probably visit doctors less often due to unfavorable economic conditions.

Investigation of the spatial pattern of apnea disorder and population density based on kernel density estimation model in Kermanshah metropolis.
Centers of apnea disorder in areas without density and high/low density in Kermanshah metropolis.

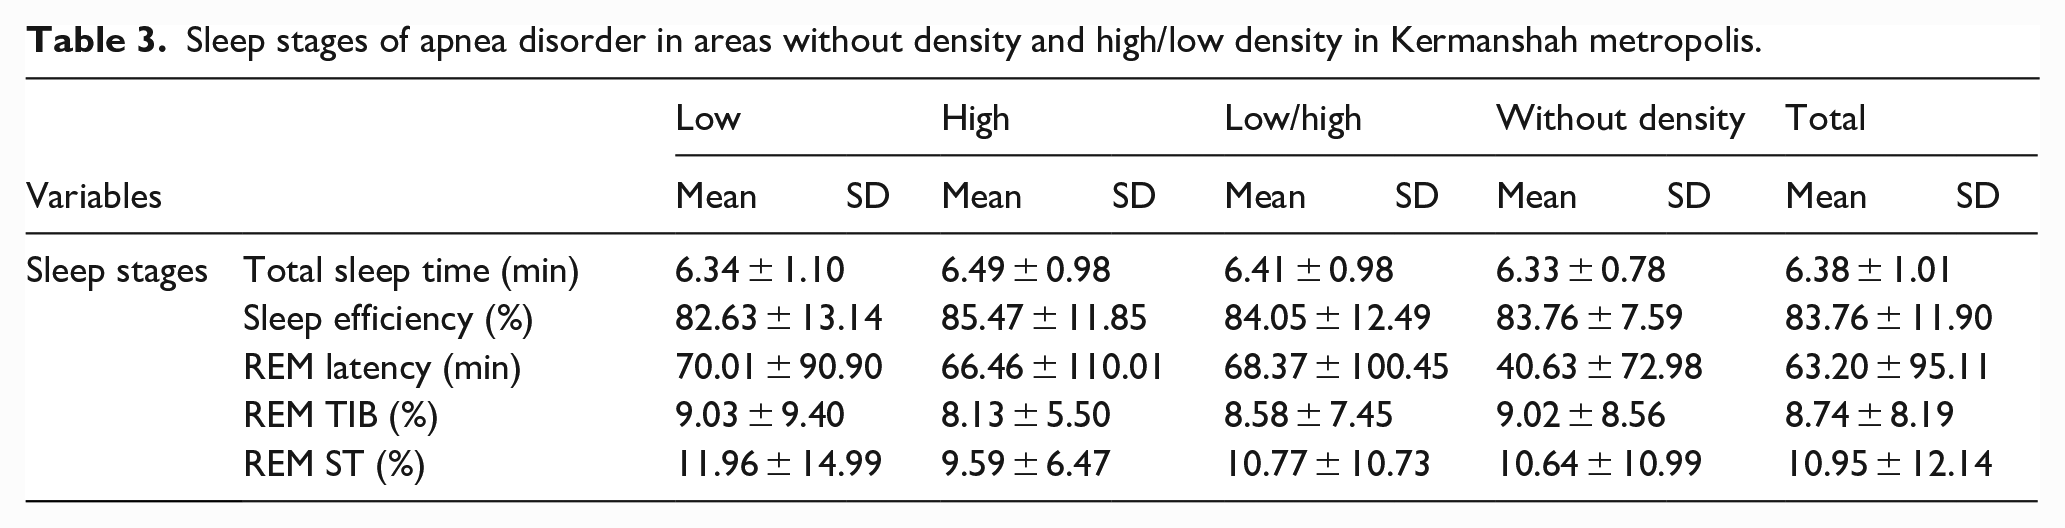
Sleep stages of apnea disorder in areas without density and high/low density in Kermanshah metropolis.
Findings of our study showed that apnea disorder in the Kermanshah metropolis was formed in clustered shape (Figure 2). The apnea disorder is not randomly distributed and showed a spatial dependence. Clusters of higher apnea disorder in this city are associated with higher income. The identification of these clusters can guide tailored public health interventions. The results of other studies also have shown a cluster shape of sleep disorders. In these studies, the need for intervention in the centers has been emphasized. 16 The results of other studies have shown that the prevalence of obesity,34,35 diabetes,36,37 respiratory diseases,38,39 cancer40,41 in the centers of sleep disorders were higher than other areas. Probably the centers formed in the city of Kermanshah face a similar situation. Therefore, it is suggested that these issues be considered in future studies.
In this study, men were more likely than women to have apnea disorder. Comparison of foci of apnea disorder with non-focal areas also showed that men were affected more by this disorder (Tables 1 and 2, Figure 1). On the other hand, age group comparisons showed that men were more likely to have the disorder by age 44. But in the age groups of 45–49, 50–54, 55–59, and 65 years and above women were more affected by this disorder (Table 1). Perhaps, the living conditions of neighborhoods such as social, cultural, economical and environmental have affected the results of this study. These results were similar to some studies 42 and contradictory to some studies. 43 The results of other studies have stated that the reason for this difference is the higher strength of the upper airways in women than men and the lower collapse of these airways in women. 44 Also, the protective role of female hormones and the effect of these hormones on dilator muscles and chemical sensitivity to hypoxia and hypercapnia in women, which is more than men, may have influenced this condition.45,46 On the other hand, other studies have mentioned the cause of this difference as environmental factors such as differences in lifestyle, quality of life, and demographic variables. 43
The findings of this study showed that unemployed people have more apnea disorder than employed people. The results of other studies were similar to our study.15,47 In this regard, the results of studies indicate that the metropolis of Kermanshah has the first rank in unemployment in Iran for consecutive years. 48 This condition may have contributed to the development of apnea disorder in this city. As mentioned in other studies, inactivity and weight gain are more common in unemployed people. This condition can cause many physical problems such as depression and anxiety, 49 which causes insomnia and worrying thoughts in people. 50
The results of our study showed that married people were more likely than others to have apnea disorder, which was similar to other studies.50,51 The family problem is more widely identified when there is a sleeping partner present. Another reason could be that having sleep apnea is harmful to having a life partner in the first place. This in turn could lead to an reporting of sleep apnea in them. This situation is probably due to the financial problems and economic insecurity that exists in societies. 25 Therefore, it is recommended that this situation be examined in future studies. In terms of body mass index, the results showed that overweight (25–30) and obese (30–40) people had more apnea disorder than others. These results were similar to other studies that have shown that obesity has been a risk factor for obstructive sleep apnea. 42 However, many other studies have not shown an association between body mass index and apnea.52,53
Strengths and limitations
The main limitation of the present study is that we are unable to discover the reasons for this geographical diversity. Previous studies have attributed this geographical diversity to regional differences in mental health, race/ethnicity, access to health care, socioeconomics, smoking, and climate patterns. 16 In this study, we could not control these factors. Also, the residents of poor and middle neighborhoods of the city do not want to go to the sleep disorders clinic due to financial inability is another limitation of this study that will probably affect the results of this study.
The strengths of this study were: 1- The first study in Iran that identified spatial patterns of apnea disorder. 2- this study is one of the limited ecological studies that has been done in the Kermanshah metropolis. 3- In statistical analysis, we used spatial autocorrelation analysis models as it was used in other studies. 16 4- Addressing a public health gap related to sleep disorders to present to health decision-makers.
Conclusions
In general, apnea disorder showed an irregular spatial pattern in the metropolis of Kermanshah. So that, Several foci and important centers have been identified. The most important centers are located in Nobahar, Bargh, and Golestan neighborhoods. The mean center of apnea disorder corresponded to the geographic center of the city, and its standard distance was most concentrated in the central, western, and northern parts of the city. The standard distance in men tended to the north, east, and northeast; But in women, it was more concentrated toward the center and northwest. Comparison of foci of apnea disorder with non-focal areas also showed that more men were affected by this disorder. Also, unemployed people have more apnea disorder than working people. These findings can be used by stakeholders, including governmental and health organization members at the national and regional levels. The results of this study can be used to diagnose the public health burden of sleep disorders in geographical areas. We encourage researchers in future studies to examine the relationship between the spatial pattern of sleep disorders and economic, social, and cultural factors and structures, and to determine the level of access to psychological counseling facilities.
Footnotes
Acknowledgements
The authors would like to acknowledge the participants for their participation in this study.
Contributions
All authors participated and approved the study design. HK, AZ and AZ contributed to design the study, SS and MK collected the data, and analyzed by AZ. The final report and article were written by SS, SM, RT and AZ and All authors read and approved the final manuscript.
Declaration of conflicting interests
The author(s) declared no potential conflicts of interest with respect to the research, authorship, and/or publication of this article.
Funding
The author(s) received no financial support for the research, authorship, and/or publication of this article.
Ethics approval and consent to participate
The study was approved by the Research Ethics Committee of Kermanshah University of Medical Sciences (IR.KUMS.REC.1397.300). Written informed consent was obtained from all group members. Consent to submit has been received explicitly from all co-authors, as well as from the responsible authorities—tacitly or explicitly—at the institute/organization where the work has been carried out, before the work is submitted.
Informed consent
Written informed consent was obtained from participation.
Patient consent for publication
Consent from the patient for the publication was taken before collecting the data from them.
Availability of data and material
All the data supporting our findings have been presented in the manuscript; the datasets used and/or analyzed during the current study are available from the corresponding author on reasonable request.