
Abstract
Background:
Globally, fiscal measures are deemed effective in combating the obesity epidemic at population level. A health promotional levy (HPL) on sugar sweetened beverages (SSBs) was implemented in April 2018 in South Africa to reduce sugar consumption.
Design and methods:
This cross-sectional, descriptive study investigated consumers’ understanding and opinion of the HPL, and impact on consumption of SSBs. Data was collected outside 15 grocery stores, within four health sub-districts of the City of Cape Town. An interviewer-administered questionnaire was completed with literate, adult consumers (N = 696).
Results:
Participants (46.0%) were aware of the HPL but regarded it insufficient to change purchasing behaviour (55.4%). The lower income group (56.4%) was most affected by the increased price of SSBs. Those who agreed (46.8%) that the levy would help to reduce the prevalence of obesity was significantly more likely to notice a price increase in SSBs (54.5%) (p < 0.01) and had a higher education level (p < 0.01). Overall, self-reported consumption of SSBs decreased by 7.7% since the HPL was enacted. Participants who were aware of the detrimental effect of consuming large amounts of sugar, were more likely to change their behaviour (p < 0.01).
Conclusions:
Participants were receptive for legislative measures to combat the prevalence of obesity but lacked clarity of the goal and implementation of the HPL. A multipronged approach is crucial to lower sugar intake sustainably and an environment which offers healthy alternatives to SSBs. A higher HPL combined with transparency of how revenue is utilised could enhance the impact of the sugar tax strategy.
Introduction and motivation
Globally, fiscal measures are increasingly recognised as an effective strategy to help combat the obesity epidemic at a population level by raising public awareness about excessive sugar consumption.1–6 Obesity is recognised as one of the metabolic risk factors for the development of non-communicable diseases (NCDs).5,7 The prevalence thereof is increasing at an alarming rate particularly in urban settings in low- and middle-income countries. 8 Furthermore, since the COVID-pandemic concerns about the obesity prevalence has been highlighted due to the elevated risk of COVID-19 and its complications in persons with obesity and NCDs.9,10 A considerable body of evidence indicates that high intakes of added sugar, particularly in the form of sugar sweetened beverages (SSBs) increases the risk of overweight and obesity.4,7,11 Sugar sweetened beverages are defined as beverages ‘that contain added caloric sweeteners such as sucrose, high-fructose corn syrup or fruit-juice concentrates’. For the purpose of sugar taxation, beverages containing intrinsic sugars only are excluded from the tax such as 100% fruit juice, unsweetened milk, and milk products. 6 While SSBs provide little nutritional value it contributes significantly to the energy intake in many populations.4,12 Pooled average consumption of SSBs in 51 countries came to 326.0 mL of SSBs per day, which equated to consuming 51 g of sugar or 867 kJ daily from SSBs alone. 12 The energy provided by SSBs alone thus exceeded the WHO recommendations issued to limit sugar intake to six teaspoons of sugar or <10% of the total daily energy intake. 13 It is a major concern that between 2002 and 2016 annual sales of SSBs in SA doubled from 3 to 6 billion litres due to the increasing affordability and accessibility thereof. 5
A number of countries responded to the WHO’s strong recommendation for governments to implement an SSBs tax at a proposed level of 10%–20%. 3 A growing body of evidence shows excise tax of at least 10% lead to decreased purchasing and consumption of SSBs2,5,14–19 and improves weight outcomes 1 especially among adolescents with obesity and those with a high baseline consumption of SSBs. 18 Mexico found a promising 7% reduction in the consumption of SSBs after the first year of taxation which increased to 10% after 2 years. Lower income groups showed the highest reduction in consumption of SSBs. 20 At a 10% taxation rate, the energy intake was reduced between 5 and 39 kJ per person per day in middle income countries which was deemed high enough to prevent further growth in obesity prevalence. 19 It is yet to be confirmed whether a reduction in SSB consumption will lead to a permanent reduction in obesity prevalence 19 and health outcomes due to a paucity of data based on real-world evidence. 4
The National Department of Health (NDOH) of South Africa developed the Strategic Plan for the Prevention and Control of NCDs 2013–2017, and National Strategy for the Prevention and Control of Obesity 2015–2020 with a target of reducing the prevalence of obesity by 10% by 2020. 21 Despite having comprehensive policies in place 22 the results from the South African Demographic and Health Survey (SADHS) showed a dramatic increase in the prevalence of overweight and obesity (68% women; 31% men), 23 the highest amongst all African countries. 24 South Africa became the first country in Africa to legalise sugar tax 25 which was implemented on 1 April 2018. 26 Referred to as the Health Promotion Levy (HPL) the sugar tax was expected to reduce public health expenditure in the long term and projected to raise billions of rands in revenues.2,5,27 Furthermore, the administration of sugar taxes was regarded as less burdensome than targeted nutrient taxes which applied to a wider range of products with differing tax levies.1,2,14 The levy was initially fixed at 2.1 cents/g of sugar exceeding a threshold of 4 g per 100 mL 6 and marginally increased to 2.21 cents in February 2019. 28 This equated to 10% excise tax on SSBs with the aim to encourage beverage manufacturers to lower the sugar content of SSBs, to discourage the excessive consumption of sugar by consumers, and slow down the rising prevalence of NDCs and obesity in the long run. 6 The HPL only applied to commercial manufacturers utilising an excess of 500 kg sugar per year for the production of SSBs. 6 Similar to other countries,29,30 the increased cost of SSBs were entirely passed on to South African consumers in an effort to reduce consumption thereof. 27
Since 17%–25% of the disease burden in the Western Cape Province could be linked to NCDs, 31 it was deemed appropriate to conduct this study in the City of Cape Town. The main aim of the study was to determine the awareness and understanding of consumers regarding the sugar taxation of SSBs. Due to the unique demographic makeup of the City of Cape Town, it was important to investigate the opinions of consumers regarding the effectiveness of the sugar taxation. The self-reported impact on purchasing behaviour and consumption of SSBs since the implementation of the HPL could be valuable in future policy development and interventions.
Design and methods
Study design and study population
A cross-sectional descriptive study was conducted. Four health sub-districts of the City of Cape Town with a relative equal distribution between the three main ethnic groups living in Cape Town (black African, mixed race and Caucasian) were selected for data collection using purposive sampling. Fifteen grocery stores across the City of Cape Town from three main food retailers in South Africa were randomly selected.
Consumers were eligible as study participants if they were older than 18 years, literate (completed grade seven) and doing >50% of food shopping for the household. Consumers who were unwilling to participate or unwilling to give written informed consent were excluded. Study participants who met the inclusion criteria were selected by fieldworkers to take part in the study, using convenience sampling. Once a fieldworker completed the interview with a participant, the next participant exiting the grocery store was selected. The sample size was computed by estimating a proportion/percentage in the population within a certain degree of accuracy. A minimum number of consumers, n = 601, was needed to provide data that can be interpreted with a 95% confidence interval and a margin of error of 4%. A target of 640 was set to ensure an even distribution of consumers across the 15 grocery stores (±43 participants per grocery store).
Methods of data collection
Data was collected during a 3-week period in March/April 2019 by 14 registered final year dietetic students who acted as fieldworkers under the supervision of a research assistant, who was a registered dietician. The investigators standardised and trained the research assistant and fieldworkers and had regular contact sessions to discuss any issues that could arise during data collection.
Prior to data collection the research assistant obtained permission from the various managers of all the selected grocery stores to administer the interviewer-administered questionnaire in close proximity of the grocery store’s entrance. Each grocery store was visited four times (three weekdays and one weekend day). Participants were recruited at different times of the day and different days of the week in an attempt to incorporate aspects of representativeness into the non-random sample.
Fieldworkers approached consumers as they exited the grocery store and explained what the research study entailed. A set of screening questions determined if participants met the inclusion criteria. Once written informed consent was obtained, the interview was conducted in a relatively quiet area where a table and seating was available. Participants’ responses to questions were captured and after the questionnaire was checked for completeness, participants received a reusable shopping bag as a small token of appreciation for their participation.
Interviewer-administered survey
The interviewer administered survey was compiled by the investigators and was based on the research objectives of this study and current literature. The questionnaire consisted of five sections namely socio-demographic information; lifestyle and behaviour attributes; awareness and understanding of the HPL; opinions about sugar tax; and lastly, purchasing behaviour and sugar consumption. The definition of the HPL was explained to participants prior to responding to opinion questions. There were 55 questions: a combination of close-ended and Likert scale questions as well as two open-ended questions. The survey took 15–20 min to complete.
Pilot study
The survey was assessed for content validity by a panel of experts (two dieticians and two consumer scientists) with an in-depth knowledge of the HPL in South Africa. They commented on the relevance of the content, level of understanding and appropriateness of the questions for the target group and changes were made accordingly.
Twenty consumers participated in a pilot study which was conducted at a grocery store in the Tygerberg health sub-district to test the face validity of the interviewer-administered survey. The same procedure as described before was followed. Participants’ comments on the language, format, layout of the survey, the procedure followed and the time it took to complete the survey was also incorporated in the survey. These participants were not included in the main study.
Data analysis
Data was double-captured on MS Excel and analysed using STATISTICA version 13 Dell Inc. (2016). Summary statistics was used to describe the variables. The relation between two nominal variables was investigated with contingency tables and appropriate chi-square tests. A p-value of p < 0.05 represent statistical significance. Open-ended questions were categorised and key themes were identified. Responses were coded and grouped according to the emerging themes.
Ethics and legal aspects
The study was approved by the Health Research Ethics Committee, Stellenbosch University (N18/07/067). Research was conducted according to the ethical guidelines and principles of the international Declaration of Helsinki; the South African Guidelines for Good Clinical Practice and the Medical Research Council (MRC) Ethical Guidelines for Research. The respective retail groups and managers of selected grocery stores provided permission prior to data collection. Informed written consent was obtained from all participants using consent forms in Afrikaans, English or isiXhosa, of which the participant received a signed copy. Participation was voluntary while confidentiality and anonymity was maintained at all times. A unique identifier code was allocated to each participant for data analysis purposes only.
Results
Socio-demographic information
The study population (N = 696) was predominantly female (59.9%), had a mean age of 40 years (SD 16.23 years, range 18–88 years) and most (80.7%) obtained a Grade 12 or after school qualification. The sample was diverse in terms of ethnicity. Half of the participants’ (54.6%) were employed fulltime, with a wide income range as 27.5% had a monthly income of less than R6 401 (lower quintile) while 14.2% earned more than R51,200 per month (upper quintile) (Table 1). There was a low uptake of social grants (22.1%).
Socio-demographic information of participants (N = 696) compared to Cape Town population according to Census 2011.
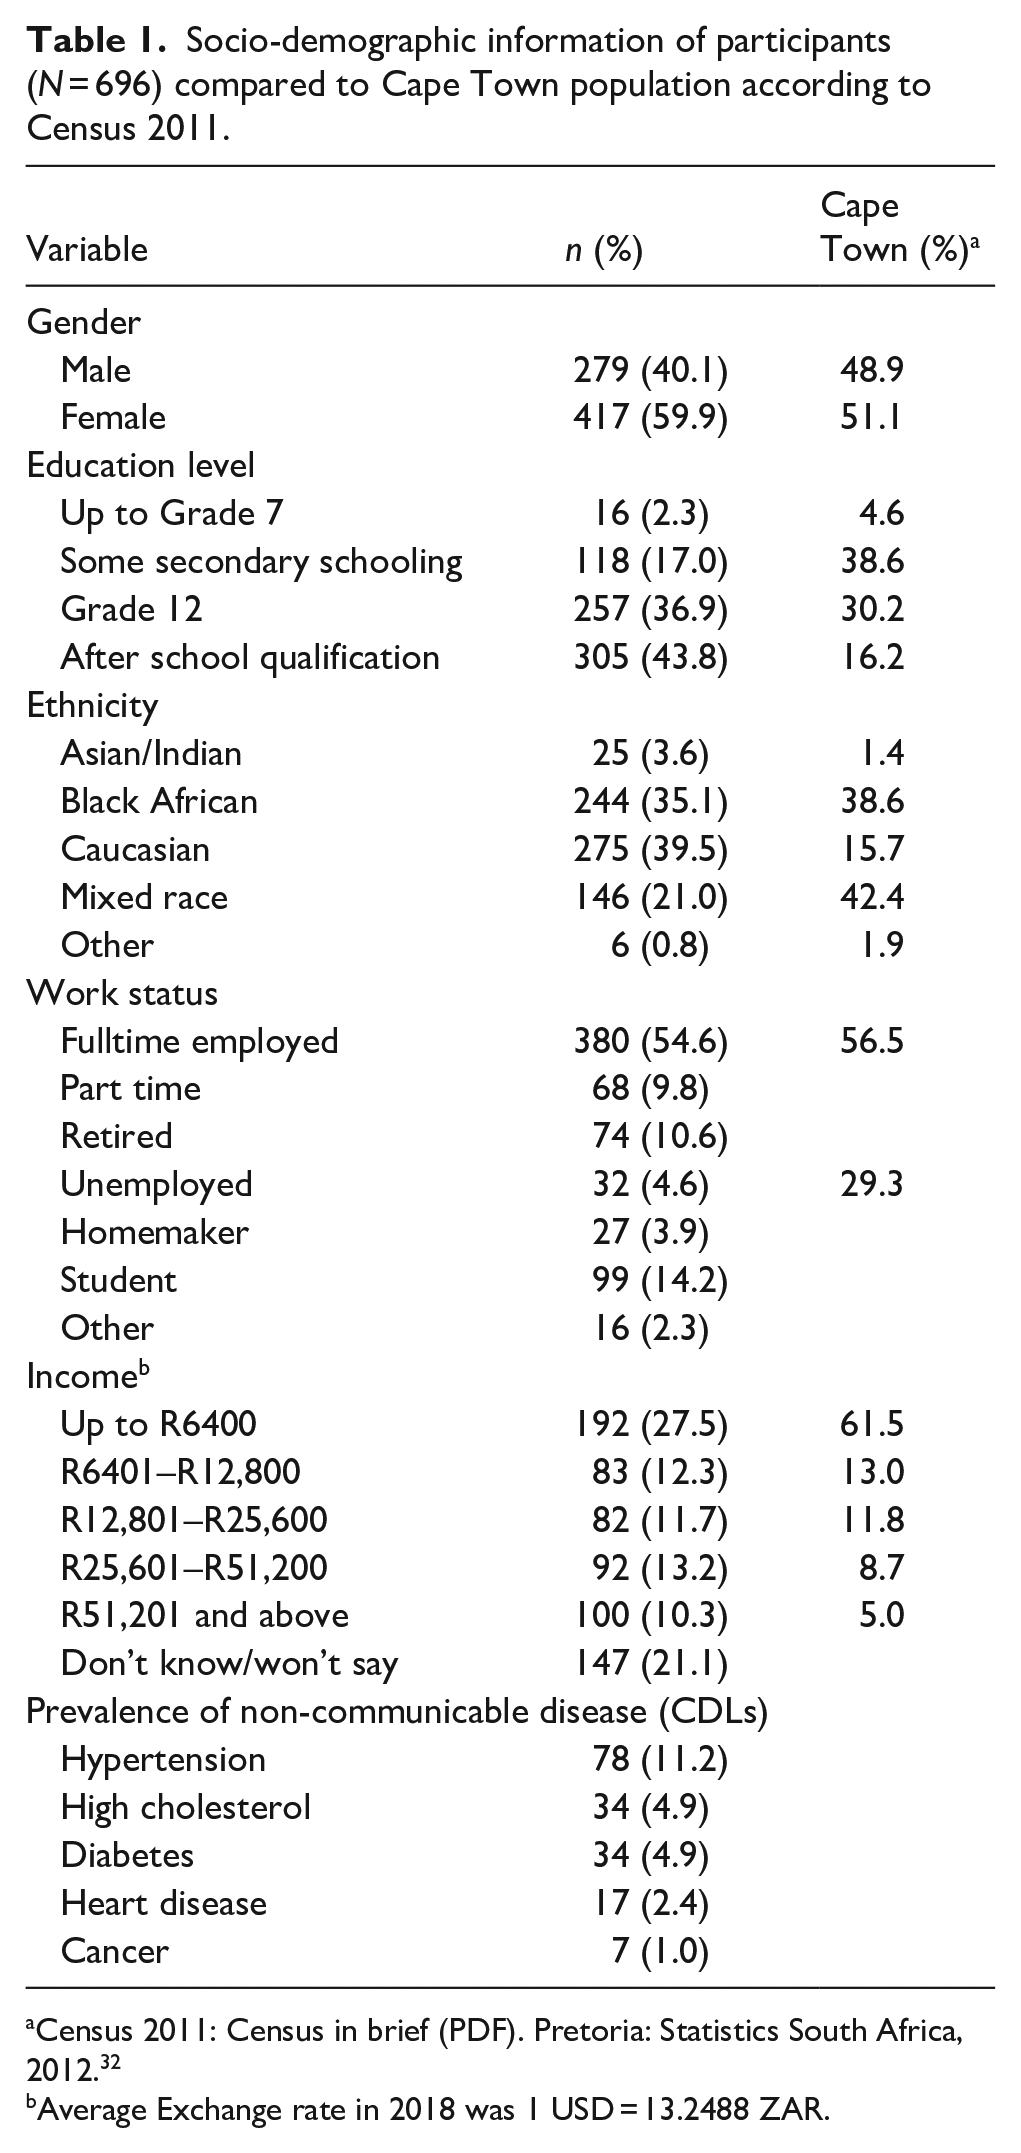
Census 2011: Census in brief (PDF). Pretoria: Statistics South Africa, 2012. 32
Average Exchange rate in 2018 was 1 USD = 13.2488 ZAR.
One fifth (21.1%) of participants reportedly suffered from chronic conditions for which they took medication and the most prevalent CDL was hypertension (11.2%) (Table 1). Behaviour associated with development of CDL included cigarette smoking (20.2%), alcohol consumption (57.0%), and a high consumption of fast foods (4.3% daily; 6.9% more than three times/week). Participants did their grocery shopping weekly (34.2%) or 2–3 times/week (23.9%). They mainly frequented the main food retailers (range 27.9%–74.1%) but seldom visited farmers’ markets (1.7%) or local Spaza shops in their community (3.0%).
Awareness and understanding regarding the sugar taxation
The majority (91.1%) of participants believed that the food and beverages they consumed had a direct impact on their health as consuming large amounts of sugar is detrimental to health (94.5%) (Table 2). Specifically, they identified the risks of becoming overweight/obese (91.4%) and developing diabetes (88.4%), heart disease (70.3%), hypertension (69.3%), or high cholesterol (63.5%).
Consumers’ (N = 696) believes about sugar and awareness of sugar taxation.

Percentage does not add up to 100% because 19 (2.7%) did not have their glasses thus couldn’t read the label.
Very few (8.6%) of the participants were aware of the recommended maximum amount of sugar to be consumed per person per day or knew that a 300 mL can carbonated soda contains at least six teaspoons of sugar (21.7%) (Table 2).
Participants (49.6%) who read food labels usually looked in the nutrition information table on a beverage can for the values listed for sugar (71.1%, n = 246/346) and energy (42.8%, n = 148/346). There was significant association between participants who preferred sugar-free carbonated drinks over regular carbonated drinks (38.9%) and those who read the nutrition information (49.6%, n = 345/695) (Chi-square test: p < 0.001).
While 46.0% of all participants were aware of the HPL 1 year after implementation of sugar tax in South Africa, only 0.3% identified the correct amount of sugar allowed in SSBs before being levied and 96.8% didn’t know the amount of tax being levied on SSBs (Table 2). There was a linear link between participants being aware of the legislation and their level of education (Grade 7 and secondary schooling 7.8%, n = 25/230 and after school qualification 61.3%, n = 196/230) (Chi-square test: p = 0.000). More than 82% correctly identified SSBs such as sports drinks, carbonated drinks, iced tea and flavoured milk drinks but more than half of participants thought sugar-free carbonated drinks and 100% fruit juice (51.0% and 71.4% respectively) also contains added sugar. Participants with a higher education level identified sugar containing products significantly better (Chi-square test: p ≤ 0.01).
Five themes emerged from the responses to an open question, describing the intent of the HPL as to increase the price of sugar containing items, discourage purchases, discourage consumption, lower the sugar content of SSBs and to raise health awareness (Table 3).
Consumers’ understanding of the intent of the HPL and how the revenue would be utilised.

When probing participants’ opinion of how the revenue generated from HPL would be utilised, their responses varied from health-related matters such as treatment of diabetes to general needs including job creation and fiscal needs. Six themes emerged including subsidising healthy foods; poverty relief and social grants; health services; job security fiscal needs and infrastructure; as well as education and research (Table 3).
Opinions of consumers regarding the effectiveness of the sugar taxation
Participants were provided with a standard definition explaining what the taxation on SSBs entails, enabling them to respond appropriately to a set of Likert scale questions. Participants overall felt positive about the sugar tax (very positive 11.2%, positive 55.8%). Half (46.8%) of the participants agreed the new tax on SSBs would lead to a reduction in the prevalence of overweight and obesity in South Africa (Table 4). Those participants who were aware of the price increase and better educated participants was significantly more likely to think the new legislation would make a difference (Chi-square test: p < 0.01 and p = 0.01 respectively).
Opinions of consumers (N = 696) regarding the effectiveness of the sugar taxation.

On a negative note, participants thought the tax levied on SSBs was too little to make a difference in consumers’ purchasing behaviour (55.4%) and believed government implemented the sugar tax for it’s own benefit and not to benefit consumers (63.7%) (Table 4). Participants with a lower education level were less inclined to agree that the new legislation will help to reduce the prevalence of overweight and obese people in South Africa (Chi-square test: p = 0.02).
Impact on consumer purchasing behaviour and consumption of SSBs since the implementation of the sugar taxation
Half (54.5%) of the participants noticed a price increase on SSBs in the previous year of which 43.1% (n = 171/379) was influenced to change their purchasing/consumption of SSBs mainly because SSBs became too expensive (81.5%, 141/173) (Figure 1). Those who did change their purchasing behaviour, were mostly from the lower (56.4%, n = 53/96) and the middle-income groups (73.5%, n = 61/83) compared to those earning >R102 zero (28.5%, n = 8/28). Though there was a significant association between participants noticing the price increase and their level of income (Chi-square test: p = 0.01) it did not necessarily mean that they were positive about the legislation nor changed their purchasing behaviour (Chi-square test: p > 0.5).

Reasons for change in purchasing behaviour of sugar sweetened beverages (n = 173).
There was a significant link between the perception of the detrimental effect of consuming large amounts of sugar and change in behaviour since the legislation was implemented (Chi-square test: p < 0.01). Sugar sweetened beverages were substituted with water (58.5%, n = 100/171), sugar-free carbonated drinks (21.0%, n = 36/171), or fruit juice, cordials, concentrates and cheaper brands (12.3%, n = 21/171). The HPL influenced some participants to look for more economical alternatives: ‘I am more aware of [the HPL]. Like the prices are up, I tend to buy more economical products and look for specials’. Misconceptions were also brought forward: ‘It influenced [my purchasing behaviour] because I don’t buy Coke anymore. I buy Pepsi because it’s imported and cheaper’. Some participants even stopped consuming SSBs while others were more conscious of ‘what I buy’ or ‘I think twice before I buy because it’s more expensive; or I buy less’.
Half (46.8%) of the participants indicated craving for SSBs regularly and some explained they consumed SSBs as a ‘bad habit’ or because ‘I am used to buying [SSBs]’. Those participants (n = 220) who did not change consumption patterns said they could afford it (33.2%, n = 73/220), liked the taste (41.4%, n = 91/220), didn’t regard SSBs as unhealthy (90.5%, n = 200/220) or ‘shop around and buy the specials and the alternatives. . . . [The HPL] hasn’t changed me, I just look for the better deal’. Several participants added in an open-ended question that they haven’t changed their behaviour patterns as they never/seldom consume (10.4%, n = 23/220) or buy (16.4%, n = 36/220) SSBs anyway.
There was a significant difference in the purchasing/consumption of SSBs in different ethnic groups in response to the price increase (Chi-square test: p < 0.01). This price increase had a bigger impact on black African participants and those from mixed origin (51.3%, n = 78/152 and 50.1%, n = 54/107 respectively).
Overall the frequency of consuming SSBs showed a decline since implementation of the HPL. Daily consumption declined with 7.7% while monthly consumption and those who consumed SSBs a few times per month or seldom increased with 8% (Table 5).
Change in frequency of consumption of sugar-sweetened beverages before and after implementation of the sugar taxation (n = 694).

Discussion
Awareness and understanding regarding the sugar taxation
Health interventions form part of a complex system therefore a number of collateral factors will influence the implementation and efficacy of the HPL such as the characteristics of the target population which includes social and cultural differences, implementation aspects, and further contextual factors.18,33 According to the NDOH thorough consultative processes were followed with beverage manufacturers, civil society groups, public health academics, and advocates during the development of the South African SSB legislation. 25 Mass media campaigns were launched to inform South African consumers of the sugar taxation by means of television and radio advertisements which were broadcasted in English, isiZulu and isiXhosa. Billboards, print and online advertisements and social media messaging followed. 25 Apparently participants in this study were not reached by the media campaigns as they were unaware of the intent and scope of the HPL. If consumers received information at their level of understanding about the intent and purpose of excise tax even before implementation of the legislation, better compliance and behaviour change could have been achieved.2,15,33,34 Consumers in Catalonia, Spain, claimed the reduction in their consumption of SSBs was partially due to a heightened awareness of the negative health effects. 35 Similarly, Stacey et al. 36 determined that South African consumers’ consumption of SSBs declined since the announcement of sugar taxation even before implementation. Recent literature reiterated that advocacy regarding sugar taxation has a bigger impact if the information is evidence-based. 37 Participants in this study were aware of the detrimental effect of consuming large amounts of sugar and made a positive link (p < 0.01) between sugar consumption and the development of NCDs. A WHO impact assessment found that health literacy improved following the introduction of the public health product taxes 3 thus well targeted education campaigns explaining the goal of the HPL are crucial in supporting consumers to change their purchasing behaviour and consume less SSBs.
More than excise tax is needed to change consumer behaviour in addressing a multifactorial health issue such as obesity.10,18 It requires a variety of approaches as well as integration of health interventions and education campaigns to improve nutritional knowledge, community participation, and inter-sectoral collaboration.17,18,33,38 In practice however the successful application of a multi-sectoral approach poses numerous challenges due to the complexity of the obesogenic environment.22,39 Measures to assist consumers in making choices include legislative measures for instance effective food labelling which has a standard format, convey consistent messages, 17 uses less complex terminology, bigger font sizes and more pictures/colours such as single health endorsement logo 40 or traffic-light labelling. 18 Consumers experience difficulty in interpreting and utilisation of food labelling thus it is crucial to educate consumers on how to make healthier choices.40 Half of the participants in this study consulted the nutrition information table on beverage cans mainly to determine the sugar content yet only twenty percent knew the amount of sugar per 330 mL can. Another measure to support consumers includes creating a healthy food environment found to be effective in reducing sugar intake 17 for instance by promoting water consumption,1,17,18 promoting healthier beverages in supermarkets, limiting SSB availability in schools 18 and product reformulation to reduce sugar content of SSBs. 17
The majority of participants in Cape Town were unaware that the noticeable price increase in SSBs was due to a HPL, therefore the policy makers missed an opportunity to inform consumers of the dire consequences of excessive sugar consumption. Understandably, 9 out of 10 participants who noticed the price increase didn’t regard SSBs as unhealthy nor changed their purchasing/consumption of SSBs. A review by Eykelenboom et al. concluded that sugar tax was ineffective in changing behaviour of high income groups, ‘stubborn’ or obese consumers and those addicted to SSBs. 1 This emphasises the crucial role of community participation and education campaigns which are context specific to address certain consumer groups’ needs. 38
Opinions regarding the effectiveness of the sugar taxation
Participants in this study were provided with a standard definition of what the HPL entails to enable them to voice their opinion based on accurate information. Once they were informed about the sugar tax, three quarters of participants felt positive about the idea of SSB tax and half of them realised the potential beneficial impact in reducing obesity in SA.
Similar to findings in the Soweto 33 study, more than half of the participants in Cape Town had the viewpoint that the levy was too little to make a significant difference in consumers’ behaviour and suggested an increase in the HPL which would increase the retail price markedly. A systematic review by Thow et al. 14 confirmed that when targeting unhealthy foods, the required effect on health outcomes were not reached when levies were too low. Consumers could have easily associated the price increase with the escalating inflation rate. 33 Based on real-world evaluations as well as modelling studies, there is a growing body of evidence that 10%−20% SSB tax is associated with a proportional decline in beverage purchases and consumption.2,5,14,15,27 This study found a 7.7% reduction in the consumption of SSBs since implementation of the HPL and it is yet to be seen whether the third increase of 2.31 cents on 20 February 2022 will effect the desired reduction in SSB purchasing. 41
Participants with a higher education level were inclined to believe that the HPL tax was implemented to supplement general fiscal deficit (p = 0.01) but would prefer the revenue to be utilised towards the advantage of the health promotion. Similar to many countries where revenue generated from sugar tax was used to cover general budget deficits1,2,4,16 the South African government did not explicitly earmark excise revenue for health promotion.2,33 The HPL would enjoy more consumer support if the true purpose of the tax was communicated in a transparent manner 1 combined with traceable policy output. 37 Also, if the revenue was used for health initiatives by providing health care to patients already suffering from NCDs, supporting obesity reduction programmes, allocating funds for school nutrition programmes or financing health promotion initiatives advocating further reductions in the consumption of SSBs.1,2,4,16,33,37
Impact on purchasing and consumption of SSBs since the implementation of the sugar taxation
Two thirds of the participants in this study did their grocery shopping at least weekly and they predominantly frequented grocery stores of the main food retailers. Frequent exposure to marketing strategies meant to incentivise purchasing of SSBs,33,42 such as prominent displays of SSBs and price reductions, are associated with a higher body mass index (BMI) of consumers. 42 At this point it is worth mentioning the role of the food industry in shaping consumers’ habits and role in the development of the obesity epidemic. For instance, overconsumption of SSBs is stimulated by offering increased portion sizes 2 and employing cumulative marketing approaches to encourage planned and impulsive purchasing of SSBs. Exterior advertisements of SSBs and high cumulative exposure to advertisements while shopping is associated with increased purchases of SSBs, especially by men. 39 The food industry use various strategies to diminish public acceptance of policy measures such as SSB taxes and negate the intent of the PHL.1,2 One of the approaches followed by the food industry was to emphasise consumers’ accountability for their own health and blame a lack of physical activity as the primary cause of overweight and obesity. 2 On the other hand, the food industry could play a significant role in promoting healthy diets through product reformulation, ethical marketing campaigns and enhancing availability and affordability of healthier beverages as a substitute for expensive SSBs.8,38,39
Daily consumption of SSBs reportedly declined by 7.7% when participants in Cape Town noticed the price increase and mainly substituted it with water or sugar-free carbonated drinks. Research shows that higher prices for SSBs could be associated with an increased demand for healthier beverages such as bottled water.4,14 To counter the impact of an obesogenic environment where SSBs are readily available and affordable it is worth investigating the reuse of taxes to subsidise the prices of healthy alternatives such as water and unsweetened milk.4,14
The lower income group represented 28% of the participants in this study where changes in purchasing behaviour was mostly seen. Research confirms that fiscal measures are effective in lower income groups to improve health-outcomes provided untaxed healthier substitutes are available and affordable. 14 Furthermore, due to the rapid growth in the prevalence of obesity in lower income groups their reduced consumption of SSBs could result in more health gains. 4 Implemented policies can have unintended positive, negative, or neutral consequences. 27 Since SSB tax is a form of collective prevention, it might be deemed inappropriate as they also affect people who are not at risk for developing obesity or related diseases 2 or consume SSBs in a responsible manner. 1
Limitations
The demographic profile was not representative of the City of Cape Town therefore findings cannot be generalised. Participant and interviewer fatigue as well as the hawthorne effect could have impacted on the quality of the data collected. The self-reported data should be interpreted with caution as information about the amount and frequency of SSBs was not quantified by means of a 24 h dietary recall nor observations.
Recommendations
The inclusion of grocery stores catering for lower socio-economic groups would increase the diversity of the study sample. The HPL could be utilised as an educational tool to raise awareness of the obesity epidemic and high consumption of SSBs in South Africa. Policy makers must take steps to improve consumer awareness and understanding of the HPL as these factors are intertwined.
Conclusion
Despite the lack of awareness of the HPL, participants were receptive for legislative measures to combat the prevalence of overweight and obesity in South Africa. The increased prices of SSBs led the lower income group to reduce their consumption of SSBs. The HPL was considered too low and combined with participants’ uncertainty of how revenue would be utilised, the success of the sugar tax strategy is eroded. Positive health outcomes will become measurable after several years only. Earmarking of revenue for health purposes, education of consumers, community participation as well as improved inter-sectoral collaboration is necessary to facilitate sustained behaviour change. Also, increased availability and affordability of healthier options is crucial to support consumers in making changes. Continued assessment and impact studies to monitor the implementation of the HPL would lead to heightened credibility.
Footnotes
Acknowledgements
The researchers would like to acknowledge the research assistants who assisted in data collection.
Declaration of conflicting interests
The author(s) declared no potential conflicts of interest with respect to the research, authorship, and/or publication of this article.
Funding
The author(s) disclosed receipt of the following financial support for the research, authorship, and/or publication of this article: Early Researcher Career Funding, Stellenbosch University.
Ethical standards and disclosure
This study was conducted according to the guidelines laid down in the Declaration of Helsinki and all procedures involving human subjects were approved by the Health Research Ethics Committee of Stellenbosch University, Cape Town, South Africa (N18/07/067). Written informed consent was obtained from all subjects.
Significance for public health
Addressing the global obesity epidemic requires fundamental changes in consumer behaviour. Political priority for solutions to this challenge is needed to enhance successful implementation of a tax on sugar sweetened beverages (SSBs). Such a strategy may well be effective to raise public awareness about the detrimental effect of excessive sugar consumption but health effects may only be visible after several years or even decades. Community participation, consumer education, and improved inter-sectoral collaboration used in conjunction with fiscal measures could lead to sustainable behaviour change. Well designed taxes which earmark revenues for health benefits could earn the trust of consumers. Income from sugar taxation should ideally be used to increase the availability and affordability of healthier options in an obesogenic environment. Policy evaluation and monitoring is required to determine the effect of price changes and the impact on obesity reduction to ascertain the distributional benefits of the policy.