
Abstract
With the growing burden of non-communicable diseases (NCDs), countries across the globe are finding ways to reduce the consumption of ultra-processed food and drinks including sugar-sweetened beverages (SSBs). South Africa implemented a health promotion levy (HPL) in April 2018 as one strategy to reduce sugar intake. Such efforts are frequently countered or mitigated by industry action in various ways, including through marketing and advertising strategies. To better understand trends in the extent of advertising, this paper analyses advertising expenditures and exposure of children to SSB advertisements in South Africa. Using Nielsen’s monthly data on advertising expenditure before and after the introduction of the HPL, for the period January 2013 to April 2019, the results show that manufacturers spent ZAR 3683 million to advertise their products. Advertising expenditure on carbonated drinks accounted for over 60% (ZAR 2220 million) of the total expenditure on SSBs. The results also show that companies spend less in advertising powdered SSBs (an average of ZAR 0.05 million per month). Based on expenditure patterns, television (TV) was the preferred medium of advertisements, with companies prioritizing what is often considered children’s and family viewing time. Urgent mandatory regulations are needed to prevent child-directed marketing.
Keywords
Introduction
The burden of non-communicable diseases (NCDs) is rising globally. 1 Consumption of sugar-sweetened beverages (SSBs) and ultra-processed foods are major contributors through their influence on weight gain and their direct link to diseases such as type 2 diabetes, cancers, and dental caries.2–4 Reducing adolescent and adult obesity rates and the growing incidence of diet-related NCDs requires changes in social eating norms as early as possible in the lifecycle, especially among children, teens, and young adults. Evidence from the Birth to Twenty (BT20+) cohort study in South Africa shows that poor eating habits such as SSB consumption influenced weight gain 5 and prevalence of other chronic diseases, which imposes significant costs on the country’s health system.6–8
Macro-level factors such as the food environment where people live, work, learn, and play, affordability of unhealthy foods relative to healthier foods, make it difficult for South Africans to attain health-promoting diets.9–11 Indeed, many South Africans across all income groups have high levels of fast food, and SSB consumption and low levels of fruit, vegetable, and whole grain intake. A key factor influencing the consumption of SSBs a and other ultra-processed products is marketing and advertising.12–14 Although they affect the preferences of both children and adults, manufacturers target children more often because they are more likely to choose foods and drinks they have seen advertised on television due to their limited understanding of the persuasive intent of such adverts.15–17 Further, children are seen as future “market of consumers” for companies to develop brand loyalty with many years of purchasing ahead of them. This early exposure affects their short- and long-term dietary preferences and habits18,19; increase snacking frequency, with low-nutrient and high-calorie foods. For these reasons, food and beverage companies across the globe frequently advertise their products, targeting children as young as 2 years.20,21 In the US, for example, child-directed advertising expenditure has grown significantly, from US$100 million in 1983 to US$17,000 million in 2007. 20 In Australia and Canada, companies have been found to spend more resources to advertise unhealthy foods and beverages compared to healthier alternatives.21–23 In fact, 90% of food and beverage advertising expenditure in Canada is for unhealthy foods, with a significant portion of these advertisements targeting children.21,23
In South Africa, the consumption of ultra-processed products including SSBs increased by about 40% between 2005 and 2010. 24 As part of the measures to control SSB consumption, South Africa declared an intention to tax sugar in June 2016, and in December 2017 the draft legislation on a health promotion levy (HPL) (also known as sugar tax) was signed into law. 25 In April 2018, the HPL was implemented with the aim of reducing sugar intake in the long-term. An observational study of South African household purchase data showed that the implementation of the HPL has been associated with reduction in purchases of taxed beverages, from 519 mL/person per day to 443.39 mL/person per day compared to pre-HPL trends. 26 Findings from before- and-after study in Langa, Cape Town also showed that low-income young adults reduced their self-reported taxed beverage intake from 315 to 198 mL/person per day. 27
Since the levy was implemented, government only increased the initial rate in February 2022, but was later postponed indefinitely. In real terms, the tax rate declined during the period of April 2018 and April 2022. 28 Thus, it is not surprising that while the HPL helped slowdown the upward trend in SSB intake in the first year of the tax, SSB sales trend continues move upward. The increase in SSB consumption, led by young adults and children, can be partly attributed to the beverage industry’s advertising and marketing strategies, 14 and these marketing strategies may have changed since the introduction of the HPL. Manufacturers market or advertise their products using media outlets such as television, radio, print, and internet.14,29,30
Because of the impact of advertising on people’s preferences and consumption patterns, particularly children, the South African government proposed restrictions on food advertising to children through the Foodstuffs, Cosmetics and Disinfectants Act in 2007. The aim of the proposed regulation was to prohibit the advertising or promotion of foods “non-essential to a healthy lifestyle” (e.g., SSBs, ultra-processed products, and certain fast foods) to children.24,31 However, these regulations were never adopted. A food consortium subsequently developed an advertising code with the input of the South African National Department of Health (NDoH). 29 The advertising code stipulates that “food and beverage advertising, including promotions, should not encourage poor nutritional habits or an unhealthy lifestyle in children, or encourage or condone excess consumption.” 32 A voluntary pledge (the South Africa Pledge on Marketing to Children) to adhere to the code was later signed, in 2009, by the major food corporations, requiring manufacturers to use their advertisements to promote healthy dietary choices and healthy lifestyles among children.33,b Similar unsuccessful pledges have been made by major food and beverage corporations such as Coca-Cola South Africa in 2017 in an attempt to self-regulate. 34 Aside from preventing unhealthy eating norms, minimizing child-directed marketing is justified from a human rights perspective. 35 Children have the right to protection from harmful information through the media such as SSB advertising messages. Because online advertising collect, store, and track information of children who visit such online platforms, companies violate the rights of children through advertising. 36 While various international treaties and local laws restrict child-directed marketing, food and beverage companies are able to disregard these child rights in their marketing activities due to a lack of enforcement.
Overview of media access in South Africa
South Africa has a vibrant print (newspapers and magazines) and electronic media (i.e., television, radio, and internet) which provides enormous opportunities for advertisers to reach large sections of the population. Statistics from the General Household Survey 37 which tracks progress of development and service delivery gaps in South Africa, using participants from 19,649 households, show that many South Africans have access to electronic media (i.e., television and radio). Overall, 82% of households reported owning television (TV) sets in 2019 (ranging from about 70% in the poorest group to over 90% in the richest group (Figure 1)). 37 While 51% of South Africans subscribe to paid TV channels obtained under Digital Satellite Television c (DSTV) 38 and StarSat d (previously Top TV), 39 subscription ranges from 40% in the low-income group to about 75% in the high-income group.

Household ownership of media channels and share of children in population by income group.
South Africa has an estimated 20 million children (i.e., persons of below 18 years), about a third of the population. 37 In every income quintile of the population, children constitute about 35%. Based on household asset ownership (Figure 1), on average, 82% of South African children have access to television.
Given the high number of households with access to TV, 37 adults and children are spending more hours viewing TV screens which encourages sedentary lifestyle while also increasing exposure to advertising. Figure 2 presents the time used to view TV screens between 2018 and 2020 (for all ages). In 3 years, the daily average time spent viewing TV screens (including non-broadcasting activities) increased from 3.06 h in 2018 to 3.35 h in 2020. 40 Even in the absence of COVID-19 alert levels 5 (26 March to 30 April 2020) and level 4 (01 to 31 May 2020) and resultant COVID-lockdown implementation, the average time spent viewing TV in 2019 was higher than that of 2018.

Average daily time in hours for TV screen viewing from 2018 to 2020 (for all ages).
As the number of viewers rise, manufacturers may find it prudent to place more advertisements to attract potential consumers. Statistics show that South African Broadcasting Corporation (SABC) 1 and e-TV are the most popular TV channels based on the average number of viewers for their programs, with over 2 million viewers per program (Table 1).
Viewership of top 20 programs by TV channel in South Africa, October 2021.
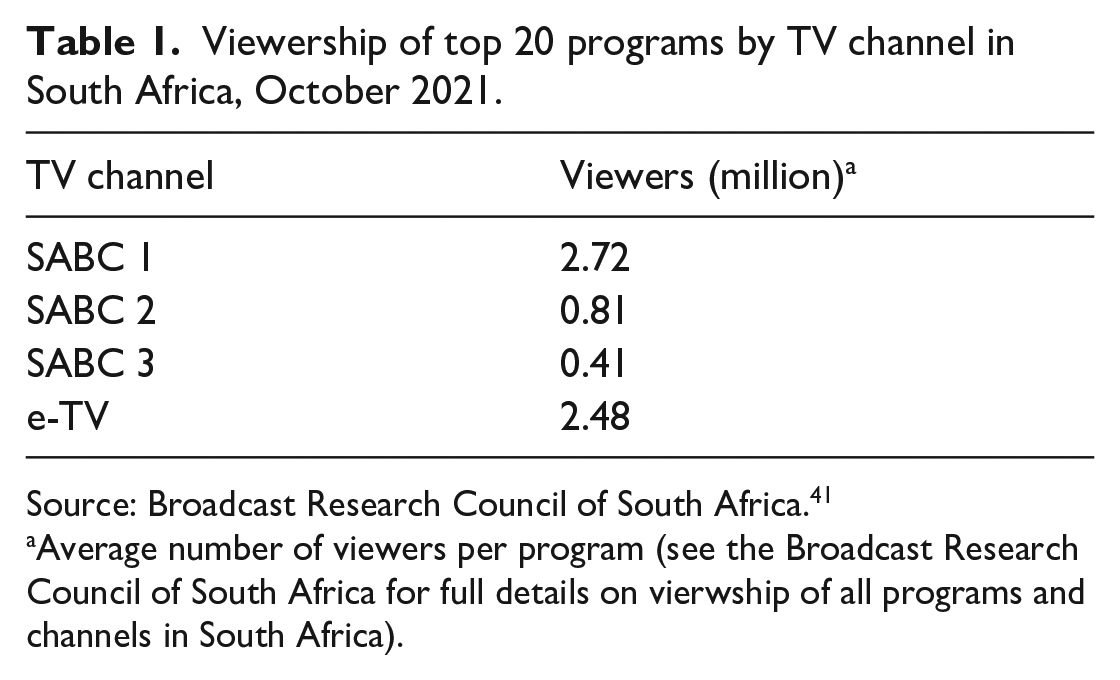
Source: Broadcast Research Council of South Africa. 41
Average number of viewers per program (see the Broadcast Research Council of South Africa for full details on vierwship of all programs and channels in South Africa).
Aside from TV, about 63% of South African households have at least one member using the internet, 37 which also exposes users to online advertisements. As more households have access to paid and unpaid TV channels coupled with the increased viewing time, opportunities abound for beverage manufacturers to advertise their products using media outlets such as TV, radio, internet, newspapers, and magazines to increase sales. The implication is that an unregulated advertising space will expose children to advertisements that encourage unhealthy eating behaviors such as advertisements promoting SSBs, ultra-processed products and fast foods which are “non-essential to a healthy lifestyle,” and thus increase the consumption of these unhealthy products. An unregulated advertising space will not adequately protect the rights of children as guaranteed in the South African Constitution and South Africa's international law obligations, as it will expose children to messaging harmful to their health and development.
While some studies have examined availability and advertising of SSBs to children,29,30,34 none has looked at the trends in advertising expenditures on various SSBs over time; this study seeks to analyze the trends in advertising expenditure on SSBs (such as fruit juices, carbonated drinks, energy drinks, and powdered drinks). The study also analyses exposure of children to SSBs based on the number of SSB advertisements aired on TV during child and family viewing time.
Methods
Sources of data
For this study, data were extracted from the Nielsen database for the period January 2013 to April 2019. 42 The Nielsen database provides multiple consumer and media datasets to academic researchers around the world. NielsenIQ produces consumer panel, retail scanner, and advertising intelligence data. The dataset provides information on advertising expenditures for SSBs in the print and electronic media. There was no primary data collection hence this study is an analysis of secondary dataset with no individual or household identifiers. Although the dataset provides only month and year, we assume that coverage begins from the first day of the month and ends on the last day of the month for the expenditure analysis. The expenditures provided are associated with type of media, broadcast time, and the company paying for the advertisement.
In the case of children’s exposure to SSB advertisements, the analysis covers only the hours 15:00:01 to 19:00:01. For the purposes of this study, print media refers to printed newspapers and magazines, while electronic media refers to television, radio, and the internet as medium of information.
Measures
SSB advertising expenditure in South African Rand (ZAR) is the estimated amount spent by beverage companies to purchase broadcasting time for advertisements in both print and electronic media. The beverages were grouped into carbonated drinks, fruit juices, energy drink, squashes and cordials, and powdered concentrates. These beverage categories are provided in the dataset.
The Nielsen data contained 112 (108 subscription and 4 non-subscription) TV channels. The subscription channels are accessed under DSTV and StarSat. The non-subscription channels included viewership of South African Broadcasting Corporation (SABC) (1, 2, 3) and e-TV, with an average of 1.6 million viewers per channel (Table 1). All other TV channels are designated in the “other” category as they have far lower viewership.
To determine whether these advertisements are directed at children, we calculated the average number of TV advertisements per hour aired during what is traditionally considered “children viewing time” of 15:00 to 17:00 h e from the Nielsen data. The rational is that the more advertisement aired during children viewing time, the more exposed children will be. The Nielsen data contains information on broadcasting time, but no information on the precise date of the advertisement. For this reason, for the purposes of this study in applying children’s viewing time, we assume that all advertisements were aired during the weekday. In line with previous studies,29,30 we know that most children attend school prior to 3 pm (during pre-COVID pandemic times during the school year) and often watch TV from this time onward when the majority of children’s programs begin.29,30,f Further, because parents are at work during 9:00 to 17:00 h and watch TV from 17:00 h onward, many TV channels broadcast talk shows and soap operas during 17:00 to 19:00 h, a period considered “family viewing time” where both children and parents watch TV. 30 Co-TV viewing has been found to increase children’s screen time. 43 The analysis on children’s exposure (which is based on the number of adverts) excludes both advertisements on radio and the internet since there is no prescribed listening time for children on radio or internet coupled with the fact that radio advertising has minimal impact on consumer behavior, at least in South Africa and India.44,45
Statistical analyses
We analyzed monthly advertising expenditures by media type, drink category, and the top 10 manufacturers in South Africa. A top manufacturer was classified as one with an annual advertising spend of at least ZAR 5 million (inflation-adjusted), on average. Media was grouped into television, print, and radio, with all other media outlets such as internet and outdoor designated as “other.” The expenditure analysis covers all types of media, both print and electronic.
Analysis of child exposure to adverts is based TV viewing. Child exposure was calculated based on the number of advertisements (i.e., number of observations in the dataset) in any given month aired on TV during the designated viewing time. The number of advertisements were aggregated by year since the number of monthly advertisements did not vary during any specific year. Afterwards, the average number of SSB advertisements per hour was calculated for “child viewing time” and “family viewing time.” Based on the already stated assumptions, advertisements were aired for 1703 days (obtained as (365 days × 6.33 years) minus (8 days × 12 months × 6.33 years)). This results in 6812 h (4 h daily) for both view times. The total number of adverts aired during each viewing time was divided by the estimated total hours for that viewing time.
Expenditures were reported in April 2019 prices using the monthly Consumer Price Index. 46 The South African rand (ZAR14.14) which was equivalent to US$1 in April 2019 was used for reporting. Stata (version 15) and MS Excel (version 2111, 2021) were used for reporting totals, mean, percentages and producing graphs. In all figures, the X-axis denote time (year/month) while the Y-axis denotes expenditure (the number of adverts in the case of child exposure).
Results
Monthly advertising expenditures
Advertising expenditure on SSBs fluctuated during the study period. In 2013, total advertising expenditure for SSBs (all drink categories) was ZAR 378 million, with carbonated drinks accounting for over 57% of these advertising expenditures. Advertising expenditure on carbonated drinks was ZAR 89 million in the first half of 2013. By the end of 2017, this expenditure had reached ZAR 583 million, but later declined to ZAR 398 million by the end of 2018 (Figure 3). In the first 4 months of 2019 alone, beverage companies spent ZAR 91 million in advertising carbonated drinks.

Monthly advertising expenditure in million ZAR (2019 prices) by drink type, January 2013 to April 2019.
Between January 2013 and April 2019, manufacturers spent a total of ZAR 3683 million to advertise their products. During this period, expenditure on carbonated drinks totaled ZAR 2220 million, with an average of ZAR 29 million per month. Powdered concentrates recorded the lowest expenditure (ZAR 3.3 million) for the period with a monthly average of ZAR 0.05 million (Figure 3). Between 2016 and 2019, carbonated beverages advertisement expenditures peaked during Christmas holiday season.
Based on media type, expenditures were highest for TV-based advertisements (Figure 4). The average monthly TV advertising expenditure increased from ZAR 19.5 million in 2013 to ZAR 42 million in 2017, and later declined by 17% to ZAR 35 million in 2018. TV expenditures accounted for about 66% of total SSBs advertising expenditure during the study period. Monthly TV advertising expenditure averaged ZAR 32 million between January 2013 and April 2019. Print media expenditure averaged ZAR 1 million per month during the period.

Advertising expenditure by media type in million ZAR (2019 prices), January 2013 to April 2019.
The advertising expenditure across all media by the top 10 companies in South Africa (Figure 5) shows that the highest advertising expenditure was by Coca-Cola South Africa Ltd. The company spent a total of ZAR 2284 million over 76 months with a monthly average of ZAR 30 million, with a peak in the fourth quarter of 2017. The second and the third highest expenditures were by Pioneer Foods and Red Bull Holdings, with a spent of ZAR 309 and ZAR 232 million, respectively.
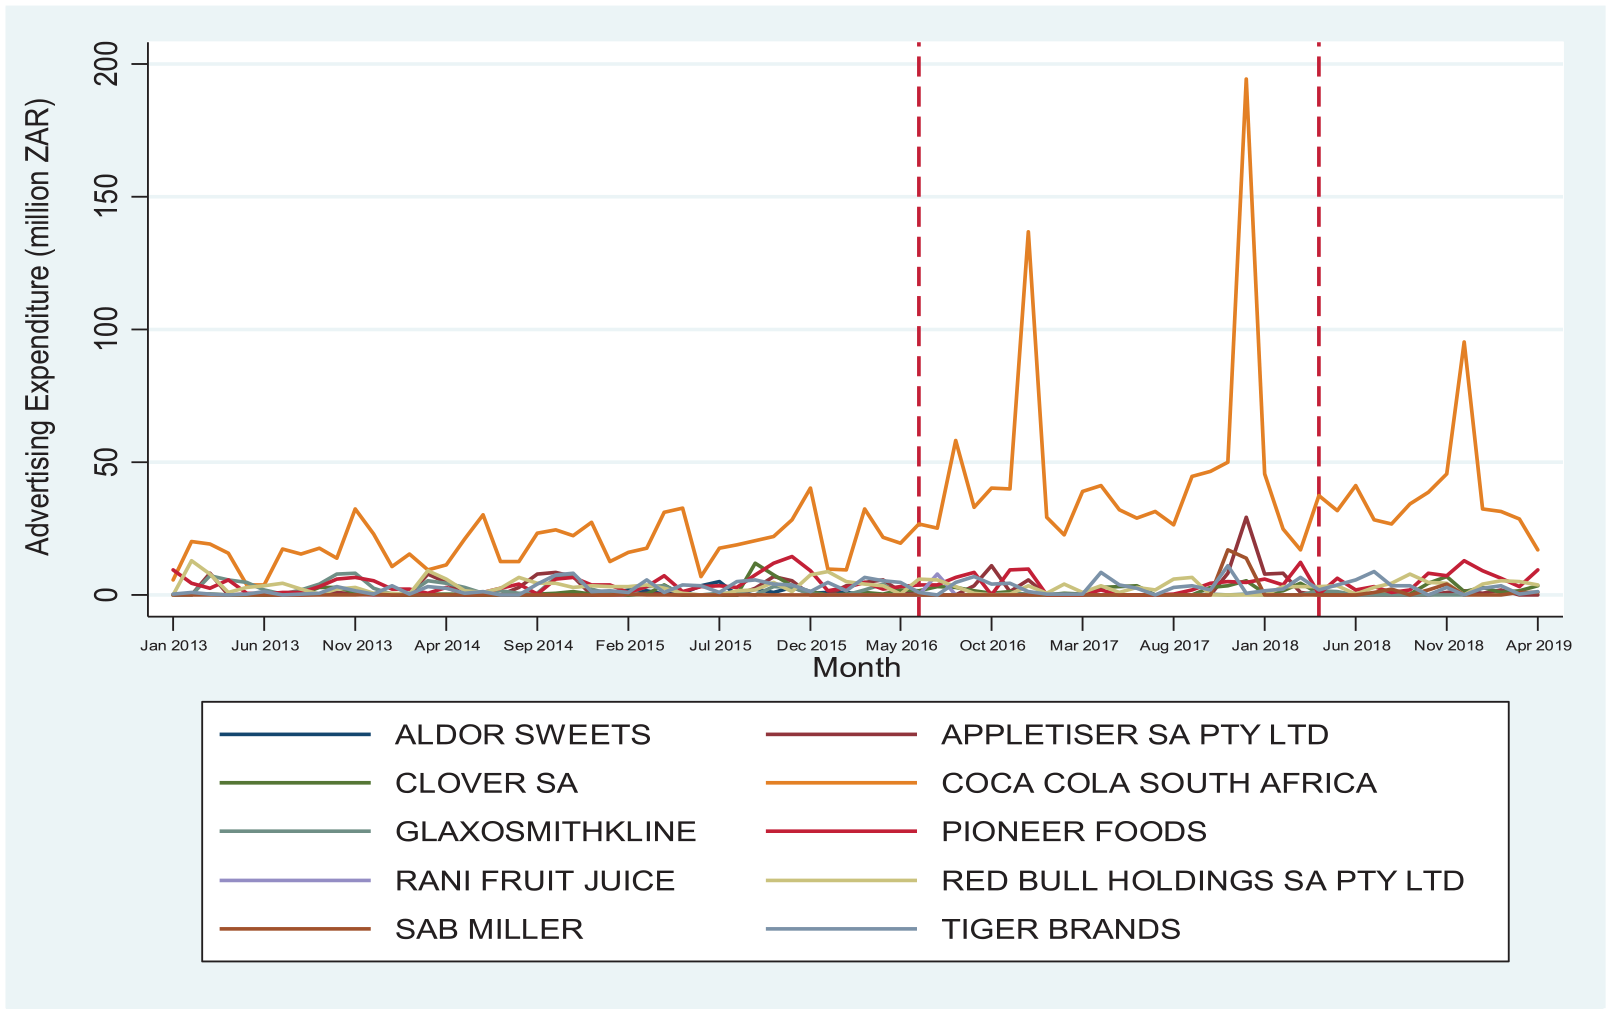
Advertising expenditure by manufacturer in million ZAR (2019 prices), January 2013 to April 2019.
Children’s exposure to advertisements
The analysis of children’s exposure to advertisement is premised on the assumption that TV is available for viewing during 15:00:01 to 19:00:01 h. This translate into a total of 4 h/day (for weekdays only) for both children’s and family viewing time. Over the 76 months period, children had a total maximum of 6812 h to watch TV during 15:00:01 to 19:00:00. Thus, a child had a maximum of approximately 538 h for each viewing time annually for January 2013 to December 2018 and 179 h for January to April 2019
Figure 6 presents the average number of advertisements per hour per drink category and year for the period January 2013 to April 2019 across all TV channels. Overall, 218,976 SSB advertisements were aired on all TV channels during the hours of 15:00 to 17:00 h, designated children’s time by the public broadcaster. About 80% of these advertisements were for carbonated and energy drinks. On average, 64 SSB advertisements were aired per hour during children’s viewing time during the study period across all television channels. The total number of advertisements per hour for carbonated drinks increased from 20 in 2013 to 59 in 2017, but later declined by 48% in 2018. During 2013 and 2017, the average number of advertisements on energy drinks declined by 40%, from 15.9 to 9.6 advertisements per hour. This, however, increased to 24 advertisements per hour in 2018. Trends in the hourly average of advertisements for other beverage categories are shown in Figure 6.

Average number of SSB advertisements per hour aired during “child viewing time” (15:00:01 to 17:00:00 h), January 2013 to April 2019.
Overall, there were more advertisements during “family viewing time” (17:00:01 to 19:00:00 hours) (Figure 7). Total advertisements during these hours were 43% higher than during children’s time (15:00:00 to 17:00:00), with carbonated and energy drinks featuring prominently.

Average number of SSB advertisements per hour aired during “family viewing time” (17:00:01 to 19:00:00 h), January 2013 to April 2019.
A significant portion of the advertisements (78%) was aired on channels other than SABC 1, 2, 3, and e-TV (Tables A1 and A2 in Appendix). These channels included, for example, M-NET and 1 MAGIC, accessed through DSTV (these are pay for view channels) which target a higher income group. The average number of advertisements for all SSB types per hour across all channels increased from 64 during “child viewing time” to 92 during “family viewing time.” The average hourly SSB advertisements was approximately 78 for the two viewing periods combined.
Given that it is unlikely that viewers watching multiple channels at the same time, Table 1 shows that among the non-paying national broadcast channels of South African Broadcasting Corporation (SABC) 1 and 2 and e-TV, viewers are likely to see 3–4 carbonated drink ads per hour during the 15:00 to 17:00 child viewing time, and 3.5–4.5 carbonated drink advertisements per hour during the 17:00 to 19:00 family viewing time. When considering all types of SSBs, viewers are likely to see around six and seven advertisements per hour in each of these two time slots on national broadcast channels.
Discussion
Consumption of SSBs is a contributory factor to the high level of obesity in South Africa. Obesity, which is a major risk factor for diabetes and other weight-related non-communicable diseases is costing South Africa’s public health sector about ZAR 33.2 billion annually.6,7 By 2030, treatment and management of diabetes alone is expected to cost the South African government and the public ZAR 35 billion. 8 Meanwhile, private for-profit companies are increasingly advertising SSBs, which fuels overweight and obesity and the NCD crisis in South Africa.
During January 2013 to April 2019, South African SSB manufacturers spent ZAR 3683 million to advertise their drinks. From ZAR 89 million on carbonated drinks in the first half of 2013, beverage companies increased their advertising spending by nearly 600%. Similar to previous findings, 14 SSB advertising expenditure was driven by television advertisements on carbonated drinks. Spending was lower on squashes and powdered concentrates. Carbonated SSBs were the main product of overall advertising expenditure, with the majority of these advertisements being broadcast on television. This is consistent with findings from recent studies in Australia and Canada which show that TV advertisements account for largest share of total advertisements.22,23
The trends also show that manufacturers increased their advertising expenditures following the announcement of government’s intention to tax SSBs in June 2016. This strategy was, perhaps, so beverage companies could expand their consumer base and generate stronger SSB brand and product loyalty before the HPL implementation so as to maintain existing sales volume after implementation of the HPL. Total advertising expenditures peaked in December 2017 just before the legislation on the HPL was passed and declined afterwards. Nonetheless, the HPL led to a significant decline in taxed beverage purchases,26,27 indicating that consumers are changing their consumption behavior following the HPL. SSB taxes in Mexico 47 and Philadelphia, US 48 have been associated with lower SSB purchases. This shows that while industry use advertising and marketing strategies to increase SSB consumption, effective implementation of policies like the HPL can neutralize the consumption effect of advertising and marketing strategies of the beverage industry.
The top advertiser was Coca-Cola South Africa Limited, spending approximately ZAR 2284 million during the period. Available data show that, in 2020, Coca-Cola accounted for 45% of all off-trade sales in South Africa.49,g The quest to maintain or increase market share may explain their high advertising expenditure during the period. Pepsi, a key competitor of Coca-Cola recorded ZAR 19 million in advertising expenditure. In the same period (2013/14 to 2018/19), the NDoH spent the equivalent of 7.1% of Coca-Cola’s advertising expenditure on NCD prevention strategies. h This shows that beverage companies advertising spending far exceeded government expenditure (or budget) on NCD prevention. Given that the purpose of advertising is to increase SSB consumption particularly among young people, 14 they ultimately undermine the prevention of NCDs which in the longer term imposes huge cost on the South Africa’s healthcare system and productivity.6–8
While the Consumer Goods Council of South Africa pledged in 2009 to reduce the exposure of children to sugary drink advertisements, 33 this did not happen. There were numerous advertisements during both the child and family viewing hours, which is consistent with the findings from previous studies in South Africa.29,30,34. A significant number of these advertisements (78%) were aired on channels other than SABC and e-TV. Unpaid channels such as SABC 1 accounted for only 35% of all advertisements for energy drinks in 2013. 14 The findings illustrate that pledges and self-regulation do not work as is the case of advertising in schools in South Africa. 34 Several years later, in 2017, Coca-Cola pledged to remove all SSBs from primary schools in South Africa. However, it appears the company raised its advertising expenditure immediately after the announcement (see Figure 5). Self-regulation by the industry aim to prevent government regulations, influence the policy environment and ultimately public health outcomes in low- and middle-income countries. 50
According to the Advertising Regulatory Board of South Africa, food and beverage products that do not represent healthy dietary choices and a healthy lifestyle (based on established scientific standards) should not be advertised to children. 32 However, this is not enforced, and our study indicates poor compliance of the voluntary South Africa’s Food and Beverage Code and the Pledge on Marketing to Children. 33 The voluntary nature of these pledges mean that no consequences will follow. During COVID-19 lockdown levels 5 and 4, people spent more hours viewing TV. At this time, we expect more hours for Co-TV viewing for most parts of the day since both children and parents were at home. This means that children were exposed to SSB advertisements. Among preschool children in South Africa, it has been shown that such children spend an average of 3.38 h/week (i.e., approximately 41 min/day) during the weekday on TV, 51 and 3.3 h/day among 9–11 years olds. 52 This implies that, on a daily basis (i.e., the 4-h window), a preschool child might be exposed to 6 to as many as approximately 53 SSB advertisements in any given channel or across all TV channels. For children in the 9–11 years age group, the results imply that they might be exposed to 25 to as many as 257 SSB advertisements daily.
To minimize exposure of children to advertisements of products shown to be harmful to health, urgent mandatory regulation, and cross-sectoral coordination from various government departments and organizations such as the NDoH, Department of Communications and Digital Technologies (DCDT) and Advertising Regulatory Board of South Africa is essential. It is important for all advertising messages to promote trust and security among the people and to protect children from exploitation. 53 In this regard, the DCDT will need to implement stricter control on what is advertised in the media. Experience from the tobacco sector may help government to regulate the advertising space of SSBs. Since exposure to advertisements influences children and caregivers’ preferences and leads them to choose nutrient-poor foods and drinks,18,19 bans on advertising, promotions, and sponsorships will help reduce children’s exposure to obesogenic foods. This will have long-term effects of reducing obesity rates and NCDs.
Strengths and limitations
Using monthly data, this study contributes to the understanding of the SSBs advertising landscape in South Africa. By this, we show that companies are infringing on children’s rights and violating advertising codes in South Africa. A limitation of the study is its inability to monitor social media advertising. Social media platforms such as Twitter, Facebook, Instagram, and Pinterest among others have become important mediums of advertising for companies, often using influencers to disguise advertising. The advertising spend on such platforms was not available in the Nielsen database but are likely growing. 42 Furthermore, there was no information on the day (exact date) these advertisements were aired. Therefore, the assumption that all advertisements were aired during the weekday and none for weekends may not reflect the actual exposure during weekdays or weekends. We were also only able to look specifically at SSB advertisements and are unable to account for advertisements of products that also contribute to increased risks of NCDs, such as unhealthy foods and alcohol. For this reason, this study only describes SSB advertisements as categorized in the Nielsen database and focuses on the designated period children are most likely (but not exclusively) being exposed to.
Finally, this work is also limited in its period of analyses to the pre-COVID years. Thus, we are unable to show whether and to what extent the airing of SSB advertisements and children’s exposure to them changed given lockdowns resulting in children spending more time at home and thus greater screen time (see Figure 2). 40 Future work needs to continue tracking these trends over time to document these economic and commercial determinants of ill health. Future studies should also consider the cost per minute for broadcasting time.
Conclusion
This study demonstrates that companies are spending significant funds to market their SSB products, with television being their preferred medium. The advertising expenditure increased significantly between 2016 and 2017 following government’s announcement of the intention to implement HPL.
Companies have failed to adhere to their own voluntary code and their pledges to protect children from advertising of SSBs. The advertising and marketing space in South Africa needs mandatory regulation because the rights of children are being violated. The NDoH, the Advertising Regulatory Board of South Africa, and the Department of Communications and Digital Technologies should monitor both free and paid TV programming, radio, print and digital media, and sanction companies who advertise SSBs to children.
Footnotes
Appendix
Number of adverts aired across all TV channels by drink type and year.

| Children viewing time (15:00:01 to 17:00:00) | Family viewing time (17:00:01 to 19:00:00) | |||||||||
|---|---|---|---|---|---|---|---|---|---|---|
| Year | Carbonated | Energy drink | Fruit Juice | Squashes | Total | Carbonated | Energy drink | Fruit Juice | Squashes | Total |
| 2013 | 10,740 | 8556 | 2580 | 984 | 22,860 | 13,056 | 9228 | 3504 | 1512 | 27,300 |
| 2014 | 11,484 | 13,524 | 2664 | 2472 | 30,144 | 17,544 | 21,516 | 3804 | 3480 | 46,344 |
| 2015 | 12,960 | 129,60 | 3708 | 3168 | 32,796 | 15,216 | 14,856 | 7716 | 3144 | 40,932 |
| 2016 | 22,980 | 11,220 | 7548 | 3360 | 45,108 | 31,068 | 15,036 | 11,892 | 2556 | 60,552 |
| 2017 | 31,656 | 5160 | 4296 | 2556 | 43,668 | 44,508 | 6960 | 9492 | 2628 | 63,588 |
| 2018 | 16,596 | 12,756 | 8724 | 2112 | 40,188 | 23,100 | 21,780 | 19,860 | 1260 | 66,000 |
| 2019** | 1124 | 1576 | 1308 | 204 | 4212 | 1556 | 2988 | 3184 | 156 | 7884 |
| Total | 107,540 | 65,752 | 30,828 | 14,856 | 218,976 | 146,048 | 92,364 | 59,452 | 14,736 | 312,600 |
| Hourly average # | 31.58 | 19.31 | 9.05 | 4.36 | 64.31 | 42.89 | 27.13 | 17.46 | 4.33 | 91.81 |
January to April 2019.
Hourly averages are for January 2013 to April 2019 and calculated using a total of 3405 h for each viewing time.
Author contributions
Conceived the research: MKB, ET, PK. Data analysis: MKB. Contributed analysis/materials: MKB, ET, SG, PK, SWN, KJH. Wrote the first draft: MKB. Provided critical review and edited drafts: MKB, ET, SG, PK, SWN, KJH. All authors approved the final version submitted.
Declaration of conflicting interests
The author(s) declared no potential conflicts of interest with respect to the research, authorship, and/or publication of this article.
Funding
The author(s) disclosed receipt of the following financial support for the research, authorship, and/or publication of this article: This study received funding from Bloomberg Philanthropies through the University of North Carolina at Chapel Hill, USA [grant number 5106249] and the South African Medical Research Council [grant number 23108].