
Abstract
This note assesses the relationship between labour productivity and employment in the framework of the unobserved component model as well as the vector autoregressive model. In the case of the organized/formal manufacturing sector in India, the transitory increase in productivity is seen to reduce the man-days in the short run, though it is not statistically significant. Permanent shock to productivity decreases labour inputs permanently, and vice versa and their association is also statistically significant. Incentivizing the firms to expand their activities, diversify production and process secondary products may help restore employment in the face of a permanent productivity shock.
Introduction
A positive shock to productivity results in a negative effect on labour hours, as propounded by the real business cycle theory. 1 The New Keynesian model of the business cycle also implies a negative transitory effect on labour hours (Gali, 1999). Basistha (2009) in the case of the United States noted that permanent shocks to productivity are negatively correlated with transitory shocks to labour hours. This may suggest that employment decline is not persistent in the long run. The present study examines whether productivity shock generates effects on labour inputs, transitorily or permanently, taking the case of the Indian organized manufacturing sector. However, it is important to mention here that the term ‘rise in productivity’ need not be confined to labour alone, as it may have implications for improvements in capital services, quality of infrastructure and so on. Greater technological progress and more efficient utilization of resources may result in higher total factor productivity growth. In the following part of our analysis we, however, primarily refer to labour productivity.
The adoption of capital-intensive technology resulting in a rise in labour productivity and a decline in employment is prevalent in many countries. A large body of literature explores conditions under which developed countries suffer from positive technology shocks as far as medium to low-skilled employment is concerned (Acemoglu & Autor 2011; Berman et al., 1994). In the context of developing countries, the mismatches between labour demand and supply are overwhelmingly large as these countries are incongruously characterized by excess supplies of labour. In the backdrop of the fourth industrial revolution, it is further feared that rapid mechanization may contribute to labour productivity growth at the expense of labour absorption. However, a positive association between labour productivity and employment appears to be a possibility if the new technology is able to create product diversification and motivate firms to pursue the processing of secondary products, thus raising the scale of activities without causing a further increase in the demand for capital (Mitra & Jha, 2016). The secondary products or the by-products which were earlier treated as industrial waste and disposed of without weighing their productive potential are being used by the firms after technological upgradation. Without any proportionate rise in capital, the firms find it profitable to process these products as they witnessed a surge in capacity and scale of activities subsequent to technological progress. Such efforts result in the restoration of employment instead of retrenchment resulting from mechanization. In fact, Vivarelli (2013) cites a number of reasons envisaging a positive relationship between technology and productivity growth, on the one hand, and employment, on the other. The ‘compensation theory’, as Vivarelli (2013) pointed out, argues that technological unemployment is a temporary phenomenon. The labour-saving effects of technology can be offset through:
(1) additional employment in the capital goods sector where new machines are being produced, (2) decreases in prices resulting from lower production costs on account of technological innovations, (3) new investments made using extra profits due to technological change, (4) decreases in wages resulting from price adjustment mechanisms and leading to higher levels of employment, (5) increases in income resulting from redistribution of gains from innovation, and (6) new products created using new technologies. (Vivarelli, 2013)
2
However, Vivarelli (2014) concludes that the compensation mecha-nisms require strict assumptions, overlook the secondary adverse demand effects that may result from falling wages and may not all work in tandem.
The extensive survey of studies by Ugur and Mitra (2017) urges that innovation which raises labour productivity may reduce employment only in the least developed countries; otherwise, employment decline with a rise in productivity is transitory. In the long run, sufficient adjustments and reshuffling are made by the firms, resulting in improved profitability as well as employment. Product innovation is instrumental to these gains even when process innovation in certain stages of the production pipeline is labour displacing. In fact, the elasticity of employment with respect to R&D expenditure, after controlling for output and wages, turns out to be positive and significant in a number of industries (Mitra, 2020). Technological progress may affect the demand for skilled and unskilled workers differently. The labour-saving technological progress during 1979–1989 in the United States was most likely responsible for the shift in the demand for non-production workers (Berman et al., 1994). The studies of other developed countries, such as the United Kingdom, also show that positive industry-level productivity shocks cause hours worked to fall in the short run (Khan & Tsoukalas, 2013). However, in the case of Japan, positive technology shocks increased the hours worked (Kwon & Ko, 2013).
The interaction between economic integration, product and process innovation, and relative skill demand is an important aspect which Braun (2008) analysed in a model of international oligopoly. Lowering trade barriers increases the degree of foreign competition, which may have effects on the incentives of firms to undertake R&D investment and also the firms’ demand for skilled relative to unskilled workers. Increased competition following economic integration induces firms to bring down production costs by investing more aggressively in process R&D. At the same time, competitors expand their investments in product innovation in order to reduce the substitutability of their products. However, all this would require highly skilled human labour which can initiate newer ways of introducing cost-efficient production processes and bring down the product differentials between the imported goods and the domestically produced goods. On the whole, economic integration and innovation are interlinked resulting in an increase in the relative demand for skilled workers 3 and not the unskilled or semi-skilled variety of labour force which is in excess supply in most of the developing countries. Innovation and skill intensity usually go together; hence, even if innovation is not always labour displacing, it benefits only those who are relatively in short supply. This tends to indicate that wage inequality is likely to increase in the process of innovation, enhanced productivity and increased trade.
Using the correlated unobserved components model (UCM), this study proposes to examine the association between productivity shock and labour input in the case of Indian organized manufacturing. We also examine the relationship among productivity, man-days per worker and inflation in the vector autoregressive (VAR) framework. However, the limitations in conceptualizing man-days per worker as an index of employment need to be realized. At times the trade-offs between the number of workers and man-days per worker are widely known, particularly when firms in an attempt to reduce labour costs hire a lesser number of workers and utilize them intensely by raising the man-days per worker. Payment for the extra hours costs less than additionally employing a new person.
The analysis is done for the aggregate organized manufacturing sector. In spite of the variations across industry groups, the commonality that the organized manufacturing sector is confronted with is a major increase in capital–labour ratio accompanied by declining employment share. This motivated us to initiate the analysis at the aggregate level, though in the future we propose to carry out the analysis for different groups of industries to observe the varying productivity–employment configuration and map those variations with the nature of industries and other important characteristics.
Data
The database is drawn from the Annual Survey of Industries of India from which we calculate productivity and labour input variables as ‘output per man-days’ and ‘man-days per workers’, respectively. Productivity is in real terms deflated by the price index. The data are of annual frequency and span from 1981 to 2019. The data on employment for industries since 1981 at quarterly or monthly frequency are not available. Annual data, as used in this study, do not capture fluctuations of less than annual frequency. ‘Value of output’ is divided by the total man-days of employees to obtain ‘output per man-day’, and the total ‘man-days of employees’ is divided by the total number of employees to obtain ‘man-days per worker’.
National Accounts Statistics (NAS) of the Ministry of Statistics and Programme Implementation provides a sectoral output at current prices and at constant prices (2011–2012 as a base). In order to get inflation, we calculated the deflator for the manufacturing sector using the information provided by NAS. The supply shock variable, as suggested in Basistha (2009), is the difference between the ‘non-farm deflator’ and ‘food and energy deflators’ of NAS. The ‘Non-farm 4 deflator’ is calculated using NAS data at current and constant prices. Similarly, the ‘Food and Energy 5 deflator’ is calculated using the value added for the sector at current and constant prices.
Methodology: UCM
A time series contains many components such as trends, seasonal variations and cycles. UCM decomposes a time series into these components (Harvey, 1989). Each of the extracted components of the series helps in explaining and predicting the behaviour of the series better.
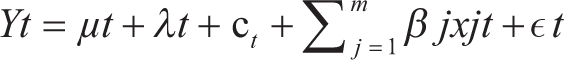

where μt is a trend, λt is seasonal, and Ct is a cyclical component of the ϒt time series, xjt are other explanatory variables. The use of UCM extracts the cyclical component of the time series used in the study.
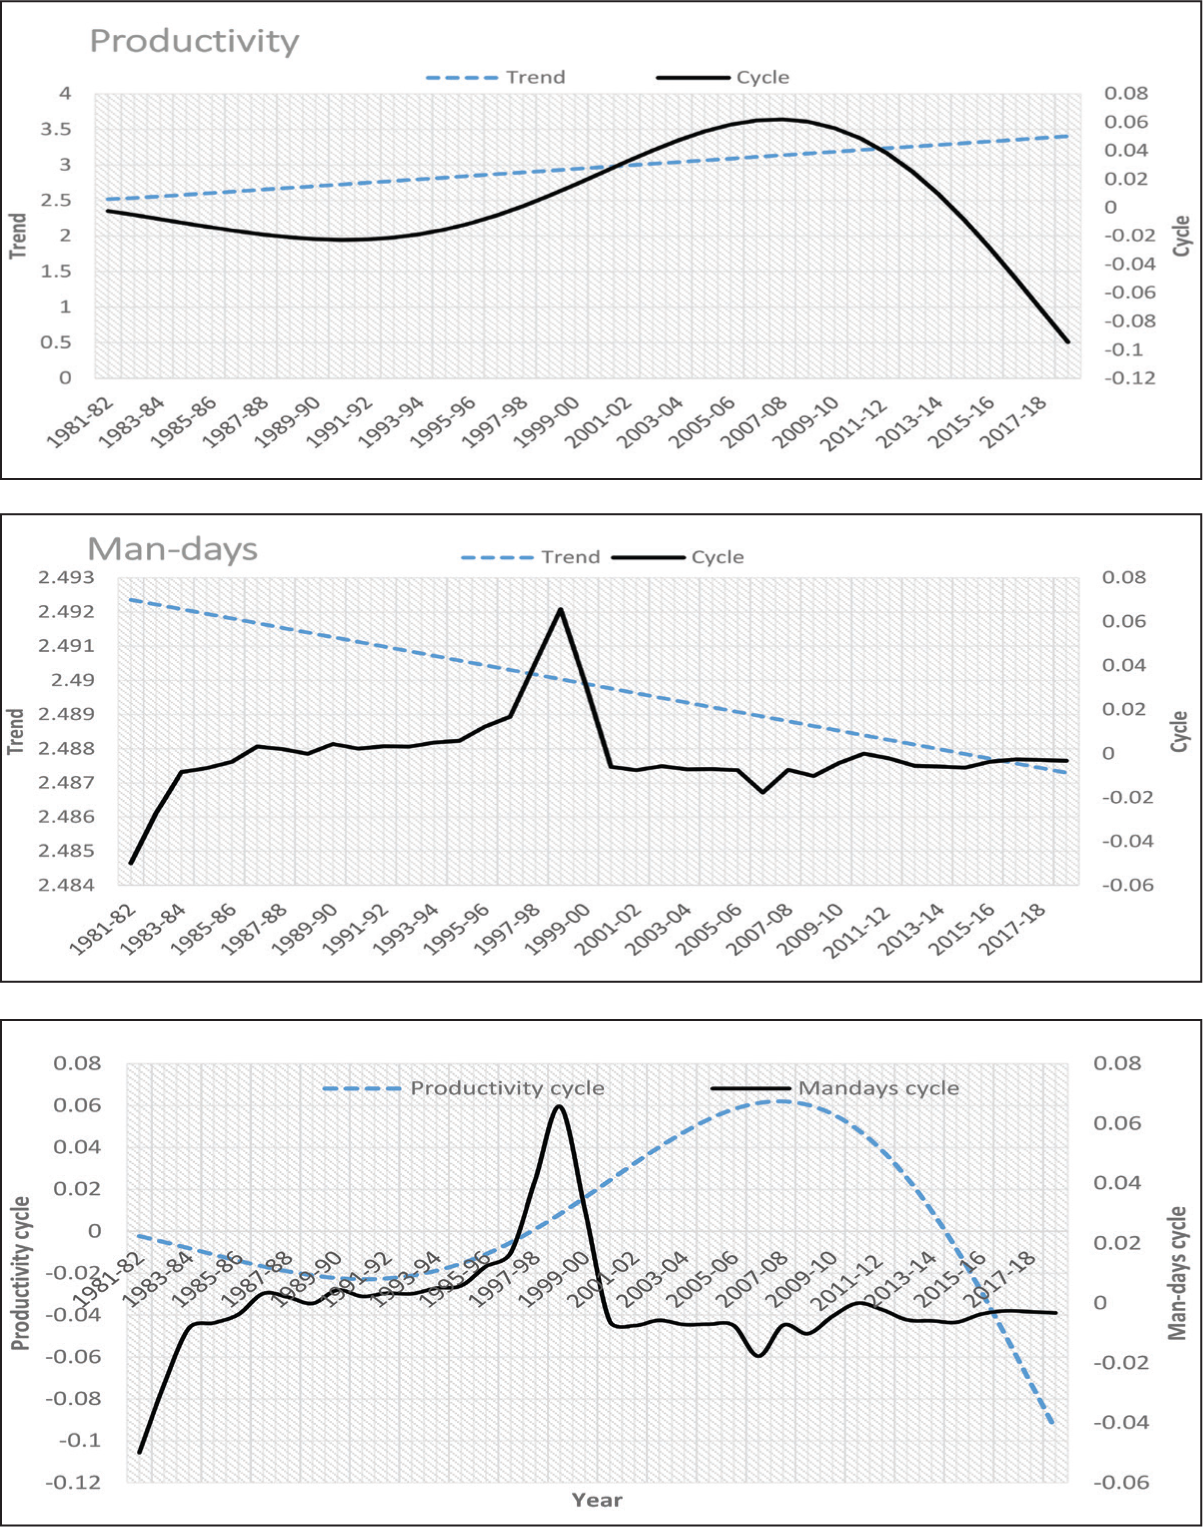
The unobserved components—cycle and trend—of the variables, viz., productivity (‘output per man-days) and man-days per worker, were extracted first for which we estimated a structural time-series model using the Kalman filter and maximum likelihood. The trend is specified as stochastic, random-walk. The cyclical component is specified as trigonometric. Regression estimates include the dependent variable ‘inflation rate’, and independent variables ‘lagged inflation’ taken as inflation expectation, ‘supply chock’ and cycle of man-days per worker and productivity. The correlation matrix, however, includes only trends and cycles components of both productivity and man-days per worker along with the inflation rate.
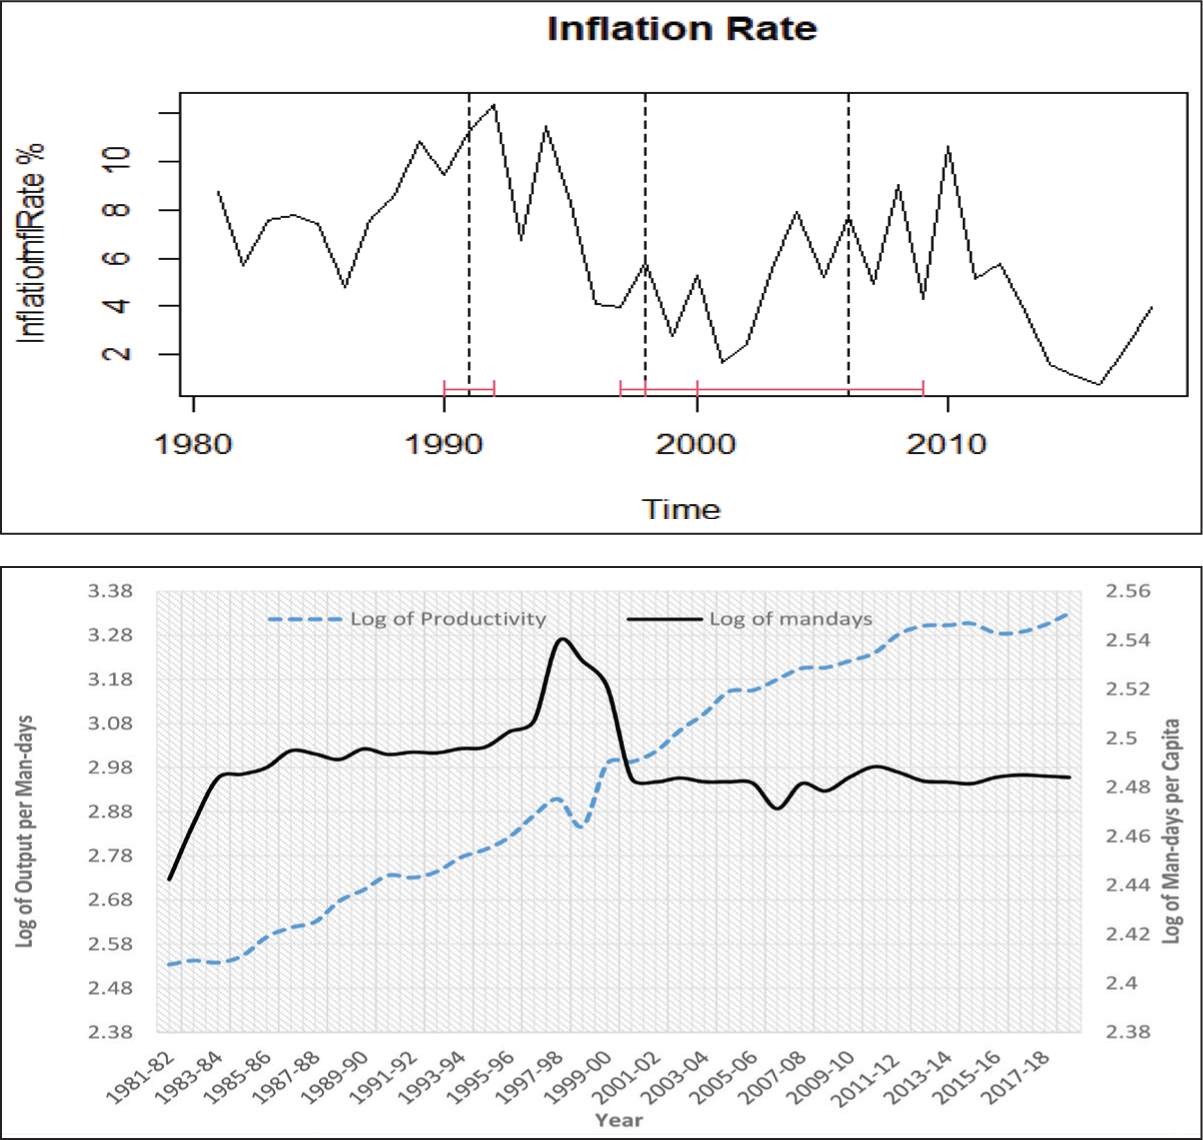
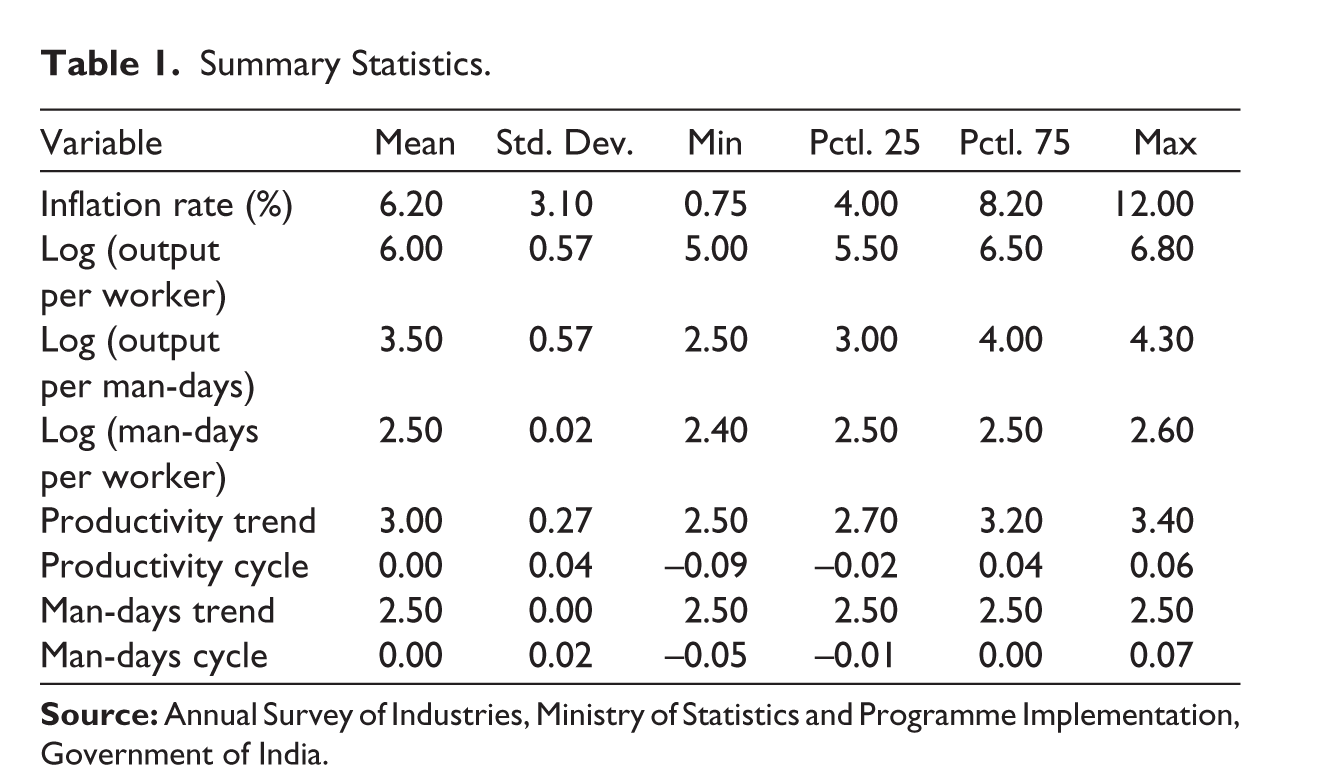
Inflation rate is tested for structural breaks. Estimates suggested three structural breaks in the years 1991, 1998 and 2006 (Figure 1). The change in macroeconomic policy in 1991 might have changed the inflation process. The year 1998–1999 witnessed turbulent and unfavourable international economic environment because of the East Asian Crises. The year 2006 represents high food inflation in India during the era of the Mahatma Gandhi National Rural Employment Scheme. Figure 1 presents a log of man-days per worker and productivity series. Figure 2 presents trends and cycle components of productivity and man-days per worker series. Summary statistics are given in Table 1.
Summary Statistics.
The equation (as in Basistha, 2009) is as follows:
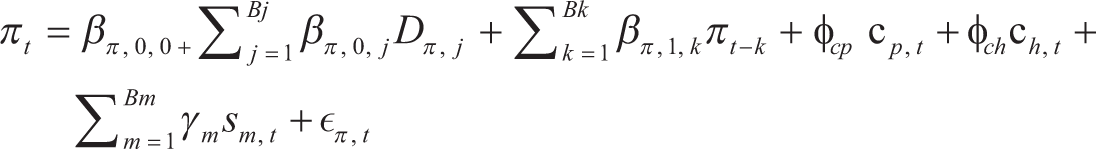
where Cpt and cht are cyclical components of the productivity and man-days per worker, respectively; Πt and Πt-k are the inflation rate and lagged inflation (as expected inflation), respectively; Dπj are dummies for structural shift λs in inflation rate: break years are 1991, 1998 and 2006; Sm, t denote supply shocks.
Results and Discussion
Correlation results are presented in Figure 3. First, we will see how transitory shock to productivity has been associated with labour input use in Indian industries. Transitory increase in productivity decreases the man-days in the short run and vice versa. However, their association is weak and not statistically significant. The transitory increases in productivity also decrease labour inputs—man-days—in the long run, vice versa, though their association is not statistically significant.
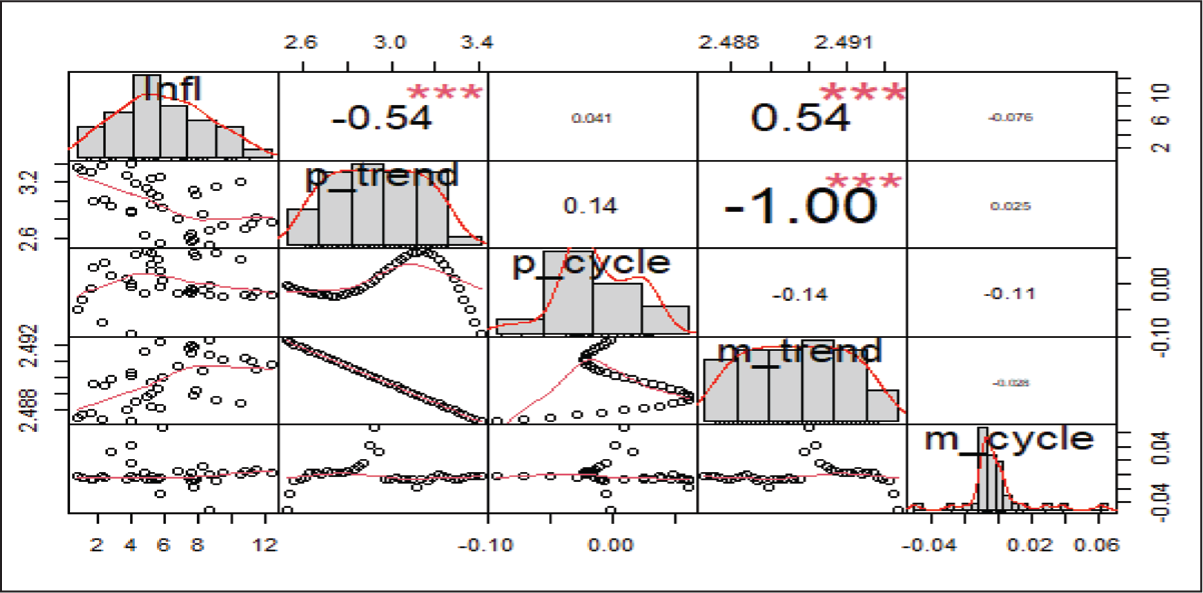
Second, we observe how a permanent shock to productivity has been associated with labour input use. The permanent increase in productivity raises labour inputs in the short run and vice versa, though their association is weak and not statistically significant. Permanent shock to productivity decreases labour inputs permanently and vice versa. Their association is also statistically significant.
Third, we can see how permanent or transitory shocks to productivity trends have been associated with inflation. As expected, a permanent increase in productivity decreases inflation, and vice versa, and their association is statistically significant. The transitory rise in productivity, however, increases inflation, and the converse is also true, but their association is not statistically significant.
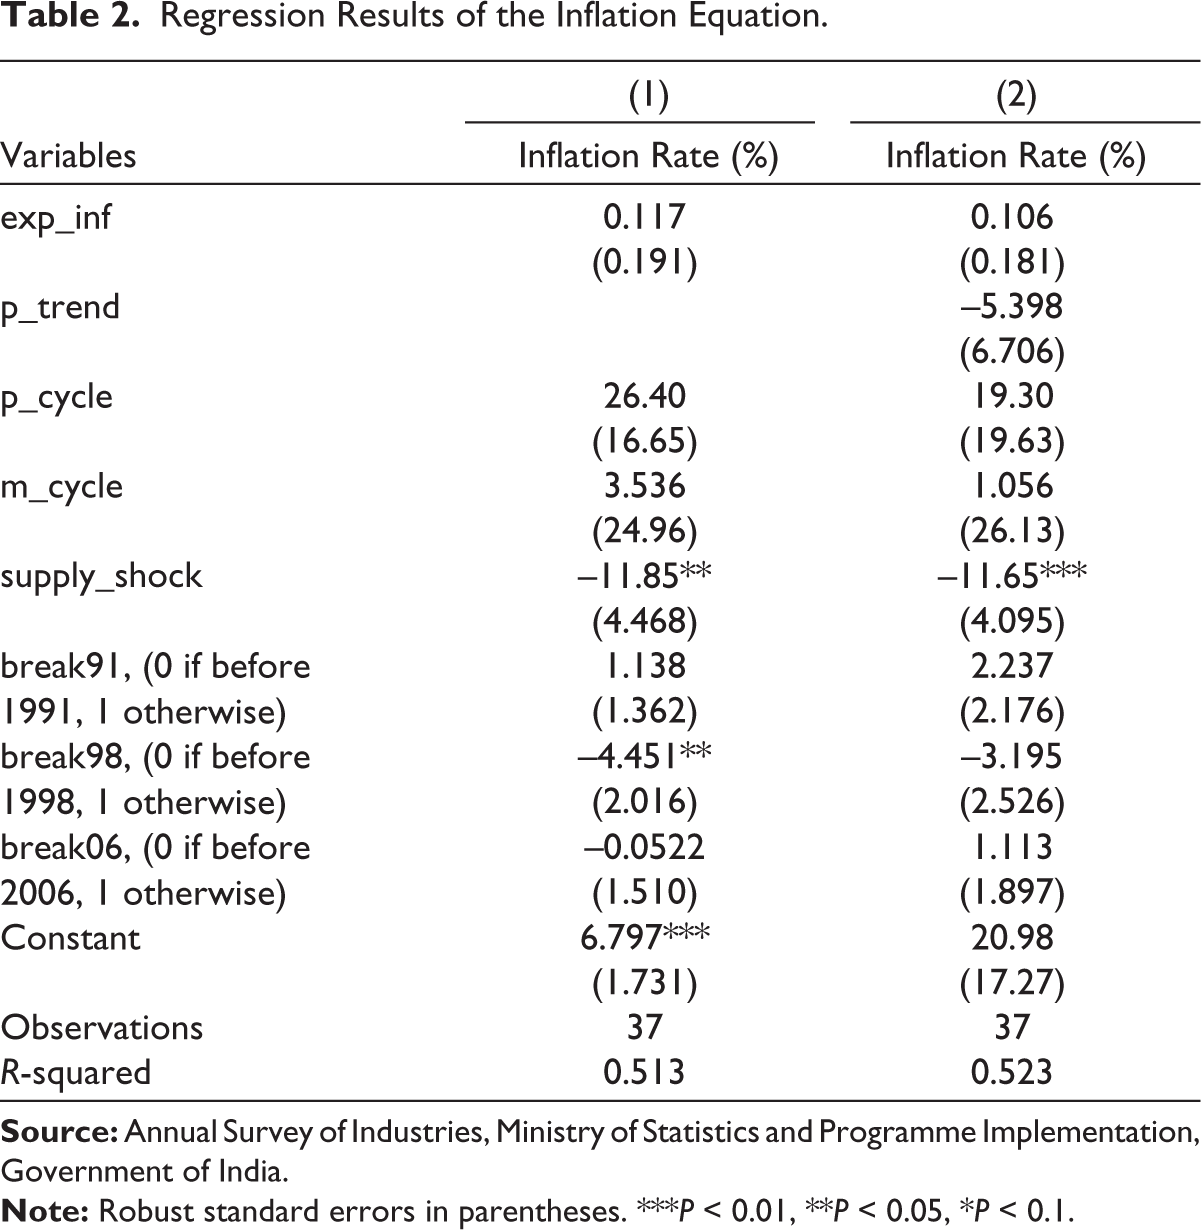
The results for the Phillips curve equation are presented in Table 2. Supply shock emerges as the most important factor in explaining the changes in the inflation rate. Permanent shock to productivity does reduce the inflation rate, but it is not statistically significant. It is the supply shock which drives inflation in the non-farm sector as seen from the regression results in Table 2.
Regression Results of the Inflation Equation.
VAR Framework
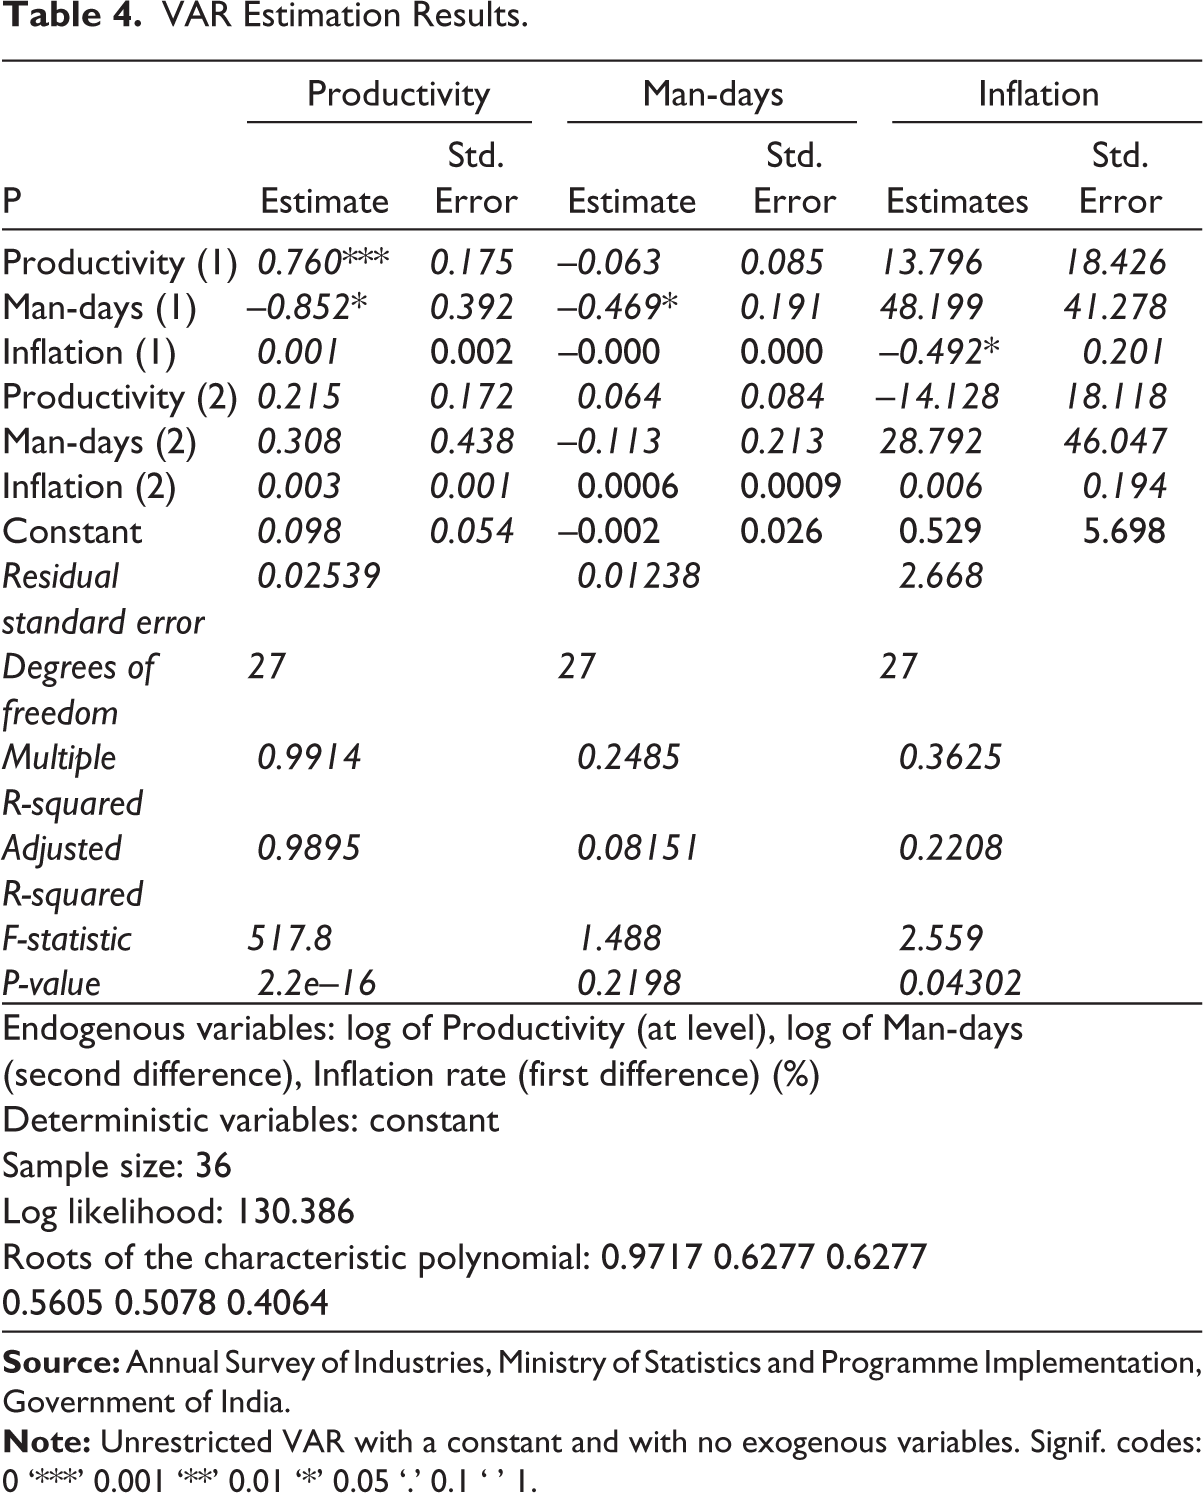
Further, to test the relationship among productivity, labour input use and inflation, we used the VAR model of man-days per worker, productivity and inflation rate. First, we tested the unit root of the productivity, man-days and inflation series, the results of which are in Table 3. The productivity series is stationary at level while the man-days series remained non-stationary even at the first difference form. The inflation series is non-stationary at level but becomes stationary at first difference. The productivity, inflation and man-days series are not integrated in the same order, and their association is also weak. Therefore, we estimate a VAR model with stationary variables (Table 4).
Augmented Dickey–Fuller Test on Peas.
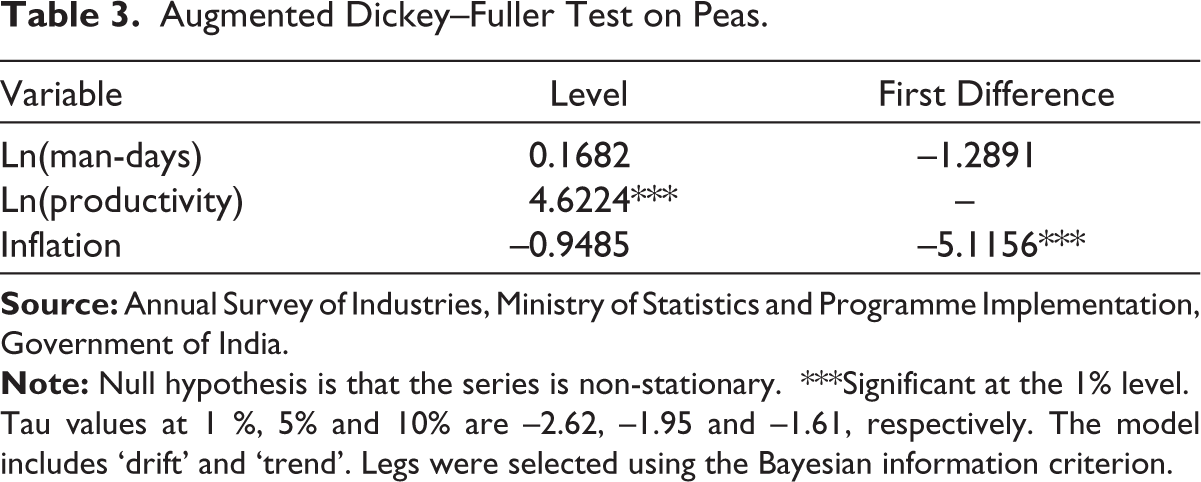
Tau values at 1 %, 5% and 10% are –2.62, –1.95 and –1.61, respectively. The model includes ‘drift’ and ‘trend’. Legs were selected using the Bayesian information criterion.
VAR Estimation Results.
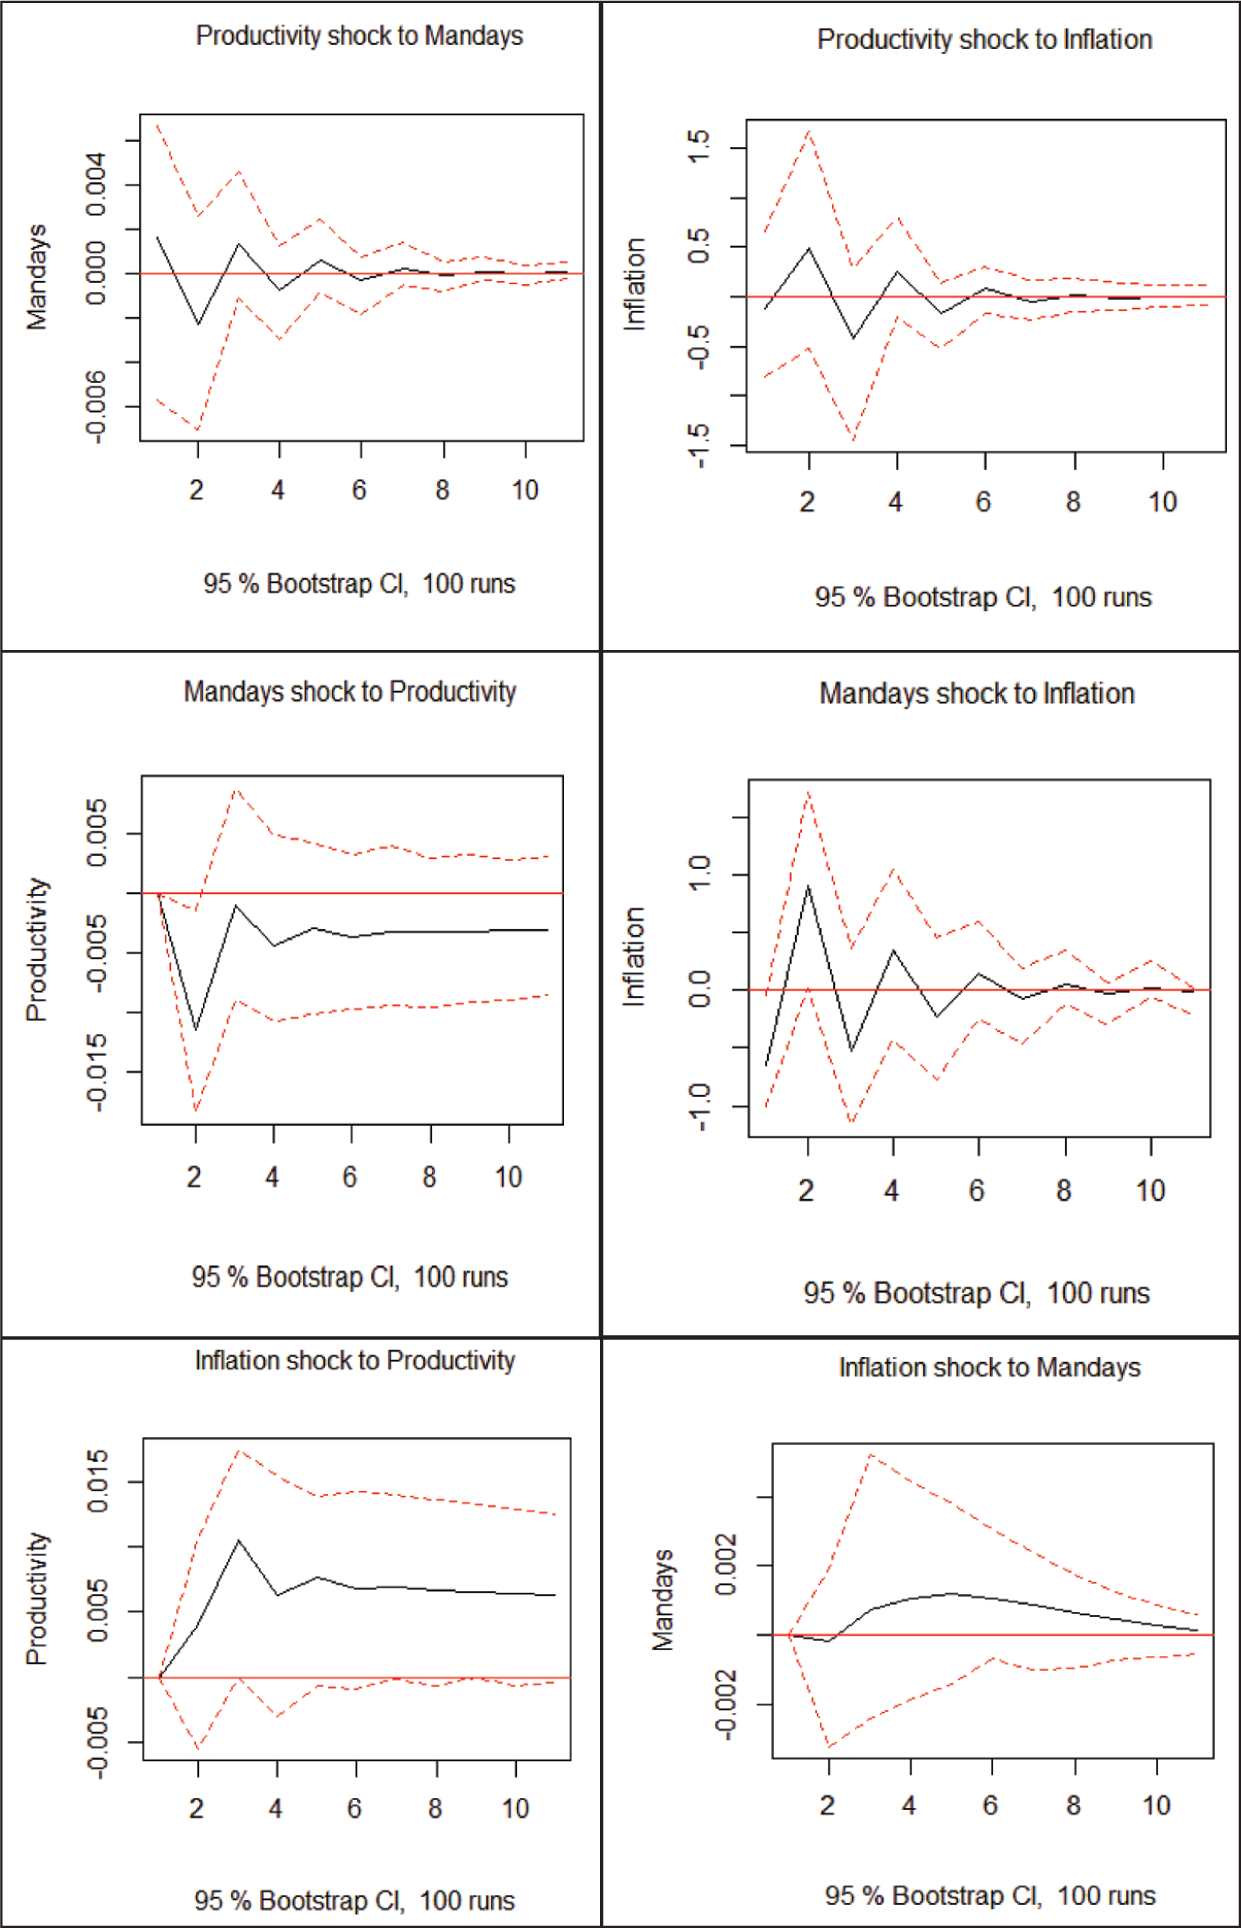
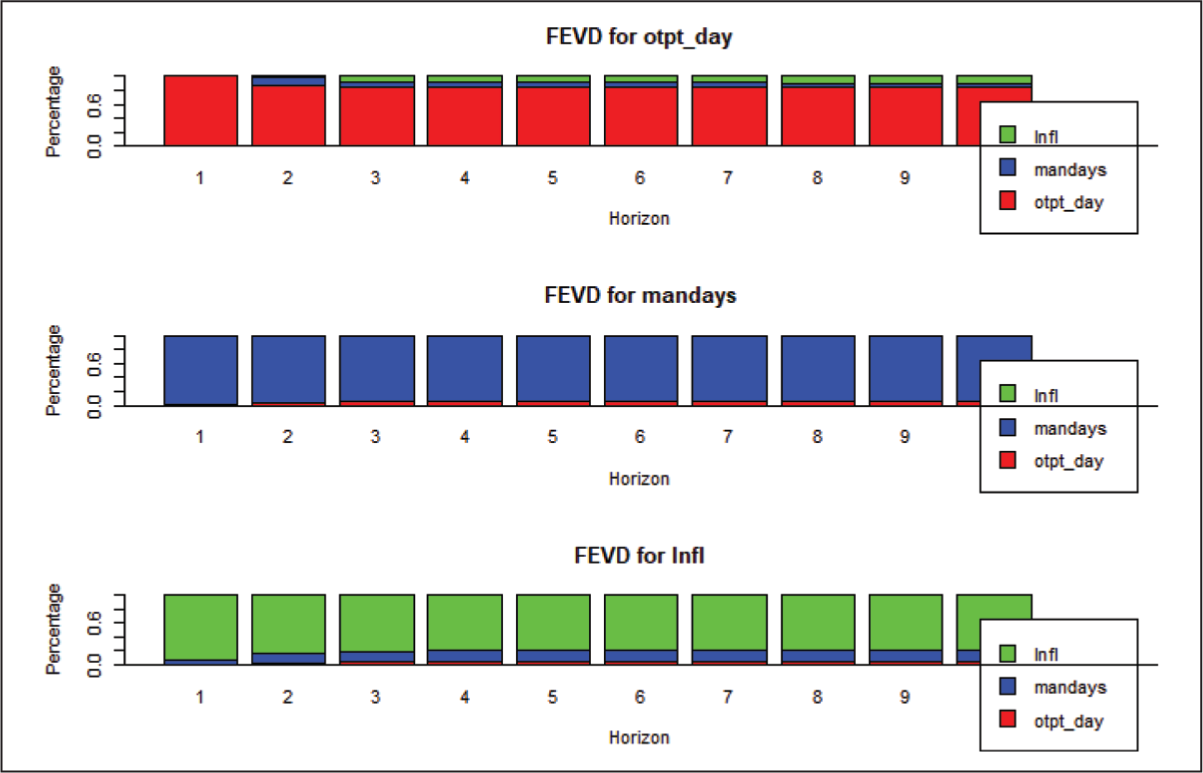
The impulse response function results show that the shock to productivity slows down the growth of man-days, but it does not persist. On the other hand, productivity may not recover fully from the shock to change the growth of man-days. Productivity shock transitorily induces inflation which fades over the next few years (Figure 4). Results of forecasted error variance decomposition are presented in Figure 5 and Table 5.
Forecast Error Variance Decomposition.
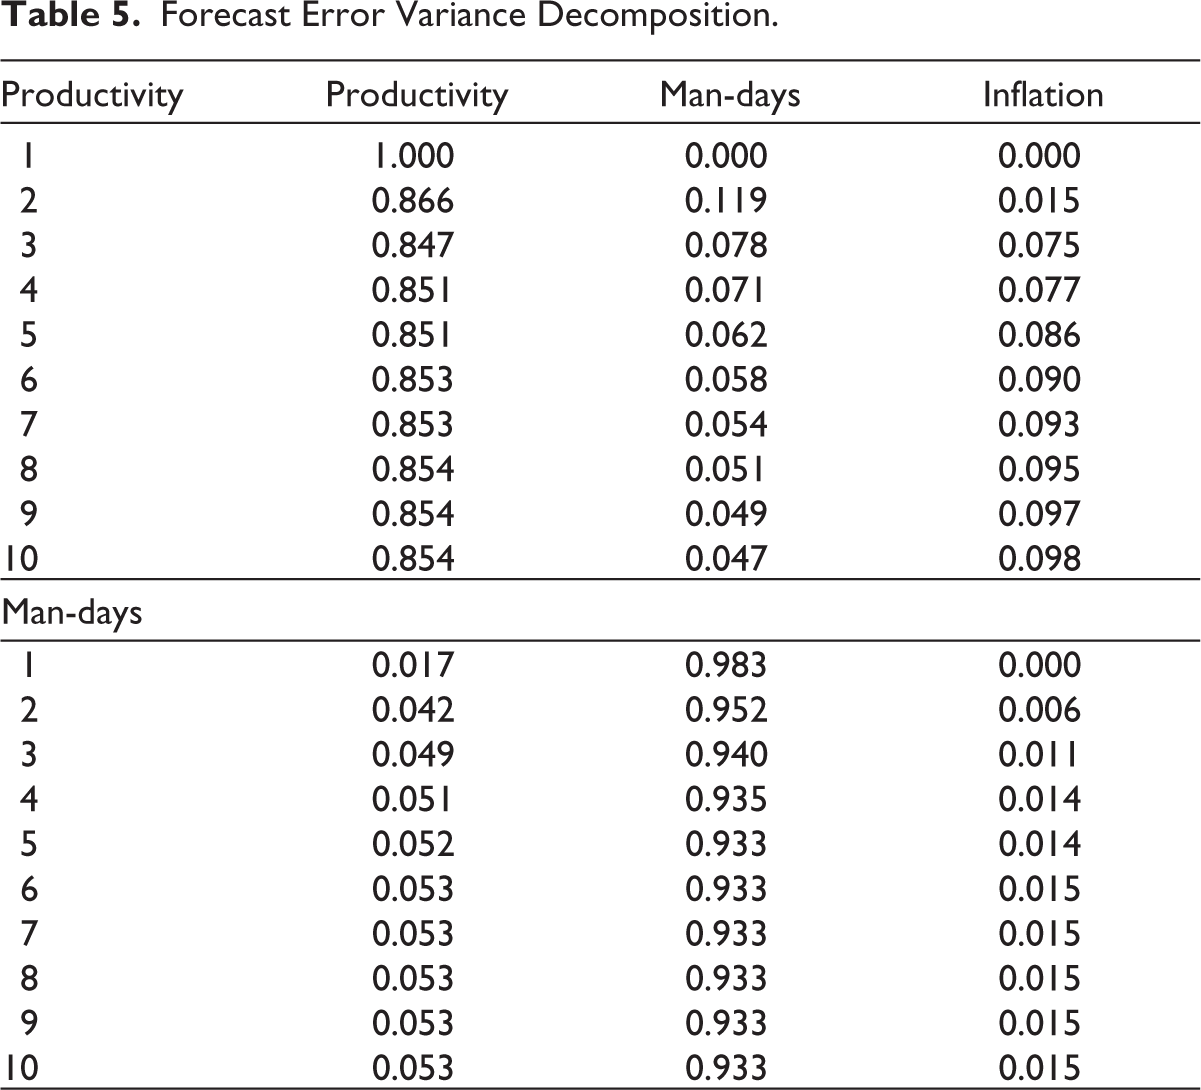
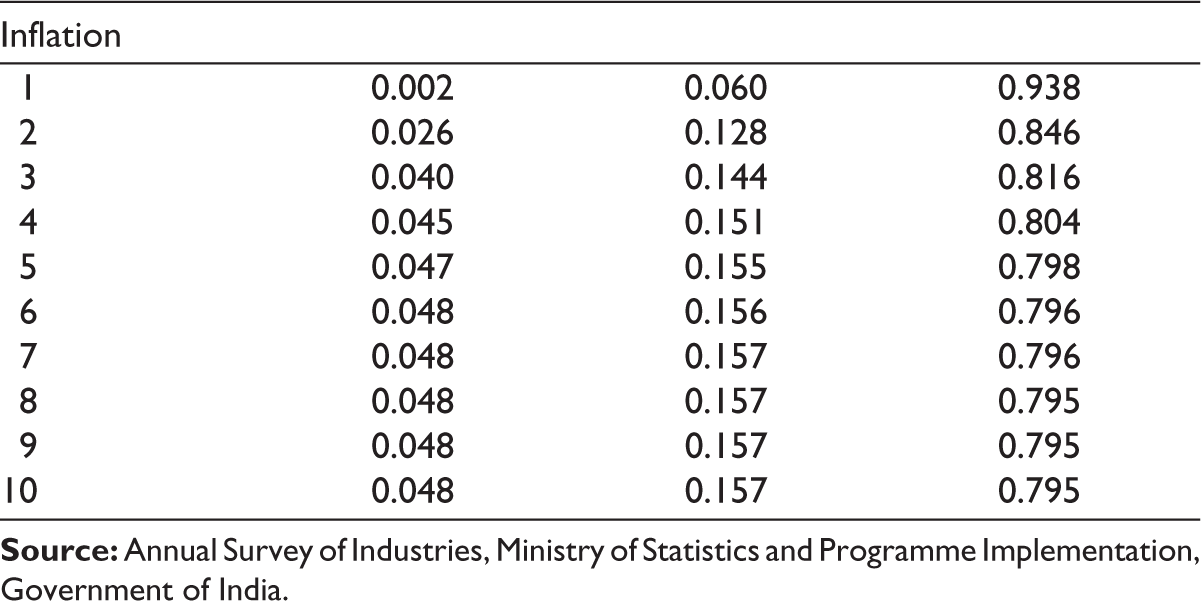
The variance decomposition results show that productivity does not account for any significant proportion of the variance in the change in the growth of man-days. However, if we compare the contribution of man-days to productivity variance vis-à-vis the contribution of productivity to man-days variance in the long run, the former is greater in magnitude. This may be taken to interpret that productivity has a relatively less effect on employment. Productivity has little impact on man-days even in the very long run (after 10 years).
Reduction in productivity can curtail employment: If a firm is not able to maintain its productivity tempo, its performance affects employment adversely. On the other hand, a rise in productivity due to capital deepening may reduce employment as observed from the impulse response function.
Through price incentives employment cannot be raised significantly, though inflation accounts for a large chunk of variation (nearly 16%) in productivity, implying price rise motivates firms to improve performance by adopting productivity enhancement strategies. Both productivity and employment show a significant impact on inflation in the long run. This is understandable because productivity rise can control inflation and increased demand due to increased employment can add to inflation.
The commonality that emerges from both the UCM and the VAR model is that transitory shocks to productivity do not have a marked impact on employment in the short run: in the UCM productivity shock does not reduce employment in the short run and in the VAR framework too as per the variance decomposition analysis, productivity accounts for less than 4% of the total variance in the employment both in the short run and in the long run. On the other hand, a permanent shock to productivity reduces employment as reflected in UCM.
Conclusion
In this note, we have tried to reflect on the productivity–employment relationship, encompassing possibilities of trade-offs as well as complementarity between them. A rise in productivity due to the adoption of capital-intensive technology can reduce employment significantly, which can aggravate the job market situation given the excess supplies of labour relative to demand. On the other hand, a productivity increase implies an improvement in profitability, which may encourage further investment and expansion, resulting in improved levels of employment. Even at the macro level, productivity growth encourages new firms to enter the industry, resulting in a rise in total employment at the aggregate level though an individual firm may witness a drop. With this background, our analysis in the UCM and VAR framework suggests that in the case of the organized/formal manufacturing sector in India, the transitory increase in productivity decreases the man-days in the short run, though it is not statistically significant. Permanent shock to productivity decreases labour inputs permanently, and vice versa, and their association is also statistically significant. The commonality that emerges from both the UCM and the VAR model is that transitory shocks to productivity do not have a marked impact on employment in the short run. On the other hand, a permanent shock to productivity reduces employment as reflected in UCM. Incentivizing the firms to expand their activities, diversity production and process the secondary products may help restore employment in the face of a productivity shock. Innovations and technological upgradation which are indeed an inevitable phenomenon in the present context need not keep us bothering relating to employment. The present study validates some of the employment concerns which arise in an attempt made by the firms to raise productivity. However, these concerns can be mitigated through effective interventions, and the optimism shown by some of the authors like Vivarelli (2013) can actually be realized. A fall in prices due to better technology may raise the demand significantly which may lead to an increase in investment, output and employment. With possibilities for skill upgradation, supply response can be positive, with a lag though. At the moment, the skill upgradation avenues suffer from a number of limitations. The casual and contractual workers hardly receive the benefit of on-the-job training; hence, with technological upgradation, retrenchment becomes inevitable. However, possibilities to reap a win-win situation can be turned into a reality by reworking on the policy questions and the incentive mechanisms.
Footnotes
Acknowledgements
The authors are highly indebted to Dr Arabinda Basistha, Department of Economics, West Virginia University for his intensive comments and inspiration. In fact, the authors got the inspiration from his work published in the Journal of Applied Econometrics (2009). The extensive comments received from an anonymous referee and the helpful suggestions of the Managing Editor of this journal have improved the quality of the paper enormously. Usual disclaimers apply.
Declaration of Conflicting Interests
The authors declared no potential conflicts of interest with respect to the research, authorship and/or publication of this article.
Funding
The authors received no financial support for the research, authorship and/or publication of this article.