
Abstract
In its latest financial stability report, dated 11 January 2021, the Reserve Bank of India (RBI) emphasised the significance of balanced mutual funds in risk transmission. We investigate the transmission of volatility and contagion effect from Indian balanced funds to representative indices—Bank, PSU Bank, Private Bank, Financial Services, Broader Market, Services Sector and Fixed Income—using three established models: Diagonal BEKK (1995), Dynamic Conditional Correlation (DCC GARCH (2002)) and network model. In analyses of financial time series data, the COVID-19 pandemic has been widely regarded as a structural break. We may better understand the dynamism and scale of spillover before and during a crisis by dividing the study into two periods: pre-COVID-19 (January 2011–29 December 2019) and during COVID-19 (30 December 2019–20 April 2021). The results of all three models support our hypothesis of statistically significant spillover from balanced funds to chosen indices, with strong persistence and a marked increase in long-term volatility spillover, showing the presence of contagion effects. The findings of this paper can assist fund managers in diversifying their portfolios while also benefiting investors educationally.
Introduction
The COVID-19 pandemic caused an extraordinary economic shock, leading to significant worldwide asset market dislocations. Major world indices fell between 4.1 per cent and 27.3 per cent (Germany’s DAX fell 27.3 per cent, while Shanghai’s Composite remained unaffected with a 4.1 per cent drop), according to Business Today on 13 March 2020. The pandemic’s economic impact was felt in India’s financial markets as well, with the Sensex30 index falling 26 per cent from December to March.
Foreign portfolio investors (FPIs) withdrew funds from emerging economies (EMEs) in a knee-jerk reaction, withdrawing 36,427 CR from Indian equities. The stock market chaos spread to mutual funds (MFs), with net withdrawals of 113548 CR in the three months ended March 2020, showing the presence of contagion effects.
MF have an average Assets Under Management (AAUM) of 32.43 trillion rupees, accounting for 12 per cent of India’s GDP. Balanced funds account for 8 per cent of the market, with portfolios holding a 40–60 equity-to-debt ratio. According to the ACE MF Database, these funds saw the effects of the pandemic, with net outflows of 37,205 CR from the hybrid category.
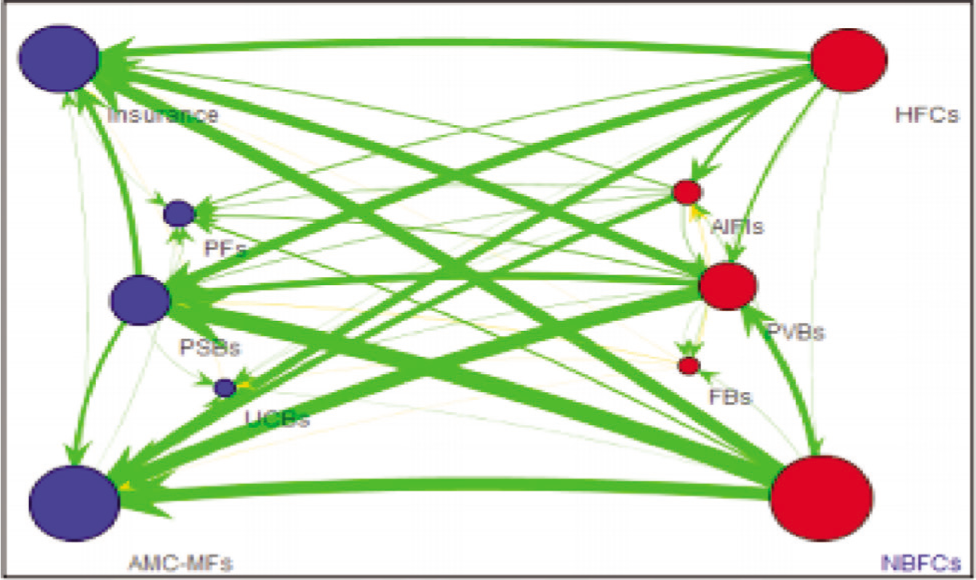
In its latest financial stability report, dated 11 January, 2021, the Reserve Bank of India (RBI) expressed concern over the risk transmission role of balanced MFs. Balanced funds’ simultaneous holdings in debt and equity exposures of financial system participants allow risk to be transmitted from equity markets to debt markets and vice versa. Figure 1 depicts a holistic picture of the financial system’s interconnectedness. In terms of inter-sectoral exposures, the largest fund providers in the system were AMC-MFs (Asset Management Company-Mutual Fund), followed by insurance companies, while the largest fund receivers were NBFCs, followed by HFCs. Such selloffs can operate as transmitters of asset market shocks across the financial system due to the linked structure of participants.
While financial contagion studies are a critical component of portfolio finance, previous research has mostly focused on the analysis of links across various financial markets (Akhtaruzzaman et al., 2021; Baur G., 2012; Connolly & Wang, 2003; Henry, 2000; Kim & Rogers 1995; Sariannidis et al. 2010; Wasim et al., 2013). When financial institutions are under pressure to liquidate assets at severely discounted prices, contagion effects through indirect MFs may emerge (Shleifer & Vishny, 2011). MFs have been researched as a channel of financial contagion on a global and EME scale, with the common finding that push factors from advanced markets expose developing economies to sudden drops and surges (Claessens & Forbes, 2001; Grabel, 2003; Moser, 2003; Pritsker, 2001; Puy, 2016). Until now, the significance of MFs in contagion has been largely overlooked in Indian research.
To address this research gap, we analyse volatility transmission from balanced funds to selected Indian indices. Our research is by far the first to look into contagion effects via MFs. The findings show significant volatility spillover persistence and a significant increase in long-term volatility transmission, confirming the presence of contagion effects.
Literature Survey
Contagion, according to the literature, is defined as the transmission of shocks between markets (including groups of markets), institutions or countries that is difficult to explain using fundamental channels. As a result, spillover or volatility transmission plays a significant influence in important economic decisions. The term ‘contagion’ originated in the medical area in the 1990s, and it was later incorporated to the financial vernacular during the Asian economic crisis of 1997.
King and Wadhwani (1990) came up with the first ever evidence on financial contagion; the study emphasized on significant rise in correlation between returns on different assets during the flash crash of October 1987. Eichengreen et al. (1995) utilized probability-based model on selected economic indicators of 22 countries over a period of more than two decades, while Calvo et al. (1996) investigated the effect of contagion on bond and stock market by employing Principal Component Analysis (PCA). Baig and Goldfajn (1998) used Vector Auto Regression (VAR) analysis for shock transmission in five Asian peers during the crisis of 1997. A series of crisis between 1998 and 2002 brought researchers’ attention to the concept of contagion as they began to examine how a contagion spread. The word ‘interdependence’ was used by Forbes and Rigobon (2002) for enhanced co-movements between markets of two nations, and their study highlighted positive benefits of shock transmission. In the recent past, fthw ollowing tests for investigation of contagion have been utilized, as illustrated in Table 1.
Toolkit for Investigation of Financial Contagion as Per Past Literature.
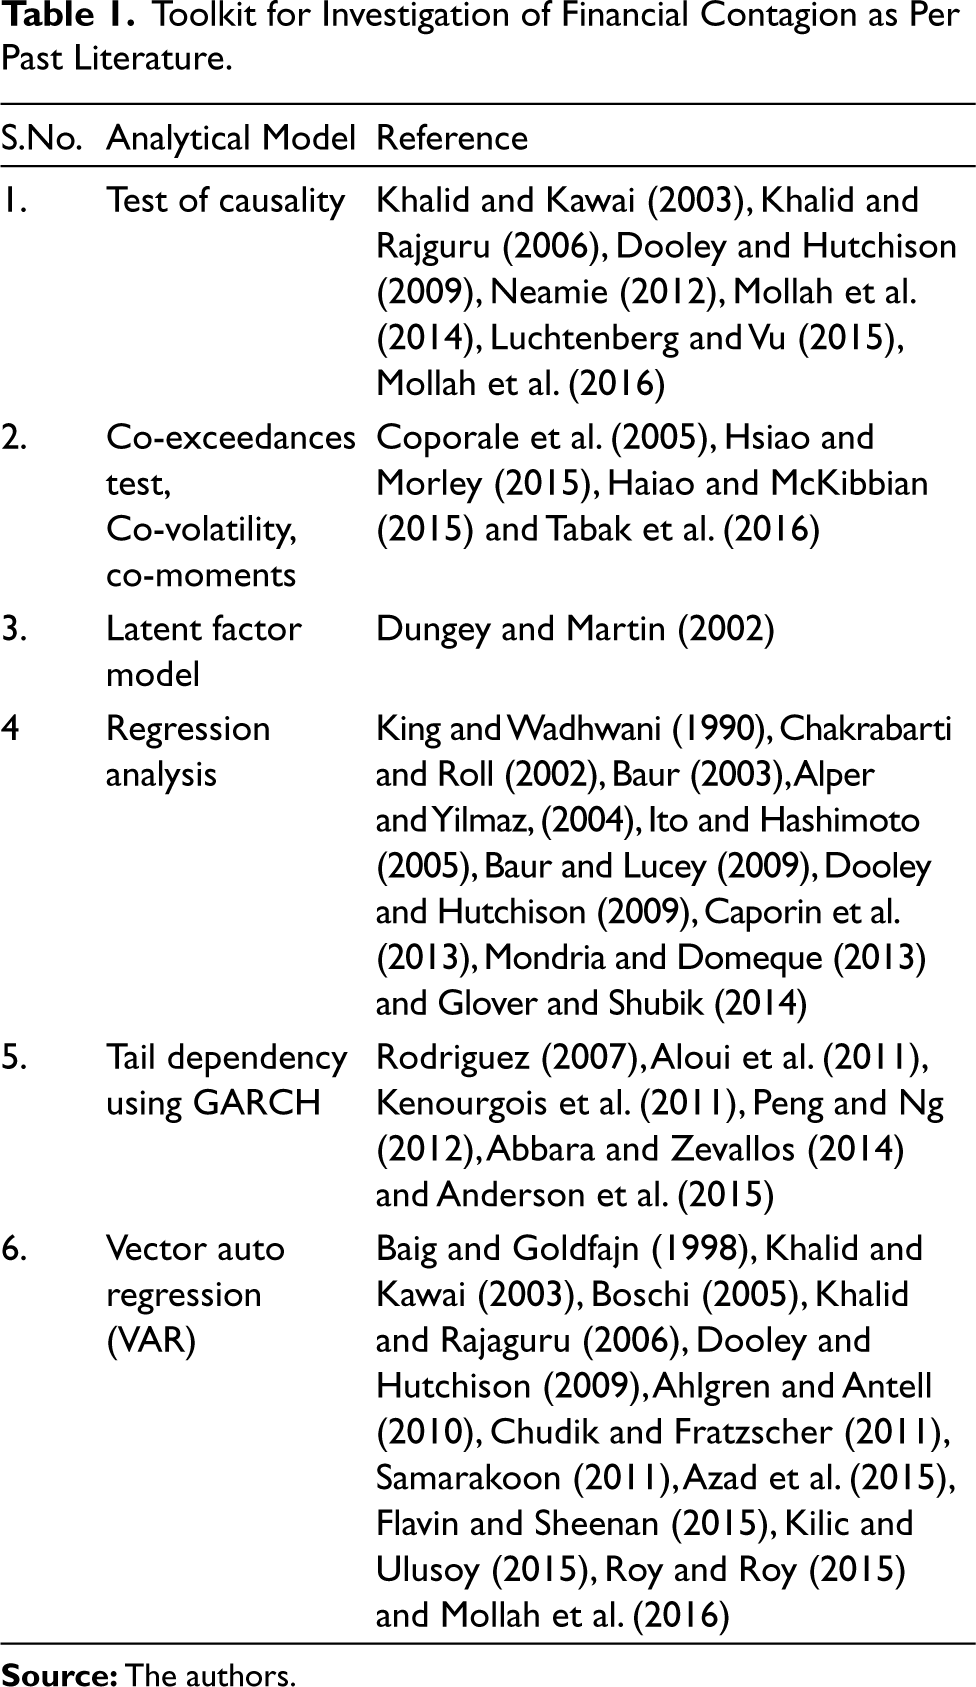
Other models used in contagion studies include Event study, Dummy variable approach, Flight-to-Quantity, Flight-to-Quality, Heterogeneous Auto Regressive Distributed Lag (HAR-DL), Johansen’s Co-Integration, VECM, Impulse response, Variance Decomposition Wavelet Analysis, Network Analysis, Hawkes Jump Diffusion Model and others. Various ARCH/GARCH frameworks, including both univariate and multivariate GARCH: Diagonal VECH, Diagonal BEKK, Constant Conditional Correlation, Dynamic Conditional Correlation (DCC), Asymmetric DCC, AGDCC and Time-Varying Dynamic Conditional Correlation (TDCC) with Student t-distribution, have been used in recent studies.Out of all the ARCH/GARCH framework models, the DCC-GARCH model has been used in a number of studies since the turn of the century, both in mature and emerging markets. Intermarket correlations soared during various crisis periods, drawing attention to emerging markets (Ahmad et al., 2014; Bekaert & Harvey, 1995; Bellalah, 2016; Cappiello et al., 2006; Chen et al., 2002; Chiang et al., 2007; Dajcman, 2012; Dooley & Hutchison, 2009; Ghorbel & Boujelbene, 2013; Goetzmann & Rouwenhorst, 2001; Guesmi et al., 2013; Güloğlu et al., 2016; Hwang, 2014; Hwang et al., 2013; Rodriguez & Mollick, 2020; Kiss & Schuszter, 2015; Trabelsi & Hmida, 2018; Yang, 2005). With the exception of a few studies, interdependence and contagion effects between the United States and the BRICS countries have been reported during the subprime crisis period (Ahmad et al., 2014; Aloui et al., 2011; Chittedi, 2015; Dooley & Hutchison, 2009; Dua & Tuteja, 2016; Rajwani & Kumar, 2016; Samarakoon, 2011; Yiu et al., 2010). Several comprehensive studies employing multivariate DCC-GARCH have been undertaken since then, covering not only the influence of the US Subprime and Eurozone crises but also the Asian financial crisis on cross-country disequilibrium (Choe et al., 2012; de Angelis & Gardini, 2015; Kenourgios & Padhi, 2012). Mitra and Iyer (2016) used a bi-variate EGARCH model to study the transmission of volatility across 11 major stock markets in the Asia-Pacific area over a 20-year period. With mounting concern about the banking sector’s stability, DCC-GARCH is being used more widely in studies on volatility and contagion spread in the banking and insurance industries (Agrawal & Sehgal, 2018; Chakroun & Gallali, 2021, Denkowska and Wanat, 2020; Rahman, 2013; Wang et al., 2020).
Innovations in financial instruments, as well as growing global economic interconnectedness, have boosted research efforts into analysing exchange rate dynamics under various regimes. A number of studies have been conducted to assess directional volatility spillover among asset market returns using the GARCH framework in general and DCC-GARCH in particular (Antonakakis et al., 2020; 2019; Eraslan, 2017; Kumar et al., 2017; Roy & Sinha, 2017). Akyildirim et al. (2020) investigated the relationship between implied volatility in US and European financial markets, as well as price volatility in a variety of crypto currencies. Martin and Nguyen (2015) published a stand-alone study that can be used to research the influence of the financial crisis on hedge fund style categories. Based on the findings of the aforementioned studies, it can be concluded that the use of contemporary volatility models in general, and the DCC model under the GARCH (1,1) framework in particular, has piqued the interest of the research community in studying intra- and inter-market correlations, as well as detecting contagion spread. As a result, we used the Dynamic Conditional Correlation (DCC–GARCH) model to investigate the behaviour of time-varying correlations between sample variables in this research.
To the best of our knowledge, this is the first study to look into shock transmission among non-banking finance institutions like MFs, with the goal of understanding how volatility from MFs spreads to other parts of the financial markets.
Data and Methodology
Data
Daily dividend-unadjusted closing price data of selected Indian indexes—NIFTY 200 TRI, BANK NIFTY, NIFTY FINANCE, NIFTY PSU Bank, NIFTY PVT Bank, NIFTY SERVICE Sector, category average of balanced funds and CRISIL Composite Bond Fund Index—are included in our dataset.
Indian balanced funds’ representative returns are calculated as the category average of all 67 schemes. The benchmark indexes for two asset classes (equity and debt) are the NIFTY 200 Total Return Index (TRI) and CRISIL Composite Bond Fund Index. The study has been conducted over a 10-year period, from January 2011 to April 2021. The COVID-19 pandemic manifested itself in all financial asset price series as a structural break
1
. As a result, we subdivided the study’s time period into two periods:
Pre-COVID-19 (January 2011–29 December 2019) During COVID-19 (30 December 2019–April 2021)
Though the first case of COVID-19 in India was reported in late January 2020, we consider the period from 30 December 2019 to April 2021 to be the crisis period, as this is when WHO’s country office in the People’s Republic of China became cognizant of a cluster of pneumonia cases of unknown cause in Wuhan, China. This allows us to assess the impact of a pandemic break-out on asset returns over time. The multi-dimensional character of the financial contagion concept precludes inference from a single indicator of shock transmission. We utilize DCC bivariate generalized auto-regressive conditional heteroskedasticity (GARCH) model of Engle (2002) and Diagonal BEKK Model (Engle & Kroner, 1995).
In the past, network analysis has been used to investigate balance-sheet contagion, interconnectedness and shock transmission in financial networks (Getmansky et al., 2015; Gunduz & Kaya, 2014; Kaushik & Battison, 2013; Peltonen et al., 2014; Puliga et al., 2014). These studies mostly focused on correlation-based financial network analysis and were limited in their ability to address the direction of spillover. Diebold and Yilmaz (2014, 2016), Ballester et al. (2016), Yao et al. (2020) and Dungey et al. (2019) conducted direction-based interconnected studies. We use a technique called ring-shaped directed network analysis to investigate the inter-connectedness and shock-transmission role of balanced funds in Indian financial markets.
All data for the variables stated earlier comes from the ACE MF database in India, which is dedicated to MF research. Because the data is free of survivorship bias, it was chosen as the study’s major source of data. During the days of data unavailability owing to national holidays, bank holidays or non-trading days, prices were calculated on basis of logical expression as values occur in the data series.
Methodology
A. Diagonal BEKK Model (Baba et al., 1995)
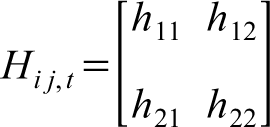
The GARCH (1,1) model with BEKK representation is used to examine the volatility spillover from balanced funds to chosen financial market indexes. The model, which is an extension of Bollerslev’s GARCH, allows for interaction between conditional variance and covariance, while the BEKK process allows for the analysis of volatility transmission between two variables. The model also necessitates the estimation of fewer parameters. The covariance matrix for a bivariate GARCH model is as under:
The BEKK model for the above setting is as follows:

Given,
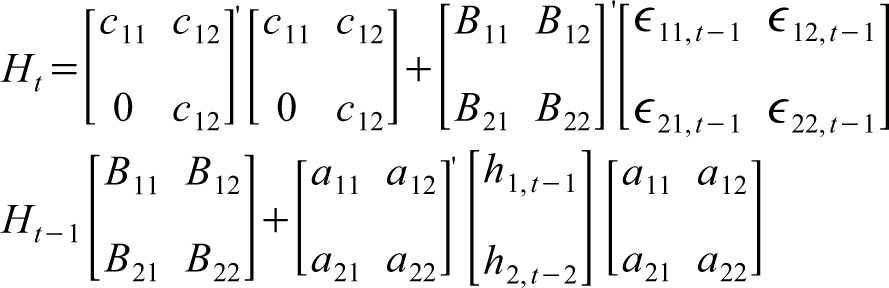
Where, A is the ARCH effect coefficient matrix, it examines ARCH effects from the past to the present conditional variances (degree of innovation from market I to market j). Matrix B investigates the GARCH effect from the past to the present conditional variances (persistence in conditional volatility between market I and market j) and C is the parameter matrix. In this approach, the BEKK formula aids in the detection of volatility transmission from one market to the next (Engle & Kroner, 1995). The model satisfies the positive definiteness constraint for the conditional covariance matrix, which is required to estimate quadratic conditional variance in non-negative form.
In the model, the A and B matrices are diagonal matrices. As a result, off-diagonal elements are equivalent to zero. Conditional variances are determined by their previous values (t–1) and also their squared residual from the past. Previous residuals, as well as the cross-product of past residuals, influence conditional co-variance. The assumption that financial return series follow a multi-variate normal distribution with fat tails is prominent in the literature. Positive and negative news shocks are transmitted differently across conditional quartiles of the return’s distribution (Tripathi, 2020). The student’s t-distribution has a better ability to detect these financial time series characteristics, hence it’s employed to develop the GARCH model in a multivariate scenario. For the model, the log likelihood function is as follows:
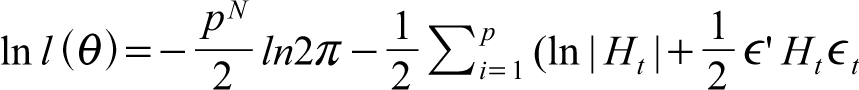
Given,
Θ is the unknown parameter in the model, N is number of markets in this two-market model, N=2 and P represents observations count.
B. DCC-GARCH Model of Engle (2002)
Engle (2002) proposed the multi-variate generalised autoregressive conditional heteroskedasticity (GARCH) model for estimating DCC. In comparison to alternative estimation methods, the model has the following key advantages.
The model auto accounts for heteroskedasticity by estimating the unconditional correlation between standardized residuals.
Without adding bulk to the parameters, the model can be seamlessly used in multivariate setting, making it fit to investigate the time varying behaviour multiple asset returns.
The model accurately represents the time-varying, non-mean reverting and fat-tailed characteristics of financial time series, making it a useful tool for analysing events and crisis conditions that lend time-varying correlation characteristic to financial asset returns.
The multivariate DCC-GARCH model is used to test the co-movement and volatility transmission from Indian balanced funds (represented by Category Average NAV) to selected financial market indices. We assume that daily log returns from k series are multivariate and normally distributed with zero mean, as suggested by Bollerslev et al. (1992) and Engle (2002). Ht is a conditional variance-covariance matrix that looks like this:
Where, 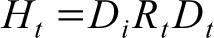
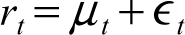
Each asset in the sample has following mean equation:
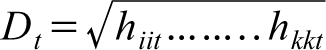
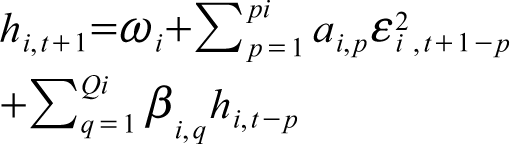
Given that hiit represents each asset’s conditional variance and is assumed to follow a univariate GARCH (p,q) process given by the expression below:
Each innovation for asset’s zero-means returns are then standardized using these univariate variance estimates. The standardized innovations from step 1 are assumed to follow multi-variate GARCH (m,n) process. The time-varying correlation matrix Rt can be described as follows:
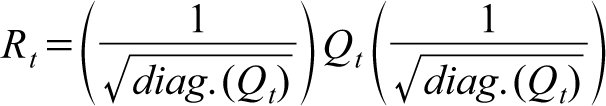
Where, Qt refers to a (k x k) symmetric and positive definite matrix, with
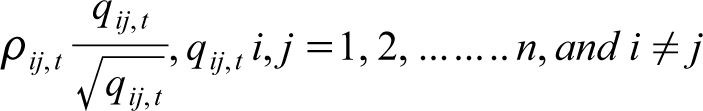
The conditional correlation coefficient ρij between two assets, i and j, is expressed as:
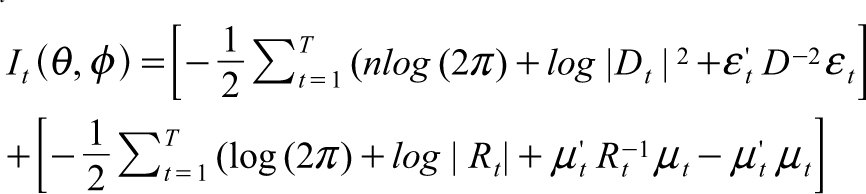
The DCC-GARCH model is then estimated by using the aforementitoned process with maximum log-likelihood criteria. Let θ be parameters in Dt and ϕ the parameters in Rt, then log-likelihood function is given as:
C. Directed Network Model
All kinds of systems can be represented by a network, which is just a collection of connected points. For example, the World Wide Web (www) is a massive network, with links acting as edges and pages acting as nodes. When trying to represent systems like a social network or a financial system, it’s easy to see how a simple network model is limited by undirected edges. The specific network model utilized in our study is Forced Directed Graph, with the edges of the model determined by the volatility spillover between two nodes. ‘Out-Degree’ weights define the size of nodes. This means that as the strength of out-degree/influence exerted on the network increases, so does the volume of the nodes. The volatility network graphs are shared under Section IV.
Empirical Analysis and Findings
Figure 2 shows time series graphs of natural logarithmic asset returns for several variables under study in panels A and B. The ARCH effect, and hence volatility clustering, can also be seen graphically in the time series graphs in Figure 1. Under all variables except CAT AVG and PSU, periods of high volatility are followed by periods of higher volatility, and periods of low volatility are followed by periods of lower volatility. This strengthens the case for using time-varying conditional correlation to model the dataset’s volatility.
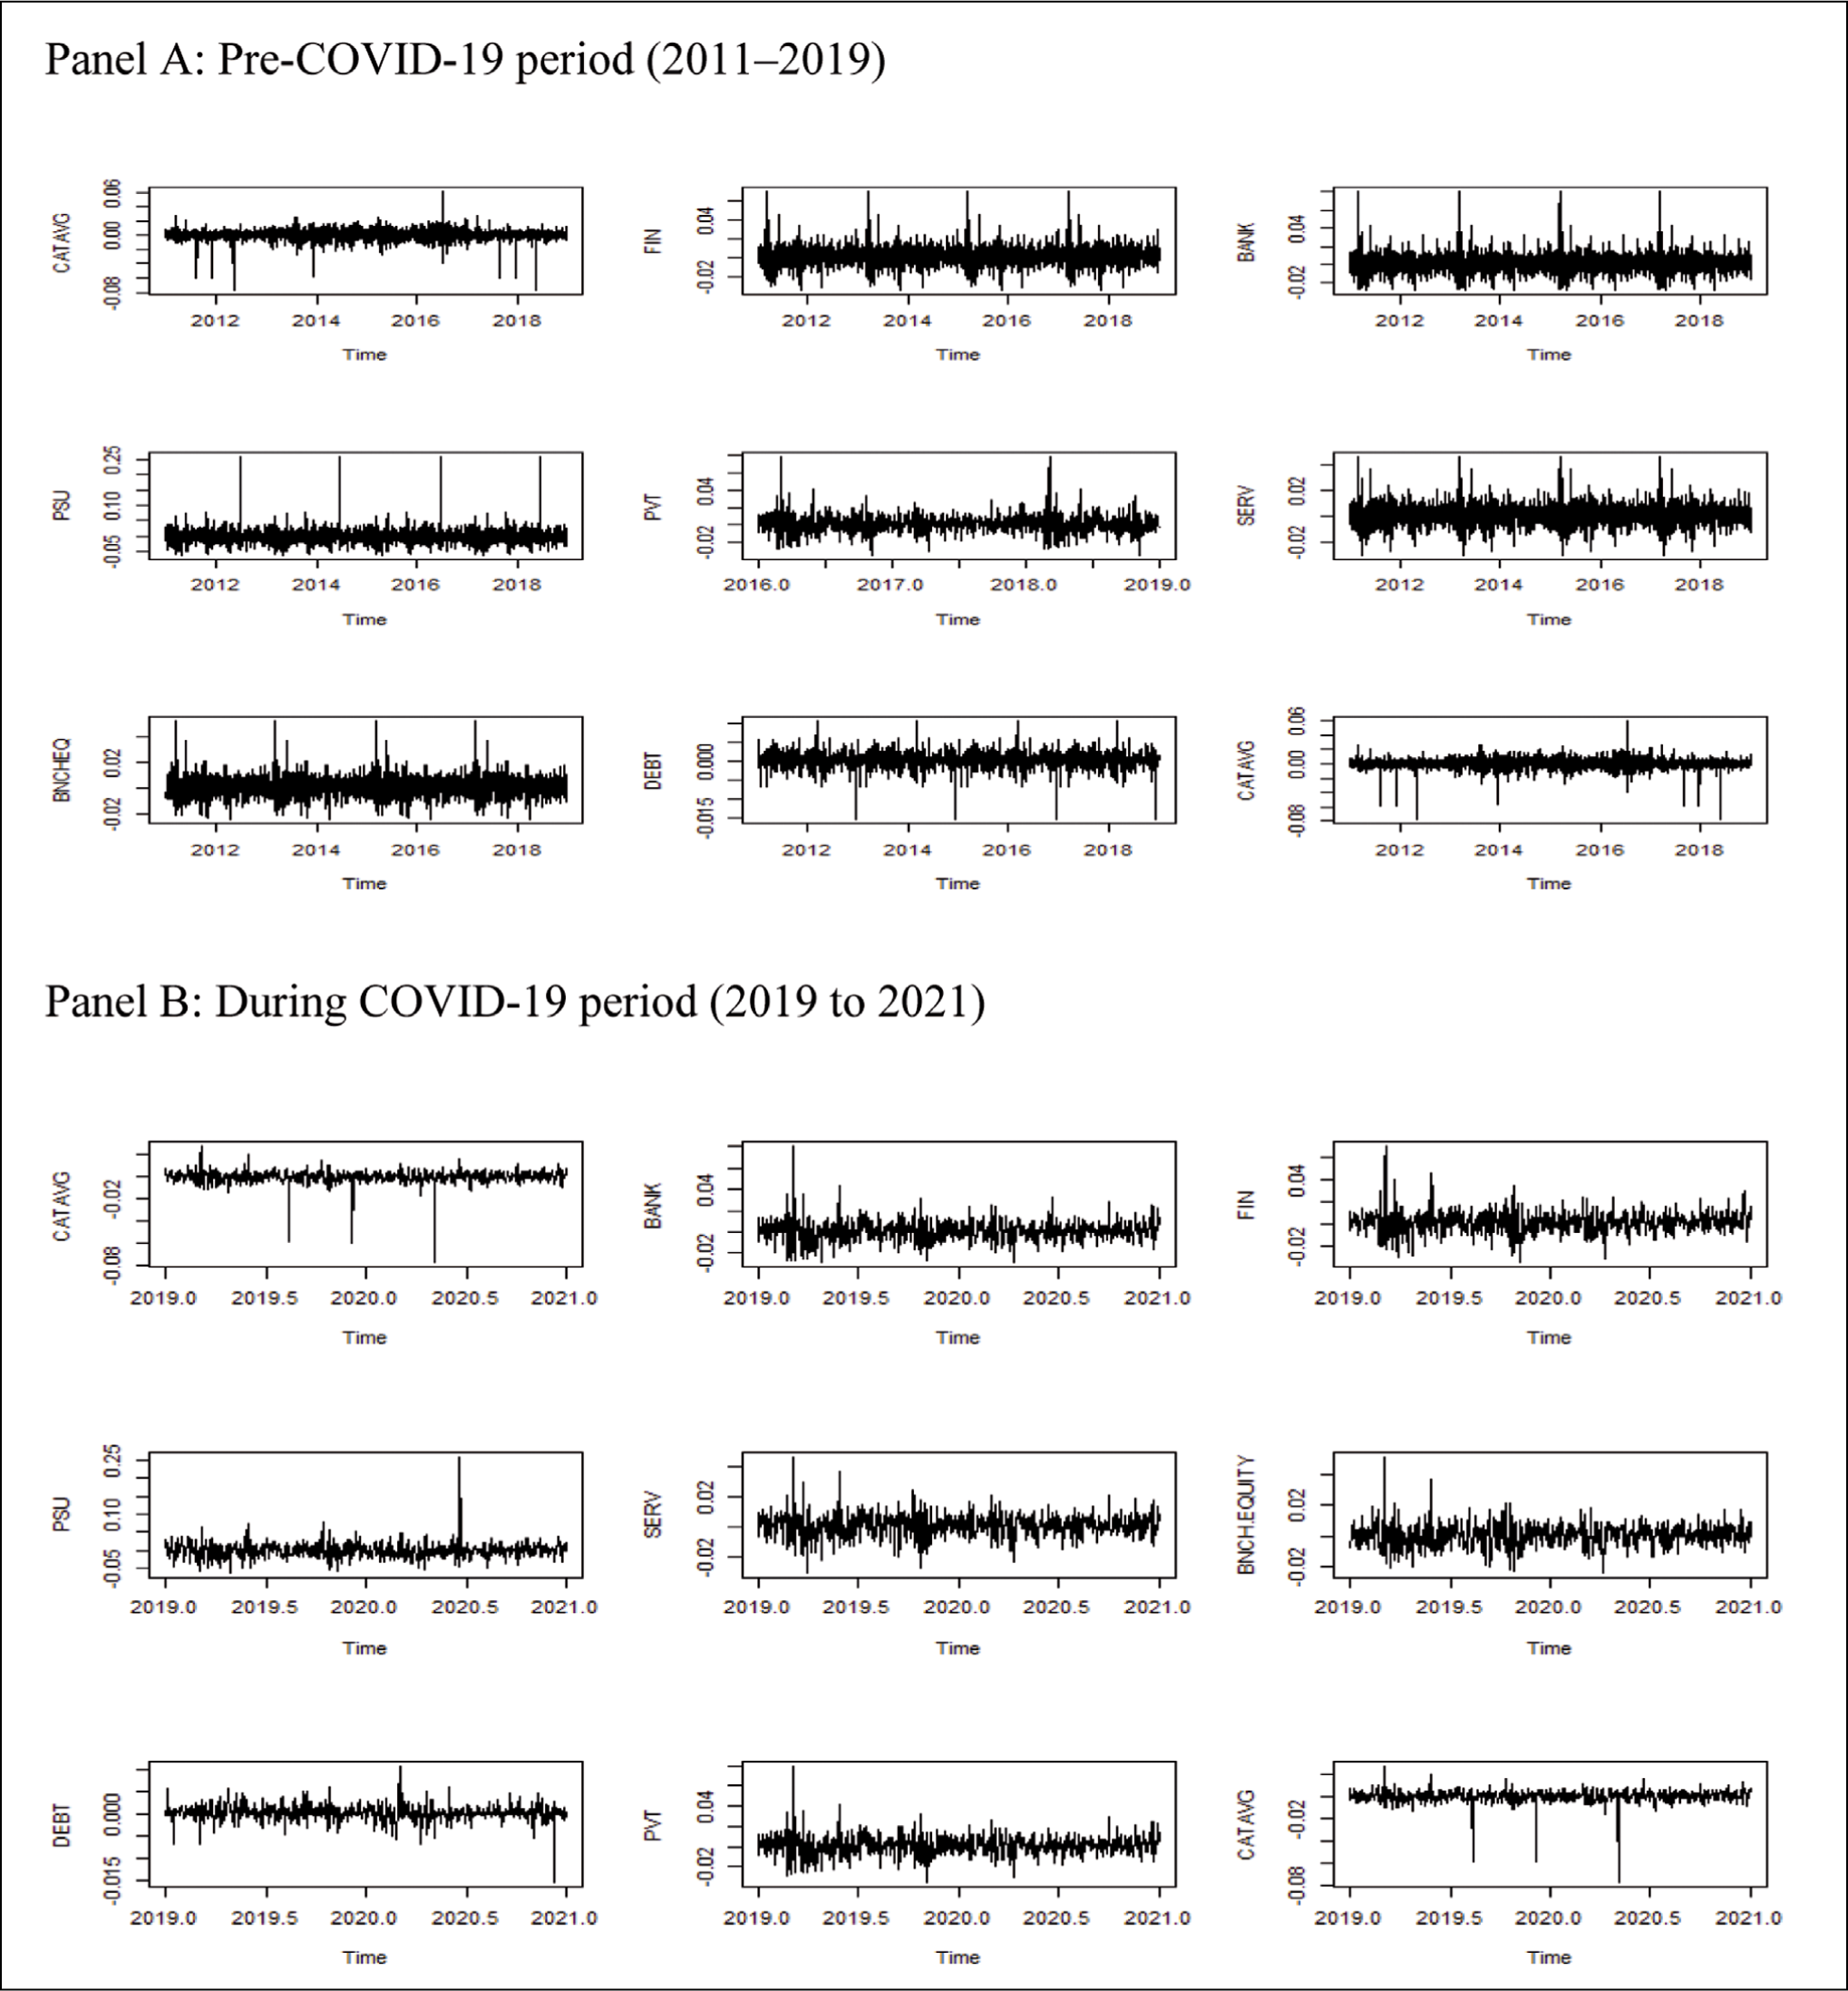
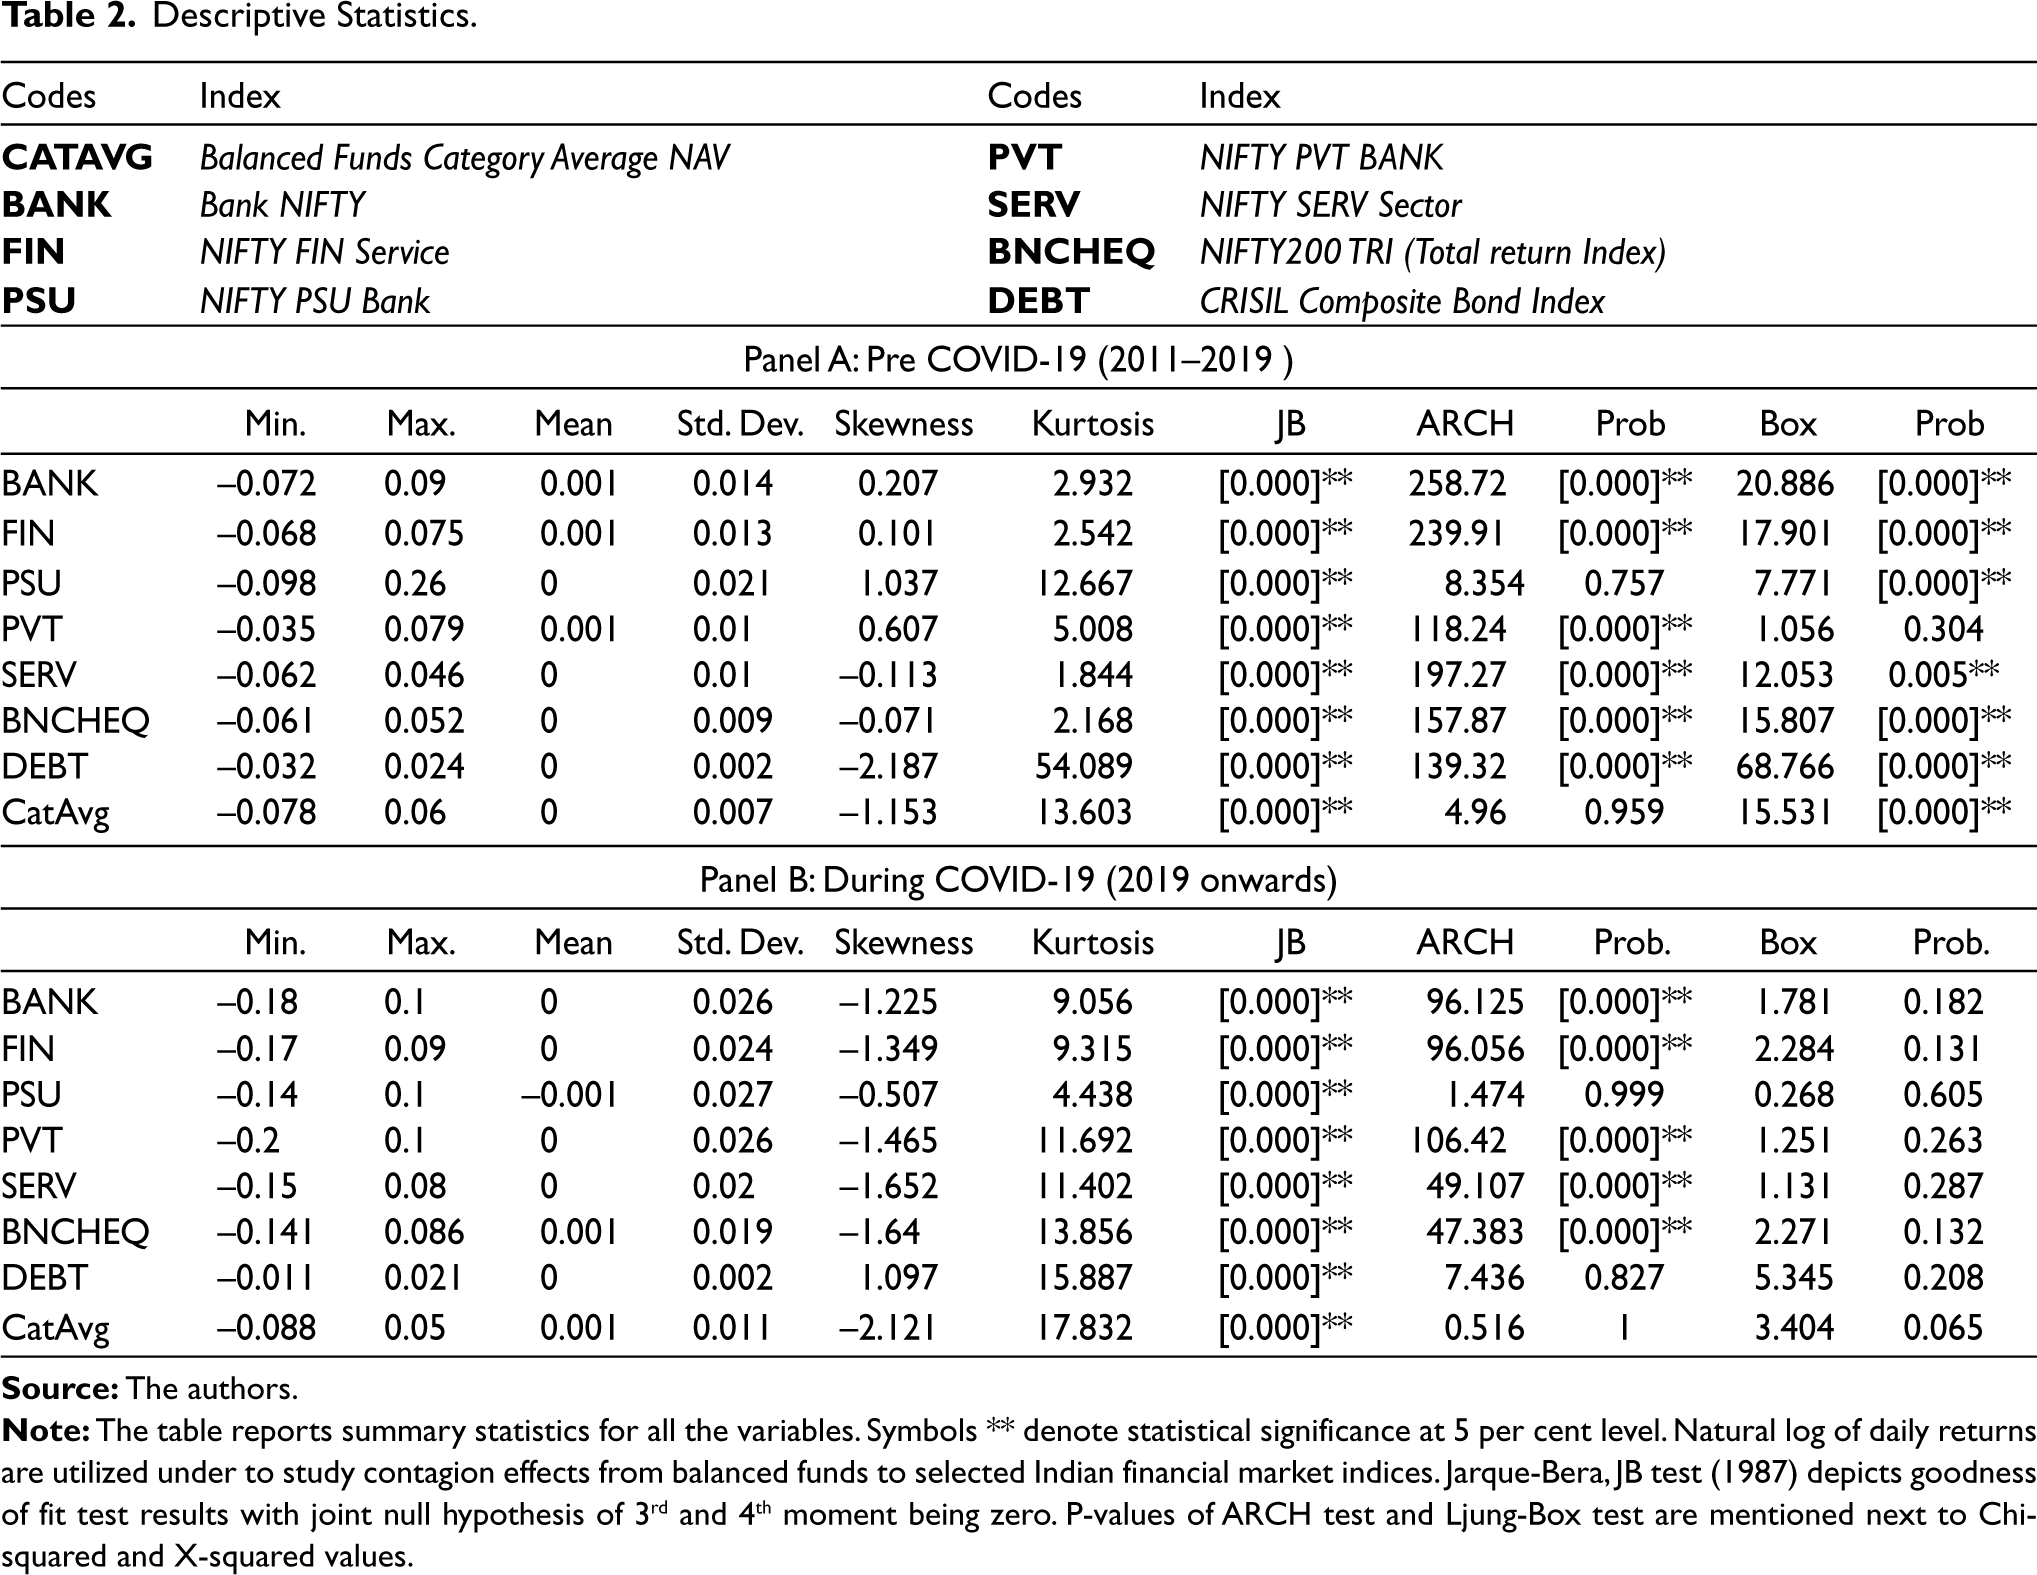
We utilise the natural log of all the variables’ daily returns. Returns are higher on average during the pre-crisis period, according to a comparison of the first three moments between sub-periods. During the crisis, the standard deviation, as a risk metric, increased significantly. The NIFTY PSU BANK Index has the highest standard deviation in Panel A, while the Composite Bond Index has the lowest standard deviation in both panels. During the crisis, kurtosis values are much higher, showing a fat-tailed distribution, which is typical of financial asset prices. At a 5 per cent level of significance, the ARCH-LM test values are significant, suggesting the presence of ARCH effects.
Descriptive Statistics.
Diagonal-BEKK Model
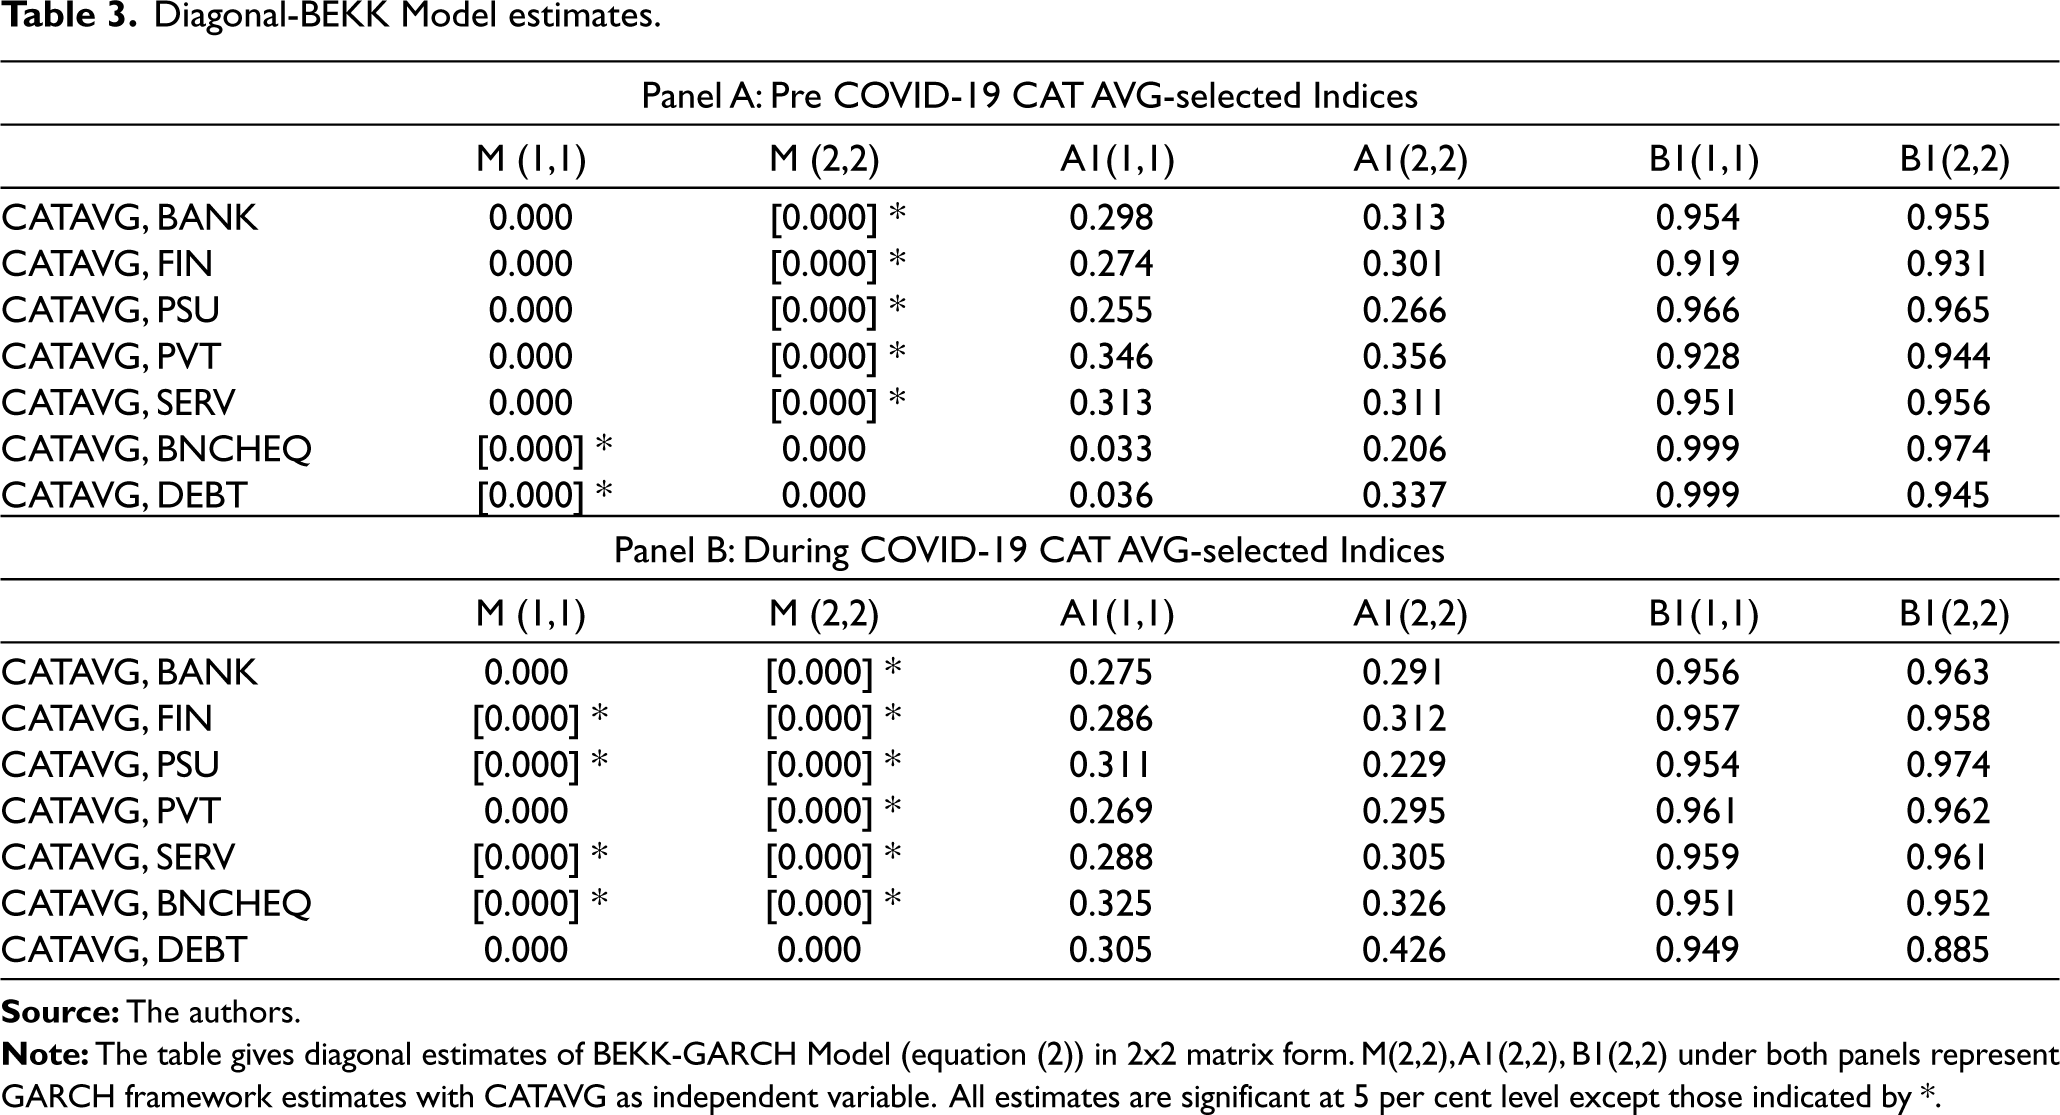
The aforementioned conditional variance coefficients represent bi-directional volatility spillover. In shocks, all of the examined indices show statistically significant covariation, which is driven by lags rather than past errors. For all variables, own volatility spillovers (A1 coefficients and ARCH effects) are positive and significant. These coefficients indicate how each variable’s volatility persists in terms of its own past errors, with DEBT having the highest volatility persistence. Cross-volatility results exhibit that past CATAVG innovations have a statistically significant impact on future volatility of all selected indices. When comparing pairwise, we see an increase in volatility spillover from CATAVG to all sectoral indices (0.5–3.5) per cent, whereas volatility spillover from broader indices (BNCHEQ, DEBT) is marginally lower (0.952 and 0.885). Though there was a minor decrease in volatility spillover from CAT AVG to DEBT (0.885, 6 per cent) during the crisis, the hypothesis of likely risk transfer between asset classes through balanced funds remains valid as B1 (2,2) coefficients are statistically significant.
Diagonal-BEKK Model estimates.
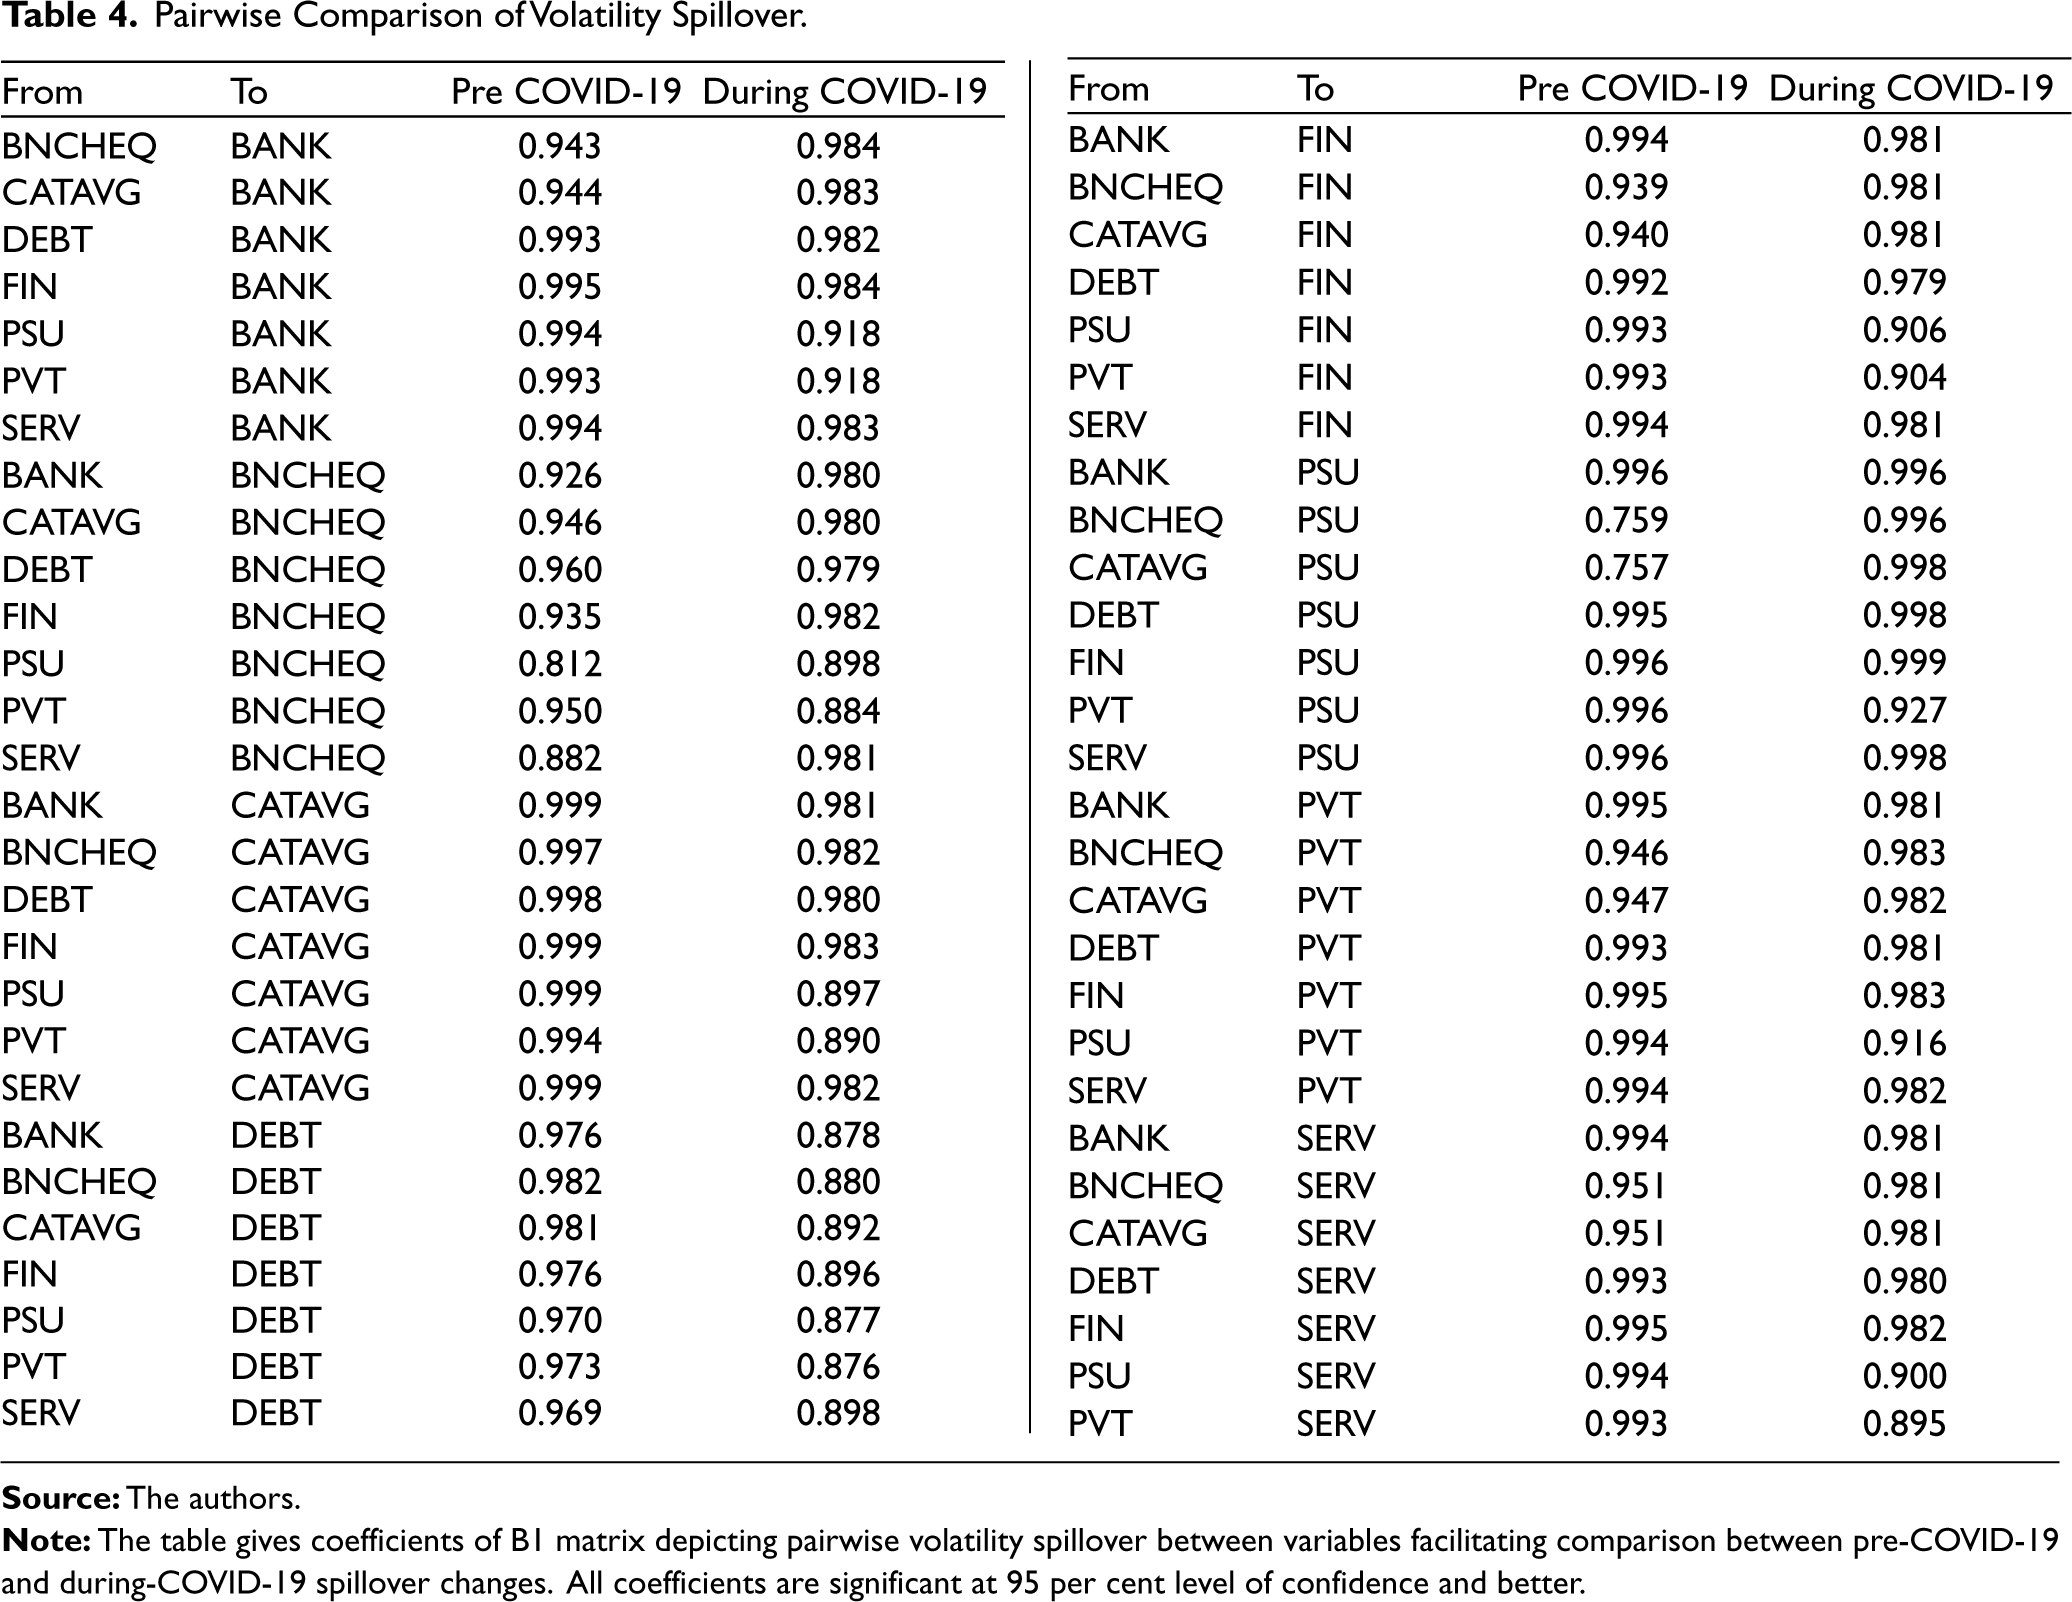
Both index-specific and cross-index volatility spillover effects are included in the BEKK model. The log-likelihood values support the rejection of the null hypothesis and are significant at 95 per cent confidence. Also, a greater log likelihood for multivariate GARCH implies that it is appropriate for depicting volatility interactions in returns. The pairwise GARCH coefficients of volatility spillover between the variables in an 8x8 matrix are listed in Table 4. GARCH coefficients look at the consistency of return volatility covariance, implying that periods of high volatility tend to be followed by periods of higher volatility on a prolonged basis. As can be seen, all of the coefficients are symmetric, indicating that the spillover between variables is in the same direction. During the pre-COVID-19 period, CATAVG experienced the most volatility spillover, while the maximum impact of volatility spillover shifted to PSU Index during the COVID-19 period (in the range of 0.997–0.999). During the pre-COVID-19 period, CATAVG had the greatest impact on DEBT. During COVID-19, however, volatility spillover from CATAVG to DEBT decreases, with a spillover coefficient of 0.892 remaining statistically significant. During the COVID-19 period, the PSU index is the most affected, as volatility spillover from all indices in the sample rises in the range of 5 per cent to 10 per cent. (0.001–0.240). It is also worth noting that the spillover from CATAVG to the other indices significantly increases during the COVID-19 period, ranging from 3 per cent to 31 per cent (with the highest increase of 31 per cent in the case of CATAVG to PSU), while spillover to CATAVG from the other indices decreases (transmission from PVT to CATAVG declines by 0.104 per cent~10.4 per cent. This further substantiates the contagion effects from CATAVG to selected indices as volatility transmission from CATAVG to all indices except DEBT increases during the COVID-19 period. The time-varying relationship of indices and resulting long-term spillover from CATAVG to all indices is investigated under DCC GARCH Model.
Pairwise Comparison of Volatility Spillover.
DCC-GARCH Model
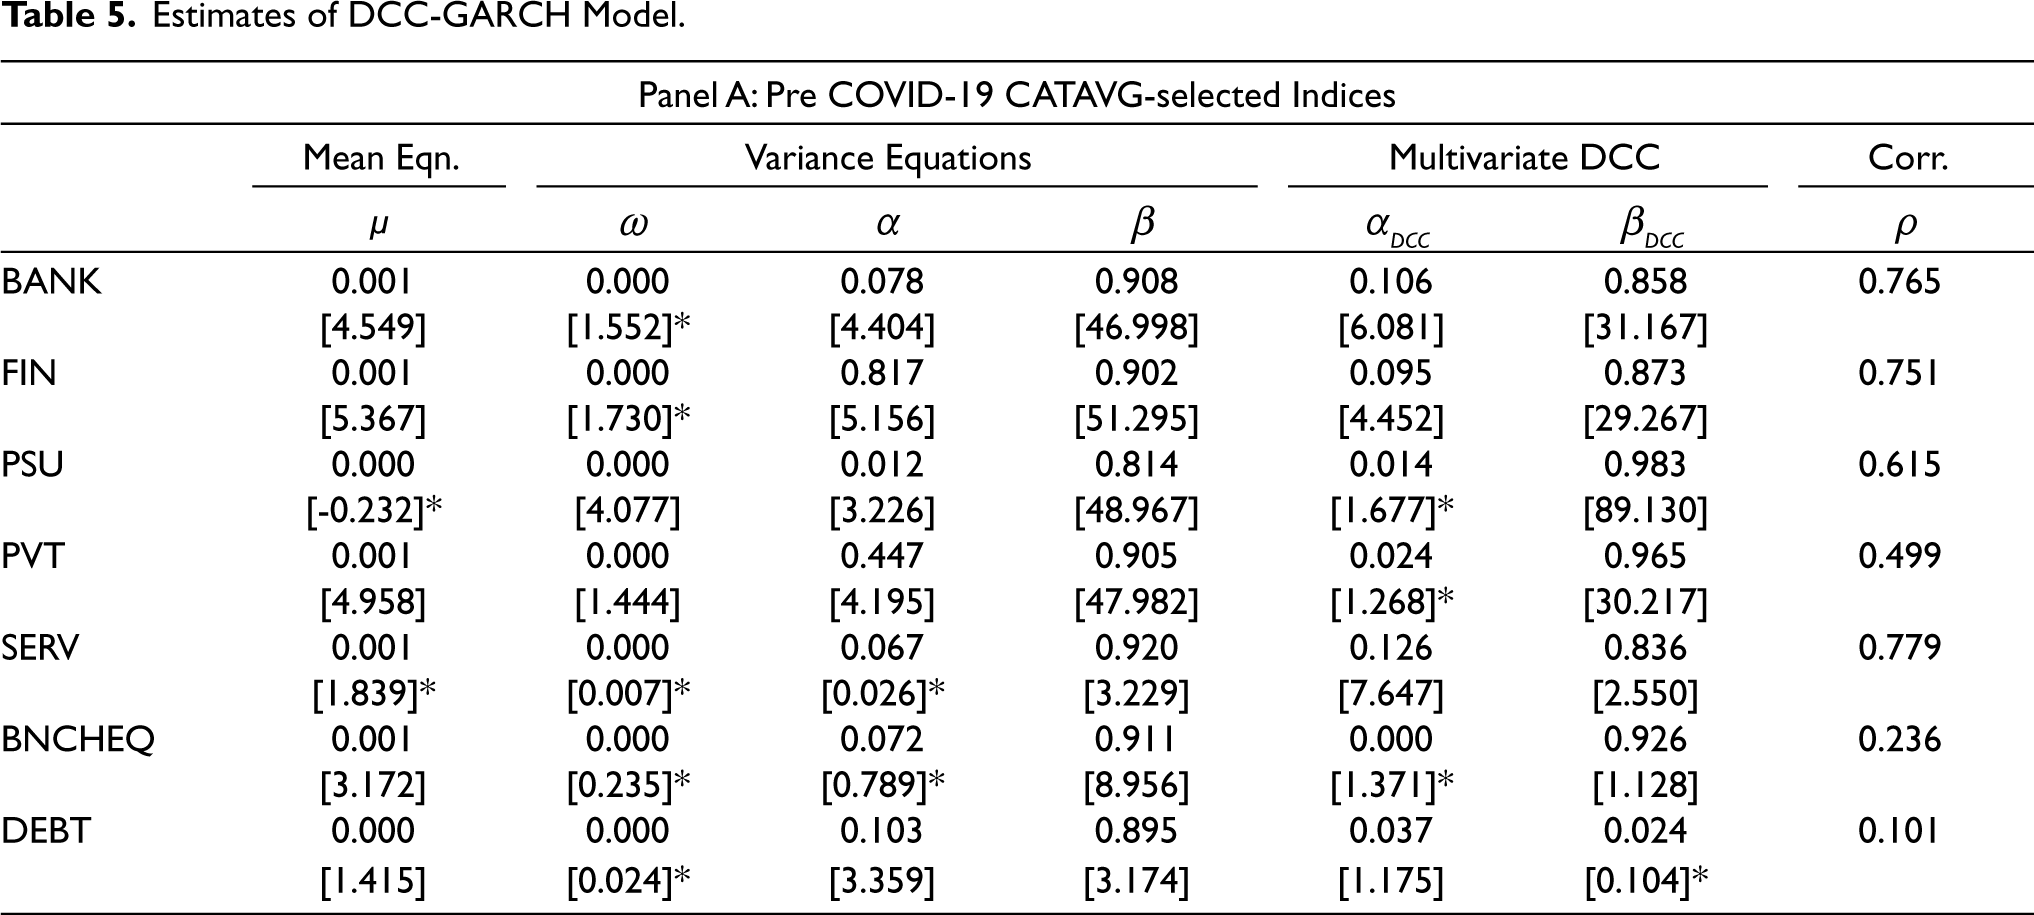
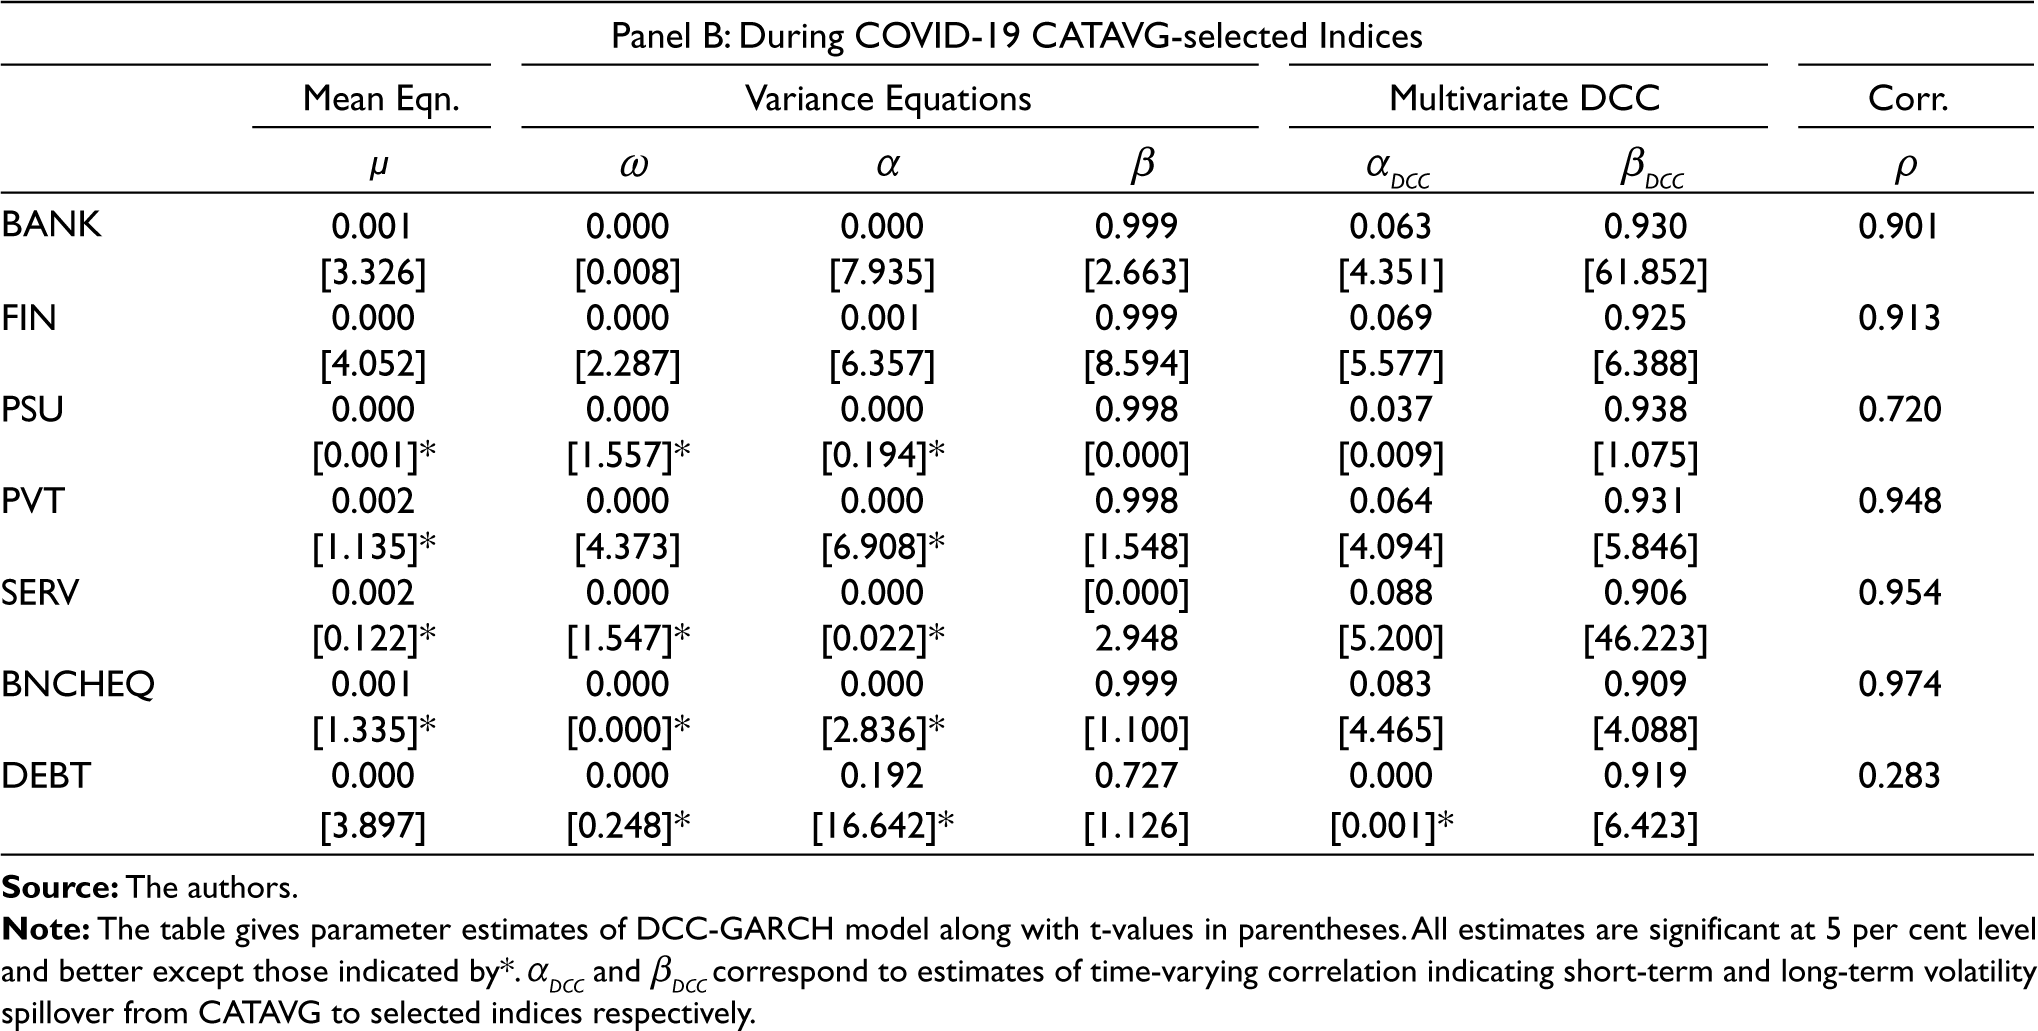
Financial time series exhibit greater correlation during times of crisis, as evidenced by bivariate unconditional correlation values for all variables in Panel B, where the highest rise of 3.18 times (0.974) is observed in CATAVG-BNCHEQ. The presence of statistically significant conditional volatility coefficients from the past (lag 1) in both sub-periods reflect the DCCGARCH (1,1) specification’s efficacy. A significant increase in DCC is assumed to fortify the inter-market transmission mechanism (Collins & Biekpe, 2003; Forbes & Rigobon, 2002; Ahmad et al., 2014). The DCC parameters (αDCC and βDCC ) show considerable persistence with the two-coefficients average increasing from 0.733 pre-COVID-19 to 0.857 during the COVID-19 period, with DEBT contributing the most. βDCC coefficients increase in the range of (0.03–14.08) times across variables, reflecting the long-term influence of contagion effects secondary to pandemic breakout and the resulting convergence of time series of returns. Conditional covariance and correlations graphs for all variables and both sub-periods are shared in Appendix (2–5).
Estimates of DCC-GARCH Model.
We establish volatility spillover network of variables during two sub-periods (pre-COVID and during COVID-19). The off-diagonal parameters A and B, as shown by the Diagonal BEKK Model, are used to compute the volatility spillover relationship among all the study’s measured variables. Two-volatility spillover networks are formed over the sample period, and 56 and 55 linkages are extracted from a total of (n2 – n, n = 8) potential linkages. Figure 3 depicts two networks of volatility spillover. Out-degree, or the number of connections originating at the vertex and pointing outward, is represented by the size of nodes. Figure 3 depicts the time-varying spillover of variable volatility (CATAVG and selected indices). The clear aggregation of volatility spillovers among variables is noticeable. Category Average (representing balanced funds average NAV) has a bi-directional relation with all other nodes. In addition, the category average node has the highest out-degree (spillover) intensity, as seen by the node size.
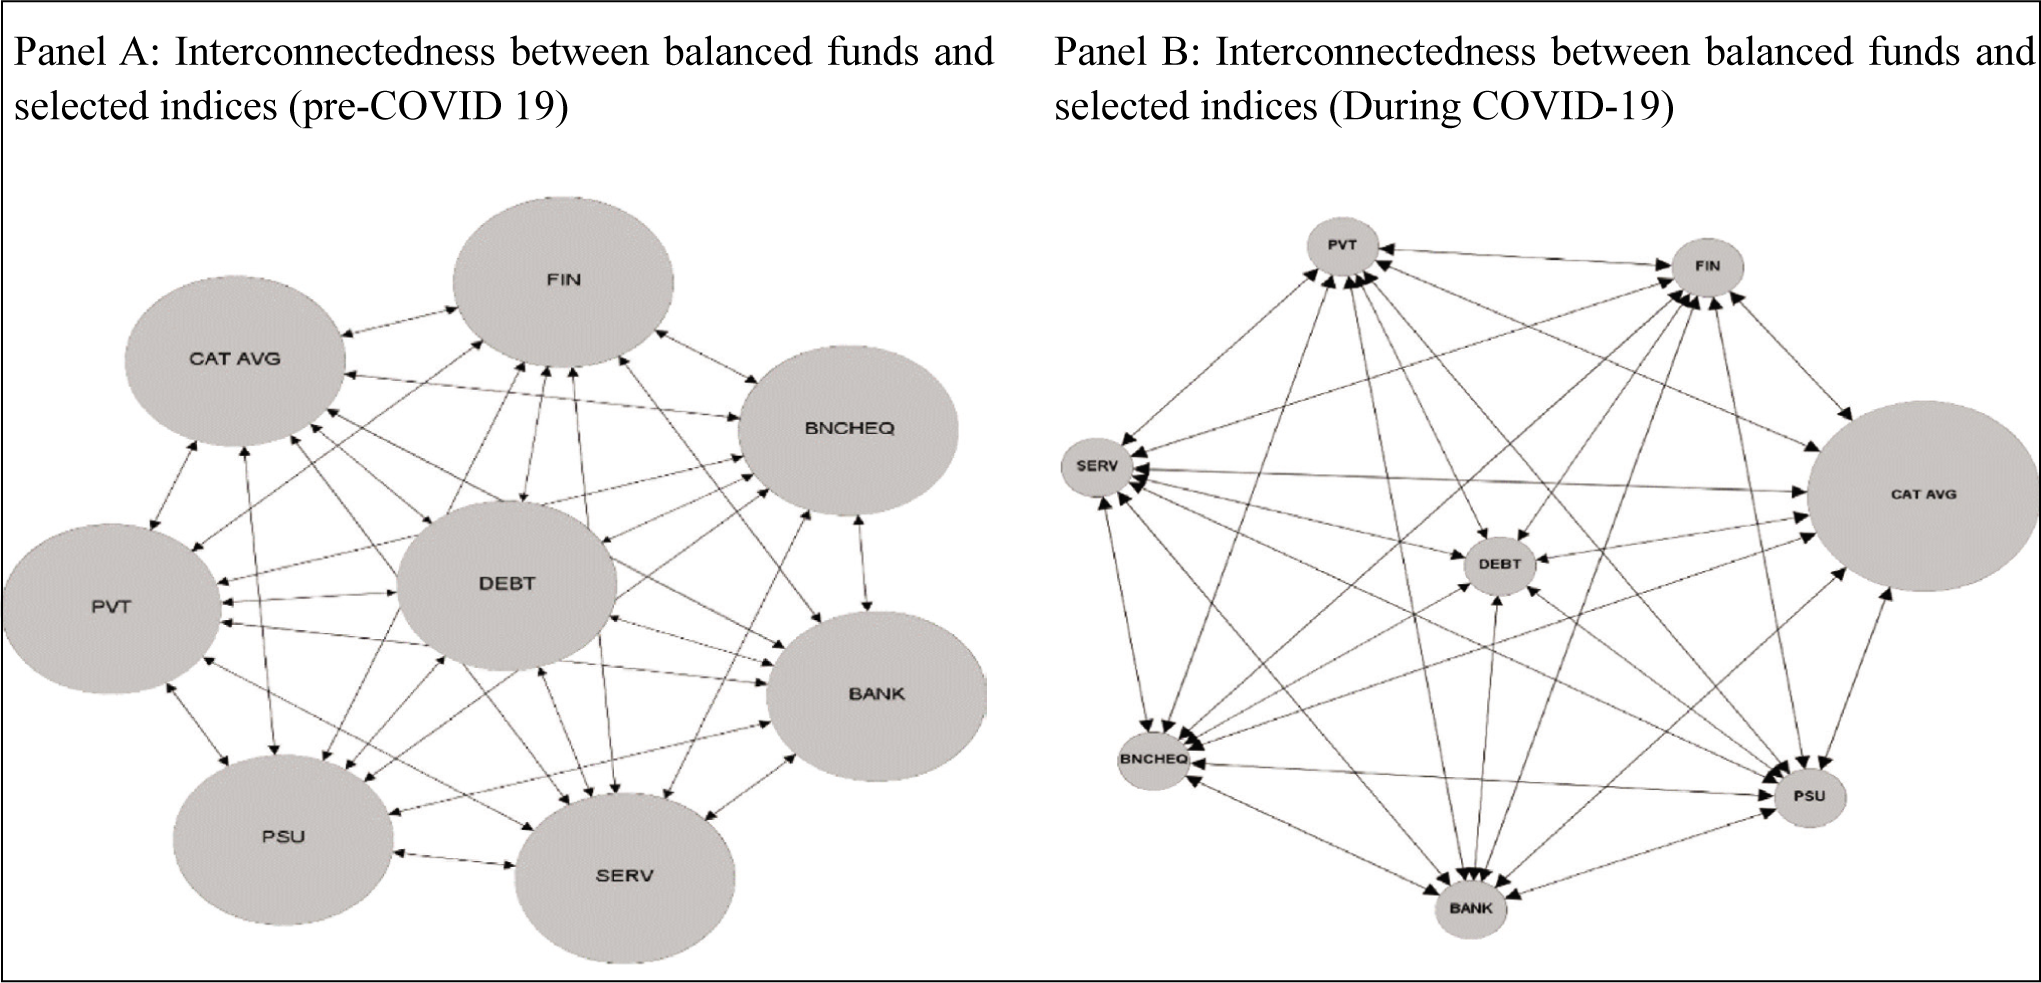
Estimates of DCC-GARCH Model.
Check of Robustness
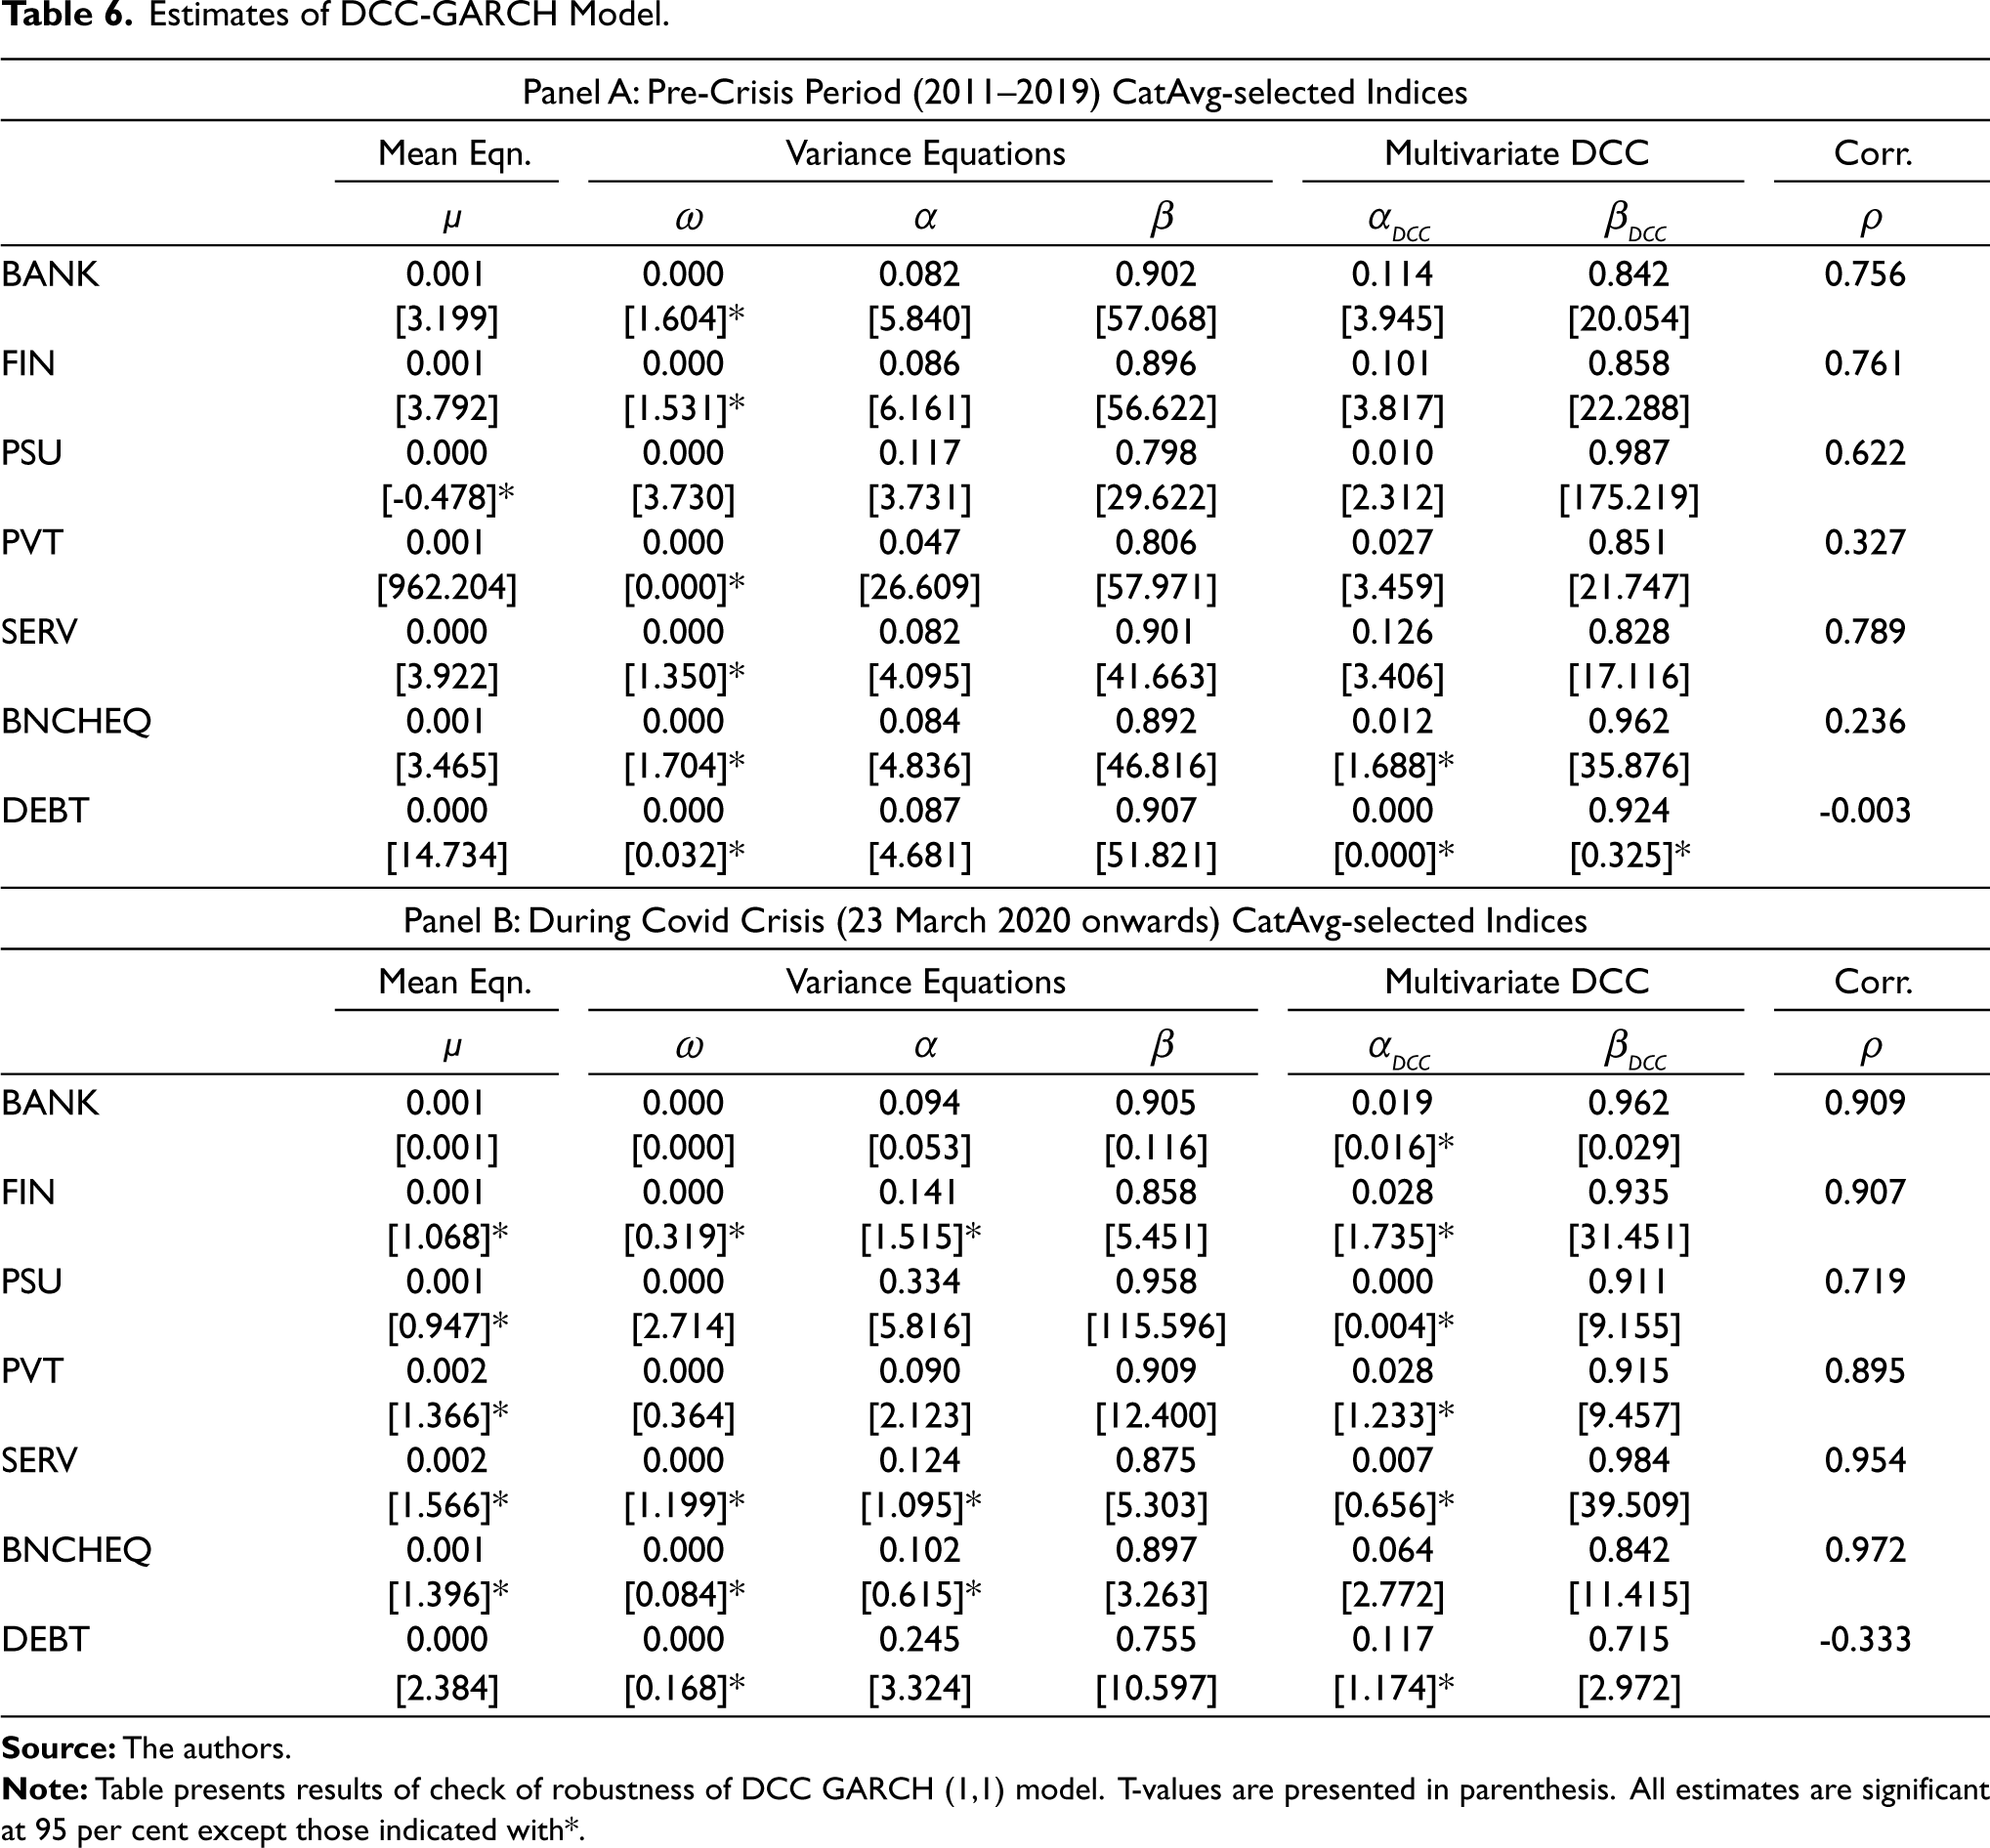
We assess the robustness of the DCC GARCH Model used to estimate the time-varying link between CATAVG and selected indices in this section. The impact of the COVID-19 breakout on Indian equities markets was felt the most on 23 March 2020, when the wider index plunged the most. We run the DCC GARCH model with the following research period break-up:
Pre-COVID-19 (January 2011–22 March 2020) During COVID-19 (23 March 2020–April 2021)
Financial time series exhibit increased correlation during periods of crisis, bivariate unconditional correlation values for all variables under Panel B validate this, and maximum increase of 3.12 times (0.972) is observed in CATAVG-BNCHEQ. The long-term DCC parameters (βDCC) exhibit strong persistence, with average value continuing to be in the range of 0.895 under both sub-periods. The maximum contribution is made by SERV. βDCC coefficients indicating long-term spillover increase for all the sector specific indices in the range of (1.07–1.18) times across variables, verifying the robustness of results obtained under section IV.B. The βDCC coefficients, however, decrease marginally for all broader market indices (BNCHEQ, DEBT), which can also be attributed to the fact that the phase of maximum volatility was over by 23 March 2020 (post which markets witnessed increasing trend). In totality, long-term spillover coefficients continue to be statistically significant, highlighting the robustness of DCC GARCH (1,1) estimation even as we run the analysis considering a new structural break point. 23 March 2020 corresponds to the break point in BANK NIFTY, as calculated under Bai and Perron test (1998)2 for structural break, with augmented Dickey Fuller Statistic minimization criteria.
Conclusion
The research examines the transmission of contagion through an indirect route by examining the influence of balanced funds on selected indexes. Following the identification of the pandemic crisis period (December 2019 onwards), we employ established models of volatility transmission and influence topology. All of the models’ findings confirm statistically substantial spillover from previous innovations in CATAVG. The DCC model confirms the persistence of spillover, and a significant increase in long-term spillover values demonstrates the dynamic character of financial time series correlation. The influence of the COVID-19 pandemic is readily seen in the multiplication of the βDCC for the DEBT asset class under the DCC Model. This demonstrates the contagion effects associated with herd behaviour. The study’s findings have various ramifications, including the need to establish essential watchdogs for contagion detection and to be cognizant of volatility spillover between asset classes in a portfolio. Numerous studies focusing on financial contagion identification in the banking sector loan books and intermarket linkages have proposed a variety of detection methodologies, including Markov regime simulation, copula-point detection and quantile regression. These algorithms can also be built and utilised to detect financial contagion in a MF setting. Balanced funds are regarded to provide diversification benefits during times of stress and have a lion’s share of retail participation—approximately 71 per cent—according to the Association of Mutual Funds in India’s (AMFI) AUM database. In light of these findings, the study may help fund managers optimise their portfolios. The article contributes to the existing literature on financial contagion by conducting the first study of its kind in a MF context. Future studies could concentrate on developing a model for estimating contagion during two distinct periods of pandemic crisis, taking into account government actions, macroeconomic conditions and changes in the financial regulatory system during the crisis.
Footnotes
Declaration of conflicting interests
The authors declared no potential conflicts of interest with respect to the research, authorship and/or publication of this article.
Funding
The authors received no financial support for the research, authorship, and/or publication of this article.