
Abstract
Objective:
To examine the relationship between multimorbidity and mortality, and whether relationship varied by material deprivation/rural location and by age.
Methods:
Retrospective population-based cohort study conducted using 2013–14 data from previously created cohort of Ontario, Canada residents classified according to whether or not they had multimorbidity, defined as having 3+ of 17 chronic conditions. Adjusted rate ratios were calculated to compare mortality rates for those with and without multimorbidity, comparing rates by material deprivation/rural location, and by age group.
Results:
There were 13,581,191 people in the cohort ages 0 to 105 years; 15.2% had multimorbidity. Median length of observation was 365 days. Adjusted mortality rate ratios did not vary by material deprivation/rural location; overall adjusted mortality rate ratio was 2.41 (95% CI 2.37–2.45). Adjusted mortality rate ratios varied by age with ratios decreasing as age increased. Overall rate ratio was 14.7 (95% CI 14.48–14.91). Children (0–17 years) had highest ratio, 40.06 (95% CI 26.21–61.22). Youngest adult age group (18–24 years) had rate ratio of 9.96 (95% CI 7.18–13.84); oldest age group (80+ years) had rate ratio of 1.97 (95% CI 1.94–2.04).
Conclusion:
Compared to people without multimorbidity, multimorbidity conferred higher risk of death in this study at all age groups. Risk was greater in early and middle adulthood than in older ages. Results reinforce the fact multimorbidity is not just a problem of aging, and multimorbidity leads not only to poorer health and higher health care utilization, but also to a higher risk of death at a younger age.
Introduction
The prevalence of multimorbidity is increasing in Canada, and across the world. While multimorbidity is typically considered a problem of old age, rates of multimorbidity begin to increase in middle age, and the volume of multimorbidity is derived from people as young as 35 years old. 1 People from materially deprived areas also experience more multimorbidity. 1 There is evidence that increased prevalence of multimorbidity results in an increased burden on persons, and increased utilization of and pressures on the health system. 2 –5
What is less known concerning the burden of multimorbidity is its relationship with mortality, especially whether the strength of this relationship varies with age and deprivation. Studies have found an overall positive relationship between multimorbidity and mortality. Studies that included adults across age groups 6 –12 generally found a higher effect of multimorbidity on mortality than those studies that included only older adults. 13 –19 A few of these studies studied the relationship between multimorbidity and mortality and levels of deprivation and found higher deprivation was association with higher mortality, including lower education 6,20 and ethnicity. 8
The goal of this study was to contribute to the body of evidence on the relationship between multimorbidity and mortality, thereby providing information that can be useful for improving health care delivery and health policy for people with multimorbidity. It adds to the literature by conducting a population-based analysis that includes persons of all ages in Ontario including children. The first objective was to determine if the relationship between multimorbidity and mortality varied across levels of urban material deprivation/rural location, controlling for age, sex, and Ontario geography. The second objective was to determine the age group-specific relationship between multimorbidity and mortality, controlling for the patient characteristics of sex, urban material deprivation/rural location and Ontario geography. Given that having multimorbidity is not simply synonymous with being old, it is critical to understand how multimorbidity impacts mortality rates in people across age groups and across different levels of deprivation.
Methods
This retrospective cohort, population-based study used a previously created cohort of Ontario residents that were classified according to whether or not they had multimorbidity (3+ chronic conditions; hereafter stated as 3+) (Figure 1). The cohort was created using linked, provincial, administrative health care databases. 1 All residents of Ontario (2013 population approximately 13 million) obtain their medical and hospital health care services from a government-administered, single-payer insurance system which maintains a comprehensive electronic provider reimbursement claims data base. Datasets were linked using unique, encoded identifiers and analyzed at ICES. ICES is a prescribed entity under section 45 of Ontario’s Personal Health Information Protection Act. Section 45 authorizes ICES to collect personal health information, without consent, for the purpose of analysis or compiling statistical information with respect to the management of, evaluation or monitoring of, the allocation of resources to or planning for all or part of the health system. Projects conducted under section 45, by definition, do not require review by a Research Ethics Board. This project was conducted under section 45, and approved by ICES’ Privacy and Compliance Office. This report follows the RECORD (REporting of studies Conducted using Observational Routinely-collected health Data) reporting guideline. 21
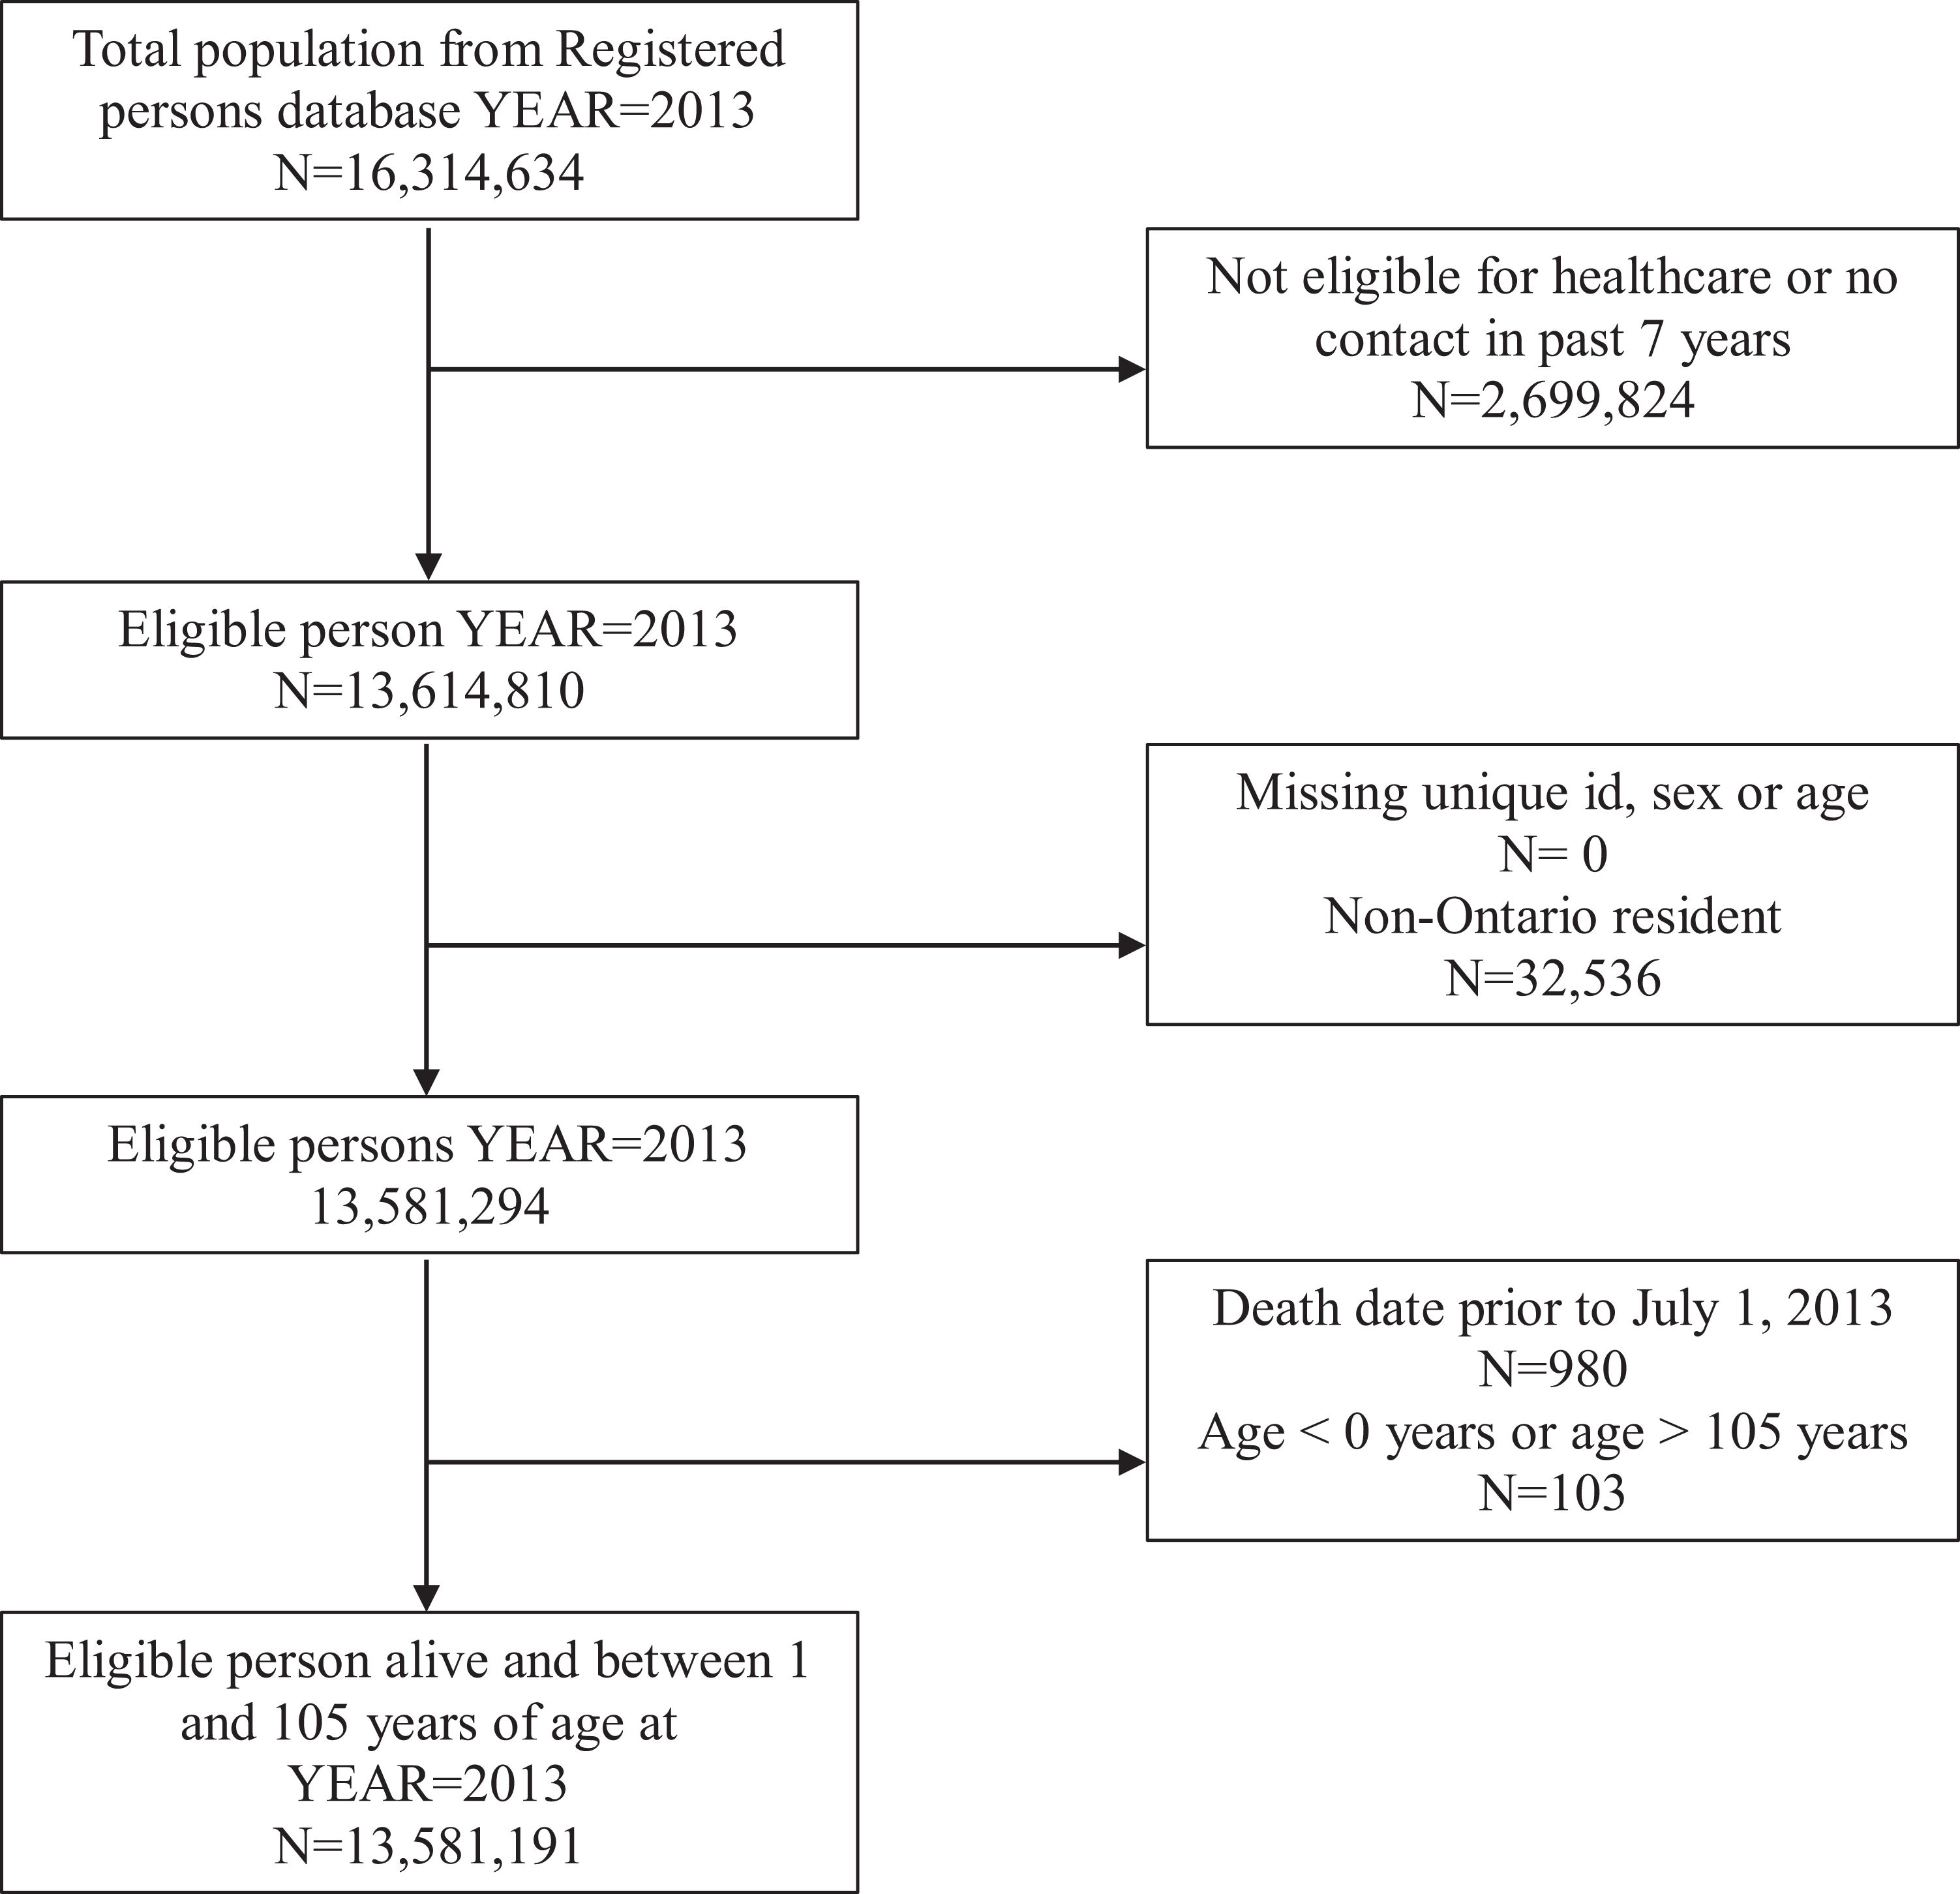
Study flowchart.
Data sources and study population
This study included people eligible for Ontario health insurance as of July 1, 2013 index date according to the Ontario Registered Persons Database (RPDB), Ontario’s health care registry. People without a valid health insurance number, those missing sex or age information and over the age of 105 were excluded. As well, people must have had contact with the Ontario health care system within the past 7 years. 22,23 The RPDB was used to obtain demographic data and participant characteristics.
Outcome—Mortality
Mortality was collected from the RPDB and defined as all-cause death within 12 months following the index date.
Independent variables
The main independent variable was multimorbidity, defined as the presence of three or more of 17 chronic conditions. 4,24 These conditions were chosen based on their availability in the Ontario administrative health care databases. Details concerning the choice and identification of these chronic conditions were reported in Ryan et al. 1 The 17 conditions were: arthritis, asthma, cancer, congestive heart failure (CHF), chronic obstructive pulmonary disease (COPD), cardiovascular disease (CVD), dementia, diabetes, HIV, hypertension, inflammatory bowel disease (IBD), chronic kidney disease (CKD), chronic liver disease, mood disorder, osteoporosis, stroke/transient ischemic attack (TIA), and urinary incontinence.
The RPDB was used to obtain sex, date of birth and postal code. Age was calculated on the index date, July 1, 2013. Age was categorized into age groups for analysis with childhood being 0–17 years, young adulthood being 18–24 years, then eleven 5-year age groups for adulthood, and 80+ years for the oldest age group. Postal code was used to determine to which regional health authorities (Local Health Integration Network (LHIN)) people belonged. At the time of the study, there were 14 LHINs in Ontario. The LHINs were funded by the Ontario Ministry of Health and Long-Term Care (MOHLTC) to “plan, coordinate and fund local health care services to improve access to health services and patient experience.” 25 They provide a measure of geographic and health system variation appropriate for the data used in this study.
People were assigned to either an urban material deprivation quintile or to a rural location as described in Ryan et al. 1 Material deprivation is one of four indicators of the Ontario Marginalization Index. 26 The material deprivation index was only applied to urban locations because it is considered reliable in urban settings where Census Dissemination Areas (CDAs) are small enough to allow for discrimination. 27 People were classified as living in an urban or rural location using Canada’s Post Postal Code Conversion File Plus (PCCF+). 28 Based on this material deprivation index, people in urban areas were classified into material deprivation quintiles with 1 representing the least deprived and 5 representing the most deprived.
Analysis
All analyses were conducted using SAS version 9.4. 29 Characteristics of the population were described and compared between those with and those without multimorbidity (3+) including the mean age, and the frequencies by sex and urban material deprivation quintile/rural location. The percentage of people with multimorbidity (3+) was determined, overall and by age group, for each of the 17 chronic conditions used in the definition of multimorbidity.
Crude (unadjusted) 1-year mortality rates were calculated per 100 people overall (percentages) and by multimorbidity (3+) status. These 1-year mortality rates were calculated overall and by urban material deprivation quintiles/rural location and by age groups.
Rate ratios were calculated to compare 1-year mortality rates for those with and without multimorbidity (3+) Unadjusted and adjusted rate ratios were calculated and are reported with 95% confidence intervals; however, because of possible confounding, adjusted rate ratios are interpreted. Within urban deprivation/rural location groups, adjusted rate ratios were estimated using a Poisson regression model and controlled for age, sex, and LHIN. For 1-year mortality rates stratified by age groups, adjusted rate ratios were estimated using a Poisson regression model and controlled for sex, LHIN, and urban material deprivation quintile/rural location. For each of the regressions, an interaction term between multimorbidity (3+) and sex was included. If the interaction was significant, a stratified analysis by sex was conducted.
In order to further quantify the impact of multimorbidity (3+) on mortality, the 1-year multimorbidity (3+)-attributable mortality prevention number was calculated for the entire Ontario population. Analogous to the number-needed-to treat in clinical trials, this value indicates how many “cases” of multimorbidity (3+) would need to be avoided in order to reduce the death for one person in Ontario in a 1-year period.
When defining multimorbidity as a count of chronic conditions, researchers have used both two conditions and three conditions as the cut-off for having multimorbidity. 4 Therefore, we have conducted a supplementary analysis with multimorbidity defined as two or more chronic conditions, referred to as multimorbidity (2+).
Results
Figure 1 reports the flow of Ontario residents included and excluded in the analysis. Table 1 reports characteristics of the Ontario population by multimorbidity (3+) status. There were 13,581,191 people in the study cohort and 15.2% had multimorbidity (3+). The mean age for those with multimorbidity (3+) was almost twice the mean age for those without multimorbidity. The proportion of people with multimorbidity (3+) was higher for each successive quintile of urban material deprivation and highest in the rural location.
Characteristics of Ontario population by multimorbidity status (3+ chronic conditions).

a Place of residence is broken down by material deprivation for urban residents but not for rural residents. The material deprivation index is valid only within urban populations. 27
Table 2 reports the distribution of multimorbidity (3+) by each of the 17 chronic conditions. Multimorbidity refers to three or more of the 17 chronic conditions including the condition listed in each row; for example, in the first row for arthritis, the multimorbidity status is three or more of any of the 17 chronic conditions including arthritis. Thirteen of the chronic conditions are more prevalent among those with multimorbidity. This is most pronounced in congestive heart failure where 94.5% of those with congestive heart failure have multimorbidity. Four chronic conditions (asthma, HIV, inflammatory bowel disease, and mood disorder) are more common among those without multimorbidity. This is most pronounced in asthma where 72.2% of those with asthma do not have multimorbidity. Supplementary Table S1 provides the distribution of multimorbidity (3+) by chronic condition for each age group.
Distribution of multimorbidity (3+ chronic conditions) in Ontario by chronic conditions (row %).a

a Supplementary Table S1 provides column per cents and distribution by age groups.
b The numbers in these columns do not add to these total numbers because people can have more than one chronic conditions, and therefore, are counted more than once.
c COPD: Chronic obstructive pulmonary disease; IBD: inflammatory bowel disease; TIA: Transient ischemic attack.
The crude unadjusted 1-year rates of mortality for the entire Ontario population were 0.22% for those without multimorbidity (3+) and 3.31% for those with multimorbidity. The median length of observation was 365 days. After adjusting for age, sex, urban material deprivation/rural location and geography, the risk difference was 0.0055 (95% CI: 0.004–0.007), which is equivalent to a 1-year multimorbidity-attributable mortality prevention number of 183. This suggests that we would need to prevent 183 people from acquiring multimorbidity (3+) in order to prevent one death within a 1-year period.
Table 3 reports on mortality by multimorbidity (3+) status and by urban material deprivation quintile/rural location; results are reported for males and females separately because there was a statistically significant interaction between multimorbidity (3+) and sex when adjusting the rate ratios. The denominator is lower in this table (n = 13,403,043) than the total sample, due to missing values on the urban material deprivation quintile/rural location variable. The number of deaths and corresponding population denominators are reported in the first two columns. These were used to calculate the unadjusted 1-year mortality rates (columns 3 and 4) and unadjusted mortality rate ratios comparing those with multimorbidity (3+) to those without multimorbidity (column 5). For both males and females, the unadjusted rates increased with higher deprivation and were higher for those with multimorbidity (3+). The unadjusted rate ratios decreased with higher levels of deprivation and with rural location.
Unadjusted and adjusted mortality rate ratios by multimorbidity status (3+ chronic conditions) by material deprivation quintile/rural (N = 13,403,043).

a Place of residence is broken down by material deprivation for urban residents but not for rural residents. The material deprivation index is valid only within urban populations. 27
b Adjusted for age, LHIN.
The final column in Table 3 reports the adjusted 1-year mortality rate ratios by urban material deprivation quintile/rural location, comparing those with multimorbidity (3+) to those without multimorbidity, adjusting for age and LHIN. The overall adjusted rate ratio for males (2.47) was higher than for females (2.37), but for both males and females, the adjusted rate ratios were substantially lower than the unadjusted rates, and no longer varied across urban material deprivation/rural location.
Table 4 reports on mortality by multimorbidity (3+) status and by age group; results are reported for males and females separately because there was a statistically significant interaction between multimorbidity (3+) and sex when adjusting the rate ratios. The number of deaths and corresponding population denominators are reported in the first two columns. These were used to calculate the unadjusted 1-year mortality rates (columns 3 and 4) and unadjusted mortality rate ratios comparing those with multimorbidity (3+) to those without multimorbidity (column 5). For both males and females, the unadjusted rates increased with each age group and were higher for those with multimorbidity (3+). The unadjusted rate ratios decreased with each older age group.
Unadjusted and adjusted mortality rate ratios by multimorbidity status (3+ chronic conditions) by age (N = 13,581,191).
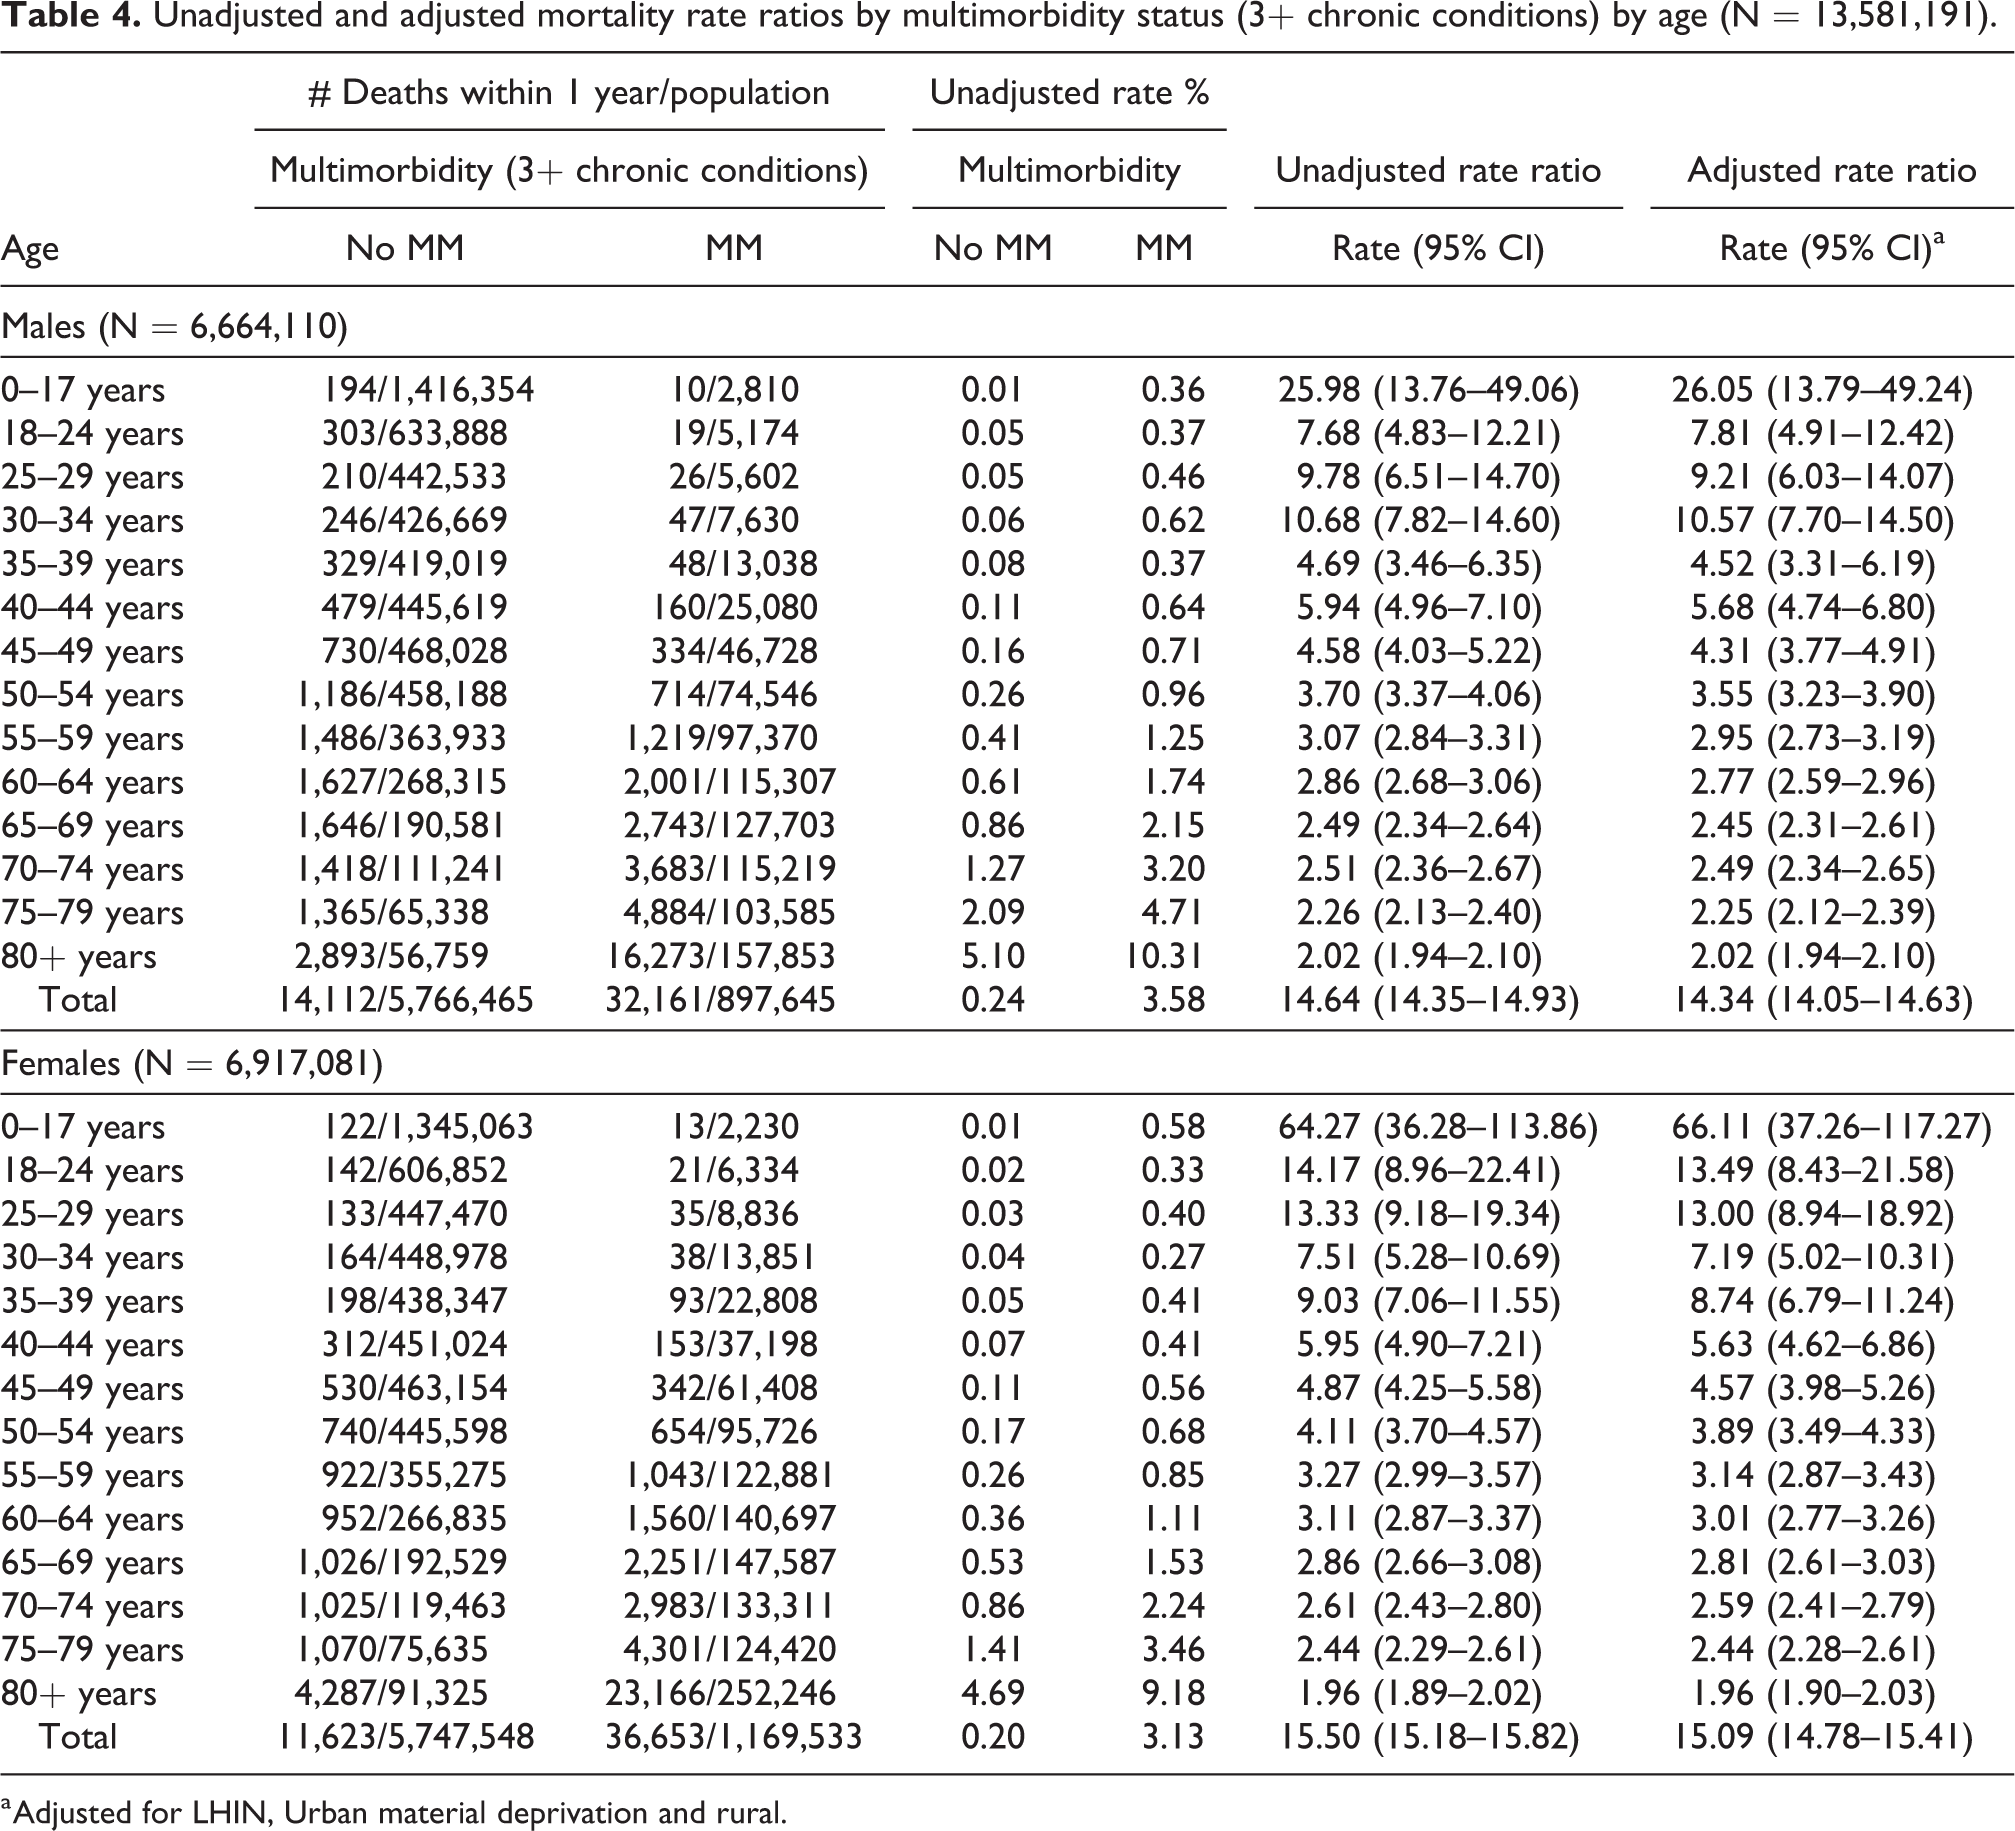
a Adjusted for LHIN, Urban material deprivation and rural.
The final column in Table 4 reports the adjusted 1-year mortality rate ratios by age group, comparing those with multimorbidity (3+) to those without multimorbidity, adjusting for LHIN and urban material deprivation quintile/rural location. There was little difference between the unadjusted and adjusted rate ratios. For both males and females, the adjusted rate ratios decreased with age, indicating a narrowing gap in 1-year mortality rates between those with and those without multimorbidity (3+) as people get older. The rate ratios were highest in the younger ages (e.g. 13.49 for females ages 18–24 years) indicating that those with multimorbidity (3+) are at a substantially increased risk of dying than those without multimorbidity in those age groups. The overall adjusted rate ratio for females (15.09) was higher than for males (14.34). Female children had three times the adjusted rate ratio than male children (66.11 versus 26.05); however, the confidence interval for females was wide. In young adults (18–24, 25–29 and 35–39 years), females had somewhat higher rate ratios than males; males had higher rate ratios for ages 30–34 years. After 39 years, the rate ratio differences between males and females were small. Overall, the gap between those with and without multimorbidity (3+) narrows at older ages but continues to persist, so that by 80+ years of age, people with multimorbidity (3+) are about two times more likely to die than those without multimorbidity.
The results of the analysis with multimorbidity defined as two or more chronic conditions (multimorbidity 2+) are reported in detail in Supplemental Tables S2 to S5. There were 28.6% of people with multimorbidity (2+) with an average age of 59.24 years compared to 15.2% for multimorbidity (3+) with an average age of 66.14 years. The crude unadjusted mortality rates by multimorbidity (2+) were 0.13 for those without multimorbidity (2+) and 2.10 for those with multimorbidity (2+). After adjusting for age, sex, urban material deprivation/rural location and geography, the risk difference was 0.005 (95% CI: 0.003–0.006), which is equivalent to a 1-year multimorbidity (2+)-attributable mortality prevention number of 212. Supplemental Tables S4 and S5 report mortality by multimorbidity status (2+) by urban material deprivation quintile/rural location (S4) and by age group (S5). There were significant interactions between multimorbidity and sex; therefore, these analyses are presented separately for males and females. The adjusted rate ratios by urban material deprivation/rural location were similar between those with multimorbidity (3+) and multimorbidity (2+). The adjusted rate ratios by age group were smaller for multimorbidity (2+) than for multimorbidity (3+); these differences were less pronounced in the older age groups.
Discussion
This study determined for the province of Ontario, the relationship between multimorbidity (3+) and mortality across levels of urban material deprivation/rural location, and determined the age group-specific relationship between multimorbidity (3+) and mortality. The results presented both unadjusted and adjusted rate ratios to demonstrate the effect of confounding of age, sex, and Ontario geography on these relationships; however, the discussion that follows focuses on interpreting only the adjusted rate ratios.
When examining mortality across urban material deprivation quintiles/rural locations, there was no variation in the adjusted (for age and LHIN) 1-year mortality rate ratios across material deprivation quintiles/urban location, and no large differences between males and females. This was consistent in the supplemental analysis for multimorbidity (2+). We need to consider whether the lack of a difference may be due, in part, to the fact that we could have missed classifying some people of lower socioeconomic status as having multimorbidity because people had to access health care in order to be diagnosed with chronic conditions as part of our ascertainment of multimorbidity. However, this does not seem to be the case because rates of multimorbidity (3+) in Ontario did demonstrate modest variation by deprivation status 1 in this same cohort Perhaps universal access to health care is protective against mortality from multimorbidity but not protective against acquiring multimorbidity in the first place. This may be because lifestyle factors, rather than health care, contribute to acquiring chronic conditions. Other studies have found lower education 6,20 and ethnicity 8 were associated with higher mortality but no identified studies determined the association between deprivation and mortality.
When examining mortality across age groups, the adjusted (for LHIN and material deprivation/rural location) mortality rate ratios decreased with increasing age. However, while the effect of multimorbidity (3+) decreased with age, even in the oldest age group (80+ years), multimorbidity (3+) still conferred a 1-year risk of death twice as high as the risk for those without multimorbidity for both males and females. But it is in the younger age groups where we see a concerning excess of mortality due to multimorbidity (3+), particularly in females. In the childhood age group, 0–17 years, males with multimorbidity (3+) had 25.98 times and females had 64.27 times higher adjusted 1-year rate of dying than those without multimorbidity. The difference between male and female children is large but the female confidence intervals are wide and the absolute numbers of deaths very small; therefore, this difference should be interpreted with caution. However, even in the younger adult age groups (those 18–44 years), having multimorbidity (3+) conferred, for males a 4.69 to 10.68 times higher rate of dying and for females a 5.95 to 14.17 times higher rate. Compared to the multimorbidity (3+) analysis, there were smaller rate ratios in the multimorbidity (2) analysis. However, even when defined as 2+ chronic conditions, children with multimorbidity had a much higher risk of dying than those without multimorbidity and, consistent with the multimorbidity 3+ analyses, the difference is greater for females than males. As with the multimorbidity (3+) analysis, both males and females 80 years and older with multimorbidity (2+) were twice as likely to die as those without multimorbidity. Our results are consistent with those found in other studies 6 –13,15 –19,30 where the effect of multimorbidity on mortality decreased with age. Our results were consistent with Jani et al. 12 that found that “Multimorbidity had a greater impact on all-cause mortality in middle-aged as opposed to older populations particularly males, which deserves exploration” (p. 1).
The larger rate ratio differences at younger ages suggests that this is where prevention can have a significant impact. While it is not possible to prevent all conditions that contribute to multimorbidity, if we reduce the percentage of people with chronic conditions at earlier ages, we can reduce the rate of multimorbidity, and correspondently reduce some of the excess mortality associated with multimorbidity. The adjusted 1-year multimorbidity (3+)-attributable mortality prevention number was 183 for the overall population. This reminds us that while preventing multimorbidity is not easy, modest efforts can save lives. To prevent multimorbidity, we need to prevent its component chronic conditions; this prevention is an on-going lifelong endeavor.
Limitations of this study are consistent with those discussed in Ryan et al. 1 where the creation of the cohort used in this current study was reported. We were only able to categorize people into having multimorbidity or not using a count of 17 conditions with validated definitions, and these conditions were only identified when the person had contact with the health care system and the appropriate diagnostic codes were entered into their health records. This could have resulted in underrepresentation of multimorbidity rates. Because multimorbidity definitions vary, it is difficult to compare rates across different studies. This continues to be a challenge for multimorbidity research where we do not have one standard list of chronic conditions that should be included in a multimorbidity definition. 4 We are often limited to those conditions we are able to identify, especially when using secondary data such as health administrative data. This study attempted to address this limitation somewhat by conducting a supplemental analysis using a second definition of multimorbidity.
A further limitation is that we cannot know, from this study, the exact mechanisms whereby multimorbidity confers an excess risk of mortality. Multimorbidity confers risk to individuals that is variable, depending on the combinations and severity of the conditions, and on the age and lifestyle of the individual. Our study identified a cross-sectional cohort of those alive at the beginning of a year and the close follow-up period reflected the risk of death in each particular age group, essentially controlling for potential period and aging effects. Recognizing that this does not allow us to see how the risk of death changes across a person’s lifetime, a future population cohort study could examine the risk of mortality across the lifespan, comparing rates between people with and without multimorbidity.
This study categorized people as either having multimorbidity or not. Future research should look at whether there is a dose response between the numbers of chronic conditions and mortality. As well, the fact that 13 conditions were more highly represented in those with multimorbidity than in those without deserves more attention. Naturally, this will be the case since these conditions form part of the definition of multimorbidity. However, the variation in these percentages can be explored further. Some of this variation reflects that certain conditions are associated with age, and there is an overall higher percentage of people with multimorbidity in the older ages. However, future research can examine whether there are particular clusters of conditions more highly associated with mortality than others.
The strength of this study is that it captures almost the entirety of the Ontario population, and 1-year mortality rate ratios were adjusted as appropriate for age, sex, urban material deprivation/rural location, Ontario geography, and reported separately for males and females.
Conclusion
Much has been written about the increased burden on persons and on the health system, arising from the increased prevalence of multimorbidity. 2,4,5 Previous research in Ontario revealed that, in terms of absolute numbers of people, the burden of multimorbidity exists not just for older adults, but for those at much younger ages. 1 It is known that those with multimorbidity use more health care services than those without multimorbidity. 3 What was less known is the association between multimorbidity and mortality, particularly whether the association varies by deprivation or age. This study identified that multimorbidity confers a higher risk of death at all age groups and that this risk is greater in early and middle adulthood than in older ages. These results highlight the importance of early intervention to prevent chronic conditions. It is essential that everyone—patients, health care providers, policy-makers, and public health—recognize that multimorbidity leads not only to poorer health 31 and higher health care utilization, 3 but also to a higher risk of death at a younger age. The results from this study can inform health care and health policy that is appropriate and tailored to different segments of the populations at risk for premature mortality due to multimorbidity.
Supplemental material
Supplemental Material, Multimorbidity_and_mortality_Table_S1 - Multimorbidity and mortality in Ontario, Canada: A population-based retrospective cohort study
Supplemental Material, Multimorbidity_and_mortality_Table_S1 for Multimorbidity and mortality in Ontario, Canada: A population-based retrospective cohort study by BL Ryan, B Allen, M Zwarenstein, M Stewart, RH Glazier, M Fortin, SJ Wetmore and SZ Shariff in Journal of Comorbidity
Supplemental material
Supplemental Material, Multimorbidity_and_mortality_Table_S2 - Multimorbidity and mortality in Ontario, Canada: A population-based retrospective cohort study
Supplemental Material, Multimorbidity_and_mortality_Table_S2 for Multimorbidity and mortality in Ontario, Canada: A population-based retrospective cohort study by BL Ryan, B Allen, M Zwarenstein, M Stewart, RH Glazier, M Fortin, SJ Wetmore and SZ Shariff in Journal of Comorbidity
Supplemental material
Supplemental Material, Multimorbidity_and_mortality_Table_S3 - Multimorbidity and mortality in Ontario, Canada: A population-based retrospective cohort study
Supplemental Material, Multimorbidity_and_mortality_Table_S3 for Multimorbidity and mortality in Ontario, Canada: A population-based retrospective cohort study by BL Ryan, B Allen, M Zwarenstein, M Stewart, RH Glazier, M Fortin, SJ Wetmore and SZ Shariff in Journal of Comorbidity
Supplemental material
Supplemental Material, Multimorbidity_and_mortality_Table_S4 - Multimorbidity and mortality in Ontario, Canada: A population-based retrospective cohort study
Supplemental Material, Multimorbidity_and_mortality_Table_S4 for Multimorbidity and mortality in Ontario, Canada: A population-based retrospective cohort study by BL Ryan, B Allen, M Zwarenstein, M Stewart, RH Glazier, M Fortin, SJ Wetmore and SZ Shariff in Journal of Comorbidity
Supplemental material
Supplemental Material, Multimorbidity_and_mortality_Table_S5 - Multimorbidity and mortality in Ontario, Canada: A population-based retrospective cohort study
Supplemental Material, Multimorbidity_and_mortality_Table_S5 for Multimorbidity and mortality in Ontario, Canada: A population-based retrospective cohort study by BL Ryan, B Allen, M Zwarenstein, M Stewart, RH Glazier, M Fortin, SJ Wetmore and SZ Shariff in Journal of Comorbidity
Footnotes
Authors’ note
The dataset from this study is held securely in coded form at ICES. While data sharing agreements prohibit ICES from making the dataset publicly available, access can be granted to those who meet pre-specified criteria for confidential access, available at ![]() . The full data set creation plan and underlying analytic code are available from the authors upon request, understanding that the programs may rely upon coding templates or macros that are unique to ICES and are therefore either inaccessible or may require modification.
. The full data set creation plan and underlying analytic code are available from the authors upon request, understanding that the programs may rely upon coding templates or macros that are unique to ICES and are therefore either inaccessible or may require modification.
Declaration of conflicting interests
The author(s) declared no potential conflicts of interest with respect to the research, authorship, and/or publication of this article.
Funding
The author(s) disclosed receipt of the following financial support for the research, authorship, and/or publication of this article: This study was supported by ICES, which is funded by an annual grant from the Ontario Ministry of Health and Long-Term Care (MOHLTC). Through Dr Ryan’s participation in the ICES Western Faculty Scholar’s Program, the study was completed at the ICES Western site, where core funding is provided by the Academic Medical Organization of Southwestern Ontario, the Schulich School of Medicine and Dentistry, Western University, and the Lawson Health Research Institute. Support for Dr Bridget Ryan’s participation in the ICES Western Faculty Scholars Program came from the Department of Family Medicine, Schulich School of Medicine and Dentistry, Western University. Dr Ryan was also funded by the Canadian Institutes of Health Research Community-based Primary Health Care Innovation Team, Patient-centred Innovations for Persons with Multimorbidity. Dr Moira Stewart was funded by the Dr Brian W Gilbert Canada Research Chair in Primary Health Care Research (2003–2017). Dr Richard Glazier was supported as a Clinician Scientist in the Department of Family and Community Medicine at St Michael’s Hospital in Toronto and at the University of Toronto.
Parts of this material are based on data and information compiled and provided by the Canadian Institute for Health Information (CIHI). The analyses, conclusions, opinions and statements expressed herein are solely those of the authors and do not reflect those of the funding or data sources; no endorsement is intended or should be inferred.
Supplemental material
Supplemental material for this article is available online.
References
Supplementary Material
Please find the following supplemental material available below.
For Open Access articles published under a Creative Commons License, all supplemental material carries the same license as the article it is associated with.
For non-Open Access articles published, all supplemental material carries a non-exclusive license, and permission requests for re-use of supplemental material or any part of supplemental material shall be sent directly to the copyright owner as specified in the copyright notice associated with the article.