
Abstract
Implementing state-transition models in team sports such as football (soccer), can be complex and time-consuming if observational methods need to be used. To help alleviate this, the aims of this study are two-fold. First, based on existing phases of play models, we introduce a hand-crafted expert state system that combines in- and out-of-possession phases of play to form a set of comprehensive tactical states. Second, we introduce a machine learning approach for automatically detecting the introduced tactical states based on positional data. This is implemented by capturing positional configurations of the players and the corresponding ball location. By clustering the player configurations for each ball zone and learning a “translation table” between the identified clusters and the expert state system, using three training games, the framework can be used to automatically detect states from the positional data of new games. The performance of our framework is evaluated by comparing the automatically detected states to the state label assigned by a human annotator using twelve test games from the 2021/2022 Bundesliga season. This showed good agreement, with F1-scores greater than 0.9 for most states. Hence, our framework may provide a method for time-efficient and comprehensive match analysis in football performance analysis.
Introduction
To date, state-transition models used in performance analysis are mostly applied in net games like tennis (e.g., Lames, 1991; Rothe and Lames, 2023) or table tennis (Pfeiffer et al., 2010; Rothe et al., 2025), allowing for a comprehensive description of a match with a transition matrix containing the probabilities of the state transitions (Lames, 2020; Lames and McGarry, 2007). The most important prerequisite for a state-transition model is a category system that defines a set of states, allowing one to attribute a unique state to each match situation (Lames, 2023). Playing states in football may serve as the backbone of such a category system for football and thus could provide the foundation for future state transition modelling. The definition of playing states is ideally based on concepts prevailing in sports practice while taking into account the methodological requirements of a category system. In addition, it should reflect the main characteristics of the modelled sport on a conceptual level (Lames, 2023). However, state systems used in football largely rely on either a few rather abstract states (Welch et al., 2021), ball possession of individual players (Liu and Hohmann, 2013) or ball positions (Hirotsu et al., 2024; Liu et al., 2022). This reduces the information conveyed in terms of tactical behavior, providing only a limited picture of actual match tactics.
Football is a team invasion game. When possessing the ball, the objective of the basic tactical moves is to advance the ball to critical zones, create a scoring opportunity, and finally score. Each of these steps must be executed against the resistance of the opponent that attempts to gain ball possession, which, if successful, takes the same steps towards the other goal, thus creating a characteristic antagonistic interaction process. Advancing the ball is a central tactical issue (Hewitt et al., 2016). There are many variations of doing so, e.g., with a controlled build-up or long passes, with a position attack or counterattack, using the wings or the center. Each ball-advancing variation is executed against a specific tactic of the defenders, e.g., against man-to-man or zone defense, against a high-, middle-, or low-positioned defensive block.
The theoretical relevance of specifying a state system for football is evident, considering the investigation of the performance structure as the main task of theoretical performance analysis (Lames, 2023; McGarry, 2009). Compared with more standard statistical approaches dealing with single Performance Indicators (PIs) or PI profiles, state-transition models preserve the dynamics and the interactive nature and provide a comprehensive representation of the sport under scrutiny (Lames and McGarry, 2007). In addition, analyzing a team's behavior separately for different playing states is a widespread method in practical performance analysis when a detailed evaluation of team performance is the target (Barkell et al., 2017; Bauer et al., 2023; Sandholtz and Bornn, 2020).
At present, detecting playing states in sports practice is quite laborious (Bauer et al., 2023). Observational methods such as notational analysis based on systematic game observation must be employed. It requires linear inspection of a video feed, recording playing states with time stamps, and supplying additional information like pitch location, game actions, and success. The inherent problems of this procedure are that it is subjective, time-consuming, and typically requires expert knowledge. In sum, the present method is very demanding regarding resources, making automatic state detection highly desirable for theory and practice in sports.
In recent years, data coverage in football has reached a very high level. Routinely, fine-grained event streams (approximately 1.500 events per match, i.e., 16 events per minute of playing time) 1 are provided. Positions of players and the ball on the pitch are recorded via video-based object tracking, typically at 25 frames per second (Linke et al., 2020). The quality and density of data coverage in football open perspectives for computer science to engage in an attractive application field and to support sports practice, for example, with problem-solving based on Artificial Intelligence (Clijmans et al., 2022; Fernández et al., 2019; Van Roy et al., 2023).
This study pursues two main goals. First, we introduce a hand-crafted expert state system for tactical states in football. Each state has a distinct tactical meaning and is characterized by spatial criteria in terms of the number of players located in specific zones of the pitch and the ball location. This state system is developed from existing category systems in football to account for common tactical categorizations. Second, we introduce a machine learning approach for automatically detecting the tactical states from positional data. This serves the purpose of facilitating state-transition modelling in football based on the introduced expert state system and the framework for their automatic detection.
State of research
In recent decades, research on football tactics often used approaches focusing on specific key elements of match play (Hewitt et al., 2016; Mackenzie and Cushion, 2013). Examples include analysis of passes (Power et al., 2017), chance creation (Link et al., 2016b), and defensive performance (Vogelbein et al., 2014). These reductionist approaches might have been pursued due to the inherently complex nature of invasion games in general and football specifically. While such approaches are very informative regarding specific elements of match play, they are not suited to describe performance in football in a holistic manner (Clijmans et al., 2022). Consequently, several attempts have been made to model match play comprehensively using various types of state models with frameworks based on player positioning, field zones, game states, and phases of play.
Based on the concept of football as a dynamic system, Kim et al. (2019) determined five unstable states in football match play that can be used to identify perturbations that lead to the creation of scoring opportunities. Welch et al. (2021) analyzed the collective movement of teams during three phases of match play, including attack, defense, and out of play, by investigating the alignment of players’ movement and the rotation around their formation's center. Jerome et al. (2024) used phases of play for analyzing and contextualizing physical demands during match play.
By combining spatiotemporal data of players with machine learning techniques Fernández et al. (2019) introduced an expected possession value (EPV) framework that is based on multiple component models. These models use various contextual features, e.g., formation lines of the defending team, relative positioning, and distances and angles between players. With the aim to explore phase-dependent formations, Bauer et al. (2023) explored two approaches for automatically identifying distinct phases of play, using a rule-based approach and convolutional neural networks, respectively.
Liu and Hohmann (2013) modeled football match play as a finite Markov chain in order to derive the performance relevance of offensive actions. The states in the Markov chain are defined by individual ball control and zones on the pitch. Using a similar method based on the transitions between zones, Liu et al. (2022) analyzed different playing styles during the 2018 World Cup.
Clijmans et al. (2022) modeled game behavior of teams as a discrete-time Markov chain to analyze playing styles. Within the model, states are defined based on the type of possession gain/loss, on-the-ball events, and in which zone on the pitch this occurred. Similarly, Van Roy et al. (2023) further proposed a Markov framework which incorporates a Markov decision process and probabilistic model checking to optimize team strategies in football. The underlying state space is defined by the on-the-ball events and in which zone on the pitch they occurred. Ötting and Karlis (2023) developed a hidden Markov model based on the effective playing space of teams. Finally, Hirotsu et al. (2024) introduced a Markov model that incorporates a set of discrete states that are defined by the team in possession, the score difference, and the ball location in terms of zones on the pitch. Tactical changes are modelled by changes in transition rates between states.
Aims of the study
As outlined in the previous section, most comprehensive models or state systems in football focus on team movement, ball position, and control zones to differentiate playing states where the tactical context cannot necessarily be inferred. Furthermore, approaches that use tactical states or phases of play often rely on expert classifications which are subjective, time-consuming, and require support from match analysts or other experts.
However, recent work regarding the phase-dependent identification of player configurations shows the potential of using player configurations for identifying phases of play and illustrates the inter-dependence of player configurations and the tactical behavior on the pitch (Bauer et al., 2023). Founded on the assumption of this connection, we aim to introduce a comparable framework for automatically detecting tactical states based on player configurations as represented by the number of players present in specific zones on the pitch.
To that end, we first aim to introduce a hand-crafted expert state system that is derived from existing phases of play models. Secondly, we develop a framework for automatically detecting the introduced tactical states based on emerging player configurations and the ball position. For this purpose, we first use three training matches to retrieve clusters of player configurations. We then derive a mapping between the clustered player configurations and the hand-crafted expert state system. The resulting “translation table” may be used to automatically detect states from positional data of new matches. We finally check the agreement of our method for automatically detecting states against match protocols for twelve test matches where states are assigned based on the same criteria.
Method
Expert state system
The expert state system used in this work is hand-crafted and mostly derived from existing variations of phases of play models. As there is no consensus on the definition of phases of play in the scientific literature, we consider aspects from multiple sources, such as practical guidelines for football analytics (i.e., FIFA Phases of Play Metrics (FIFA, 2023)) and other phases of play approaches in research applications (Bauer et al., 2023; Jerome et al., 2024). Hence, in line with existing phases of play models, our state system includes the states build-up, progression, attacking play, and counterattacks for the team in possession, as well as low block, mid-block, and high block for the team out of possession.
A fundamental concept implemented in the identification of a state system was that each state incorporates the tactical behavior of both the team in possession and out of possession to reflect the interactive nature of the game. A compromise between a large number of states, yielding a very detailed picture, and a practically relevant number of different tactical intentions was tried to achieve. Finally, the notion of a playing state as an equivalence class of match situations was respected in the sense that each situation may be attributed to one and only one state and for all existing situations a state definition should be applicable (Lames, 2023).
Player and ball zone model
Our main idea for automatically detecting states is based on the positional configuration of the players and the ball location. We record these aspects based on a 5-zone player grid and a 15-zone ball grid, respectively. These grids serve as a frame of reference for both the rule-based criteria developed for the hand-crafted expert state system as well as the automatic detection of states. Note that in contrast to the common understanding of player configurations in the sense of team formations (Bauer et al., 2023; Shaw and Glickman, 2019), we propose a different concept where we capture the player configuration based on the players’ occupation of areas within the 5-zone grid. Hence, when we refer to player configuration in the scope of our framework, we refer to the latter approach.
To assess the player configuration of teams, we use a grid dividing the pitch into five vertical player zones: DefBox, DefMid, MidMid, OffMid, and OffBox, as shown in Figure 1(a). The operational definitions of these zones are determined based on grass stripe dimensions as specified for pitches used in UEFA competitions per the Handbook for Greenkeeping in the Bundesliga and Bundesliga 2 (DFL, 2022). The grass stripes may be recognized in the match videos and can also easily be transferred into numerical borders for the automatic detection.

(a) Player zones; (b) Ball zones.
The ball position is assessed in a similar way using a 15-zone grid, recognizing different tactics when playing at the wings or in the center. To that end, the pitch is further divided by two imaginary horizontal lines that are extensions of the lateral borders of the penalty box, as shown in Figure 1(b). As a result, each player zone is divided into three ball zones, with one central and two lateral zones.
State definitions
Our assumption for the identification of phases of play is that a specific phase is reflected by (1) the distribution of players of both teams over the pitch, and (2) the position of the ball. In part this conception is founded on the established concept of constraints (Newell, 1986) which is commonly applied in sports performance analysis (Glazier, 2017). In that regard football tactics are strongly influenced by task constraints like pressure from opposition players, distance to the goal, passing options and game rules such as offside. Naturally these factors will determine player and team positioning relative to the ball, making the latter viable factors to determine tactical states during regular match play. For example, during an attacking play situation where the ball is in the final third, it can be expected that the in-possession team will position itself to a large extent in the final third as well, since this is functionally required to create passing opportunities or open up space to dribble into a dangerous zone in order to create scoring opportunities. The defending team would also be expected to stay in this area with their players positioned even closer to their own goal than the attacking team. Thus, defining playing states based on the distribution of the two teams over the pitch and the ball position is a promising way to approach playing states. In addition, this kind of modeling only requires positional data and thus is apt for automatic playing state detection.
Some of the basic states outlined in the section below were subdivided to capture variations in the corresponding tactical situations (see Table 1), specifically concerning the occupation of certain zones on the pitch. Furthermore, while states generally retain the overall context of the equivalent phases of play, we adapted the definitions in order to reflect our primary assumption that states could be identified based on the distribution of players over the pitch in combination with the ball position. These definitions were developed based on prior functional considerations (deductive) as well as systematic game observation (inductive).
Expert state system with eligible ball zones and rule-based criteria pertaining to player distribution.

The subsequent paragraphs provide detailed definitions of the states incorporated in the hand-crafted expert state system. For most states, we combine in-possession and out-of-possession sub-states, i.e., the tactical situation of the defensive and the offensive team. Note that although certain combinations may logically occur or even do so in practice, these were not included as separate states if they occur infrequently and with limited duration or lack tactical relevance. This serves to ensure a tactically meaningful state system that is relevant in terms of regular match play. Such combinations may include configurations that only occur during short transition phases between states or during irregular situations like a clearance. Below we first introduce all included sub-states separately by their tactical and positional characteristics.
In-possession sub-states
Build-up
Playing situations are classified as build-up when the in-possession team has control over the ball in the DefBox and DefMid zones with the general aim of advancing the ball to the offensive third. We further differentiate among three types of build-up play depending on where the ball carrier is positioned in relation to the rest of the team. This results in the sub-states vertical build-up (majority of players positioned in zones up-field from the ball location), horizontal build-up (majority of player positioned in the same zone as the ball location) and counter build-up, i.e., the initial phase of a counterattack (majority of player positioned behind the zone with the ball location).
Progression
We classify a playing situation as progression when the ball is located in MidMid. Here, we also distinguish between two sub-states. Vertical progression where the majority of players is positioned in OffMid or OffBox and horizontal progression where the majority of players is also positioned in MidMid. This typically occurs after a successful build-up phase when the team in possession tries to advance the ball into the offensive third or the ball was played back to one of the center backs or an inverted full back positioned in MidMid, in order to immediately re-initiate an attack.
Attacking play
During attacking play, the ball is located in the offensive zones (OffMid or OffBox) and the team in possession aims to create a goal-scoring opportunity. In this context, we further distinguish between transitional attacking play and attacking play with box occupation. During the former, the team in possession tries to advance the ball towards the out-of-possession team's penalty box or the wing areas at the side of the penalty box. During attacking play with box occupation, the ball is typically located close to the penalty box or at one of the sides of the penalty box. Additionally, at least two other players are positioned in OffBox to receive a pass or cross into OffBox.
Counter/Fast attack
This state captures two basic concepts that are very similar when inspecting the underlying positional configurations. First, a proper counterattack where the ball carrier quickly dribbles towards the opponent's goal. Second, a playing situation where the ball was played directly into the attacking line of the team in possession. In both situations, the positional configuration of teams will be more spread out, with roughly a 1:1 ratio of defending versus attacking players in the same zone as the ball. Additionally, the team out of possession will have a large number of players positioned in zones closer to the goal of the team in possession when compared to other states.
Out-of-possession sub-states
High-block
During a high block, the team out of possession tries to exert pressure in the opponent's half. This often involves a more player-oriented style of defending where players may leave the defensive formation to try and disrupt the opponent's build-up. A high block thus includes pressing as well as counter pressing situations after transitions. In terms of player configuration, we consider a high block when at least four players from the team out of possession are positioned in OffMid and/or OffBox.
Mid-block
The team out of possession takes up a structured defensive formation in MidMid, i.e., around the midline. When positioned in a mid-block, the team primarily tries to prevent the opposing team from entering the offensive third after the initial build-up, mainly trying to cover passing lanes towards their defensive third. Consequently, there are only a few players, if any at all, trying to exert pressure on the ball carrier.
Low-block
In this state, the team out of possession is largely placed in their own DefMid or DefBox, i.e., their defensive third, usually taking up a compact formation with minimal space between defensive players. This setup typically occurs when the team in possession is either in progression or attacking play, where the main target of the team out of possession is to defend their box/goal and prevent the opponent from creating scoring chances.
Additionally, each state is characterized by a set of rule-based criteria that consider the ball location as well as the number of players in each zone of the player grid. Table 1 provides an overview of all nine states, including their corresponding operational criteria. The latter are subsequently used to derive a mapping between the automatically detected clusters of player configurations and the hand-crafted expert state system.
Data & sample
For this study, we used positional data from fifteen randomly selected matches of the 2021/2022 Bundesliga season. The positional data was recorded with a video-based tracking system (Tracab, 25 Hz) with proven accuracy (Linke et al., 2020) and provided by one of the authors in scope of his position and responsibility at this time. The selected sample of matches was split into a training set consisting of three matches and a test set consisting of twelve matches. The training set included six different teams, and the test set included 16 different teams, with 18 different teams (i.e., all teams that participated in the 2021/2022 Bundesliga season) included in total. Note that our test set includes teams which were not present in the training set. This is intentional as it allows us to assess whether our proposed methodology generalizes to teams it has not seen during training. As a second-wise detection of game states was conducted, the sample provided roughly 8100 s of in-possession phases for the training set and 30,600 s for the test set.
Generally, we only included matches with 10 vs. 10 in-field players, i.e., matches without send-offs during the regular playing time of 90 min, to represent regular match play.
State detection from positional data
Data preprocessing
In a first step, the positional data of players and the ball was aggregated to 1 Hz. The data was split into one-second windows and average player and ball positions were calculated for each window. The identification of states is restricted to periods of the match where they may be clearly detected, i.e., when regular match play occurs in a tactically clear situation. Thus, for example, game stoppages were excluded. Separating stoppages from regular match play required the identification of all periods where the ball was out of play (OOP). This can be due to a referee's whistle (e.g., foul followed by a free kick to restart the match) or the ball going out of bounds after which play is restarted by a throw-in, goal kick, or corner kick.
In addition, phases with no clear possession (NCP) for either team were excluded as the attribution of a playing state is only appropriate when one team has control of the ball. A similar concept of ball possession was introduced in the form of team play making by Link and Hoernig (2017). Since these phases were not originally labeled in the positional data, this had to be done in a separate preprocessing step. We only considered sequences as ball possession phases where a team was in possession for longer than three seconds, in line with the work of Bauer et al. (2023).
For similar reasons, we excluded the first three seconds after turnovers and set-pieces (Bauer et al., 2023). The player positioning during the execution of set-piece situations such as corners or free kicks produces distinct positional configurations due to the task-specific tactics employed. These are subject to separate analyses independent from regular match play analyses (Casal et al., 2015; Link et al., 2016a). We assume that three seconds after the execution of a set play, the match assumes a tactical configuration similar to regular play. In the case of a throw-in, we assume that the player positioning is comparable to a regular playing situation as soon as the ball is in play.
Representation of players’ positional configurations
To represent the positional configuration of teams, the distribution of players, i.e., the number of players positioned in each of the five player zones, is extracted from the positional data and formatted as a pair of 5-tuples. Within a pair, the first 5-tuple represents the distribution of players for the team in possession, and the second 5-tuple represents the same for the team out of possession. Each element of an individual tuple indicates the number of players from the respective team positioned in the corresponding zone. In that regard, the first element of a tuple represents the number of players in the zone DefBox and the last the number of players in the zone OffBox, viewed in the playing direction of the respective team.
Four exemplary tuples are given in Figures 2(a) to (d) showing an observed possession sequence starting with a vertical build up vs. mid-block [1-2-6-2-0–1-4-6-0-0], a subsequent vertical progression vs. low block [0-1-4-6-0–1-9-1-0-0] and a transitional attacking play vs. low block [0-1-2-8-0–3-8-0-0-0], ending with an attacking play with box occupation vs. low block [0-1-2-4-4–7-4-0-0-0].

Exemplary positional configurations for a selection of states (ball location denoted in orange): (a) vertical build-up (mid-block), (b) vertical progression (low block), (c) transitional attacking play (low block), (d) attacking play with box occupation (low block).
In Figure 2(a), the ball carrier is positioned in DefMid with most of his teammates positioned in MidMid to provide an opportunity for receiving a vertical pass. The out-of-possession team is also largely positioned in MidMid to cut passing lanes but without applying direct pressure on the ball carrier. In Figure 2(b), most of the in-possession team's players have advanced into OffMid to provide an opportunity for a vertical pass into that area to initiate their attacking play. Here, the out-of-possession team has largely withdrawn to their DefMid to prevent passes into this area, especially through the center. In Figure 2(c), the in-possession team has successfully progressed to OffMid with several players already positioned close to the box, opening passing lanes for chance creation. The out-of-possession team is positioned mostly in front of their box to contest any dribbling or passes towards the box area. Finally, in Figure 2(d), the in-possession team has several players in the opposition's box to provide opportunities for a pass or a cross. The out-of-possession team has largely fallen back into their box to mark the opposition players in the box.
Clustering procedure and translation table
The pairs of 5-tuples combined with the ball zone are used to represent the tactical state of a match in a certain situation. This representation leads to a very large number of possible configurations (upper limit for state space: 15 ball zones × 511 × 511 states). Of course, this theoretical state space would only be sparsely populated in practice, as only a fraction of possible configurations would occur during actual matches. In addition, a different configuration is obtained each time a player crosses one of the borders between player zones, yet such adjacent configurations are often semantically similar. For example, for the defending team, 7-4-0-0-0 is tactically very much the same as 8-3-0-0-0, meaning that most players are in their own defensive box and some in DefMid.
In order to cope with this large number of states, a clustering procedure was applied to identify clusters of similar configurations based on the training matches. Hence, the resulting tactical classification will assign an expert state to each cluster, as opposed to each configuration, which greatly reduces the complexity. Afterward, the clustering and corresponding tactical classification can be applied to the configurations identified in new games.
Tuples are first transformed by differencing to the adjacent tuple element (0 in case of the starting element). Implementing these transformed tuples facilitates capturing the differences between the tuple elements, which subsequently improves clustering results. Next, for each ball zone, we apply the KMedoids clustering algorithm (Han, 2001) on the obtained pairs of transformed tuples. In contrast to the common KMeans clustering algorithm, KMedoids has the advantage that the medoid tuple of each cluster is an actual configuration that appeared in the data, which can be used to inspect and represent each cluster. Additionally, we use the sum of the absolute distances (L1) rather than the Euclidean (L2) distance as a distance metric. This improves clustering performance since L2 might be susceptible to overestimating individual outliers (Sureja et al., 2022) in our transformed tuples. The optimal number of clusters between [1, 20] for each ball zone is set by using the elbow method. This approach attempts to identify the optimal number of clusters after which any additional clusters only add marginal improvements to the model fit. To do so, we use the “Kneedle” algorithm (Satopaa et al., 2011) to mathematically find the point of maximum curvature in the elbow curve (i.e., inertia as a function of the number of clusters).
As a result of this step, we obtain representative clusters of player positioning of both teams for each ball zone. In order to derive a mapping between the obtained prototypical clusters and the expert state system, i.e., what we will call the “translation table”, we apply the rules of the expert state system to each pair of 5-tuples within each cluster for the matches in the training set. Hence, for each pair of 5-tuples, we obtain a tactical state defined by the hand-crafted expert state system. Afterward, a cluster is represented by (1) its medoid pair of 5-tuples, which illustrates which prototypical positioning situation this cluster represents, (2) the majority vote among the labels of the hand-crafted expert state system given to all pairs of 5-tuples within this cluster, and (3) a probabilistic vote among the labels of the hand-crafted state system given to all pairs of 5-tuples within this cluster. The latter two illustrate which tactical state the cluster represents, either by inspecting the majority vote of the labels or their distribution. For example, the majority vote of a cluster could indicate that it primarily includes pairs of 5-tuples involved in a build-up against a mid-block, while the probabilistic vote can yield a more fine-grained view by showing that a build-up against a mid-block encompasses 75% of the cluster and a progression against a mid-block encompasses the remaining 25%.
The translation table can be applied to new games by (1) determining the ball zone and pair of 5-tuples for each one-second window within a regular play possession, (2) applying the identified clustering (i.e., for each identified pair of 5-tuples, determining the nearest medoid across all prototypical clusters of the respective identified ball zone), and (3) extracting either the majority vote or probabilistic vote among the labels within the cluster associated with the identified nearest medoid. Hence, in case a pair of tuples was not originally included in the translation table, the state classification will be derived from the most similar/nearest cluster. In summary, this procedure allows us to determine a distinct tactical state for any pair of tuples based on the translation table.
Assessment of agreement
To assess the performance or the quality of the automatic state detection framework, we used observational methods. A trained observer produced second-wise match protocols for the twelve matches of the test set based on recordings of the regular TV coverage of these matches. Within the observational match protocol, the prevalent tactical state was recorded and annotated on a per-second basis. Similarly, periods with no clear possession (NCP) of either team and periods where the ball was out of play or out of bounds (OOP) were recorded. An equivalent match protocol was produced using the framework outlined in the section above. Subsequently, both protocols were time-aligned to allow for evaluating the detection quality in terms of inter-rater reliability. Periods where the available TV footage did not allow for assessing the prevalent tactical state or the in-game status, for example during close-up shots or when a replay was shown (177 s on average per match), were excluded from the evaluation.
For the evaluation, a second-wise comparison was chosen. We applied a tolerance margin of ±2 s regarding the positive detection of a tactical state. This is motivated by the premise that a manual annotation inherently produces a certain temporal variance in detecting a state. This is due to the observer needing to rely on the match clock shown in the TV footage for time reference as well as perceptional inconsistencies for observing the onset of a state. Thus, a perfect temporal alignment between the manual annotation and the automatic classification model cannot be expected.
In addition, the choice of a ±2 s tolerance margin is justified because we are primarily interested in the occurrence of a tactical state and less in its exact duration. Nevertheless, the chosen tolerance margin is sufficiently narrow to detect actual incorrect classifications.
Agreement between automatic and observed classification was quantified using precision, recall, and F1-scores per state on a per-second basis.
Baseline comparison
The automatic detection of tactical states is compared against three baseline methods. A first baseline (i.e., LOGREG-TUPLE) uses a logistic regression model to predict the tactical state associated with each one-second window, represented by the average ball zone and player configuration. Hence, the same preprocessing is applied, and this baseline thus uses the exact same representation as the proposed clustering procedure. A second baseline (i.e., LOGREG-RAW) uses a logistic regression model to predict the tactical state and/or NCP/OOP situation associated with each one-second window, represented by the average ball location and average player locations. Hence, this baseline does not use the proposed preprocessing and instead attempts to learn the state classification from the raw positional data, which allows for assessing the influence of the preprocessing and zone representations. A third baseline (i.e., RULE-BASED) applies a rule-based classifier that is constructed using the same rules as defined in the expert state system. Similar to the LOGREG-TUPLE baseline, this baseline uses the exact same representation as the proposed clustering procedure.
Results
Example state detection
First, we illustrate the result obtained through the automatic state detection on a possession sequence from one of the test games. Table 2 gives a second-by-second overview of the possession sequence and includes the retrieved ball zones, pairs of 5-tuples, and the predicted tactical state.
Exemplary game sequence including tuple pair and predicted state.

The automatic state detection shows that this possession sequence first evolves from a horizontal build-up vs. mid-block into a transitional attacking play during which the opposition team falls back into a low block. Eventually, the sequence transitions into attacking play with box occupation.
Preprocessing and state detection statistics
Table 3 presents descriptive statistics for the game time removed due to the ball being out of play and out of bounds (OOP) and game time in no clear possession (NCP) as well as the remaining net playing time in clear possessions (ICP) for the three training and twelve test matches. The table also shows the respective percentage of OOP, NCO, and ICP in terms of overall game time. Overall game time was 95 min and 35 s on average. Removing out-of-bounds and out-of-play periods results in a mean net playing time of 53 min and 15 s.
Descriptive statistics for game time variables (min) and their percentage in terms of overall game time.
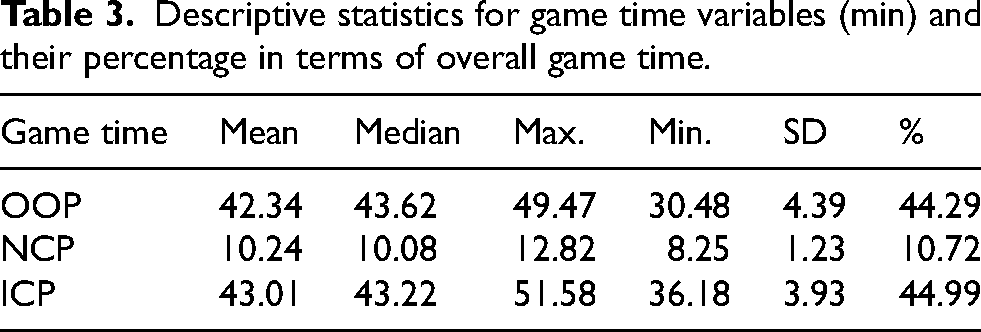
Additionally, the requirement of a three-second minimum duration for possession sequences led to the removal of 106 possession sequences on average under this threshold. This reduces the mean number of recorded possession sequences from 329 to 224.
Figure 3 displays the average game time covered by OOP and NCP phases as well as individual states in terms of percentage of overall game time. Table 4 illustrates descriptive statistics for the automatic state detections in the six test games as well as the state's percentage in terms of net playing time in clear possessions.

Percentage of overall game time (%) covered by OOP, NCP and individual states.
Descriptive statistics (in minutes) for automatic state detections and percentage of each state in terms of all states detected across all 12 test matches.
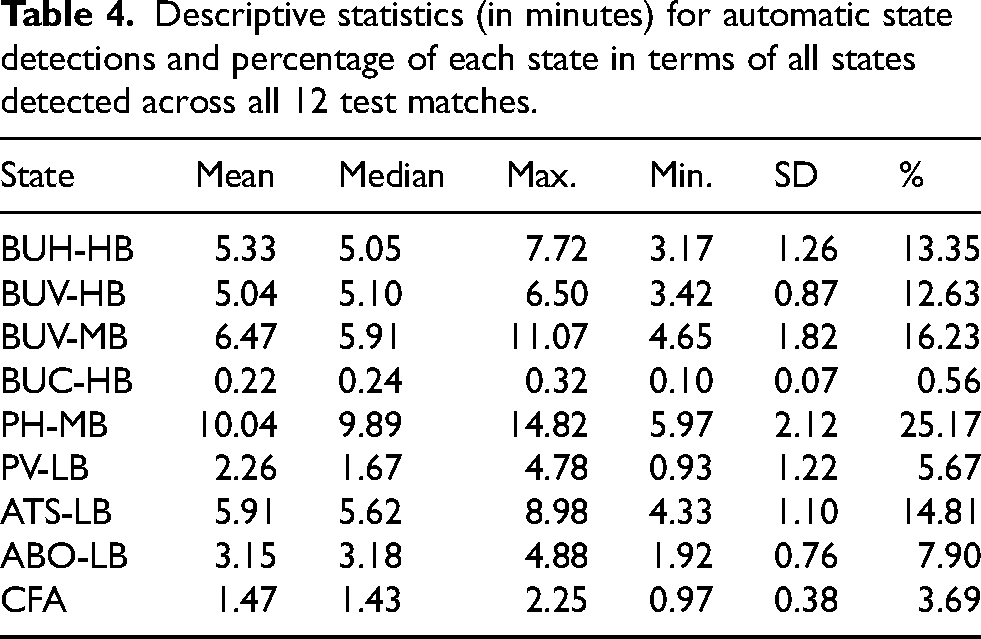
In total, all variations of build-up states make up the greatest proportion of states (42.77%), followed by progression (30.85%), attacking play states (22.69%), and counter/fast attack (3.69%). The most prevalent individual state is horizontal progression vs. mid-block (25.18%) while the state exhibiting the lowest prevalence is counter build up vs. high-block (0.56%).
Clustering procedure
We analyze the obtained prototypical clusters by (1) globally inspecting the obtained number of clusters per ball zone, and (2) locally inspecting the results of the elbow method and the obtained clusters for exemplary ball zones. In addition, we evaluate the methodology by analyzing a number of design choices of the clustering procedure.
Figure 4 provides a global overview of the optimal number of prototypical clusters identified per ball zone. Typically, the number of identified clusters within a ball zone is either 4 or 5, with ball zone 11 being an outlier having 7 identified clusters.

The total number of prototypical clusters identified per ball zone.
Figure 5 illustrates the results of the elbow method used to determine the optimal number of prototypical clusters. The results are illustrated for three exemplary ball zones: zone 1 (a zone on the side of the pitch close to the corner, having the typical number of identified clusters), zone 5 (a central zone slightly higher up the pitch, having the typical number of identified clusters), and zone 11 (a central zone high up the pitch, having a higher number of identified clusters than typical). The results of the elbow method for the other ball zones can be found in Figure A1 the Appendix.

The elbow plot for ball zone 1 (top-left), ball zone 5 (top-right), and ball zone 11 (bottom). The blue curve shows the decrease in inertia with an increasing number of clusters. The vertical red line indicates the optimal number of clusters using the elbow method.
Figure 6 visualizes a 2D PCA decomposition of the clustered player configurations for two exemplary ball zones: zone 6 (a zone in the build-up region) and zone 11 (a zone in the attacking region). For ball zone 6, the approach identifies five prototypical clusters concerning the three different types of build-ups against the two different types of defensive setups. For ball zone 11, seven prototypical clusters are identified, concerning the three different types of attacking play against a low block of the defending team.
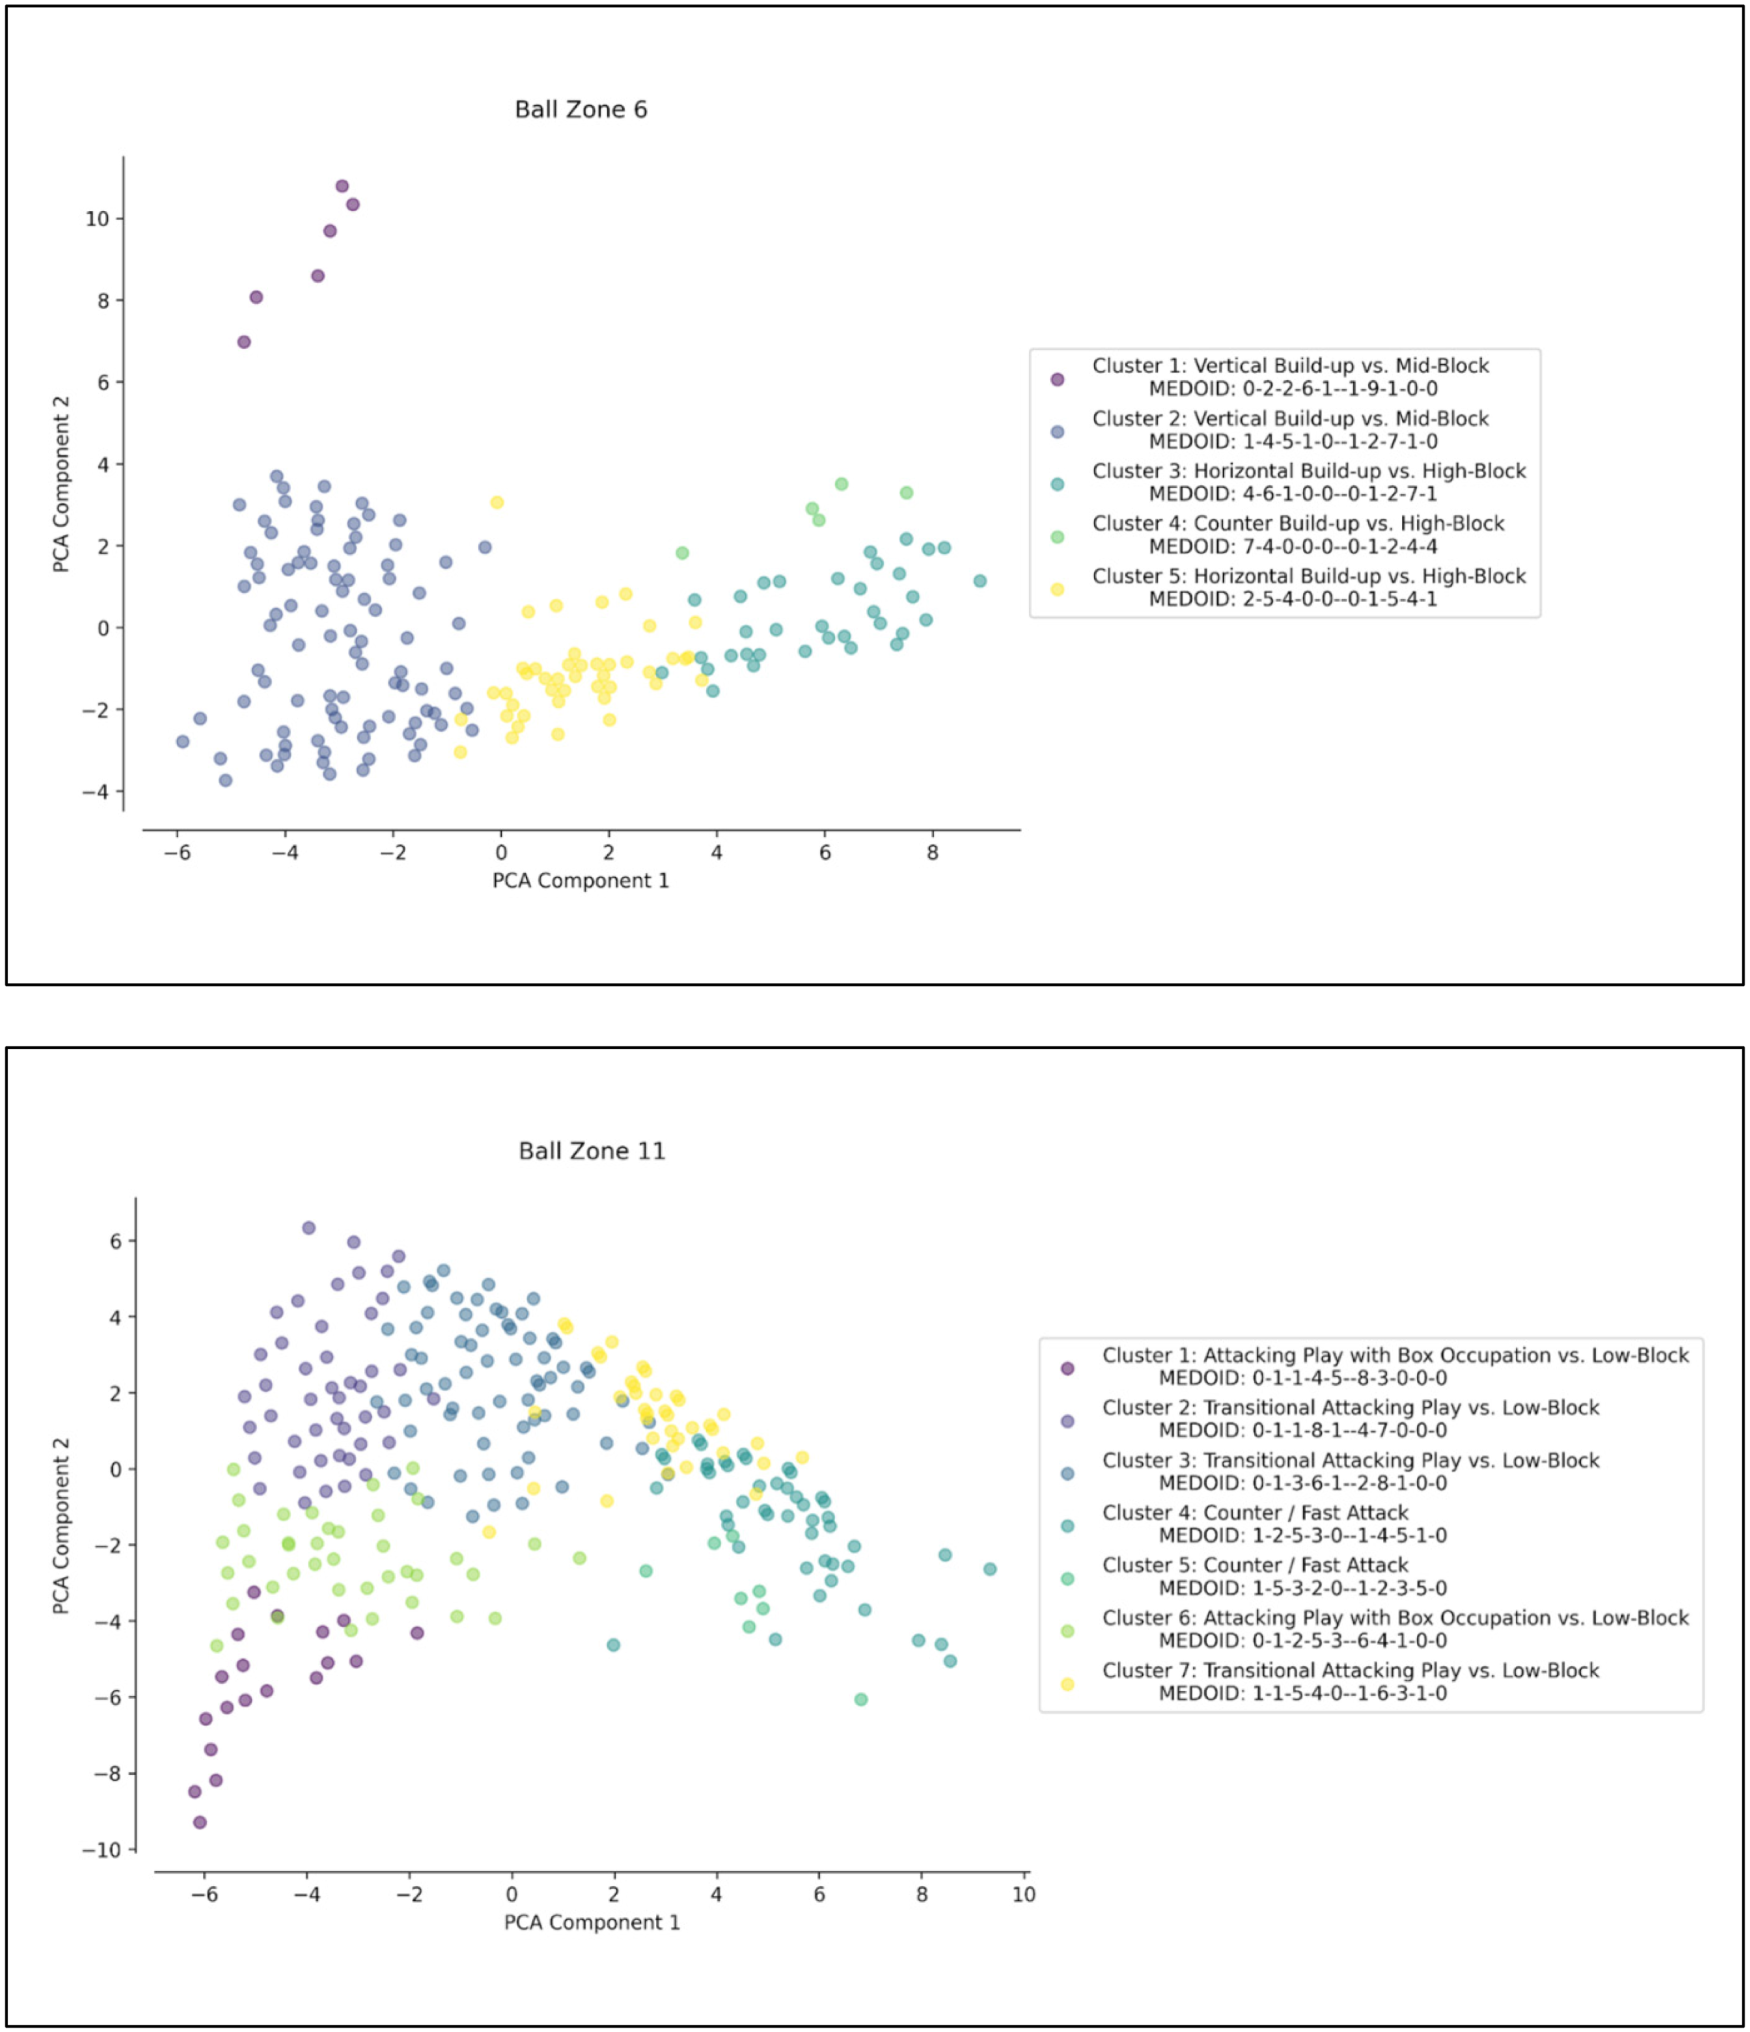
Visualization of a 2D PCA decomposition of the clustered player configurations in ball zone 6 (top) and 11 (bottom). Each dot represents a player configuration. The player configurations are compressed using PCA to allow for visualization in 2D and colored according to their corresponding identified cluster. For each cluster, the majority vote tactical state and the medoid player configuration are mentioned.
Finally, we evaluate the design choices of the proposed clustering methodology. In particular, we analyze the effect of the tuple representation and the choice of distance function. Table 5 summarizes the Silhouette scores for the obtained clustering within each ball zone in four different scenarios: L1 & transformed tuples (our proposed approach), L1 & original/non-transformed tuples, L2 & transformed tuples, and L2 & original/non-transformed tuples.
Silhouette scores for the clustering procedure when using different distance functions (L1 or L2) and different tuple representations (with or without transforming). Higher scores are better.

Assessment of agreement
Detailed results for the agreement between the proposed automatic detection of tactical states with the ground truth obtained by observational analysis are shown in Table 6. The detection of NCP and OOP both yield F1-scores >0.9. Agreement for tactical states ranges from 0.76–0.96. Weaker F1-scores of 0.76 and 0.84 were found for the two most infrequent states Counter Build-up vs. High-Block and Counter/Fast Attack.
Validation results for the automatic detection of states.

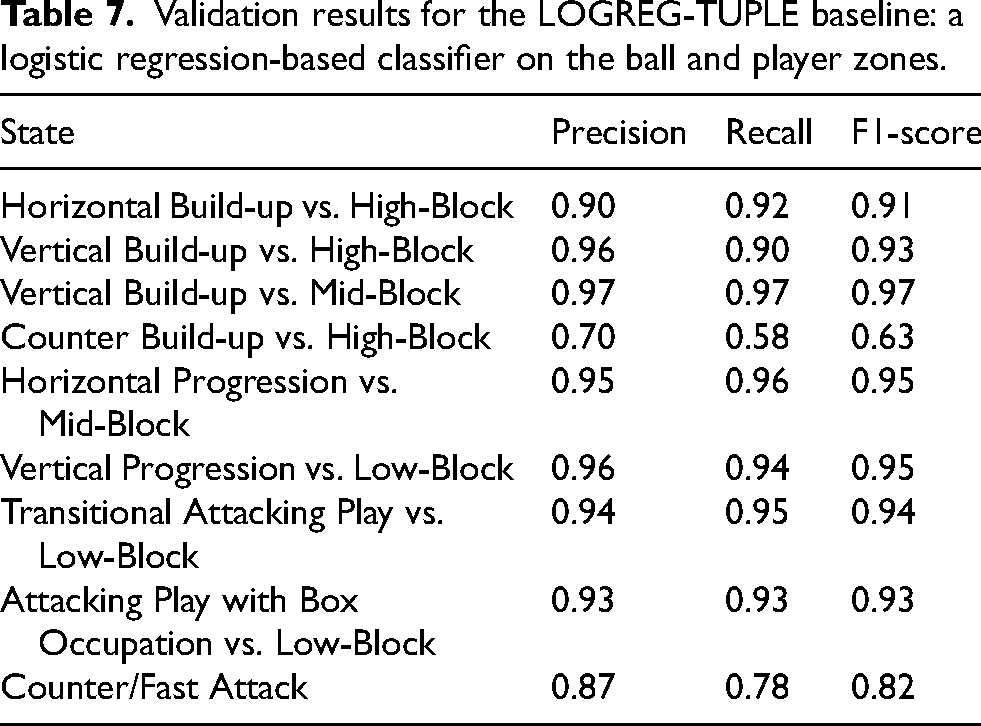
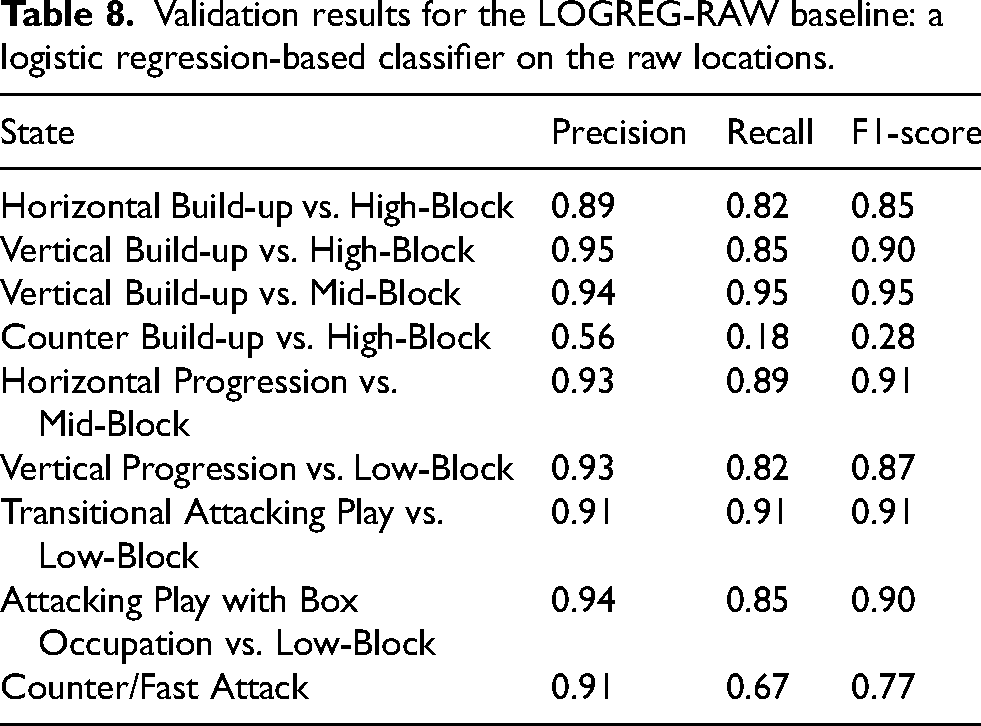
Tables 7–9 report the results for the agreement between each baseline and the ground truth obtained by observational analysis. The detection of NCP and OOP both yield F1-scores > 0.85. Agreement for tactical states ranges from 0.63–0.97 (LOGREG-TUPLE), 0.28–0.95 (LOGREG-RAW), and 0.12–0.93 (RULE-BASED). In all cases, weak F1-scores were found for the two most infrequent states “Counter Build-up vs. High-Block” and “Counter/Fast Attack”. In addition, the LOGREG-RAW baseline struggles to detect the state “Horizontal Build-up vs. High-Block” and “Vertical Progression vs. Low-Block”, while the RULE-BASED baseline also performs poorly at detecting “Horizontal Build-up vs. High-Block” and “Horizontal Progression vs. Mid-Block”.
Validation results for the LOGREG-TUPLE baseline: a logistic regression-based classifier on the ball and player zones.
Validation results for the LOGREG-RAW baseline: a logistic regression-based classifier on the raw locations.
Validation results for the RULE-BASED baseline: a rule-based classifier based on the rules of the expert system.

On average, the LOGREG-RAW and RULE-BASED baselines have an overall worse performance compared to the proposed clustering approach, with a precision of 0.89 (LOGREG-RAW), and 0.87 (RULE-BASED) vs. 0.93 (clustering approach), a recall of 0.81 (LOGREG-RAW), and 0.78 (RULE-BASED) vs. 0.91 (clustering approach), and a macro F1 of 0.84 (LOGREG-RAW), and 0.79 (RULE-BASED) vs. 0.92 (clustering approach). The LOGREG-TUPLE baseline appears a strong contender with an average precision of 0.92, average recall of 0.89, and macro F1 of 0.90. However, especially regarding the two most infrequent states, the proposed clustering approach appears to outperform all considered baselines.
Discussion
Expert state system
Although there are no universally accepted definitions for the underlying phases of play (Jerome et al., 2024), the hand-crafted expert state system we introduce in the scope of this work is based on existing phases of play models (Bauer et al., 2023; FIFA, 2023; Jerome et al., 2024). In addition, our main idea is to define states using the players’ distribution over the field and the location of the ball. If this is successfully achieved, the state definitions rely only on player and ball positions, which are readily available for automatic state detection.
At the first level, we distinguish four basic phases of play in ball possession (Build-up, Progression, Attacking Play, and Counter/Fast Attack) and three basic phases out of possession (high-, mid-, and low-block). The in-possession phases are further differentiated. For build-up and progression, we distinguish between a horizontal and vertical focus. For attacking play, we introduce two states reflecting the degree of box occupation by the attacking team. Finally, the sub-states of the in-possession team and the out-of-possession team are combined. Note that not each combination makes sense and counter/fast attack is defined independently of defense block type.
Thus, we arrive at a state system comprising nine states. This is more differentiated than common phases of play systems. On the other hand, nine states (18 for the two teams together) are still convenient to deal with. Admittedly, this state system is still highly abstract as many tactical details, e.g., the question of which players (playing positions) are located in the different zones or the specifics of their interactions for progressing the ball, are not mapped.
The idea of systematically combining the states of the in-possession team and the out-of-possession team aims to catch the tactical interaction between the teams. It reflects their defensive and offensive playing styles with respect to their preferred block location (high, mid, low) and line-up orientation in ball possession (vertical/horizontal).
Assessment of configurations
As is frequently found in literature, grids are introduced to locate areas on the pitch (Clijmans et al., 2022; Hirotsu et al., 2024; Liu and Hohmann, 2013; Liu et al., 2022; Van Roy et al., 2023). There are no binding specifications on the number and extension of these grids. In the literature, we find rather coarse-grained grids using 9 (Hirotsu et al., 2024) or 12 (Liu et al., 2022) zones divided over three or four width-wise partitioned bands. On the other hand, there are some suggestions for very fine-grained grids using e.g., 192 zones (Clijmans et al., 2022). The latter approach is suited mainly when a very precise representation of the ball position is required. However, this approach is too fine-grained to attribute a distinct tactical meaning to individual cells. Moreover, these approaches solely consider the ball position and ignore the locations of other players. Considering this could provide additional insight into the tactical situation, e.g., in terms of the pressure applied by the defensive team or positioning of teammates in relation to the ball carrier.
We have chosen five player zones (DefBox, DefMid, MidMid, OffMid, OffBox). The vertical sequence of these zones reflects the closeness of the players to their own or the opponent's goal, thus expressing some of the players’ tactical affordances. Dividing the pitch into five player zones is a compromise, allowing for a sufficiently nuanced analysis of the player distribution but also preserving distinct tactical semantics of the zones given by the proximity to the goals. The 15 ball zones are obtained by dividing each player zone into two wings and one central zone, which allows distinguishing between advancing the ball over the wings or through the center.
Specifically, the borders between the zones DefMid/MidMid and MidMid/OffMid were identified by grass stripes. This may be seen as a concession concerning observational validation as this requires having visual clues for zone detection. The same holds for the definition of the most offensive and most defensive zone with the help of the penalty box lines. In principle, working with positional data allows one to define arbitrary zones with specific, possibly curved, areas, e.g., based on a model on promising shooting distance for the most offensive and defensive zone.
Based on the player zones, player configurations are captured as 5-tuple pairs where each element in an individual 5-tuple represents the number of players in the corresponding player zones from DefBox to OffBox. Figure 2 shows a bird's eye view of the player and ball positions. There is a good correspondence between the pairs of 5-tuples and the actual tactical state.
Although this method allows for a good approximation of the tactical situation during the corresponding game sequence, it is also limited to some extent by the rigid zone borders. This is especially evident when a few players change position close to the border between two player zones. Depending on the specific criteria, this may induce a change in the assigned tactical state even though the collective formation only moved up or down the pitch slightly, which does not necessarily equal a change in the underlying tactical context. Similarly, 5-tuple pairs do not allow for inferring distances between individual players or the compactness of their formation. This needs to be taken into account when applying this framework for analyzing games.
Training and testing phase
For the three matches included in the training set, a translation table between the obtained clusters of player configurations and the hand-crafted expert state system was derived by applying the rule-based criteria of the state system to the found pairs of 5-tuples. To ensure representing the widest possible range of player configurations, teams of varying strength and with different playing styles were included in the training set. The large number of possible pairs of 5-tuples (511 × 511) results in an extensive theoretical state space, while only a fraction of this state space will be covered within individual matches. Therefore, to deal with the large number of possible configurations, a clustering procedure was implemented to aggregate similar micro-configurations per ball zone, and each cluster was associated with a tactical state. This resulted in a cluster-based translation table, which enables the detection of tactical states in new matches. The proposed method is likewise relatively robust to misdetections resulting from small differences in underlying micro-configurations as state classifications are derived from clusters.
An occasional issue in the training phase, which occurred in a minor percentage of clusters, was inconsistencies in the tactical states associated with 5-tuple pairs within the same cluster. In these cases, the tactical state of a cluster was determined by the majority vote state. This seems to be acceptable as the clustering procedure collects only similar configurations that are well represented by the majority state of the cluster.
In the testing phase, first, the correct possession phases for the twelve test matches were extracted according to the rules described above. New configurations, which must be expected given the extensive potential state space, were matched to the cluster in the translation table with the closest cluster medoid for a given ball zone. Thus, new configurations were associated with their tactical state by detecting the most similar cluster in the training set and corresponding tactical state in the translation table. This procedure allows for an automatic detection of tactical states based entirely on positional data of players and the ball.
Preprocessing and state detection statistics
The analysis of the twelve test matches provides a first insight into the frequencies and durations of OOP and NCP phases as well as the nine tactical states of our state system (Tables 3 and 4, Figure 3). Since the positional data we used did not include specific flags for out-of-play and out-of-bounds situations, these sequences had to be removed during preprocessing. In contrast to approaches that detect team formations, we did not exclude playing time after throw-ins. While throw-ins may influence the compactness or lateral shift of the configuration of players, the influence on the distribution of players over the five vertical zones is arguably negligible. Moreover, if a team retains possession after a throw-in, tactical behavior is mostly comparable to regular match play in the same position. The remaining net playing time of 53 min and 15 s corresponds to findings from the literature, e.g., by Link and Hoernig (2017).
The omission of NCP phases led to an additional removal of around 10 min from the regular net playing time per match. However, this should not impede the tactical state results. In this regard, the removed possession sequences under the specified minimum duration of three seconds mostly correspond to situations where a possession gain occurs, followed by an immediate loss of possession. In addition, dropping the first three seconds after a ball possession may be acceptable if the priority is detecting the overall tactical states in a match. Typically, after a loss of possession, players need a short period of time to adapt their positioning to the new tactical situation. These micro-transitions are highly situational and may therefore be excluded from an analysis of general tactical states.
Concerning tactical states, teams spent most time in build-up states, followed by progression, attacking play, and counter/fast attack states. Although our state system is partially based on existing phases of play models, drawing comparisons to prior research is not meaningful as different definitions of states and state-granularity are employed in comparable studies.
However, it should be highlighted that the frequency of the state Counter build-up vs. high-block might point to a potential need for adapting the state system. With an average of only 14 s of game time across all test games, this state was scarcely detected. While this was expected to some extent due to the state's inherent occurrence after turnovers, the detection of this state might have been impacted more severely by the removal of possession time and sequences as initially expected. Arguably, this implies a certain numerical instability which could be problematic for drawing tactical conclusions.
Clustering procedure
The global analysis of the clustering procedure provides insights into the number of prototypical clusters that are detected within each ball zone. Across the pitch, the total number of clusters within a ball zone does not drastically differ, with 4 or 5 clusters being the most common, and one zone having a higher number of 7 identified clusters. This indicates that, within each ball zone, there is a notable variance in the detected player configurations. This is to be expected, as teams will not stick to one fixed player configuration within a particular ball zone, but vary this according to the game context. Yet, there is no drastic difference in variation across the pitch, besides the slightly higher number of clusters identified for ball zone 11. This higher variance in player configurations seems reasonable as this zone is located centrally in the attacking half in which various offensive and defensive tactical situations can occur. Regarding (dis)similarity on opposite sides of the pitch, the procedure identifies a similar number of clusters for ball zones on the left and right sides of the pitch. This indicates a rather balanced use of player configurations on both sides.
The local analysis of the elbow method provides insights into the selection of the optimal number of clusters for each ball zone. The results shown for ball zones 1, 5, and 11 are representative for the other ball zones. For most ball zones, the “elbow” in the curve is found at four or five clusters, after which the decrease in inertia becomes increasingly smaller for each added cluster. For ball zone 11, which is the zone with the highest number of identified clusters, the inertia sharply decreases in a similar way until roughly four clusters, after which it appears to taper off before sharply decreasing again at seven clusters. Hence, indicating that an additional seventh cluster appears to fit the player configurations in the training data better.
Visualizing how the various player configurations within a ball zone are clustered can provide insights into the coherences and differences amongst the clusters. The results shown for ball zone 6 indicate that two clusters concerning the tactical state “Vertical Build-up vs. Mid-Block” are distinguished by the clustering procedure. It identifies two variations of this tactical state with one generally occurring higher up the pitch (i.e., Cluster 1) than the other (i.e., Cluster 2), as can be seen by the occupied zones in the medoid pair of 5-tuples. Similarly, the two clusters concerning the tactical state “Horizontal Build-up vs. High-Block” are distinguished by the clustering procedure as one involving more (fewer) players of the offensive (defensive) team higher up the pitch (i.e., Cluster 5) compared to the other (i.e., Cluster 3). Similar observations can be made for ball zone 11 (and the other ball zones). Two clusters concern the tactical state “Attacking Play with Box Occupation vs. Low-Block”, with one being slightly more concentrated in OffBox (i.e., Cluster 1) than the other (i.e., Cluster 6). Three clusters concern the tactical state “Transitional Attacking Play vs. Low-Block” and two clusters concern the tactical state “Counter/Fast Attack”, for which the difference again can be found in how high up the pitch and how spread out both teams play. This identified variation in the tactical states could explain why the elbow curve showed an additional drop in inertia for this ball zone, as the method attempts to distinguish between these tactical variations. Additionally, this identified variation in the proposed tactical states for the various ball zones might indicate that a further refinement of the expert state system based on playing height and width could be a possible avenue to explore next.
Finally, by inspecting the quality of the cluster fit across various design choices, the effect of the proposed tuple representation and distance function can be analyzed. Using L1 as a distance metric is found to globally perform better than L2. The latter appears susceptible to individual outliers, of which there might be present as the preprocessing of OOP/NCP is not perfect. Additionally, the difference between transformed and original tuples is not universally better for one or the other in the case of L2. However, when using L1, using the transformed tuples clearly increases the performance across all ball zones. By transforming the tuples to include the “trend” between the different player zones, it appears that the characteristics of the tuples can be better distinguished.
Assessment of agreement
In terms of our framework for automatically detecting tactical states, results for agreement with the manual match protocols are generally sufficient to infer a high-quality detection. This is evidenced by resulting F1-scores close to 0.9 in all but two states. Especially the most frequent states showed a very high F1-score (F1 > 0.95). Weaker F1-scores were present for the states counter build-up vs. high block and counter/fast attack. These states are disproportionately affected by the removal of ball possession time after turnovers as well as particularly short possession sequences due to the relatively short duration of these states and the fact that they mainly occur after turnovers. This especially applies to counter build-up as mentioned above. Additionally, within the manual match protocol, possession sequences were identified manually. This may lead to earlier identification of ball possession or the consideration of sequences that are subject to removal in the preprocessing of positional data. Thereby, actual occurrences of these states might not be identified as ball possession even though a team was actually in control of the ball.
One issue concerning counter build-up specifically is misidentifications of turnovers, which is highlighted by the comparatively low precision score. While scarce overall, these mostly occur during contested attacking play sequences when a player from the defending team interferes with the ball, thereby specifically affecting ball zones where the state counter build-up might occur after a turnover. This may lead to the false detection of a short possession sequence or an early detection of the beginning of a possession sequence. Since the defending team is typically positioned in a low block during such instances, where the player configuration can be similar to a counter build-up situation, this may result in a false detection of the latter.
Furthermore, a counter or fast attack is particularly difficult to detect based on positional configurations alone. Therefore, the rule-based criteria of this state mainly rely on a comparatively spread distribution of players in contrast to other states, as outlined in Table 1. While this criterion arguably works well for identifying this state, it is less distinct than the criteria for the other states. A potential work-around for this issue would be to additionally use the ball speed for identifying counter/fast attack, as e.g., demonstrated by Jerome et al. (2024).
The proposed procedure clearly outperforms two of the three proposed baseline approaches. A logistic regression-based baseline on the zone and tuple representations is a strong contender yet drops in performance on the two most infrequent states. In such cases, the proposed procedure appears more robust, hence justifying the proposed methodological complexity. The analysis of the baseline approaches showed that the inclusion of preprocessing for detecting OOP/NCP improves predictive performance. While detecting OOP from raw location data is relatively easy, detecting NCP is not. Additionally, while we explicitly account for a period of return to regular play using the three second cut-off, this period of unclear play is not easily identified by a classifier based on raw locations. Similarly, the representation of the ball and player locations as zones and tuples also improves predictive performance compared to using raw locations. This can partially be explained by the abstraction introduced by the proposed zones, thereby reducing the influence of noise in the data. Finally, the clustering step also improves upon a rule-based methodology applied to individual tuples. The latter is not robust to misdetections that result from small differences in the underlying configurations, whereas this is a strong point for the clustering-based approach which is able to correct this by deriving the majority vote from the clusters.
There are certain limitations to our framework for automatically detecting states. While the quality of detection has been demonstrated for a set of twelve test games of the 2021/2022 Bundesliga season, applicability of the framework to other seasons and different leagues remains to be tested. To that end, it might also be beneficial to expand the translation table with games from other leagues to ensure a higher resilience when using it for more diverse datasets. Likewise, it might be necessary to update the translation table in regular intervals to account for changes in tactical behavior over time.
Conclusion and outlook
In this study, we introduce a hand-crafted expert state system which builds on existing phases of play models and incorporates the tactical behavior of the in and out of possession team. In addition, operational criteria using the number of players in specific zones on the pitch and the ball location were developed. The presented state system incorporates states that serve as equivalence classes for distinct tactical situations and, in the future, may be used for state transition modelling in football. Additionally, we developed a corresponding framework for automatically detecting these states based on the positional configuration of players and the ball location. Positional configurations are recorded as 5-tuples, clustered and associated with a state based on the previously developed operational criteria to form a translation table, which serves as the basis for detecting states in new games. This framework is reliably able to detect states in new matches, thereby showing potential for a variety of applications in performance analysis or sports analytics, while omitting the need for time-consuming manual labeling of game situations. Future work should investigate the applicability of the framework to a more diverse set of games, e.g., including games from multiple seasons and leagues.
Footnotes
Acknowledgments
We want to extend our gratitude to KINEXON Sports & Media GmbH for providing the raw data set used in this study.
Ethical approval statement
Not applicable
Informed consent
Not applicable
Consent for publication
Not applicable
Author contributions
FR contributed to the conceptualization and design of the study, data processing and analysis as well as writing and editing of the manuscript. MVR contributed to the conceptualization and design of the study, data processing and analysis as well as writing and editing of the manuscript. GP provided the data of the study in scope of his position and responsibility at this time and contributed to its interpretation and processing. JD co-supervised the study, contributed to the conceptualization and design of the study, writing and editing of the manuscript. ML co-supervised the study, contributed to the conceptualization and design of the study, writing and editing of the manuscript.
Funding statement
The authors disclosed receipt of the following financial support for the publication of this article: The publication of this study was supported by the Technical University Munich within the framework of the Open Access Publishing Program. Furthermore, this research was supported by the Flemish Government under the “Onderzoeksprogramma Artificiële Intelligentie (AI) Vlaanderen” program (MVR, JD), the Research Foundation Flanders (FWO 12A4326N to MVR), and KU Leuven Research Fund (C14/24/091 to JD).
Declaration of conflicting interests
The authors declared no potential conflicts of interest with respect to the research, authorship, and/or publication of this article.
Data availability
Raw data was provided by courtesy of KINEXON Sports & Media GmbH and cannot be re-distributed in accordance with the corresponding agreement.
Notes
Appendix
This appendix provides the additional results of the elbow method and clustering visualization.