
Abstract
Stealing a base in baseball involves risk but can create scoring opportunities. We evaluate the effectiveness of double steal attempts–in which two runners attempt to steal bases simultaneously–using observational play-by-play data from Major League Baseball spanning 1980 to 2022, plus the 2023 season following significant rule changes. Our outcome is run value, which measures the change in expected runs resulting from a play. To estimate the causal effect of a double steal attempt across different base-runner configurations, we apply propensity score methods adapted from the personalized medicine literature, specifically inverse probability of treatment weighting. We find that double steals with runners on 1st base and 2nd base are associated with increased run value, especially in 2023. In contrast, double steal attempts with runners on 1st base and 3rd base show no consistent benefit. These findings suggest that, although the double steal may be underutilized in Major League Baseball, it may be a valuable strategy when applied in the right context.
Keywords
Introduction
Motivation
Baseball is always evolving. Rule changes in Major League Baseball (MLB) have caused many changes in play, especially in the last couple of years. Changes to the 2023 season included a pitch timer, defensive shift restrictions, and bigger bases (for details, see Castrovince 2023). We believe some of these new rule changes have led to an increase in stealing attempts and an increase in attempted double steals (Castrovince, 2023). As these rule changes influencing play are recent, there has not been much published research on the effects on stealing yet. However, this apparent increase in stealing piqued our interest in double steals. Why are double steals rare? Does the potential success of a double steal outweigh the potential consequences of base runners caught stealing? Should teams reconsider their seemingly low usage of the double steal strategy?
A double steal occurs when two runners on base both attempt to steal a base in the same play. The double steal occurs most frequently with runners on 1st base and 2nd base and runners on 1st base and 3rd base. With runners on 1st base and 3rd base, the runner stealing 2nd base potentially draws the attention of the defense and the ball away from home plate, allowing the runner on 3rd base a better opportunity to steal home. If both runners succeed, then the team has scored a run and moved the trailing runner into scoring position. Even if the runner stealing 2nd base is caught stealing, at least with less than two outs the offensive team could score a run. Worst case scenario is a double play where both runners are caught stealing and two outs are recorded.
Similarly, if a double steal is attempted with runners on 1st base and 2nd base, the potential consequences are that the offensive team now has two runners in scoring position, one runner advances and one runner is caught, or both runners are caught stealing, resulting in two outs and potentially the end of the inning. In the event of a poor throw or other defensive miscue, a double steal attempt with runners on 1st base and 2nd base could lead to one or two runs scored. Does the risk of an out, and a double play as the worst case, outweigh these potential successes from the double steal attempt? In the less egregious consequence, is it disadvantageous to give up an out to score a run when runners are on 1st base and 3rd base? Or advance a runner to 3rd base in the latter case of runners on 1st base and 2nd base? Double steals are rare, but this base running strategy can be the difference between winning and losing in a close game.
Randomized controlled trials are the gold standard for quantifying treatment effects. Randomization creates balance between measured and unmeasured variables among the control and treatment group, reducing the effects of selection bias. We aim to study whether and when it is advantageous for the offense to execute a double steal (the “treatment” here). As researchers investigating the double steals, we suspect we would not be allowed to flip a coin during a MLB game to decide whether to tell runners in a particular situation to attempt a double steal or not. More bluntly, we cannot run randomized controlled trials during MLB games.
We are thus in the situation of an observational study – the players and coaches voluntarily choose whether to steal or not (i.e., whether to fall in the treatment group or the control group). A voluntary treatment assignment has potential for inducing selection bias. For example, teams may be more willing to deploy a double steal with better base stealers or against a pitcher-catcher tandem who is poor at holding and ultimately catching runners. Is a measured positive impact of a double steal then due to the strategy (attempt) or due to the prowess of the runner or the ineptitude of the pitcher-catcher tandem? A random treatment assignment will balance these differences across treatment and control groups. In an observational study we do not have such a luxury. A successful approach to this problem in the personalized medicine literature (Austin and Stuart, 2015) is to mimic a randomized controlled trial by matching or weighting on the likelihood of a double steal (or propensity for volunteering into the treatment group). We will detail propensity score methods, particularly inverse probability of treatment weighting, to quantify the impact of the double steal as a base running strategy.
Literature review
To our knowledge, most papers in the literature focus on stealing a single base, not the double steal strategy of stealing two bases simultaneously. In an article posted on the Baseball Prospectus website, Fox (2007) examined the frequency of double steals, their success rate, and potential impact on run expectancy. Fox’s work was prompted by a comment from Lou Piniella, then manager of the Chicago Cubs, regarding the underutilized potential of the double steal. Fox tabulated the frequency and success rate of double steal attempts by team from 1970 to 2007 (excluding 1999). Across that span, 79% of attempts occurred with runners on 1st base and 2nd base, 19% with runners on 1st base and 3rd base, and 2% with runners on 2nd base and 3rd base. He found that the frequency of double steals per 162 games remained fairly steady at 8 to 12 steals per season through 1986, rose above 17 steals per season from 1987 to 1995, and then declined to 7 to 9 steals per season from 1996 to 2003. He also reported that success rates varied with the number of outs but remained generally stable over time. In our review, we found that articles and blogs addressing double steals primarily report summary statistics such as frequencies and success rates, with little focus on estimating effect size or strategic value.
While our study focuses specifically on double steal attempts, we acknowledge a broader body of literature on base stealing. McMurray (2015) provided a historical account of stolen base trends across eras, noting the rise, fall, and resurgence of aggressive base running strategies in MLB. Several papers assessed the impact of base stealing on team performance, using a regression model on wins or win percentage (Demmink, 2010; Pavitt, 2011) and simulating run production (Baumer, 2009). More recently, Stanley (2023) developed classification models to predict the success of a single stolen base attempt using pitch-level features and player characteristics. These studies focused on modeling outcomes or success probabilities associated with individual or aggregate stolen base behavior. In contrast, our study aims to estimate the causal effect of a specific base running strategy, the double steal, on run value, using propensity score weighting methods. Our approach is motivated by recent rule changes in MLB and by the relative lack of work quantifying the situational effectiveness of the double steal, though recent work by Perez and Showalter (2024) highlights renewed interest in base stealing under the new rules. Additional simulation and situational analyses have also explored the strategic value of aggressive base running, though none to our knowledge isolate the causal effect of double steals using inverse probability weighting.
Like stealing, bunting is a strategy used in baseball to try to advance a runner into scoring position (excluding the squeeze bunt). When successful, a sacrifice bunt can increase the probability of scoring a run; when unsuccessful, it results in one or two outs. Lopez and Evans (2019) used propensity score methods to match bunting attempts with non-attempts, using observational MLB data to estimate the impact of bunting. Confounding factors that influence bunt success include batter and runner speed, hitting ability, defensive positioning, and other game context variables. Lopez and Evans used propensity score weighting to balance covariates between bunt and non-bunt plays and estimated the average treatment effect of the bunt. This line of reasoning motivates our use of causal inference methods to evaluate the double steal strategy.
The goal of this paper is to employ observational study techniques to quantify the impact of the double steal and suggest scenarios in which it may be advantageous for the offense. Since there are limited publications on double steals in MLB, we also draw on related work from other sports that implement causal inference frameworks. Wu et al. (2021) evaluated the effectiveness of crossing the ball in soccer; Yam and Lopez (2019) studied NFL fourth down decisions; and Toumi and Lopez (2019) investigated zone-entry strategies in the NHL. These studies use propensity score methods to evaluate risky but potentially high-value strategies under varying game contexts. Stealing a base is similar to crossing the ball: if successful, it improves scoring chances; if not, it can reduce them. In soccer, failed crosses outnumber successful ones, often fueling debate about their use. Stealing and crossing both involve trade-offs that may sway the outcome of a close game, depending on situational factors.
Paper outline
The primary goals of the paper are as follows:
Exploratory data analysis: explore the double steal strategy via frequencies, run expectancy, and run value. Causal inference: estimate the impact of the double steal (treatment effect) using propensity score methods. The new state of the MLB game: evaluate the impact of the double steal after the MLB rule changes for the 2023 season.
In Section “Data set”, we introduce the data. In Section “Methods”, we define run expectancy and run value in addition to explaining observational studies, propensity scores, and inverse probability treatment weighting. In Section “Exploratory data analysis”, we present an exploratory data analysis as a first pass on the impact of double steals with respect to run expectancy and run values. In Section “Estimating treatment effect”, we estimate the treatment effect, inferring the relationship between the double steal attempt and run values in different base running situations. In Section “The 2023 season”, we extend our analyses to data from 2023 after the MLB rule changes. In Section “Conclusion”, we conclude the paper with a summary of our findings and possible extensions for future analyses.
Data set
We collected play-by-play data from the 1980 to 2023 MLB seasons from Retrosheet, a charitable organization focused on providing as much data as available about both National League and American League baseball games dating as far back as 1871 (Retrosheet, 2024). Over about the last century, 1917 to 2023, Retrosheet has compiled complete play-by-play data (Retrosheet, 2024). However to mimic the time span of Fox (2007), we chose a period of about the last 40 years, excluding the pandemic season. We chose to remove the 2020 MLB season from our data set since Covid-19 greatly impacted this season, an outlier in terms of number of games played and even strategies and runs to the post-season relative to seasons since 1980. Initially, the data scraped from Retrosheet contained 121 variables, but not all were relevant to our desired analyses. After cleaning the data and generating player statistics from the original play-by-play data, we were left with 18 variables. For a complete list and description of these variables, see Table 1.
Variable descriptions with summary statistics for 1980 to 2022 excluding 2020.
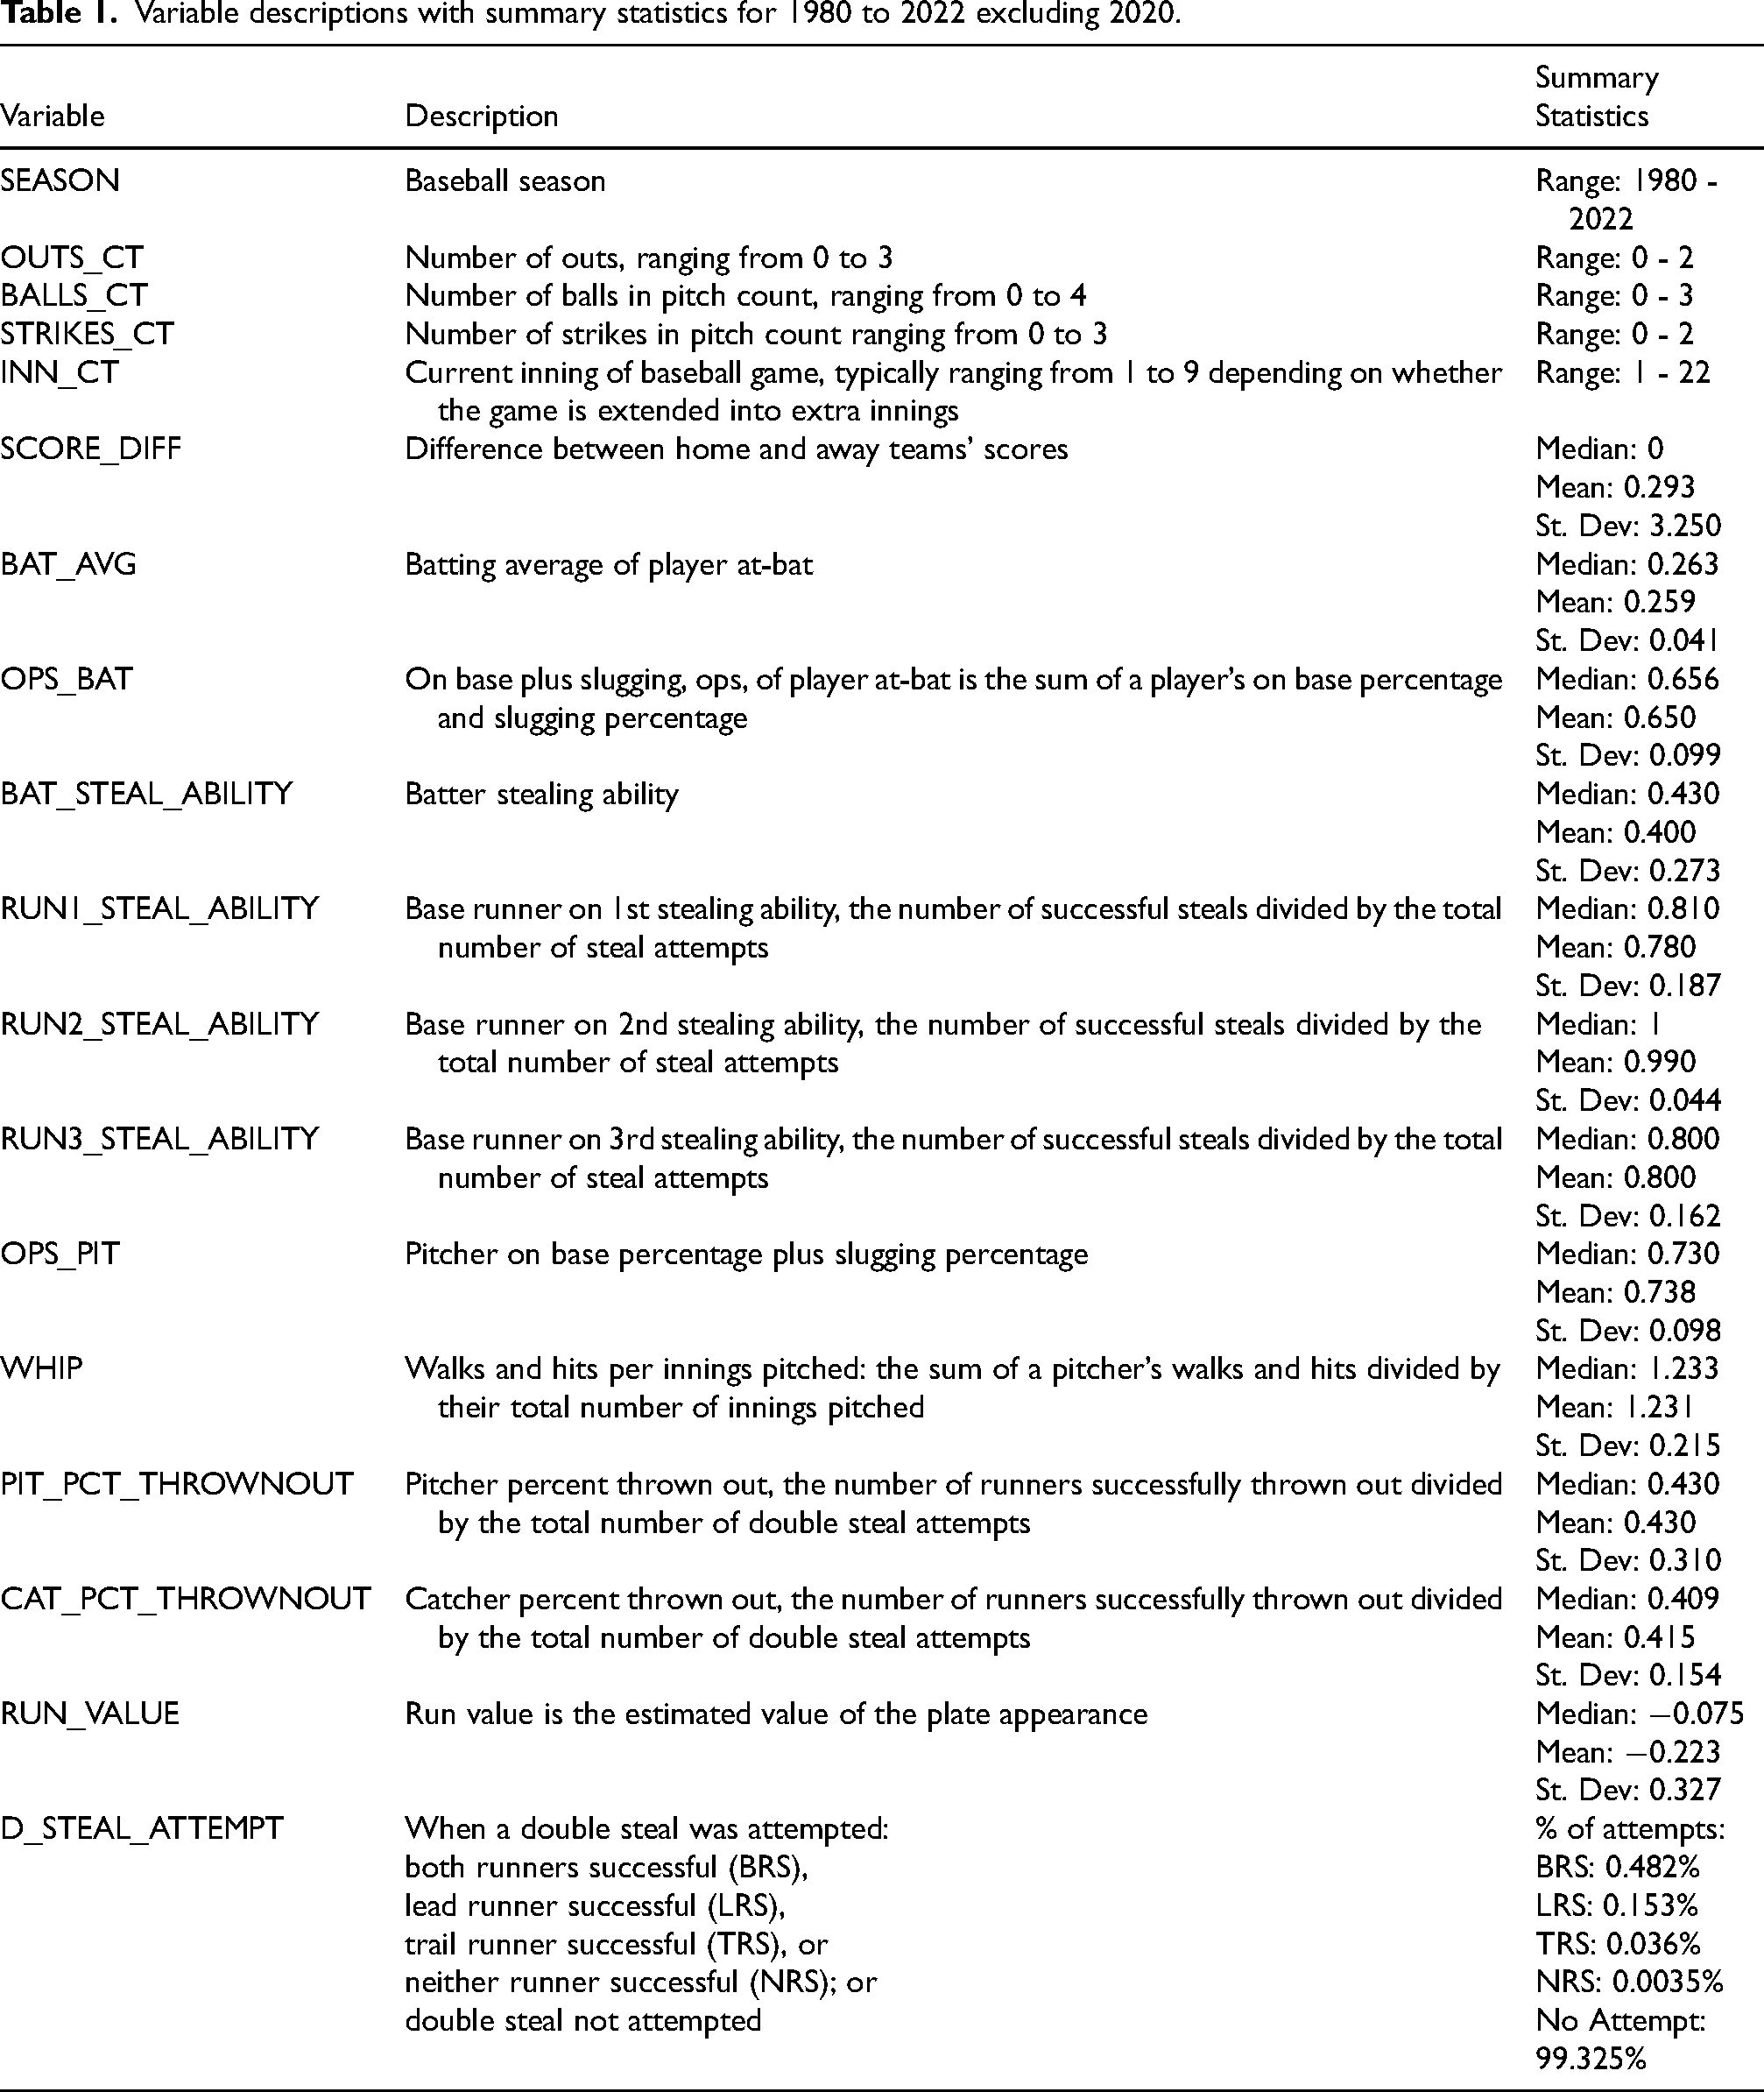
We filtered the data for plays where two runners are on base: runners on 1st base and 2nd base, runners on 2nd base and 3rd base, or runners on 1st base and 3rd base. Each observation, or each play, can be classified as a double steal attempt or no double steal attempt, our treatment. The outcome of interest is run value which will be defined in Section “Methods”. In our exploratory data analysis, we look at the benefits and risks of a double steal relative to the four possible consequences of the steal attempt. This exploration provides a first look at the impact of a double steal on run value as we head towards estimating a treatment effect.
We define the following terminology to identify the scenarios considered in our analyses:
Treatment: double steal attempt (binary, yes or no) Outcome: run value (continuous; will be defined in Section “Methods”) Double steal consequences (four): both runners successfully steal, the lead runner successfully steals (and trail runner is caught), the trail runner successfully steals (and the lead runner is caught), both runners are caught stealing. Comparison of interest (treatment effect): no double steal attempt against a double steal attempt regardless of consequence. States defining base occupancy and number of outs (six): 110 0, 110 1, 110 2, 101 0, 101 1, 101 2, where this four-digit code identifies the location of the runners on base and the current number of outs; for example, a state of 110 0 tells us that there are runners on 1st base and 2nd base and that there are no outs in the inning. Base occupancy situations (two considered): in parts of the exposition, we discuss only the two situations of runners on base when a double steal is attempted without mention of the number of outs in the inning; 110 (runners on 1st base and 2nd base) and 101 (runners on 1st base and 3rd base).
Table 2 presents the frequencies of double steal attempts by state for the double steal consequences. In the 110 situation there were only 12 instances (5 with zero outs and 7 with one out) where neither runner was successful and in the 101 situation there were only 19 instances (1 with zero outs and 18 with one out) where neither runner was successful; to conserve space we do not include these counts in Table 2. Table 3 presents the frequency distribution of double steal attempt consequences by situation, 110 (runners on 1st base and 2nd base) and 101 (runners on 1st base and 3rd base). Table 3 also includes counts for no double steal attempt. Less than one-percent of the plays were a double steal attempt, relative to no attempt in either situation. The most common double steal consequences were both runners successful and only trail runner successful, and the consequence of neither runner successful was infrequent. Since the double steal attempt counts for runners on 2nd base and 3rd base are very low (112 attempts; 1.8% of all double steal attempts), we omitted them from Table 2. Out of the observed double steal attempts, 75.6% have runners on 1st base and 2nd base (situation 110) and 22.6% have runners on 1st base and 3rd base (situation 101).
Counts table for 1980 to 2022 excluding 2020 categorized by runners’ positions and number of outs.

For example, the count of the cell “Both Runners Successful” 110 0 and 000 0 is 4. The starting state before the successful double steal was runners on 1st base and 2nd base and after the successful double steal both runners scored so there were no runners left on base and still no outs.
Frequency distributions of double steal attempts where both runners are successful (BRS), only the lead runner is successful (LRS), only the trail runner is successful (TRS), and neither runner is successful (NRS), as well as no double steal attempted.

The frequency distributions are presented separately for the situations of runners on 1st base and 2nd base (110) and runners on 1st base and 3rd base (101).
Methods
We split the analysis into different situations based on having two runners on base. We initially investigated three situations: runners on 1st base and 2nd base, runners on 2nd base and 3rd base, and runners on 1st base and 3rd base. We dropped the case of runners on 2nd base and 3rd base from our analysis due to small sample size for reliable inferences.

Run expectancy and run value
Run expectancy is usually discussed in the context of a run expectancy matrix, in which each cell represents one of the 24 potential combinations of runners on base and number of outs (Albert et al., 2024). Each of these potential combinations can be classified as a unique state, combining the information of the location of runners on the bases and the current number of outs in a four digit code defined in Section “Data set”. The individual run expectancies filling the matrix are the average runs scored in what remains of the inning for each state. As explained by Albert et al. (2024), calculating the run expectancy matrix first requires computing the runs scored in the remainder of the inning, defined as
Run expectancy changes when the state changes. For instance, if the state at the start of an at-bat is runners on 1st base and 2nd base with 1 out (110 1), then a play occurs, such as the batter being struck out, the new state is runners on 1st base and 2nd base with 2 outs (110 2). The run expectancy for the remainder of that inning has changed. Run value (RV) measures this change by comparing the run expectancy (RE) of the old state, or state before the play, to the run expectancy (RE) of the new state, or the state after the play, while also considering the number of runs (R) scored on the play, if any (Albert et al., 2024),
Observational studies and propensity scores
Our goal is to estimate the average treatment effect (ATE), namely the expected difference in run value between double steal attempts (treatment) and no double steal attempt (control) for situations of baserunners on 1st base and 2nd base and baserunners on 1st base and 3rd base. Specifically, using the notation of Austin and Stuart (2015), denote the binary treatment indicator as
The average treatment effect is the expected value of the treatment effect 

Although the ATT reflects the effect among the subset of plays where a double steal was actually attempted, our focus on the ATE is intentional. The goal of this study is to assess whether double steals may be underused and whether they could be beneficial in a broader set of eligible game situations. Estimating the ATE allows us to evaluate the potential impact of applying the double steal strategy more widely, beyond the limited contexts in which it has historically been used. This perspective aligns with how coaches might reconsider their in-game decision-making under the new MLB rules that encourage more aggressive base running.
Experiments, such as randomized controlled trials, implement randomization to balance unobserved and observed variables between a treatment and control group; we are then able to obtain an unbiased estimate of the ATE (Austin and Stuart, 2015). However the play-by-play data collected from Retrosheet is observational data. We did not have any influence over whether runners attempted to double steal or not, and in particular we were not able to implement any randomization schemes in the assignment of treatment, making this an observational study (Gilmartin-Thomas et al., 2018). Propensity scores allow us to balance variables across the treatment and control observations to estimate treatment effects, or in other words perform causal inference (Heller et al., 2010).
Given an observation, the propensity score is the probability that the observation has been treated conditioned on observed variables (Kranker et al., 2021). In our case, the propensity score is the probability on a given play that a double steal was attempted conditioned on the inning, number of outs, batting average, OPS, and other variables. The propensity score is defined as
Inverse probability of treatment weighting (IPTW) implemented in regression modeling allows for the estimation of average treatment effects (ATE) (Austin and Stuart, 2015; Olmos and Govindasamy, 2015). Specifically, we weight each play using stabilized weights defined by
Stabilization improves the finite-sample variance properties of the estimated treatment effect by reducing the variance inflation caused by extreme inverse propensity scores, thereby enhancing the precision and robustness of the weighted regression estimator (Hernán and Robins, 2020). To further limit the impact of extreme weights, we truncate weights at the 1st and 99th percentiles. The weighted regression of run value on treatment and the covariates listed in Table 1 is then used to estimate the ATE comparing double steal attempts to non-attempts.
We estimate the average treatment effect using inverse probability of treatment weighting (IPTW) in a weighted linear regression model, with weights derived from estimated propensity scores. To obtain valid standard errors for inference, we compute robust sandwich variance estimators using the sandwich and lmtest packages in R (Zeileis, 2004; Zeileis and Hothorn, 2002; Zeileis et al., 2020) after fitting the weighted regression with the lm() function. Inferences remain reliable under this approach even with estimated propensity scores and large weights, and are recommended for observational studies (Austin and Stuart, 2015; Hernán and Robins, 2020).
To estimate causal effects using propensity scores, four key assumptions must be satisfied: exchangeability, consistency, positivity, and correct model specification (Austin and Stuart, 2015).
Exchangeability (also known as conditional ignorability) assumes that, conditional on the observed covariates, treatment assignment is independent of the potential outcomes. This implies that all relevant confounders are measured and included in the propensity score model. In the context of our study, we attempt to meet this assumption by including a rich set of covariates that may influence the decision to attempt a double steal.
Consistency assumes that each unit’s observed outcome under the treatment received is equal to its potential outcome under that treatment. This assumption is reasonable in our setting, as the observed outcome (i.e., the run value of the play) directly reflects the treatment that was actually applied (whether or not a double steal was attempted), with no ambiguity or interference.
Positivity requires that for every combination of covariates included in the propensity score model, the probability of receiving either treatment (a double steal attempt) or control (no attempt) is strictly positive. That is, no covariate pattern should deterministically predict treatment assignment. Violations of this assumption can lead to unstable weights and biased estimates. In our dataset, each observation (play) has a non-zero probability of either treatment condition. To evaluate this assumption, we present histograms of the estimated propensity scores stratified by treatment group in Sections “Estimating treatment effect” and “The 2023 season”. The substantial overlap between the groups suggests that the positivity assumption is satisfied.
Finally, correct specification of the propensity score model assumes that the model used to estimate the propensity scores includes all relevant confounders and correctly captures their functional relationships with treatment assignment. While this assumption cannot be directly verified, a common diagnostic is to evaluate the balance of covariates between treatment groups after weighting. If the propensity score model is well specified, inverse probability weighting should produce similar covariate distributions across groups.
We assess covariate balance using standardized mean differences (SMDs), which provide a scale-invariant measure of group imbalance. Substantial reductions in SMDs after weighting offer indirect evidence that the propensity score model is adequately specified. The absolute standardized mean difference is
where 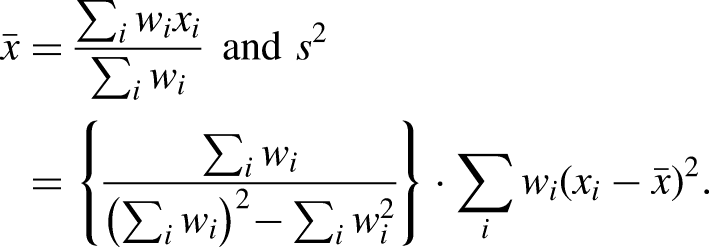
As shown in our analyses in Sections “Estimating treatment effect” and “The 2023 season”, covariate balance was achieved after weighting, supporting the no model misspecification assumption. We found that a logistic regression model provided a good fit for estimating the propensity scores based on the binary treatment indicator. All player metrics (see Table 1) were calculated for the season up to the point of the double steal attempt play. With the assumptions satisfied, we proceed to estimate the average treatment effect (ATE) and draw inferences using the propensity scores via inverse probability treatment weighting.
Exploratory data analysis
Impact of double steals
As articulated in Section “Data set”, there are four consequences of a double steal play, depending on whether both or either runner are successful stealing. In this section, we will explore run expectancies and run values over these consequences as well as that of no double steal attempt.
Table 4 presents the run expectancy matrix for the six states: runners on 1st base and 2nd base (110) and runners on 1st base and 3rd base (101) each with 0, 1, and 2 outs for data from 1980 to 2022 excluding 2020. For each state, the run expectancy increases moving from neither runner successful to only trail runner successful to only lead runner successful to both runners successful across the table. Logically, this trend makes sense because at least one runner should be moving into better scoring positions, if not scoring themselves. For each of the two base occupancy situations (110 and 101), the run expectancy decreases moving from zero outs to two outs down the table for a given state. We next compare run expectancy for the double steal attempt consequences against no attempt.
Run expectancy matrix categorized by double steal attempts where both runners were successful, only the lead runner was successful (and the trail runner caught), only the trail runner was successful (and the lead runner caught), and neither runner was successful as well as no double steal attempt.
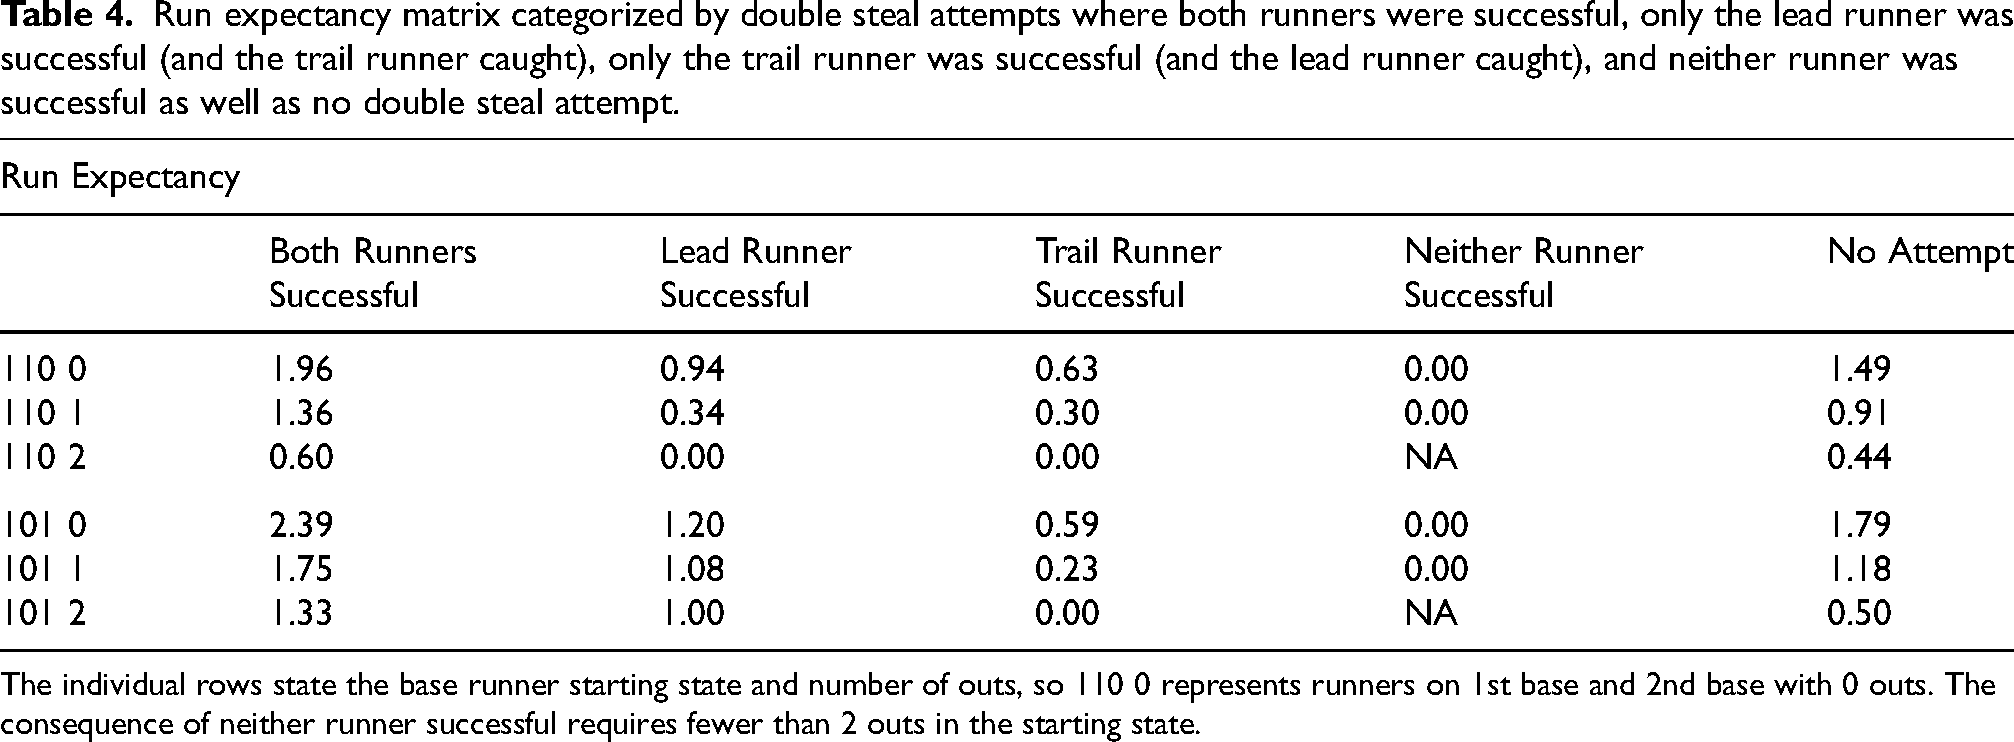
The individual rows state the base runner starting state and number of outs, so 110 0 represents runners on 1st base and 2nd base with 0 outs. The consequence of neither runner successful requires fewer than 2 outs in the starting state.
Table 4 shows that the run expectancy when both runners are successful is greater than that when no attempt is made, in all states except 110 2 almost half-a-run or more. When only one runner is successful, the run expectancy is consistently less than when no double steal is attempted, except in the 101 2 state. In this latter state, the lead runner scores and the trail runner is caught. In all these cases, the runner scored before the out was made, leading to a run expectancy of one run. Though the inning ends after the trail runner is caught stealing, this run expectancy is greater than the 0.5 runs when no double steal is attempted. The consequence of the trail runner caught in the double steal attempt is more harmful in the 110 situation, the run expectancy around half-a-run less, than in the 101 situation. On the other hand, it is slightly more harmful for only the lead runner to be caught in the double steal attempt, compared to no double steal attempt, in the 101 situation than in the 110 situation. In the 101 situation, when only the trail runner is successful, the run expectancies differ from that of no double steal attempt by 1.2, 0.95, and 0.5 runs, whereas in the 110 situation, these differences are 0.86, 0.61, and 0.44 runs moving from zero outs to one out to two outs respectively. The most harmful consequence is neither runner successful in a double steal attempt, where the run expectancies are zero.
In Figure 1, we visualize run expectancies among the four double steal consequences and no double steal attempted for the years 1980 to 2022, excluding 2020. The scatter plot smooth curves confirm our observations from Table 4, run expectancies when both runners are successful are consistently better than not attempting a double steal. The run expectancies when the lead runner is successful are close to those when not attempting a double steal, in the 101 2 state consistently better by half-a-run. When the lead runner is caught, the run expectancies vary, some seasons close to those when no double steal is attempted, but for some seasons more than a half-a-run less. Recall from Tables 2 and 3 that there are very few cases where neither runner is successful, and relative to double steal attempts, the most common consequence is both runners are successful. Given the larger number of double steal attempts with runners on 1st base and 2nd base (4789 in the 110 situation compared to 1430 in the 101 situation), at this point we suspect attempting a double steal may be worth the effort in this situation. However, with runners on 1st base and 3rd base (101 situation), the gain is less clear; the risk may not be worth the reward.

Bubble plots of run expectancy by outs and base occupancy states for double steal attempts where both runners were successful, lead runner was successful (and the trail runner caught), trail runner was successful (and the lead runner caught), and neither runner was successful, as well as no double steal attempt.
In Figure 2, we compare the change in run values among the four double steal attempt consequences for all six states of runners on 1st base and 2nd base and runners on 1st base and 3rd base for 0, 1, and 2 outs. Figure 2 seems to reinforce the potential benefit of a double steal attempt with runners on 1st base and 2nd base (110). In this situation, the run values are almost all positive when both runners are successful stealing. Though there are negative run values for the consequence of one runner caught (either lead or trail runner), there seems to be a larger number of positive run values for the consequence of both runners successful to more than balance it out. However, when runners are on 1st base and 3rd base (101), the run values are almost all negative except with two outs. The larger number of run values below negative one when only the lead runner is successful suggests the potential risk of a double steal in this 101 situation.

Bar plots of run values categorized by base occupancy state; either runners on 1st base and 2nd base or runners on 1st base and 3rd base, and by number of outs.
A historical perspective on double steal prowess
As further motivation of the potential gains of a successful double steal, consider a “back of the envelope calculation” of 
We emphasize that double steal success and failure are observed after a double steal attempt and thus impact the run value outcome. We cannot define treatment in this way, conditioning on a particular consequence, nor draw causal inferences on
Consider a successful double steal attempt as one where both runners successfully steal a base, so a failure is one runner caught stealing or both runners caught stealing (see Figure 2 for the run values). With runners on 1st base and 2nd base (situation 110), the solutions

Overall career steal success rate for individual players in MLB between 1980 and 2022 excluding 2020. Viewed as a frequency distribution (1; top) and as a scatterplot of number of stealing attempts against stealing success rate (2; bottom). Players with no steal attempts have been omitted.

Histograms of the logit-transformed propensity scores for double steal attempts (green) and plays where no double steal was attempted (gray). From left to right, the panels correspond to the 110 and 101 base-running situations during the 1980-2022 period, and the 110 situation for the 2023 season.

Balancing plot for runners on 1st base and 2nd base, comparison of double steal attempt versus no double steal attempt.

Balancing plot for runners on 1st base and 3rd base, comparison of double steal attempt versus no double steal attempt.
With runners on 1st base and 3rd base and two outs (state 101 2), the average run values for successful and failed double steals are both positive, larger than a negative average run value for no attempt, and larger for successful double steals. With runners on 1st base and 3rd base with one out (state 110 1), the average run value for a successful double steal is greater than the average run value for a failed double steal and for no attempt, but all the run values are negative. After this exploration, we continue to think a double steal attempt may be worth the risk with runners on 1st base and 2nd base, but the advantage of a double steal attempt with runners on 1st base and 3rd base is still unclear. We will now draw these inferences in Section “Estimating treatment effect”.
Estimating treatment effect
For each of the two baserunner situations, we used generalized linear modeling to estimate propensity scores and compute the inverse probability of treatment weights. The left two panels of Figure 4 present histograms of the logit-transformed propensity scores for plays with runners on 1st base and 2nd base (110) and runners on 1st base and 3rd base (101), respectively. The histograms show substantial overlap between plays where a double steal was attempted and those where it was not, which supports the positivity assumption required for inverse probability of treatment weighting (IPTW). This overlap indicates that both groups are represented across a common range of covariate patterns, making estimation of the average treatment effect (ATE) via weighting appropriate and stable. We used these weights in a linear regression model on run values to estimate a treatment effect controlling for covariates.
We first consider the situation of runners on 1st base and 2nd base (110). The absolute standardized mean difference (1) for each variable used in the generalized linear model for estimating propensity scores and computing inverse probability of treatment weights is visualized in Figure 5. We can see that after weighting, the absolute standardized mean differences were reduced below the 0.2 threshold, suggested by Heller et al. (2010), for all variables (in fact, less than 0.1). We may conclude that our method for weighting helped to obtain better balance between covariates in the treatment and control groups than in the original data, allowing us to mimic the benefits of a randomized control experiment.
With good balance achieved in the weighted data for runners on 1st base and 2nd base, we fit a regression model of run values on an indicator of whether a double steal was attempted or not, and all other 14 covariates, weighting each play by the inverse probability of treatment weight. The regression inferences are displayed in Table 5. The coefficient estimate for the treatment double steal attempted is 0.15. On average the run value will increase by 0.15 (
Regression inferences for runners on 1st base and 2nd base; treatment effect of double steal attempt against no double steal attempt.

For runners on 1st base and 3rd base, Figure 6 shows that the absolute standardized mean differences for all covariates are reduced after weighting and that all absolute standardized mean differences are below 0.2 (in fact less than 0.1). This finding indicates that we have achieved balance among our variables and can proceed with our regression inferences.
Table 6 presents regression inferences for runners on 1st base and 3rd base. The estimated coefficient for the treatment double steal attempted is
Regression inferences for runners on 1st base and 3rd base; treatment effect of double steal attempt versus no double steal attempt.

The 2023 season
In 2023 MLB increased the size of the bases, added rules on timing between pitches (pitch clock), and limited the number of pick-off attempts by a pitcher to two per plate appearance, among other rule changes. The impetus was to speed up the game and induce more game play action, some of which was to encourage more stealing (Castrovince, 2023). In this section, we analyze double steal attempts in 2023 to study any impact of the rule changes.
Exploratory data analysis, 2023 double steals
Table 7 presents the counts of double steal attempts where both runners are successful, only the lead runner is successful (and the trail runner is caught), or only the trail runner is successful (and the lead runner is caught). The table categorizes counts by initial states of runners on 1st base and 2nd base and runners on 1st base and 3rd base for 0, 1, and 2 outs and by the state after the play. With runners on 1st base and 2nd base (110 situation), the percentage of double steal attempts where both runners were successful in 2023 was twice that of the period 1980 to 2022; the percentage was also slightly larger in 2023 in 101 both runners successful and 101 lead runner successful consequences. Overall 1.4% of 110 situations and 0.6% of 101 situations saw a double steal attempt in 2023, compared to 0.9% and 0.5% in the period 1980 to 2022. Out of the observed double steal attempts, 83.5% had runners on 1st base and 2nd (situation 110) and 15.4% had runners on 1st base and 3rd (situation 101).
Counts table for 2023 categorized by runners’ positions and number of outs.
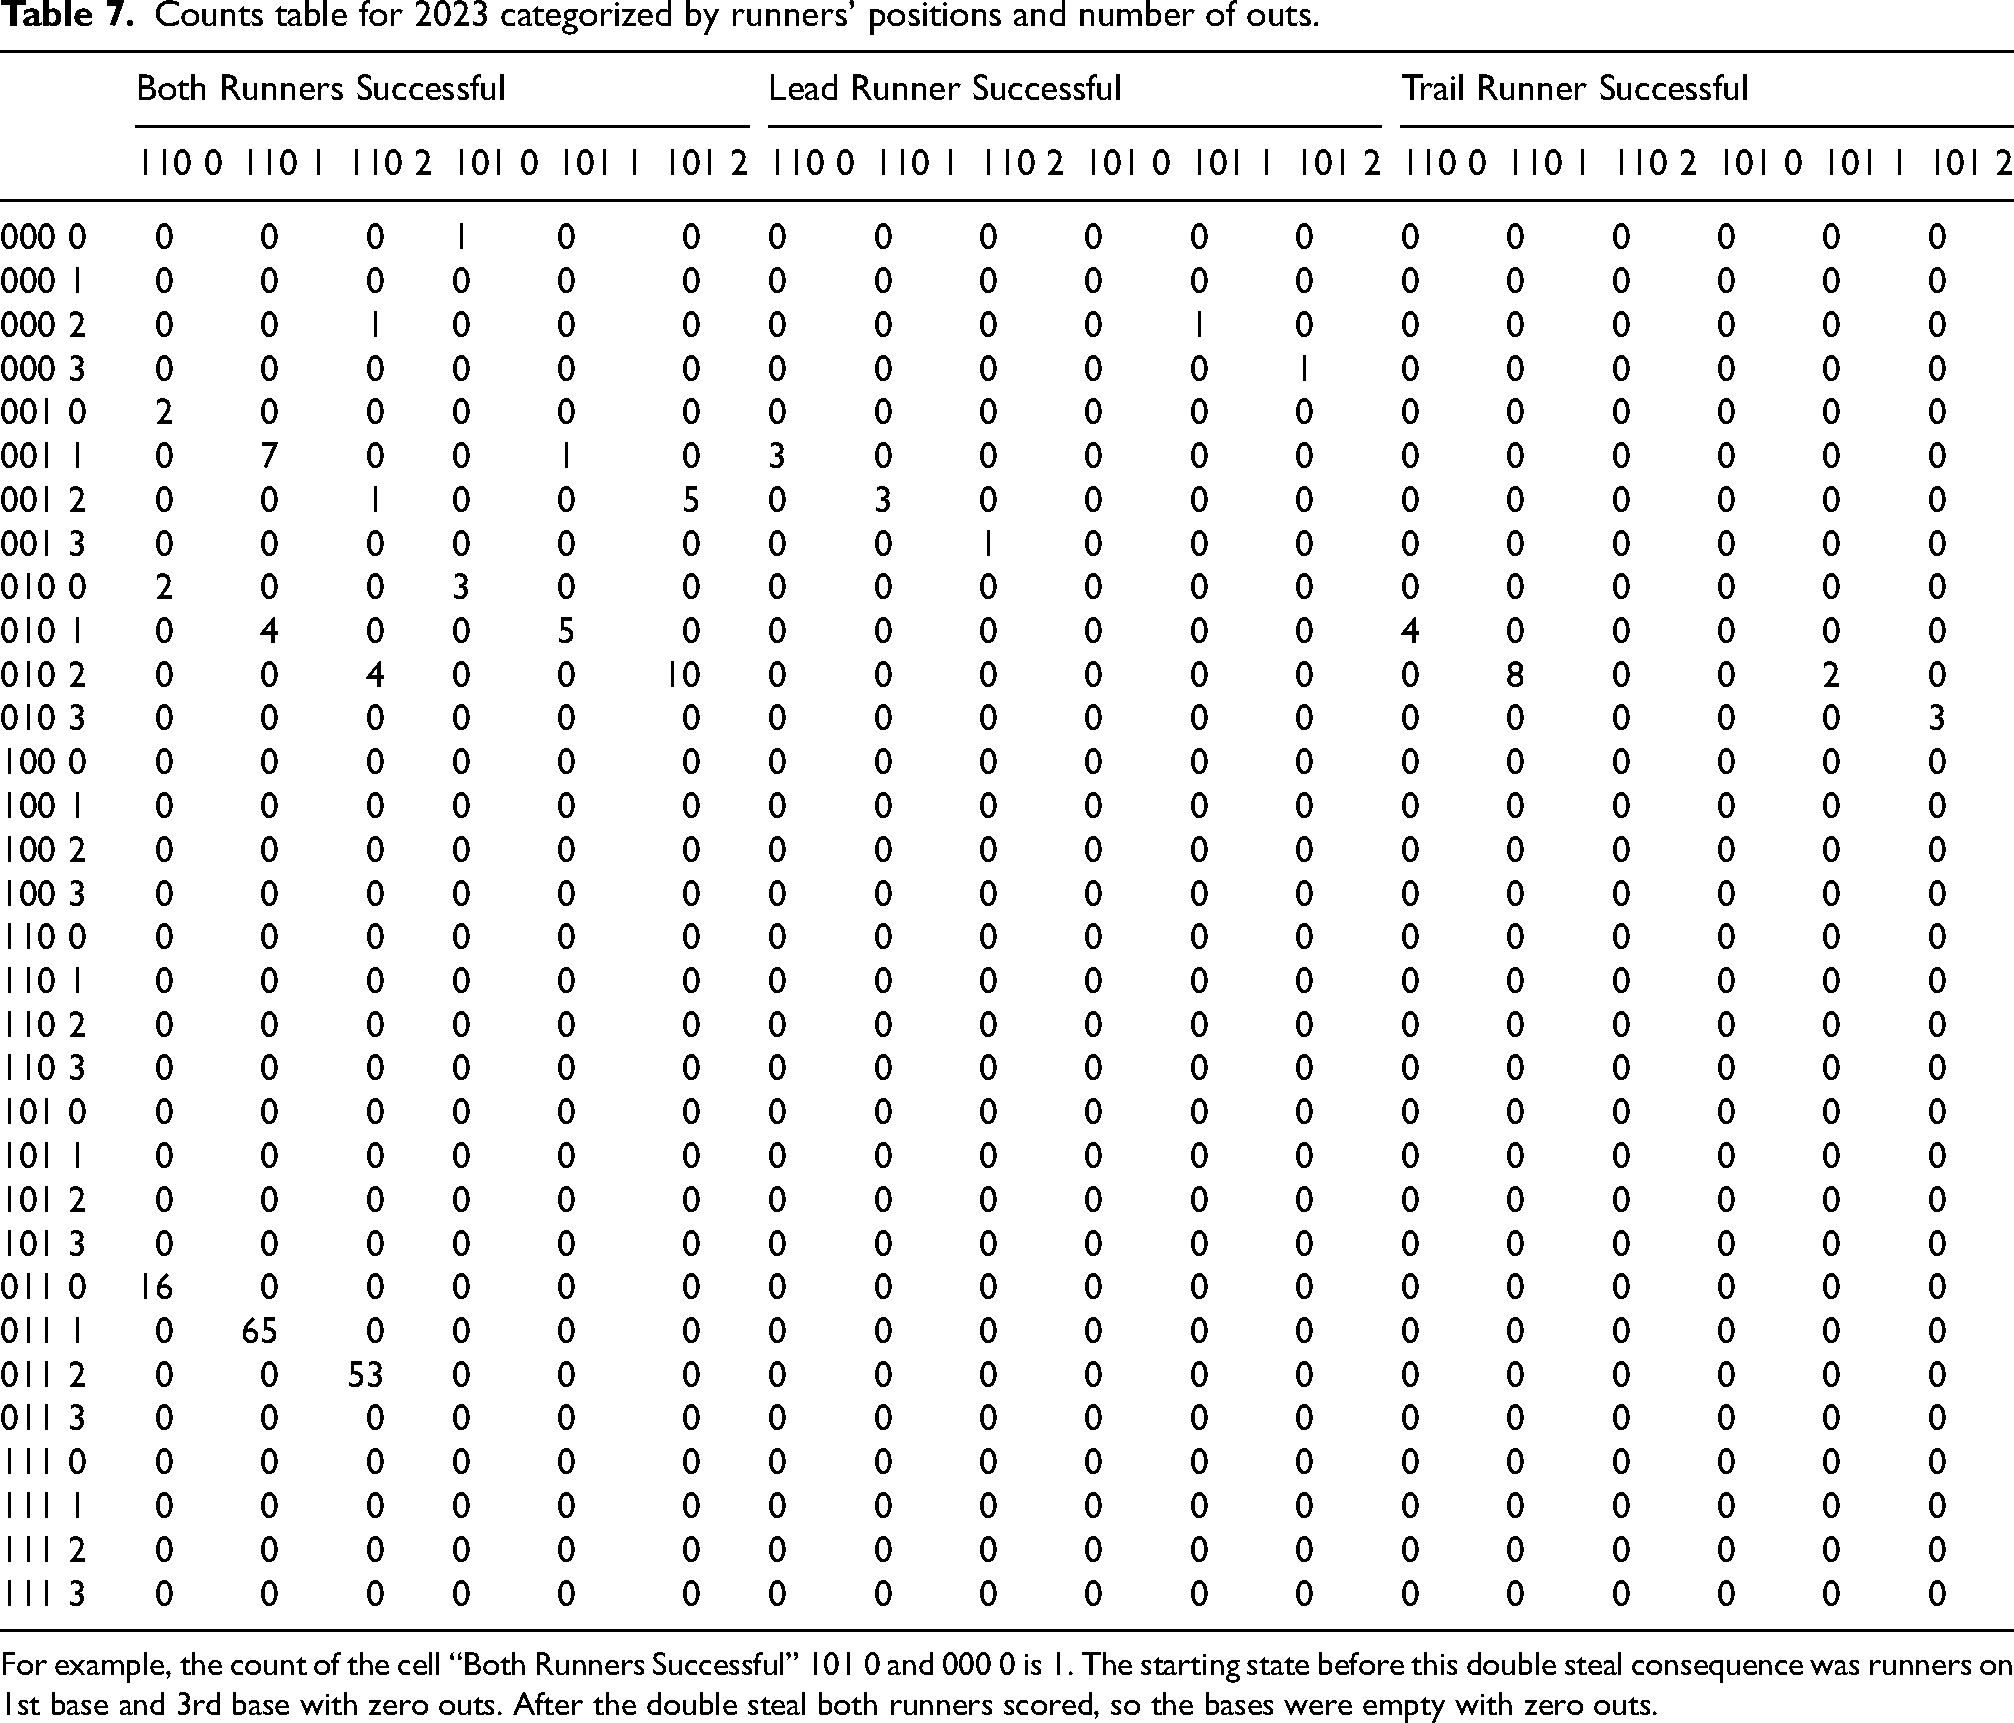
For example, the count of the cell “Both Runners Successful” 101 0 and 000 0 is 1. The starting state before this double steal consequence was runners on 1st base and 3rd base with zero outs. After the double steal both runners scored, so the bases were empty with zero outs.
Table 8 displays the run expectancies for the six base occupancy states for the consequences of a double steal attempt. In 2023, there were no instances of only one runner successful, lead or trail, in the 101 0 state nor of only the trail runner successful in the 110 2 state; these cells are identified with “NA” in Table 8. The run expectancies where both runners were successful on the double steal attempt are highest, trending down to instances of one runner successful and neither runner successful (where available). Compared to the historical run expectancies in Table 4, the run expectancies in 2023 are on par or larger for double steal attempts where both runners are successful, the largest being 3.50 in the 101 0 state (compared to 2.39 prior to 2023). The run expectancies for double steal attempts where only one runner is successful are less than or equal to the analogous historical run expectancies in Table 4, except for the 101 1 state where only the trail runner was successful (though in 2023 only 2 events occurred in this latter state). The run expectancies for no attempt are very similar comparing 2023 to the period 1980-2022, excluding 2020. The potential benefit, an increase in run expectancy after a double steal attempt in 2023, seems to outweigh the potential cost of either runner or both runners being caught.
Run expectancy matrix for 2023 categorized by double steal attempts where both runners were successful, only the lead runner was successful (and the trail runner caught), only the trail runner was successful (and the lead runner caught), and neither runner was successful, as well as no double steal attempt.

The individual rows state the base runner starting state and number of outs, so 101 0 represents runners on 1st base and 3rd base with 0 outs. The NAs indicate states where either no double steals were attempted (see Table 7), or in the states 110 2 and 101 2 the consequence of neither runner successful is impossible.
Consider a successful double steal attempt as one when both runners successfully steal a base, so a failure is one runner caught stealing or both runners caught stealing. In 2023, with runners on 1st base and 2nd base (situation 110), the solution
Estimating treatment effect in 2023
There were only 32 double steal attempts with runners on 1st base and 3rd base (situation 101) and 2 double steal attempts with runners on 2nd base and 3rd base (situation 011). These sample sizes are too small for propensity score weighting regression analysis, we thus focus on the situation of runners on 1st base and 2nd base (situation 110) in the remainder of this section. The rightmost panel of Figure 4 displays substantial overlap in the logit-transformed propensity score distributions between double steal attempts and plays where no attempt was made, supporting the positivity assumption in the 2023 data. In preparation for a regression analysis, the standardized mean difference plot in Figure 7 shows that all variables are balanced after weighting, below the 0.2 threshold.

Balancing plot for runners on 1st base and 2nd base for 2023 double steal attempt versus no double steal attempt.
A double steal attempt leads to an increase of 0.339 in run value (
Conclusion
Even though attempting a double steal can be risky, our analysis suggests that in some situations, the strategy may offer a meaningful advantage. Successfully completing a double steal improves run expectancies and run values as more runners move into scoring position or score. In particular, we find that double steal attempts with runners on 1st base and 2nd base are associated with an increase in run value, whereas attempts with runners on 1st base and 3rd base do not appear to confer a comparable benefit. Following the introduction of new MLB rules in the 2023 season, which encouraged more aggressive base running, the proportion of double steal attempts increased, and the estimated treatment effect with runners on 1st base and 2nd base became even more pronounced. Although double steals are relatively rare and often underutilized, our findings suggest that they can be effective when used selectively. By incorporating contextual factors such as base runner speed, pitcher and catcher defensive ability, pitch count, and base occupancy, coaches can make informed decisions about when to attempt a double steal. Especially in a close game, a well-executed double steal may shift the outcome in a team’s favor.
Although we included the number of outs as a covariate in the propensity score model and confirmed balance after weighting, our treatment effect estimates were averaged over all out states within each base situation. Future work could explore estimating out-specific treatment effects, which may reveal heterogeneity not captured in our marginal estimates.
As new technologies lead to continued growth in player statistics recorded by MLB or publicly available baseball reference websites, future models should work to incorporate these new variables. With more complete data available, there will be more options for potentially deeper dives into (double) steal strategies. This paper provides the framework to enable causal inference to be conducted using observational baseball data, which could be applied in many ways. For example, in future work we hope to extend our analysis to single steals, or steals in general; and produce finer grained analysis relative to counts in an at-bat, score differential, and place in the batting order. We also wish to compare run expectancies and run values for hit-and-run attempts versus straight steals and any advantages to stealing in extra innings.
Footnotes
Funding
The author(s) received no financial support for the research, authorship, and/or publication of this article.
Declaration of conflicting interests
The authors declared no potential conflicts of interest with respect to the research, authorship, and publication of this article.