
Abstract
Resilience has emerged as a pivotal construct in understanding performance sustainability under pressure in professional sport. This study introduces and validates the Team Resilience Index, a novel quantitative tool designed to assess the resilient behavior of professional basketball teams across an entire season, based on competition-derived stressors. Using public data from the Spanish ACB League, the Team Resilience Index was constructed by identifying and quantifying seven key stressors from the literature, experienced by each team and analysing performance outcomes relative to those stressors. Two versions of the index were tested and validated using correlations coefficients and multiple linear regressions. The findings demonstrate that Team Resilience Index offers a reliable and interpretable measure of team resilience, correlating strongly with end-of-season performance and influenced by external benchmarks. This research contributes a practical, competition-based methodology to the resilience literature, providing coaches, analysts, and researchers with a robust framework for monitoring team adaptation throughout professional sport seasons.
Introduction
Professional sports organizations operate in dynamic and complex socio-organizational environments shaped by the relentless demands of competition. These contexts exert considerable pressure on athletes, coaches, and staff, requiring sustained high performance and rapid adaptation to setbacks and challenges. Research in this area continues to follow suit with the emergence of multiple topics and areas of interest to assist practitioners in achieving continued high performance (Jutamulia and Hosoi, 2025; Wiseman, 2025). Within this framework, understanding how teams maintain performance in the face of adversity has become a central concern for both researchers and practitioners.
Team resilience should be distinguished from related constructs such as collective efficacy, cohesion, and adaptability. While these refer to shared beliefs, social bonds, or short-term adjustments, resilience represents a dynamic, collective process that enables teams to maintain or recover performance when facing adversity (Gucciardi et al., 2018; Morgan et al., 2013). In professional sport, where pressure and expectations are ever-present, resilience is a desirable trait and a critical success factor. Resilient teams are better equipped to navigate adversity, foster cohesion, and maintain competitive performance (Sharma and Sharma, 2016). Consequently, the assessment of resilience as a dynamic process, particularly over extended periods such as an entire season, becomes essential (Chapman et al., 2020).
Although interest in team resilience within sports has grown considerably, much of the existing research remains either theoretical (Fasey et al., 2021), qualitative (Morgan et al., 2019) or based on case studies (Morgan et al., 2015, 2017). Several psychometric instruments have been developed to measure resilience, including the Connor-Davidson Resilience Scale (CD-RISC; Gucciardi et al., 2011), the Sport Resilience Scale (Sarkar and Fletcher, 2013), and the CREST inventory (Decroos et al., 2017; López-Gajardo et al., 2023). However, these instruments primarily rely on self-reports and are typically applied over limited timeframes, such as a single competition (e.g., the Olympics), or shorter period (e.g., a month), leaving a gap in the literature regarding team-level resilience measured quantitatively throughout an entire professional season.
To address this gap, the present study proposes the development of the Team Resilience Index (TRI), a competition-based instrument designed to assess team resilience. Drawing on data from the Spanish professional basketball league (ACB League), we analyse the extent to which teams encounter and respond to identifiable stressors during a season. The TRI offers a novel empirical approach to tracking team resilience, with implications for performance monitoring and strategic decision-making by coaches, managers, and analysts.
The following sections review the theoretical underpinnings of resilience in sport, differentiate between levels of analysis (individual, team, organizational), and explore the key role of stressors. Then, we present the methodology for constructing the TRI through the stressors that teams face in the season, followed by its validation and implications.
Literature review
Team resilience and the role of stressors
The concept of resilience has evolved significantly since its initial emergence in the 1970s, when it was primarily used to explain individual adaptation to adverse life events and risks of psychopathology (Garmezy, 1985). Over time, the construct now includes proactive strategies to enhance adaptation across multiple domains, including health, education, and organizational behavior (Leppin et al., 2014).
One critical extension has been to address from individual to collective level, encompassing teams and organizations (Flint-Taylor and Cooper, 2017; Kozlowski et al., 2015; Maloney et al., 2016; Rodríguez-Sánchez and Vera Perea, 2015), and particularly in sports (Galli and Gonzalez, 2015; Kim et al., 2017; Morgan et al., 2015, 2017).
In sports, resilience enables athletes to recover from setbacks while maintaining performance (Morgan et al., 2013), a crucial skill given the constant pressure to succeed. The literature on resilience in sports analyses it on three possible levels: individual (athlete), team and organizational, where different behaviors are necessary to cope with the setbacks and challenges they face in their competitions (Morgan et al., 2015). At the individual level, adaptability, confidence, and concentration mitigate the negative effect of stressors (Fletcher and Sarkar, 2012). At the next level, a resilient team is not merely a collection of resilient individuals—it must collectively respond to setbacks affecting performance. Team resilience extends beyond the aggregation of individual traits such as confidence or focus; it emerges through collective processes and shared resources (Morgan et al., 2017), combining their team resources, for example: the quality of internal relationships, their technical characteristics and skills, existing leadership or support received, to resolution challenges and bounce back to previous levels of performance (Allinger et al., 2015; Carmeli et al., 2013; Stephens et al., 2013). At the organizational level, aligned values, clear objectives, and cultural practices that promote adaptability facilitate resilience (Ortiz-de-Mandojana and Bansal, 2016). In professional sport settings, this translates to teams’ ability to remain cohesive, focused, and effective amid the uncertainty and fluctuations that characterize competitive seasons (Fletcher and Sarkar, 2012).
Team resilience differs conceptually from other related constructs such as collective efficacy, team cohesion, and adaptability. While collective efficacy reflects the shared belief among members in their collective ability to achieve specific outcomes (Fransen et al., 2015), and team cohesion refers to the strength of social and task bonds that hold the group together (Carron and Brawley, 2012), resilience represents a dynamic process through which teams sustain or regain performance when facing adversity (Morgan et al., 2013, 2015). Likewise, although adaptability and psychological flexibility involve reactive adjustments to changing demands, resilience implies a broader and temporally extended process of recovery, maintenance, and even growth following disruption (Gucciardi et al., 2018; Wagstaff et al., 2018). Therefore, team resilience should be understood as an emergent property of coordinated team functioning that enables sustained effectiveness under stress, rather than a static psychological attribute.
Subsequently, team resilience is defined as a multifactorial (Machida et al., 2013), dynamic (Morgan et al., 2015), and functional (Wagstaff et al., 2018) construct for understanding the adverse effects of stress in sport contexts. This capacity is fundamental at the elite level, where the pressure for results is relentless (Fletcher and Sarkar, 2012). A resilient team benefits from long-term goal focus, stronger cohesion, and better adaptation to change (Galli and Vealey, 2008; Morgan et al., 2013, 2015).
Stressors are central to the study of resilience, as they provide the contextual setbacks that require responses to sustain performance (Sarkar and Fletcher, 2014). These stressors may be classified at the individual, team, or organizational level too (Arnold et al., 2018; Galli and Vealey, 2008; Larner et al., 2017), although certain stressors often cross these domains (García-Secades et al., 2014; Morgan et al., 2013). The literature doesńt show, at a quantitative level, the impact of different stressors on team performance over a period, mainly because of the need for more quantitative work in this area of research.
This study focuses on team-level stressors, differentiating from prior research that has focused on individual athletes (Galli and Vealy, 2008; Gucciardi et al., 2011). Given the relevance of team performance in elite sports, a gap remains in specific metrics assessing resilience at the team level. Optimal team performance drives sports organizations, making resilience analysis essential.
Teams face diverse stressors affecting daily performance, including internal conflicts, absenteeism, poor individual performances, changes in team members, and conflicting objectives (Allinger et al., 2015). In professional sports, stressors also stem from logistical issues, underperformance, coaching changes, strained relationships, injuries, fatigue, and competition transitions (Decroos et al., 2017; Lu et al., 2016). Given stressors’ critical role, this study develops a measurement index to determine which teams display resilient behavior in the context of continuous stressors over a competitive season.
A key question arises: how do we assess a team's resilience over a season? Has it faced significant stressors affecting performance? Analysing the impact of stressors allows for determining which teams sustain resilience throughout a season. Before presenting our index, we review existing resilience measurement approaches.
How to measure team resilience in sports
Recovery from setbacks is a fundamental aspect of resilience. Although theoretical advancements in sports team resilience have been rapid, it remains an emerging construct (Gucciardi et al., 2018). Empirical research, particularly at team and organizational levels, is limited regarding measurement and its relationships with performance variables.
Existing research primarily relies on qualitative studies (Fasey et al., 2021; Morgan et al., 2013, 2015, 2017), with biographical data that provide insights into resilience processes (Morgan et al., 2015). Quantitative approaches include questionnaire-based scales such as the Dispositional Resilience Scale-15 (DRS-15) (Bartone, 2007), Resilience Scale for Adults (RSA) (Friborg et al., 2005), and Connor-Davidson Resilience Scale (CD-RISC) (Connor and Davidson, 2003).
Recent efforts have focused on sports-specific measurement tools, considering resilience at individual, team, and organizational levels (Sarkar and Fletcher, 2013). For example, Sharma and Sharma (2016) developed a questionnaire to assess team resilience, while Decroos et al. (2017) proposed the CREST Inventory to examine team responses under pressure (López-Gajardo et al., 2023). Validating these scales has expanded opportunities to measure and relate resilience to organizational factors.
Despite these advances, current instruments do not clearly identify which teams overcome adversity better in specific competitions or seasons, how many setbacks they face, or whether they maintain or exceed expected performance. For sports researchers and practitioners, these gaps limit understanding of how teams sustain performance despite adversity. Addressing this need requires measurement tools tailored to sports teams’ unique challenges. A more precise resilience index could inform strategies to enhance collective resilience, decision-making, and professional sports performance (Fletcher and Sarkar, 2012).
Building on this premise, the current study introduces a Team Resilience Index (TRI) based on the stressors defined in the literature and continuously updated public sports competition data. The TRI operationalize resilience as a longitudinal, competition-derived construct, emphasizing team adaptation under adverse conditions. This approach moves beyond self-report and situational questionnaires by grounding resilience in observable match outcomes and contextual variables (e.g., opponent quality, sequence of results, situational stressors). The next section details the methodology used to create this index, focusing on stressors and professional basketball teams in the Spanish ACB League.
Methodology
Developing specific instruments to measure resilience in sports teams is crucial for a deeper and more effective understanding of this concept. In this research we propose an alternative approach from previous empirical works: developing metrics to quantify team resilience throughout a season using competition data. This method offers reliable, practical measures for researchers and practitioners, as it does not rely on aggregating a large sample of questionnaires to validate its results. First, we show the development of Team Resilience Index (TRI) as a reliable metric for team resilience. Second, we check TRI in Spanish Basketball League (ACB League). Third, we analyse external factors over TRI.
We assume that, in a competitive sport season, there are n teams, m stressors, and s games. For a given team i, i = 1, …, n, we considered the resilience vector ri of s observations as follows:

Here, rpij represents the outcome of game j for team i and nfeij represents the number of stressors affecting team i in game j. Stressors can be considered to have an equal or unequal effect; therefore,
If
Based on this, we propose two methods for measuring resilience in professional basketball.
Option A
For j = 1, …, s, we propose rpij as follows:
rpij = 1 if team i wins game j. rpij = –1 if team i loses game j.
Draws are not permitted in basketball, regular season or playoffs games. In the case of sports where a draw is a possible outcome, it is coded as 1 because we consider it positive to earn points for the result obtained. The stressor factor nfeij ranges from 0 to 1, depending on how many stressors affect team i in game j, since feijh is equal to 1 if stressor h appears in match j for team i and 0 otherwise.
Thus, the resilience vector ri takes values between −1 and 1:
Values close to −1 indicate low resilience (the team faces stressors and loses). Values close to 1 indicate high resilience (the team faces stressors and wins). Values near 0 indicate an erratic pattern, where stressors exist but their impact is unclear.
We define the Team Resilience Index (TRI) for team i as the arithmetic mean of its resilience vector:
Team Resilience Index: Percentage of team resilience: Weighted percentage of resilience: Means Square Deviation (MSD): Interpret the results when TRIi is close to zero.
Means Square Deviation:
A high MSD indicates erratic resilience patterns, particularly when TRIi is close to zero. Consequently, MSD can also be used when two teams have identical TRI values. In this case, the team with the lower MSD is preferable as it is more consistent.
To illustrate it, we consider an example with two teams (A and B, with n = 2), three stressors (m1, m2, m3), and four games (s = 4), as shown in Table 1.
Example of analysis of stressors.

mi = stressors affecting each team in the 2021-2022 season (example).
Considering that all stressors have the same weight (w1 = w2 = w3 = w4 = 1/3), the computed values are as follows:
Team A: TRIA = mean (2/3, 2/3, 0, 1/3) = 0.416; TRIA/m = 13.88%; MSD (rA) = 0.076. Team B: TRIB = mean (0, −1, 1, 0) = 0; TRIB/m = 0%; MSD (rB) = 0.5.
Team A demonstrates 13.88% resilience (the maximum being 100/3 = 33.33%), while Team B shows erratic resilience, preventing classification as resilient or non-resilient.
Option B
In this alternative approach:
rpij = 1 if team i wins game j. rpij = 0 if team i loses game j.
This method avoids penalizing losses in the resilience index. The reason is that if a team loses a game, it is not necessarily related to stressors. Therefore, losing a game is not penalised negatively. Here, ri ranges from 0 to 1:
Values near 0 indicate low resilience (team loses when facing stressors). Values close to 1 indicate high resilience (team wins facing stressors).
Thus, we define analogously:
Proposed stressors
As mentioned in the theoretical section, sports teams face several stressors during a season that may occur at different times (in different weeks of competition) or simultaneously (at the same week). Elite basketball coaches often refer to their team´s resilience in relation to the presence of these stressors, including injuries, limited rest between games, defeats, or the existing competitiveness (García, 2025; Newsroom Infobae, 2024).
Based on previous classifications of team stressors (Allinger et al., 2015; Thelwell et al., 2010) and, those specific to sports teams (Decroos et al., 2017; Lu et al., 2016), we selected key stressors to develop our index related with player's absence due to injuries, close losses, negative competitive inertia, poor performance, changes of coach or team players, constant competitive pressure, and away games.
Using this list, we considered seven stressors for our index (ST, m = 7), capturing the impact of stressors faced by teams throughout a season. We define the following list of variables for our analysis and how we measure them:
ST1 Player's absence due to injuries: Fewer than 12 registered players for a game. ST2 Close matches: Games with narrow score margins, losing or winning by less than five points. ST3 Negative competitive inertia: Losing three or more consecutive games. ST4 Poor performance: Team performance below the 40th percentile. ST5 Change of coach or team players: Playing within four games of a coaching change. ST6 Constant competitive pressure: Playing two games within three days (“back to back” games), including games played in other FIBA international competitions (Euroleague, Eurocup and Basketball Champions League). ST7 Non-local games: Playing as a visiting team.
All data were obtained from the official database of the ACB league on its website (www.acb.com). The data of the difference in match days of those teams that play international competition has been obtained from Fiba Basketball to find the days between games.
Case study: ACB league 2020-21 season
The dataset (available at https://digibug.ugr.es/handle/10481/107272) comprises the 19 teams (n = 19) that competed in the ACB League during the 2020–21 season, one of Europe's premier basketball leagues. Each team played 36 regular-season games (s = 36), with a maximum of 44 games for those that advanced to the playoffs (Table 2). The following metrics were calculated, both Option A and Option B:
Team Resilience Index: Resilience Percentage: (TRIi/m) · 100. Mean Square Deviation: MSD (ri).
Team resilience Index results TRIi/m (options A and B).

Gm = Games played; TRIi = Team resilience index; RMSD(ri) = Root mean square deviation; m = Total stressors; the maximum value for
Furthermore, two situations will be distinguished below. The first considers that all stressors are equally important (all stressors have the same weight), and the second considers that some are more relevant than others (not all stressors carry the same weight).
All results were obtained using the R programming environment. The code is available in GitHub at https://github.com/rnoremlas/resilience.
All stressors carry equal weight
These values allowed us to rank teams based on resilience. In cases where two teams had the same TRI, a lower MSD (ri) was preferred.
In addition to the material available on GitHub, the values shown can be obtained from the supplementary material available in open access at https://hdl.handle.net/10481/104892. As an example, the file shows the example with Real Madrid.
In both Option A and Option B, the most resilient teams were Real Madrid, Barcelona, Tenerife, Valencia, and Baskonia, with a positive resilience percentage in Option A. The least resilient teams were Gipuzkoa, Estudiantes, Bilbao, Fuenlabrada, and Betis. Gipuzkoa and Estudiantes were relegated to the Spanish second division (LEB Oro) for the following season.
On the other hand, Table 3 presents the stressors affecting each team. Four teams (Betis, Estudiantes, Fuenlabrada, and Unicaja) faced all seven stressors, while the least affected teams (Barcelona, Manresa, Real Madrid, and Tenerife) faced only five. The remaining teams experienced six stressors at some point during the season.
Stressors presented by each team.

STi = stressor I; mi = stressors affecting each team in the 2021-2022 season.
We observed that some stressors affected all teams at some point in the season (ST2, ST4, ST6, and ST7), whereas ST5 impacted only five teams. This confirms that all teams face challenges, though their intensity and frequency vary. Since no team experienced all stressors throughout the season, we recalculated the resilience percentage by considering only the stressors each team encountered (Table 4).
Team resilience Index (TRI) of each team as a function of the stressors.
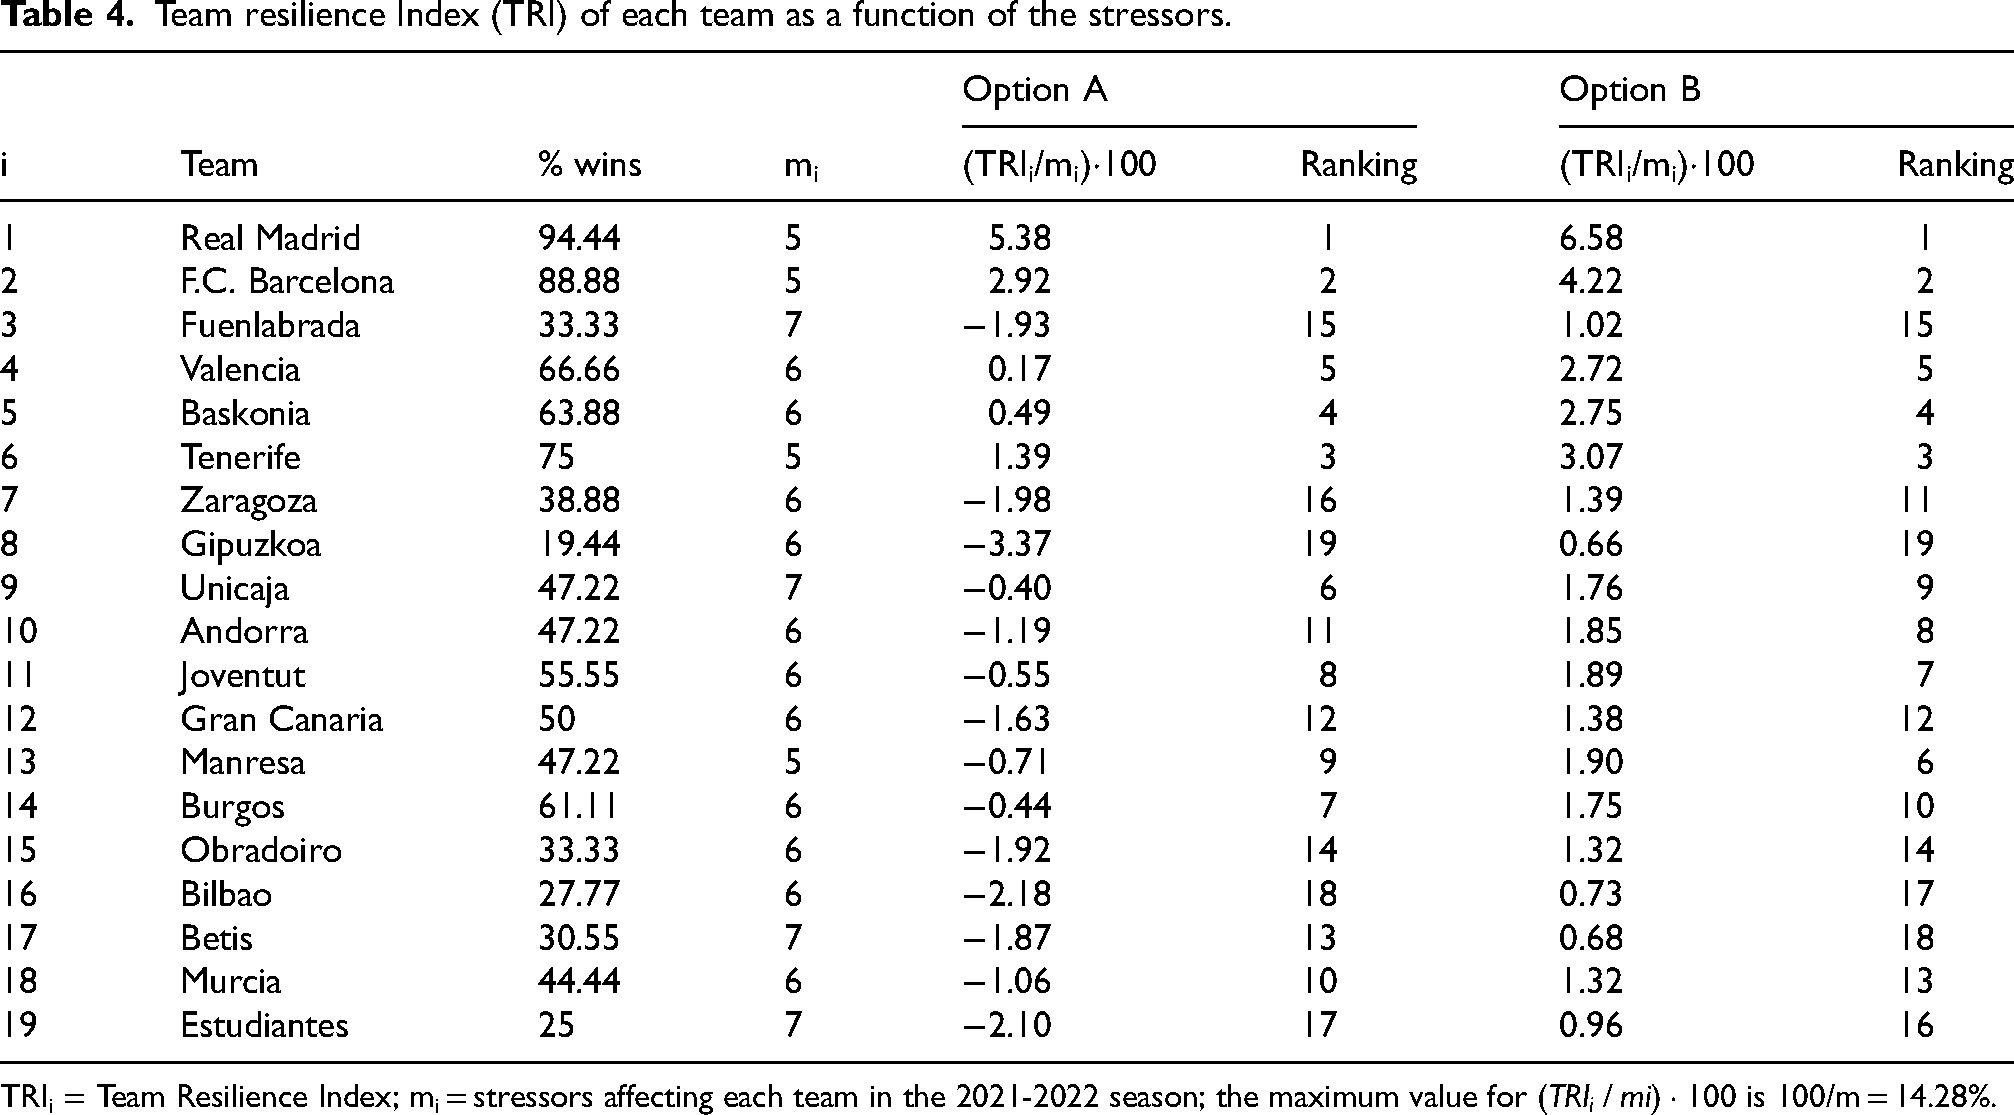
TRIi = Team Resilience Index; mi = stressors affecting each team in the 2021-2022 season; the maximum value for
Stressors have different weights
If it is considered that stressors should not be given equal weight, the first question to address is obvious: what weight should be assigned to each stressor? We will use the empirical evidence shown in Table 3.
This table presents the frequency with which each stressors appears across the teams considered. Specifically: 18 (0.157), 19 (0.167), 15 (0.131), 19 (0.167), 5 (0.043), 19 (0.167) and 19 (0.167). The values in brackets represent the weights (wh) assigned to each stressor h = 1…,7, respectively. It can be observed that all the weights are quite similar (thus the first case, in which all stressors have equal relevance, can be considered accurate) except for the fifth stressor (coaching change).
The results presented in Tables 2 and 4 are calculated using these weights. The results obtained are shown in Tables 11 and 12 in the Appendix. As can be seen, the results are very similar to those obtained when all stressors are assigned equal weights.
Based on Tables 2 and 11, Table 5 shows the rankings obtained from (TRIi/m)·100 in the two case studies considered (equal and different weights) for options A and B. Although the rankings for each team are very similar, Spearman's correlation coefficients have been calculated, yielding very high values: 0.996 (p-value equal to 8.415·10-6) for Option A and 0.985 (p-value equal to 8.379·10-6) for Option B.
Comparison of rankings obtained from (TRIi/m)*100 in options A and B in case studies A (equal weighting for stressors) and B (different weighting for stressors).

Similarly, based on Tables 4 and 12, Table 6 shows the rankings obtained from (TRIi/mi)·100 in the two case studies considered (equal and different weights) for Options A and B. Once again, a high similarity is observed, confirmed by calculating the Spearman's correlation coefficients: 0.998 (p-value equal to 8.399·10-6) for Option A and 0.982 (p-value equal to 8.312·10-6) for Option B.
Comparison of rankings obtained from (TRIi/mi)*100 in options A and B in case studies A (equal weighting for stressors) and B (different weighting for stressors).

This stability was expected since, as mentioned above, the empirical evidence in Table 2 suggests fairly similar weights for almost all stressors.
Validation of the team resilience Index validation
To validate the TRI, we first analysed the relationship between the resilience rankings in Table 2 using the Spearman's coefficient to assess the relationship between rankings (Pérez, 2005). We expected that teams with higher resilience would achieve better results.
The correlations between season ranking and TRI were 0.952 (Option A) and 0.938 (Option B). The correlation between TRI rankings from both options was 0.943.
These results confirm that resilient teams achieved better performance. While both measurement options provided similar team rankings, Option A showed a stronger association.
Figures 1 and 2 show the rankings from Table 2. Figure 1 confirms that Option A correlates resilience with team success. It also highlights two teams with discrepancies: Unicaja, which ranked higher than expected based on resilience, and Gran Canaria, which ranked lower. Figure 2 shows that both methods classified Real Madrid, Barcelona, Gran Canaria, and Gipuzkoa identically.

Resilience rankings from option A (above) and option B (below), versus the final ACB ranking.

Resilience rankings from option A versus option B.
Second, the Spearman's correlation coefficients for different rankings of Tables 2 and 4 are shown in Table 7. All correlation coefficients are significantly different from zero as the p-values (in brackets) associated with the null hypothesis that the correlations are equal to zero are greater than 0.05. Therefore, this hypothesis is rejected.
Relationship between the ranking at the end of the regular season in ACB league and the different team resilience Index (TRI) options developed.

The p-values associated with the null hypothesis that the correlations are equal to zero are shown in brackets.
Option A's correlation with the final league ranking decreased slightly (from 0.952 to 0.935), whereas Option B's correlation increased (from 0.938 to 0.940). The similarity between the two options also declined (from 0.943 to 0.914).
In summary, both measurement options strongly correlate resilience with performance, but when adjusting for stressors, the association becomes nearly identical for both methods (0.935 and 0.940, respectively), being slightly higher in Option B.
Finally, Pearson's correlation coefficient was calculated between the TRI value shown in Table 4 for Options A and B and the winning percentage of each team in the regular season (see also Table 4). The resulting values were 0.945 and 0.915. Furthermore, the corresponding significance test indicates that both correlations are significantly different from zero (associated p-values of 1.079·10−9 and 3.947·10−8, respectively, which are less than 0.05, so the null hypothesis of nullity is rejected).
These results set that the TRI calculated using Option A has a stronger linear association with team performance, measured in terms of the winning percentage.
Figure 3 shows the scatter plots of the TRI value and winning percentage (Table 4). Additionally, the simple regression lines, in which the winning percentage is analysed as a function of the TRI calculated according to each option, are displayed. Teams located above or below the regression line have a higher or lower winning percentage, respectively, than expected from their TRI value, respectively.

Scatter plot of the TRI value shown in Table 4 for options A and B with the winning percentage of each team in the regular season.
The values obtained by Real Madrid and Gipuzkoa Basket under Option B (Figure 3) may account for the lower correlation observed with the winning percentage that Option A.
If it is considered that the stressors have different weights, the results presented in Table 7 is recalculated using these weights (see Table 13 in the Appendix). As can be seen, the results are very similar to those obtained when all stressors are assigned equal weights.
Other factors influencing the team resilience Index
In order to further validate the proposed index, in this case taking as a reference external factors to those used in its design, in this section we propose a multiple linear regression in which the dependent variable is the TRI adjusted for the number of stressors, whether calculated according to Option A or B (Table 4).
The following will be considered the independent variables:
AA: Average age (in years) of the roster. NP: Number of new players at the start of the season. ATR: Average tenure (in years) of the roster. CSC: Number of consecutive seasons of the coach at the club. Euroleague: A binary variable that captures whether the club plays in the Euroleague. Europe: A binary variable that captures whether the team plays in the BCL or Eurocup.
The first of these is used as a proxy for the adaptability of the player, since the older the player, the more knowledge of the game is assumed to be available. The following three aim to measure the consistency of the team based on the stability of the roster and coach. Finally, the last two are used as a budget proxy, as those teams that play in European competitions are assumed to have a higher budget. Note that a distinction was made between the first European competition (Euroleague) and the other competitions (BCL and Eurocup). In this case, we would be taking those teams that only play in the ACB League as a reference. Note that the small number of observations (19 teams, see Table 8) make it inadvisable to include a larger number of independent variables.
Multiple linear regression model data.

The results obtained are shown in Table 9 after centering the variable AA to avoid problems of non-essential multicollinearity (relation to the intercept, for more details see Salmerón et al., 2020). It can be seen that the models are technically correct as they are jointly valid, high coefficients of determination (so the established linear relationship is adequate), and the residuals are normal and homoscedastic. The fact that the model is technically correct and that there are reference variables with coefficients significantly different from zero indicates that the index captures resilience and not simply noise.
Multiple linear regression models analysing TRI as a function of external benchmarks.

Coefficients significantly different from zero at 5% significance are highlighted in bold. F-statistic for the test of joint significance, Breusch-Pagan test for homocedastic and Kolmogorov-Smirnov test for normality (in all cases the null hypothesis is rejected).
In both models, the variables AA and Euroleague have a significantly different coefficient from zero with a positive sign. This implies, on the one hand, that when the average age of the squad increases, resilience increases and, on the other hand, teams that play in the Euroleague have greater resilience than those that only play in the ACB League.
Furthermore, when TRI is calculated from option B, the associated coefficient of the ATR variable significantly different from zero with a positive sign. This implies that when the roster tenure increases, the resilience index also increases.
Finally, the analysis of the residuals of the proposed models provides us with information on the behavior of each unit simply by keeping in mind that positive/negative residuals indicate that the observed value of the TRI is higher/lower than the value estimated by the model. That is, a positive/negative residual indicates that considering the values of the independent variables, the corresponding team has obtained a higher/lower TRI value than expected by the model. In short, teams with positive residuals have obtained results in the TRI above their potential (such as, see Figure 4, FC Barcelona and Murcia) and teams with negative residues below their potential (such as, see Figure 4, Gipuzkoa and Valencia).

Bar plot of the residuals of the estimated models in Table 6.
If it is considered that the stressors have different weights, the results presented in Table 9 is recalculated using these weights (see Table 14 in the Appendix). The only notable difference arises in the case of multiple linear regression where the dependent variable is obtained from Option B. In this case (see Table 14), the ATR variable (average tenure of the roster) does not influence the resilience index at a 5% significance level (but it does at 10%). In other words, minimizing the impact of the change of coach in the calculation of the resilience index means that the experience of the roster ceases to have a positive influence on it. This finding suggests an interaction between roster stability and coaching changes—teams with highly experienced rosters are less likely to experience a coaching change.
Discussion
The results of this study support the validity of the Team Resilience Index (TRI) as a useful metric for quantifying how professional basketball teams respond to adversity during a competitive season. Among the seven stressors considered (Table 10), given their frequency of occurrence, three of them are assumed to play a particularly important role in the calculation of TRI: playing away games (ST7, 27.27%), achieving wins in congested game periods (ST6, 21.13%) and winning despite underperformance (ST4, 20.06%). These findings suggest that resilience in elite teams could be driven by their capacity to manage fatigue, maintain tactical coherence, and perform under suboptimal competitive conditions.
Total and average number of stressors affecting each team.
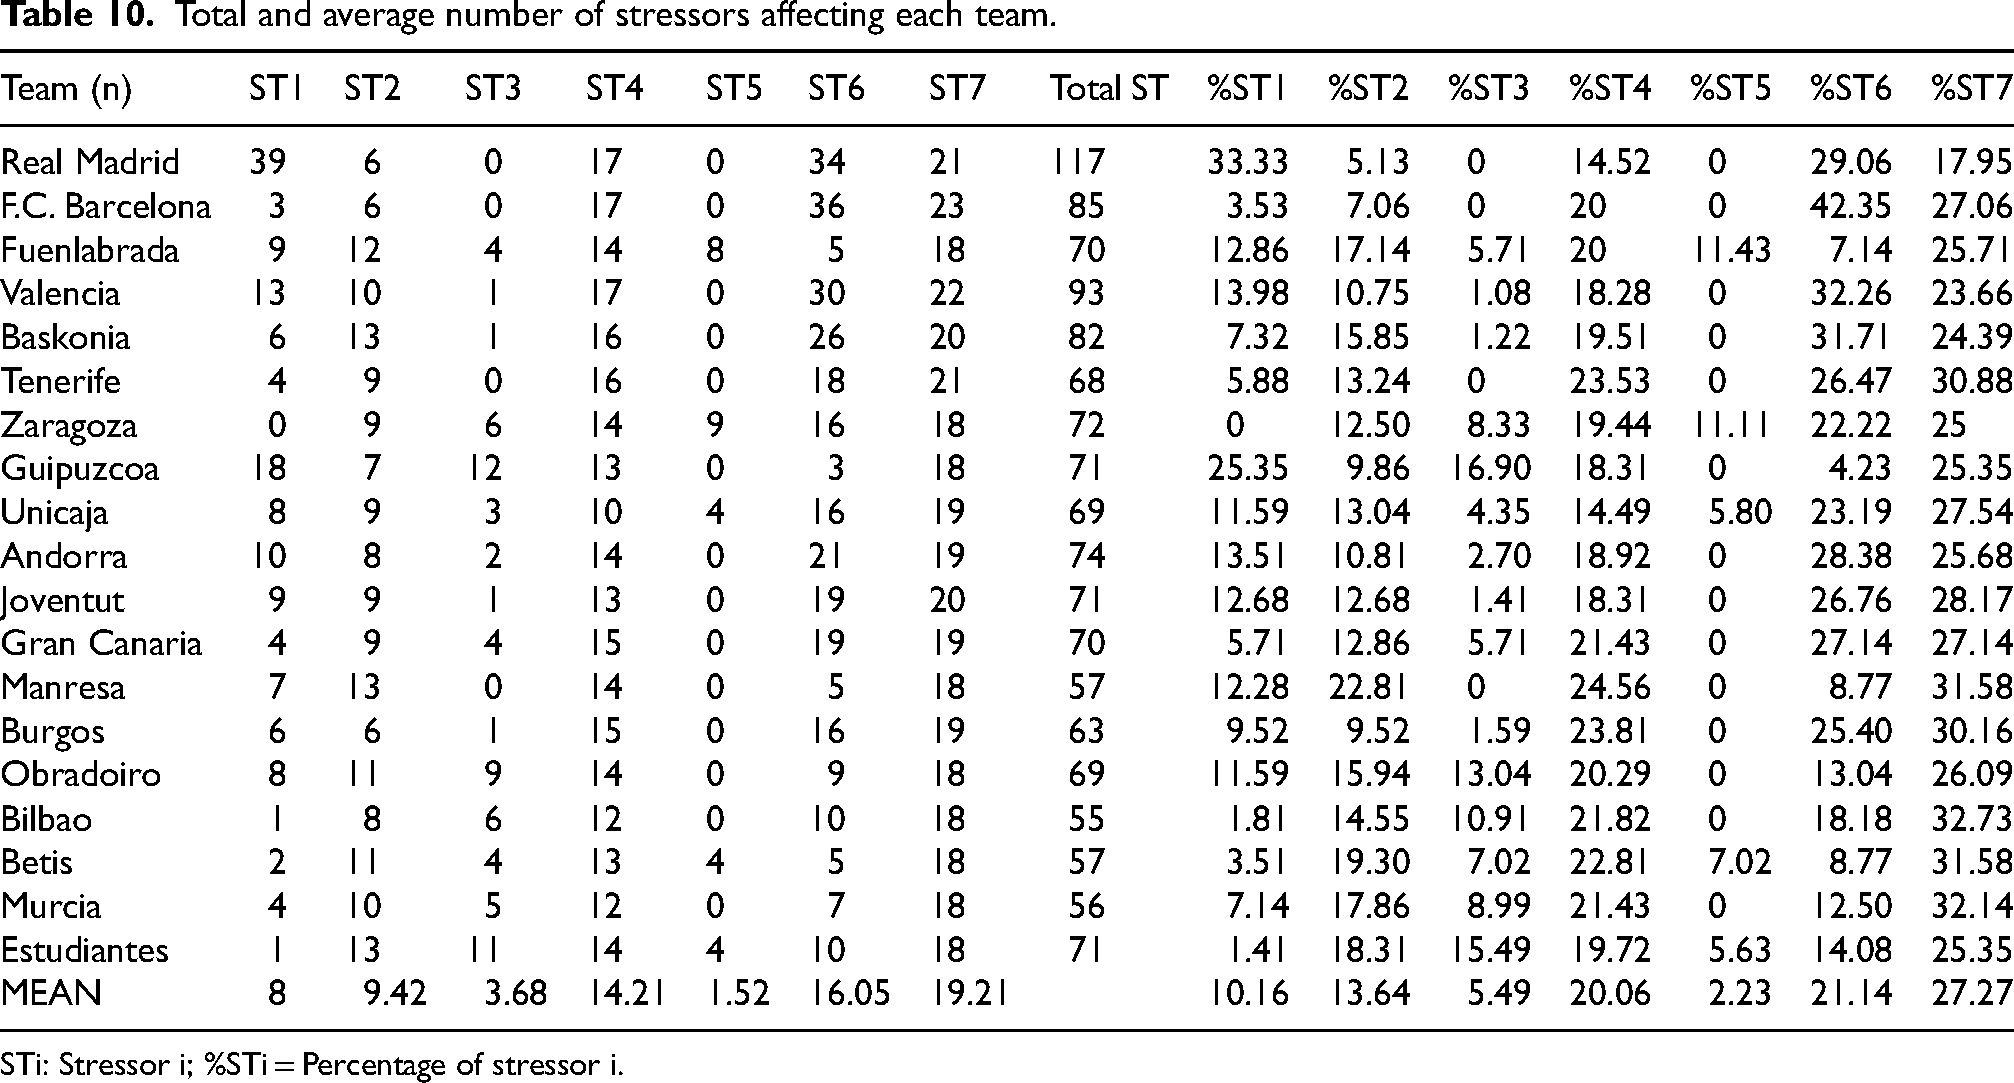
STi: Stressor i; %STi = Percentage of stressor i.
Stressor ST1 (registering fewer than 12 players in a game) was particularly relevant for Real Madrid (33.3%) and Gipuzkoa (25.4%). Real Madrid ranked first in the resilience index, while Gipuzkoa ranked last. This suggests that beyond overcoming stressors, having key players who can step up in difficult moments is a crucial factor in resilience. An interesting aspect to study in the future is which specific players are absent in a game, whether they are key players or players with few minutes, as the impact of the stressor may vary.
Tenerife presents a notable case. Under Option A (considering all stressors equally), Tenerife achieved the highest resilience percentage (m = 7) among the top five teams. However, under Option B (excluding penalization for losses and adjusting for stressors faced), its relative standing dropped—only to rise again when resilience was recalculated based on actual stressors (m = mi). Tenerife's lower number of stressors gave it a relative advantage when calculating resilience percentage.
Interestingly, teams with greater financial resources faced a higher number of stressors. For example, Real Madrid (117), Valencia (93), FC Barcelona (85), and Baskonia (82) reported the highest total stressor counts. These teams also ranked among the most resilient, so resource-rich environments may better buffer external stressors and facilitate adaptive responses. However, the relationship between financial capacity and resilience remains a topic for future empirical inquiry.
Conversely, Gipuzkoa and Estudiantes—two of the lowest-performing teams—encountered a relatively high number of stressors (71 each) yet ranked among the least resilient. This finding illustrates that mere exposure to adversity does not inherently foster adaptation. Rather, resilience requires structured mechanisms for learning, tactical recalibration, and psychological robustness, which may be absent in underperforming teams.
Note that the percentages shown in Table 10 could be used as weights for each stressor to construct the resilience index. The results obtained are very similar to the previous ones. These results have not been included in the paper to avoid increasing its length, but they can be reproduced by the reader using the code available on GitHub (https://github.com/rnoremlas/resilience).
On the other hand, the regressions results indicate that the seniority of the project and its continuity in terms of players (without considering the coach) increases the resilience index. This question points more to the figure of the manager than to that of the coach as an instrument for building a consistent team based on the adaptability of the player.
Finally, although the teams with a higher budget (those that play the Euroleague) have a higher resilience than those that play only the ACB League, those teams with a medium budget (understanding these as those that play the BCL and Eurocup) have the same resilience index as the teams that only play the ACB League. In other words, the budget increase experienced by these teams is not reflected in increased resilience to the considered stressors.
Regarding other existing indexes, research has used two lines, one based on long-term qualitative analysis analysing the behavior of teams in order to identify those elements considered resilient (Morgan et al., 2019), and the other more recent lines based on the use of the CREST Inventory questionnaire, as in López-Gajardo et al. (2023), in multiple sports to see its impact on performance and other aspects such as group cohesion. Both are precious and interesting lines of research that we will consider in other future work.
It is also important to note that the 2020–21 season was held under COVID-19-related restrictions, which may have influenced team dynamics, player rotation, and competitive rhythm. However, as these circumstances affected all teams similarly, their impact on comparative resilience rankings is expected to be limited. Future studies including post-pandemic seasons will help to confirm the robustness of the present findings.
With this resilience index, we increase the number of quantitative tools for estimating resilience, allowing its continuous measurement and analysis, using factors and aspects that basketball professionals identify that affect their performance and require them to be resilient (del Newsroom Infobae, 2024; Río, 2025). It enables ongoing calculation using publicly available competition data by sports professionals daily, so we consider it to be usable and adaptable for professionals.
Conclusions
A professional sports team faces different stressors, often simultaneously. Based on the literature (Allinger et al., 2015; Decroos et al., 2017), we know that teams suffer from player absences and injuries that do not allow them to have the whole team available for matches, a demanding competitive calendar that does not allow for breaks and training to correct mistakes or the competition itself and equality between teams in the matches played. This happens on a continuous basis, but additional factors can also appear: a change of coach generates a situation of stress and uncertainty for the players that requires time for everyone to adapt to new training routines, tactics, or playing roles. Playing at the rival's court is another stressful situation, as you don't have the additional support of your fans and family at the time of the match, apart from the change of routines, travel fatigue… all these elements add difficulties to the team's performance. Everyone always prefers to play in front of their own fans, friends, and family.
The dynamics of the season itself generate new stressful situations, a bad streak of results generates uncertainty for the players, pressure to improve performance, and fear of whether they may change their roles in the team or even be replaced. Negative results dynamics are very complicated to manage at a collective level because they are unwanted and generate additional internal and external pressure to improve results (Decroos et al., 2017; López-Gajardo et al., 2023). Therefore, we consider it very relevant to analyse the impact of these stress factors on the results to check the resilience of the team based on these emerging factors.
This study examined team resilience in professional basketball, reviewing existing literature and proposing a quantitative measurement index (TRI) based on actual stressors experienced by teams. Two alternative formulations were tested: Option A, which accounts for both wins and losses under stress, and Option B, which neutralizes the penalization of losses. Both demonstrated strong correlation with end-of-season performance (measured as winning percentage), both in the case where all stressors have the same relevance and, in the case, where they do not. Since the TRI adjusted for the number of stressors experienced by a team calculated from Option B performs better when related to external benchmarks, we consider it more appropriate to calculate the TRI under this option. Extending the number of seasons and (consequently) variables in the multiple linear regression model performed is a future line of work of great interest. It´s important to confirm that the continuity of the project and the experience of the players are factors that increase the resilience of the team, as well as to obtain new relationships of influence that could not be explored due to the small number of observations in the model proposed.
Team Resilience Index represents a practical and scalable tool for applied performance analysis. For researchers, it advances empirical approaches to team resilience by moving beyond theoretical constructs and perception-based instruments. When professional coaches talk about the use of data for decision-making, they usually point out the need for metrics that are quick to collect and simple to analyze and understand. Our index meets these characteristics more efficiently than existing team resilience instruments. With our index, team professionals can observe whether they are being subjected to stressors, compared to other teams in their competition, and the impact it has on performance on an ongoing, week-to-week basis, which is a demand from professionals in this field. For practitioners, the TRI offers actionable insights into how teams navigate adversity, aiding in performance diagnostics, coaching interventions, and organizational decision-making. A next step in this line of research will involve presenting and testing the Team Resilience Index with professional teams and coaching staff to evaluate its perceived usefulness and practical applicability in real performance contexts.
As the 2020–21 season was influenced by COVID-19 restrictions, some contextual effects may have affected team performance; however, these were consistent across teams and do not compromise the comparability of results.
Limitations of this study include the focus on a single season and sport (Spanish ACB basketball), the exclusion of financial, contextual, and injury-related factors not publicly documented. In addition, from the list of team stressors established by Allinger et al. (2015), only seven of them have been used, and all have been given equal weight in the analysis. Additionally, the index has only been analysed in one sport. Therefore, despite demonstrating its reliability and ease of application, its applicability to other team sports should be explored. Future research should extend the analysis to multiple seasons to examine the temporal consistency and predictive validity of the Team Resilience Index. While the current study focuses on a single season for feasibility reasons, longitudinal validation across seasons is already planned in future studies. Present study focused on validating the TRI through competition-based and statistical evidence so, future research should incorporate triangulation with other tools, such as the CREST inventory (Decroos et al., 2017), and with expert evaluations from coaches or analysts. Such triangulation would enable a more comprehensive validation linking performance-based and perceptual measures of team resilience.
Moreover, future studies could explore interactions between TRI scores and other psychosocial dimensions identified in resilience literature, such as group structure, mastery approaches, social capital, and collective efficacy (Morgan et al., 2013). Integrating variables like learning orientation, flexibility, and organizational culture could offer a multilevel understanding of how teams transform adversity into sustained performance (Sharma and Sharma, 2016). Integrating a larger number of stressors present in the literature into the index and analysing the specific weight of each stressor is a very interesting line to improve stressor-based resilience analysis. To achieve this, reliable data related to these stressors are essential.
This approach could be expanded to explore its relationship with other levels of resilience, such as individual and organizational resilience, as has been done in other fields (McEwen and Boyd, 2018). Additionally, a resilience measurement index at the organizational level could be adapted or developed within the sports context. In sum, the TRI provides a robust foundation for operationalizing team resilience and enables further inquiry into the competitive adaptabilitýs structural, psychological, and contextual determinants.
Footnotes
Acknowledgements
The authors want to thank the members of the research group, “Innovation, Sustainability and Business Development” (SEJ-481) and Quantitative Methods Department for their help and comments. In addition, the authors want to sincerely acknowledge the anonymous reviewers for contributing beneficial suggestions to improve this paper for its publication.
Funding
This work was supported by Grant PID2023-150517NB-I00 funded by MICIU/AEI /10.13039/501100011033 and ERDF/UE; and by Grant C-SEJ-069-UGR23 funded by Consejería de Universidad, Investigación e Innovación and by ERDF Andalusia Program.
Declaration of conflicting interests
The authors declared no potential conflicts of interest with respect to the research, authorship, and/or publication of this article.