
Abstract
This descriptive study aimed to explore longitudinal variation in home advantage (HA) among the top four tiers of English rugby union, based on the matches played from 2000/01 to 2024/25 seasons. Home advantage was quantified using Pollard's traditional and rescaled methods. Initial one-sample t-tests revealed that the mean HA values were significantly greater than 50% across all tiers (p < 0.001), indicating a clear presence of HA. Thereafter, outcomes of a one-way repeated measures ANOVA concluded that HA significantly differed between competition levels (p < 0.001). Post-hoc tests revealed it was significantly greater in the Gallagher Premiership (64.37%) than the RFU Championship (59.69%) across the considered period (p = 0.003). Although XmR control charts identified potential non-random variation in HA during the 2005–2008 RFU Championship seasons, it appears to have stabilised over the past decade across all the examined tiers. This judgement was further supported by sensitivity analyses conducted using linear mixed models, which highlighted no significant seasonal variations in HA in the top two tiers since 2014/15 season. Overall, the findings signify the influence of HA on English rugby union and offer opportunities for future research to explore root causes of the observed divisional and longitudinal variations.
Introduction
Home advantage (HA) is a widely accepted phenomenon in sport. Specifically, it refers to the advantage that teams may have when playing at their home ground. As a construct, HA has significant support for its influence on match outcomes in many sports, including rugby union (Nevill and Holder, 1999; Pollard and Armatas, 2017; Robertson and Joyce, 2015; Thomas et al., 2008). For instance, prior research that examined HA in rugby union identified its prevalence in the Six Nations tournament (Thomas et al., 2008), professional leagues in Spain (Gómez et al., 2011) and tournaments (from year 2000 to 2004) played in the southern hemisphere (Super 12 and Tri-nations – currently known as Super Rugby and Rugby Championship) (Morton, 2006).
Research illustrates that HA is often explained through 4 main factors: travel, familiarity, rules and crowd (Nevill and Holder, 1999; Pollard and Armatas, 2017; Pollard and Gómez, 2014). A range of literature provides evidence to signify that travel pays a key role in establishing home advantage (Carron et al., 2005; Pollard et al., 2017; Pollard and Gómez, 2014). Specifically, Pollard and colleague's research found significant correlations between leagues with particularly large travel distances and their respective HA magnitude (Pollard et al., 2017; Pollard and Gómez, 2014). However, no significant associations have been found for leagues operating within one time zone, indicating that the ‘jet lag’ effect could explain the link between HA and travel (Carron et al., 2005). Similarly, in terms of familiarity, it has been suggested that home team athletes are more familiar with their own venue, perhaps leading to better performances (Pollard, 2002). However, general research that examined familiarity as a factor on HA is inconclusive, with studies finding that temporary changes in venue do not significantly reduce HA (Loughead et al., 2003; Moore and Brylinsky, 1995). Additionally, early research also highlighted that rule factors may pose little influence on HA (Nevill and Holder, 1999).
Interestingly, among all the factors investigated, crowd size has been identified as the one having strongest association with home advantage (Agnew and Carron, 1994; Delbianco et al., 2023; Leitner et al., 2023; Nevill et al., 1996; Nevill and Holder, 1999). Crowd size supposedly influences HA through biased referee decision-making (Boyko et al., 2007; Downward and Jones, 2007), which leads to more yellow and red cards given to away teams (Dawson et al., 2020) and more fouls awarded to home teams (Lovell et al., 2014; S. Areni, 2014). Moreover, crowd density and crowd attendance have been positively correlated with HA (Agnew and Carron, 1994; Nevill et al., 1996). Yet, these studies could not distinguish the influence of the crowd from other factors such as travel and familiarity. The latter issue is remedied by more recent research conducted during COVID-19 lockdowns, which offered the ideal conditions to isolate crowd factors as an independent variable (Delbianco et al., 2023; Leitner et al., 2023; Wolaver and Magee, 2022). For example, Leitner et al. (2023) found that crowd-less ‘Ghost Games’ significantly reduced the magnitude of HA in football, potentially due to a reduction in referee bias and lack of emotional support from the crowd. Equally, in rugby union, Delbianco et al. (2023) found that the average winning margin for home teams fell from 6 to 4 points when playing without a crowd. Furthermore, Wolaver and Magee (2022) found that the removal of crowds reduced the yellow and red cards given to away teams but had no influence on cards given to home teams. Although studies conducted during the COVID-19 pandemic provided a unique opportunity to investigate how the removal of crowds influenced HA, travel and familiarity factors could still have impacted those findings. Importantly, the research by Ponzo and Scoppa (2016) attempted to solve this issue by examining HA on ‘same-stadium derbies’ in football (which occur between teams that share a home stadium). Thereby, completely isolating crowd factors from confounding variables. Subsequently, Ponzo and Scoppa (2016) revealed that in same-stadium derbies across 22 seasons, “home” teams scored 0.45 more goals than “away” teams on average and were 15% more likely to win. Although lower in magnitude than normal matches, HA was still observed to be significant despite the removal of travel and familiarity factors, suggesting that crowd size is the most relevant factor when explaining HA (Ponzo and Scoppa, 2016).
According to the prior examination of crowd size on HA, it is plausible to hypothesise that home advantage should be more impactful in higher leagues which may have the largest crowd sizes (Leite and Pollard, 2018). Studies investigating this topic in football elicit mixed results (Almeida and Volossovitch, 2017; Nevill et al., 1996; Pollard, 1986). For example, Nevill et al. (1996) found that HA increased in the top football leagues in England and this effect was mediated by crowd size. However, Almeida and Volossovitch (2017) conducted a study into divisional differences in Portuguese football, finding that HA was lower in the top divisions despite their large crowd attendances. Nevertheless, as discussed previously, although the prevalence of HA in rugby union has been examined in some contexts, a comprehensive exploration into the presence of home advantage on divisional levels within a nation (e.g., English rugby union) is non-existent. Resultantly, a better understanding of the divisional differences is essential to highlight the role that HA plays in match outcomes. Therefore, to bridge those gaps in sport literature, this paper aims to explore the influence of home advantage on the top four tiers of English rugby union system, over the last 25 seasons. Specifically, by (a) identifying if HA prevails within each of the top four tiers of English rugby union and (b) evaluating whether differences in HA exists across those four tiers.
Methods
Variables and measures
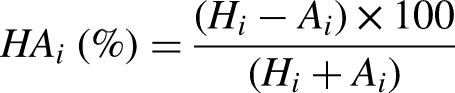
Guided by a post-positivist approach, this study adopted a descriptive study design to examine the influence of home advantage (HA) on the English rugby union system. Resultantly, home advantage was defined as the dependent variable and the English rugby union competition level or tier was used as an independent variable (with 4 levels: Tiers 1, 2, 3 and 4). While previous research illustrated multiple methods to quantify home advantage (Goumas, 2013; Matos et al., 2019; Pollard, 1986), in this study, HA was measured using two approaches. Initially, for each competition, HA was defined as the percentage of home wins in comparison to overall wins (home and away) by all teams across a season, which will be referred to as ‘Pollard's traditional method’ throughout the paper (Pollard, 1986). Although this method provides a single, season-wide home advantage value, calculated separately for each league, it is reasonable to critique that it perhaps represents a summary of home outcomes rather than a true indicator of comparative advantage, as it doesn’t fully account for away performances. Nevertheless, this HA quantification can still be useful to gain league-wide snapshots, especially over many matches. In turn, making it suitable for the initial holistic comparisons across tiers and seasons considered in this study (see sub-section Data). Moreover, for leagues where there is a balanced number of home and away matches (like those in the English rugby union system), this method may reduce potential bias caused due to variations in team ability by calculating HA over an entire season (Pollard, 2006; Pollard and Gómez, 2009; Sánchez et al., 2009). While the above formula was originally suggested by Pollard (1986) for leagues where games are played to a finish (i.e., no tied or drawn outcomes), from a practical sense, the number of draws that can occur during a rugby union season is very low in comparison to sports like football, where drawn games will be much more common. For instance, there was less than 1% drawn games in the 2022–2023 Gallagher Premiership (rugby union) season while this number increased to 23% for English Premier League (football) in the same league season (Livesport, 2023a, 2023b). Therefore, to utilise the above HA formula in this study, it was assumed that drawn matches across an English rugby union season are negligible. Importantly, researchers have suggested that in scenarios where point scoring systems are overly complicated like those in rugby union, using percentage of home wins can be considered as a valid method to quantify home advantage (Williams et al., 2005). Therefore, based on the resultant calculation, if HA was to influence a league season, a value above 50% suggests that teams are more likely to win home matches than away matches. Consequently, larger values above 50% represents greater magnitude of HA within a considered league (Lago-Peñas et al., 2017; Pollard and Gómez, 2015).
Thereafter, to further strengthen the robustness of results, HA was also quantified using ‘Pollard's rescaled method’ when conducting specific sensitivity analysis in this study (discussed later in the results) (Almeida and Leite, 2021; Matos et al., 2019). Particularly, this method quantifies HA for each team per season based on the below formula.
Where
Data
The data sample used in this study consisted of 22,264 matches (across the last 25 years) played in the top four tiers of the English rugby union system (i.e., Tier 1: Gallagher Premiership, Tier 2: Rugby Football Union Championship, Tier 3: National League 1, Tier 4: National League 2). Importantly, the sample of matches represents every league game played during the regular season in all the tiers since 2000/01 until the recently concluded 2024/25 season. However, due to disruptions during COVID-19 lockdown, in the 2020/21 season, matches in Tiers 3 and 4 were cancelled completely, while some Tier 1 and 2 games were also abandoned. Moreover, research suggested that HA was significantly impacted by the lack of fans in stadia during the pandemic period (Delbianco et al., 2023; Leitner et al., 2023). Therefore, to account for such variations in the sample, data from 2020/21 season were omitted from the initial analyses (see Table 1). When compiling the sample, match data were obtained from the website of the national governing body for English rugby union (Rugby, 2023). For more recent seasons, the prior website had data available for the percentage of home wins and losses. Particularly, to ensure the quality of the collected data, those statistics were validated using raw win/loss data from a selected season to ensure their accuracy. This was achieved by calculating the HA percentage for the 2022/23 Gallagher Premiership season and cross referencing it with the relevant statistic provided on the England rugby union website and a secondary rugby union results archive (Livesport, 2023b). Data collection began when 100% agreement was achieved between the multiple modes of HA presentation. The subsequent home and away wins, draws, home advantage and total matches data were stored in a Microsoft Excel file prior to data analysis discussed later. In terms of data required for the sensitivity analysis based on HA quantification using Pollard's rescaled method stated previously, total home and away points acquired by each team during a season were extracted by web scraping two online rugby union result archives: Livesport (https://www.livesport.com/uk/rugby-union/) and All.sport (https://all.rugby/tournament/premiership/table) using R programming language. Similar to the previous step, data available in both those archives were validated against the official England Rugby website (https://www.englandrugby.com/fixtures-and-results) prior to full data collection.
Total matches in each tier per season.
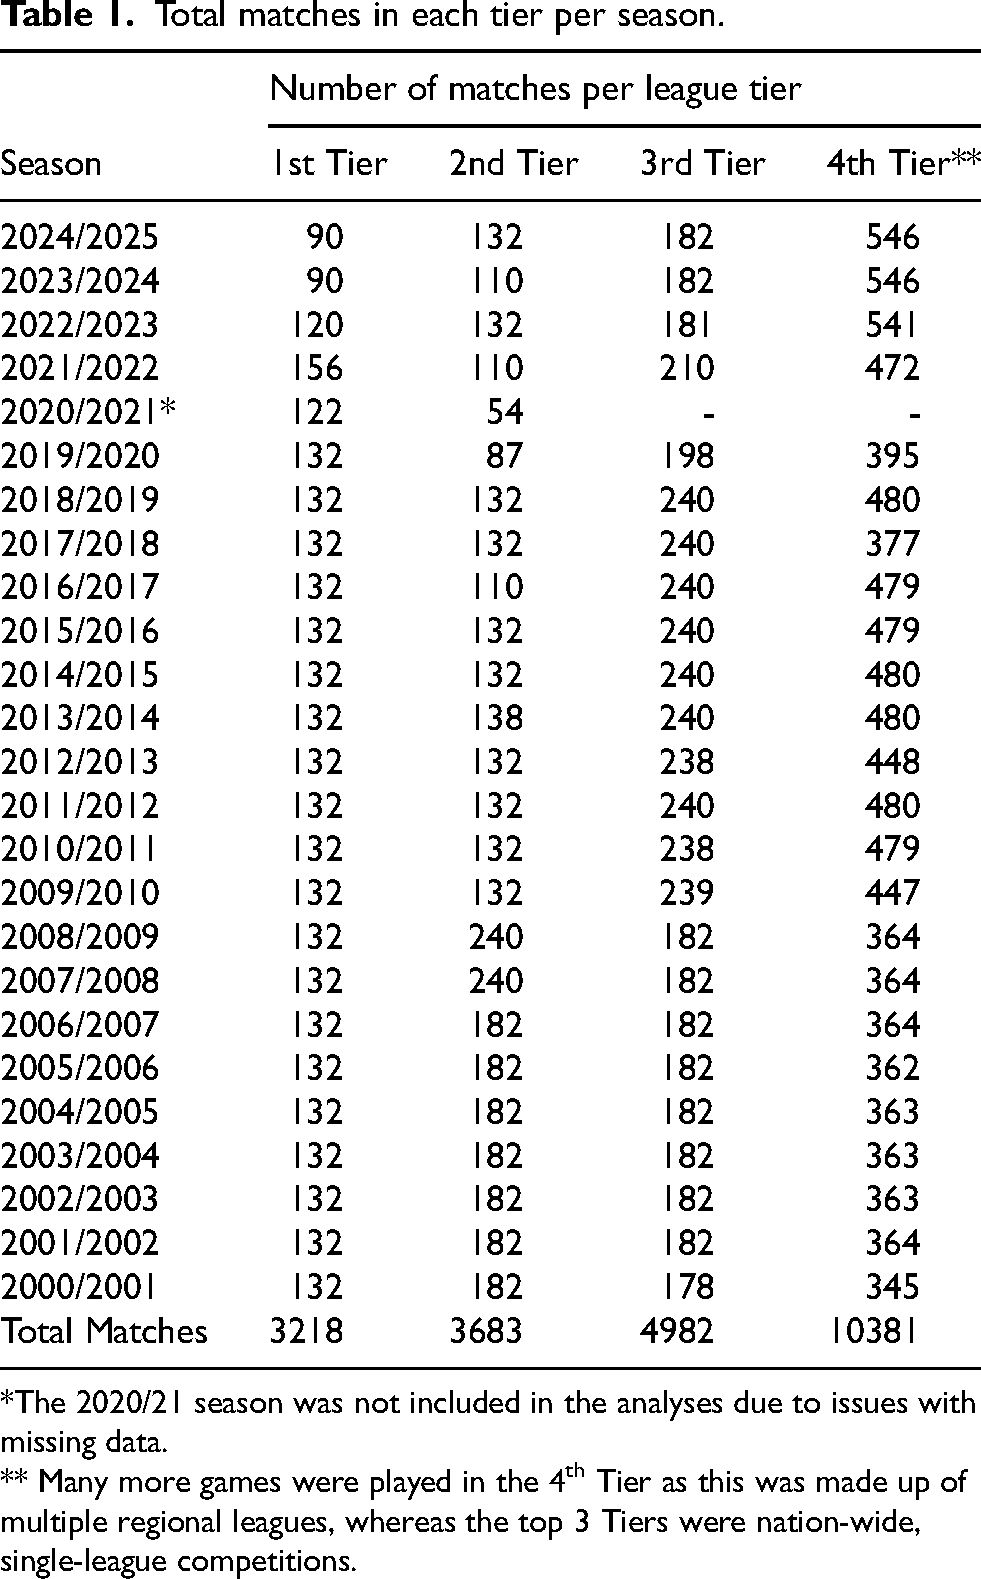
*The 2020/21 season was not included in the analyses due to issues with missing data.
** Many more games were played in the 4th Tier as this was made up of multiple regional leagues, whereas the top 3 Tiers were nation-wide, single-league competitions.
Statistical analysis
Descriptive and inferential statistics
Home advantage was calculated for each season and Tier (Tier 1 = HA1, Tier 2 = HA2, Tier 3 = HA3, Tier 4 = HA4) and visualised using a bar chart. Additionally, sample means and standard deviations were used to summarise the home advantage prevalent in the four leagues. Initially, the extent of HA (which was quantified using Pollard's traditional method) in each tier of the English rugby union system was assessed using one sample t-tests, where observed mean home advantage across the seasons was compared against a null value of 50% illustrating no HA. Next, by combining the data across the 24 seasons, a one-way repeated measures ANOVA (within effect only) was used to evaluate the global difference in HA across the four tiers. Importantly, effect sizes of the one-way repeated measures ANOVA were calculated using partial η2 and converted to the Cohen's f statistic. In this instance, based on the guideline available in literature (Cohen, 1992), effect sizes were interpreted as small (f = 0.1), medium (f = 0.25) and large (f = 0.4). Afterwards, pairwise t-tests with Bonferroni corrections pertaining to the four tiers were conducted to analyse the main effects pertaining to the ANOVA. Effect sizes of the post hoc tests were interpreted based on the Cohen's d criteria: small (d = 0.2), medium (d = 0.5) and large (d = 0.8) (Cohen, 1992). Moreover, normality of all samples in the analysis was assessed using Shapiro-Wilk tests (p > 0.05) and visualised used Q-Q plots. The assumption of sphericity for the repeated measures ANOVA was assessed using Mauchly's test and the Greenhouse-Geisser adjustment was used to account for any violations of sphericity.
Longitudinal analysis of home advantage
To further explore longitudinal fluctuations in HA, a line chart was initially used to visualise variation in HA over time for all four tiers of English rugby union. Thereafter, control charts presented in statistical process control (SPC) were used to investigate the stability of HA over time for each of the considered tiers. Although the use of control charts in sports analytics remains under-researched (Morgulev et al., 2022; Sands et al., 2019), they offer a valuable tool for identifying non-random variation (or special cause variation) within a process. In this context, the underlying system or set of factors that generate home advantage (for a season) over time within a given tier was considered as a process. Consequently, XmR charts were used to evaluate the longitudinal stability of home advantage in English rugby union (Mohammed et al., 2008; Seoh, 2019; Wheeler, 2017). XmR charts were chosen considering HA is represented in this instance as continuous data and since sub-groupings are of size one (i.e., only a single entry for each time point) (Mohammed et al., 2008). Based on below standard formulae, three sigma limits were used to define control limits for each component of the XmR chart (Mohammed et al., 2008). Where,
Average chart (X-chart)
Control Limit (CL) = Upper (UCL) and Lower Control Limit (LCL) at 3-sigma = The corresponding 1- and 2-sigma levels were defined based on the same prior formula.
Moving range chart (mR)
Control Limit (CL) = Upper Control Limit (UCL) =
Wheeler (2017) highlights that one of the key requirements for XmR charts to operate as intended is to ensure that data are collected under similar conditions. Thereby, since most games in 2020/21 season were played behind closed doors due to COVID-19 restrictions, to ensure the homogeneity of sub-groups, data from this season were not considered when developing the XmR charts. Moreover, although XmR charts could be applied to moderately autocorrelated data, researchers highlight the importance of examining the independence of time-ordered observations when developing control charts (Mohammed et al., 2008). Thereby, autocorrelation function (ACF) plots were used to examine autocorrelation in the considered time-series data. Particularly, correlation at lag 1 was examined and control limits were widened if it was greater than 0.4 (Mohammed et al., 2008).
Although the Nelson (1984) and Western Electric (1956) rules are commonly used to detect special cause (non-random) variation in control charts, there is limited consensus on which rules are most suitable for identifying such variation in XmR charts. Also, since Wheeler (2017) emphasises the importance of being cautious when applying too many rules to control charts due to the increased risk of overreaction and false alarms, we limited our analysis to four key rules that are widely recommended in the literature to identify instances of non-random variation in HA from the XmR charts (Mohammed et al., 2008). Importantly, while all rules were considered for the X-chart, only the first one was used in the moving range chart.
Any single point falling beyond the 3-sigma control limits. A run of seven or more points on the same side of the centre line. Two out of three consecutive points falling beyond the two-sigma limits on the same side of the centre line. A run of seven points, all trending consistently upward or downward.
Sensitivity analysis
In the final stage of the analysis, to strengthen the robustness of results, a further sensitivity analysis of HA in the last decade (i.e., from 2014/15 to 2024/25 seasons) was conducted by quantifying HA from Pollard's rescaled method stated previously. This analysis was performed for the tiers that demonstrated significant differences in HA, identified from the post-hoc repeated measures ANOVA discussed previously. Specifically, linear mixed models (LMM) were developed for each tier to evaluate more recent variations in HA (i.e., from 2014/15 season onwards). The response variable for the models was the HA percentage calculated per team per season. No aggregation or averaging of HA values across teams or seasons was performed prior to the modelling. Instead, each team-season HA value was treated as an individual observation, with ‘Season’ included as a fixed effect to capture overarching temporal trends. Team was modelled as a random intercept to account for baseline differences in HA between teams. This structure allowed within-season and between-team variability to be preserved, ensuring that the model-derived estimates of seasonal effects were based on the full set of raw team-level data. Effectiveness of the subsequent models were determined by performing likelihood ratio tests against the null model and thorough analysis of the residuals. Finally, an alpha level of 0.05 was set for the statistical analysis and all calculations and visualisations reported in this study were formulated using R programming language through the RStudio integrated development environment.
Sample sizes
Priori sample size calculations were performed using R to determine the minimum sample sizes required for the hypothesis tests. Specifically, for the t-tests, at an alpha level of 0.05 and 80% power, the sample size calculation illustrated that 15 seasons of home advantage data were necessary for detecting a large effect (d = 0.8) of home advantage in each tier (using pwr package). The large effect size was considered due to such values observed in football HA studies adopting similar methods (Almeida and Volossovitch, 2017). Subsequently, because the dataset of the final analysis contained 24 seasons of data, this outcome illustrated adequate sample sizes to evaluate the first hypothesis (i.e., prevalence of HA in each tier). In terms of the second test, at an alpha level of 0.05, 80% power and considering no violations of sphericity, the priori sample calculations illustrated that 70 seasons of home advantage data was necessary for the one-way repeated measures ANOVA to detect a large effect of f = 0.4 (note: sample size calculation for repeated measures ANOVA requires effect sizes to be specified via Cohen's f statistic) in HA between the four tiers (based on WebPower package in R) (Cohen, 1992). However, it was not practically viable to attain this sample size. This was because rugby union turned professional in 1995 and would therefore theoretically result in only 30 maximum data points for the analysis. Moreover, since English rugby union home win data were only available from year 2000, the final dataset was limited to 24 seasons (with the exclusion of 2020/21 season data due to disruptions of COVID-19 pandemic). The subsequent situation illustrated that, unless the true effect size of the sample was much larger than that set in the priori (i.e., f = 0.4), the second hypothesis test (i.e., to examine differences in HA between the tiers) can become underpowered. Unfortunately, such limitations in sample sizes due to study design constraints can be likely when undertaking applied research like those examined in this research (Lakens, 2022).
Results
Figure 1 illustrates a summary of the percentage of home advantage prevailing in English rugby union from 2000/01 to 2024/25 seasons. Specifically, based on the sample data, Tier 1 (M = 64.37, SD = 4.37) matches were the most highly influenced by home advantage, whilst Tier 2 (M = 59.69, SD = 4.02) matches were least influenced. Interestingly, there was nearly identical presence of home advantage in Tier 3 (M = 61.75, SD = 2.04) and Tier 4 (M = 61.79, SD = 1.87).
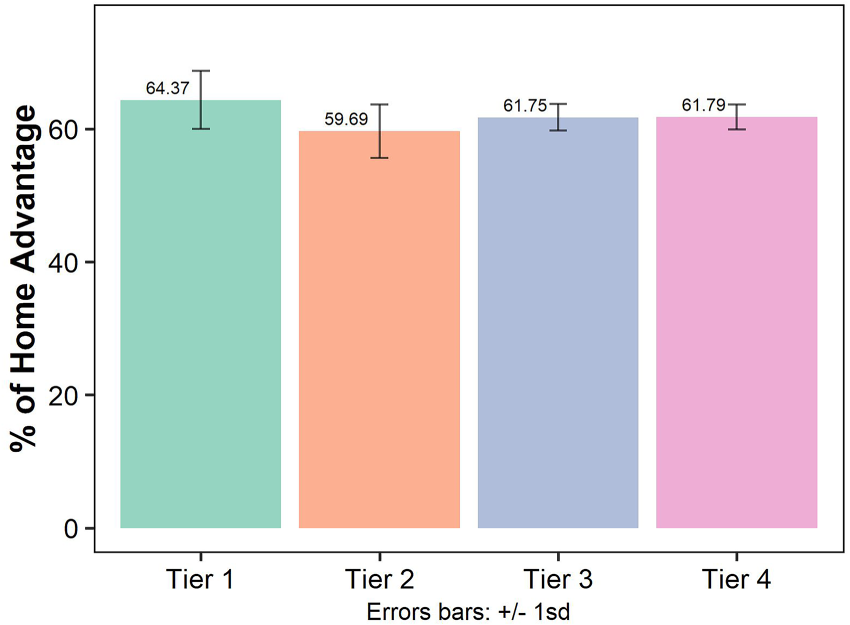
Summary of home advantage in the top four tiers of English rugby union from 2000/01–2024/25 seasons.
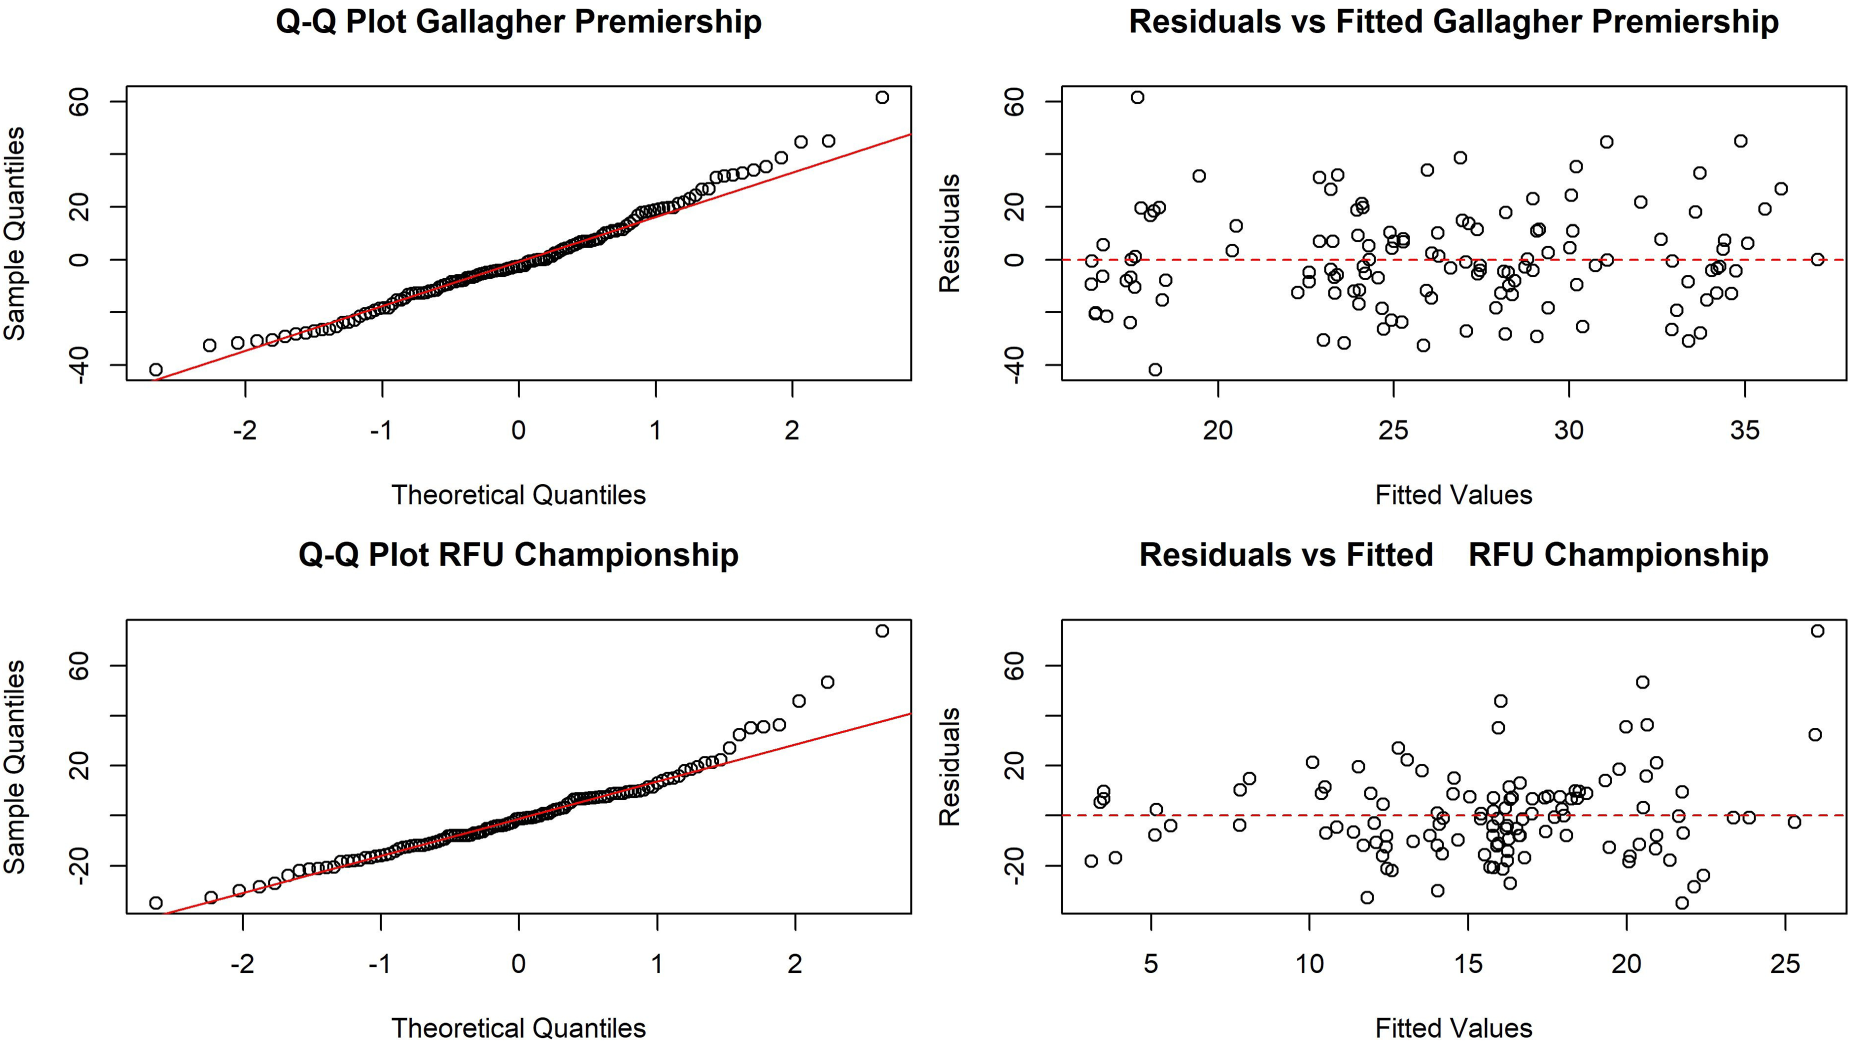
Results of Shapiro-Wilk tests (Tier 1: p = 0.49, Tier 2: p = 0.1, Tier 3: p = 0.96, Tier 4 = 0.99) and Q-Q plots (see Figure 2) signified that all sample data were normally distributed. Hence, considering the first hypothesis test, the results indicated that the mean HA % of all Tiers observed in Figure 1 were significantly greater than 50%, illustrating a significant influence of HA on match outcomes in each of the top four tiers of English rugby union (Tier 1: t(23) = 16.10, p < 0.001; Tier 2: t(23) = 11.80, p < 0.001; Tier 3: t(23) = 28.15, p < 0.001; Tier 4: t(23) = 30.83; p < 0.001).
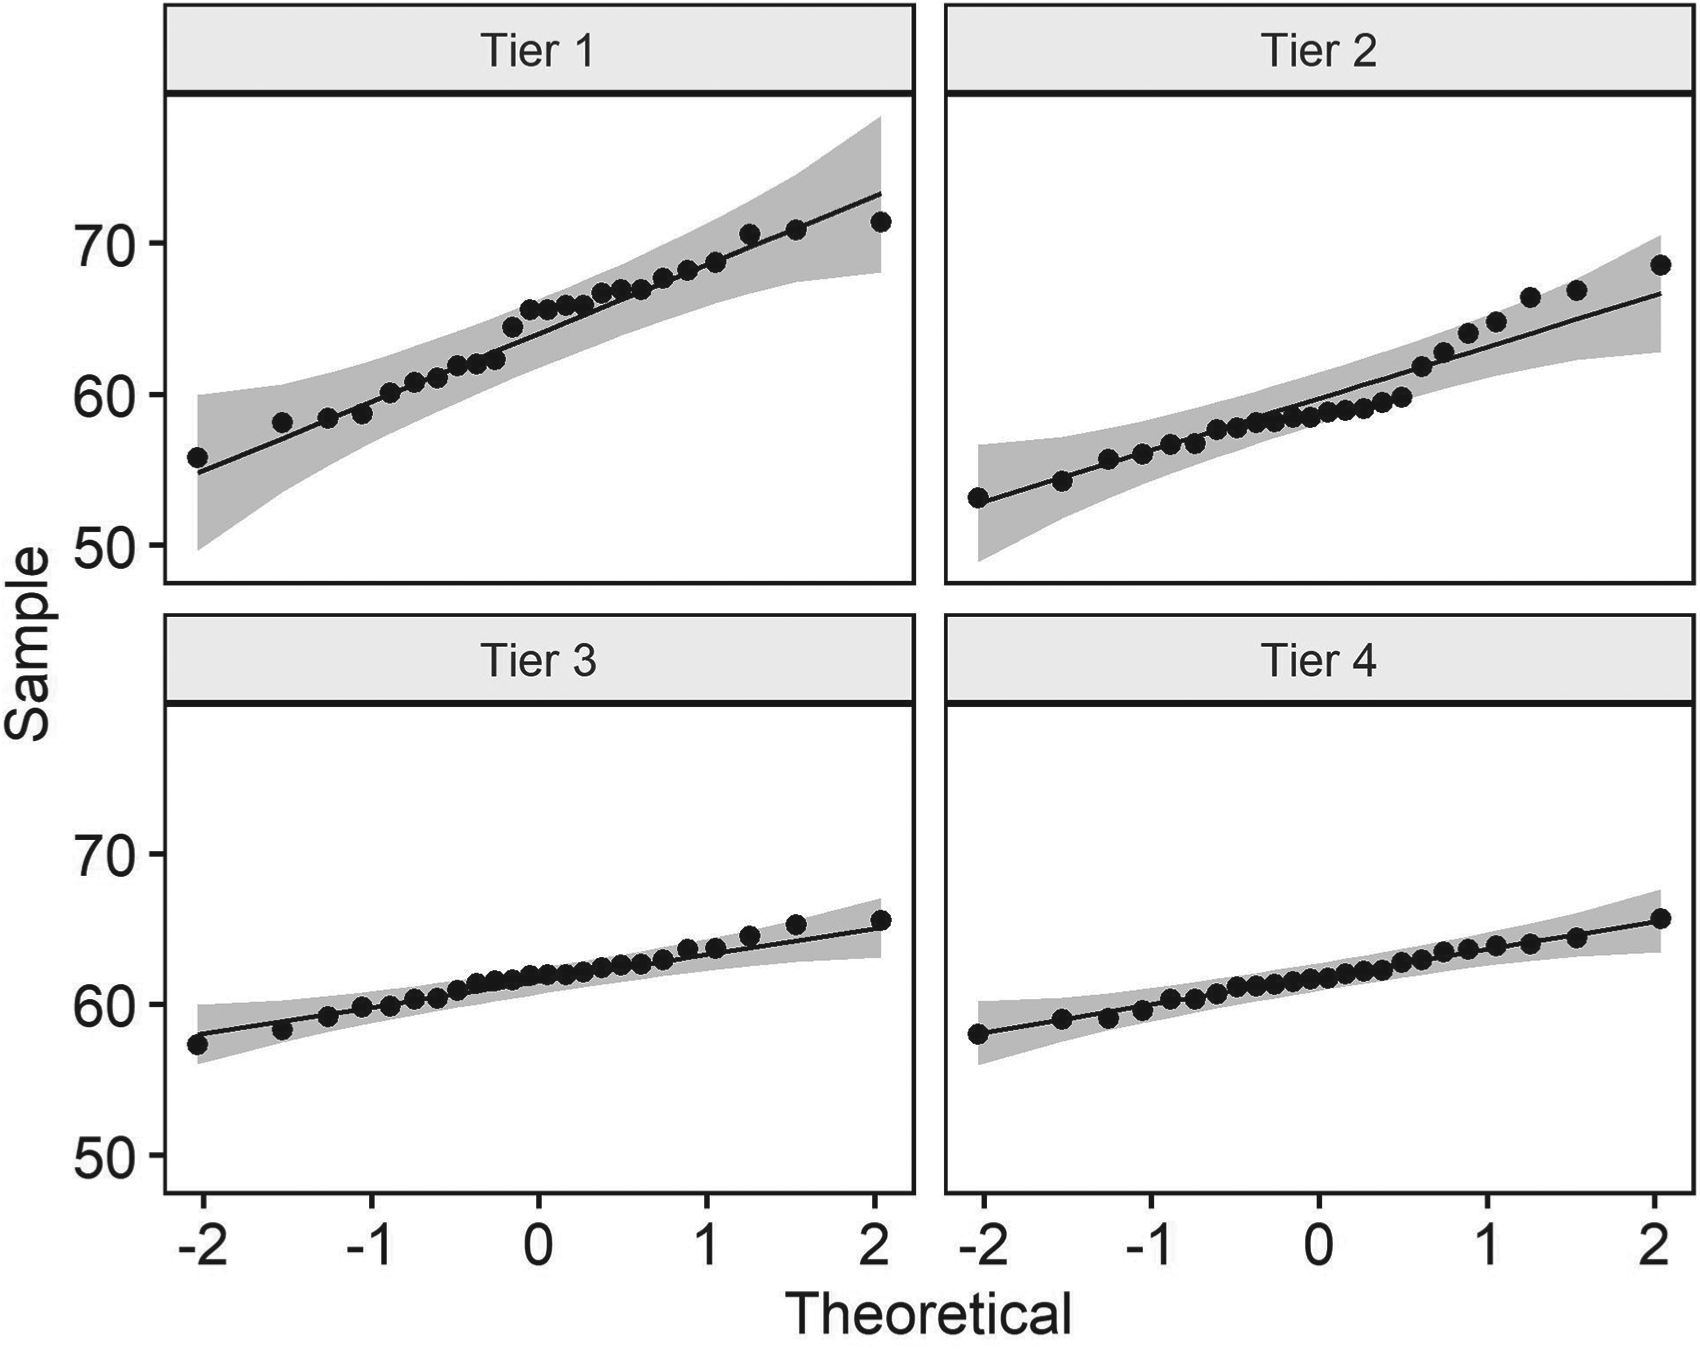
Q-Q plots of the sample data.
In terms of HA across the English rugby union tiers, outcomes of the one-way repeated measures ANOVA, with a Greenhouse-Geisser correction of 0.76 due to departure from sphericity (p = 0.012) highlighted that the magnitude of home advantage varied significantly across the top four tiers of English rugby union, F(2.28, 52.49) = 8.43, p < 0.001, f = 0.54. Moreover, post-hoc tests signified that the subsequent differences in HA were only significant between Tier 1 (M = 64.37, SD = 4.37) and Tier 2 (M = 59.69, SD = 4.02), Bonferroni adjusted p = 0.003, d = 0.83. Specifically, the result indicated an approximately large effect of HA difference between Tier 1 and 2, whilst all other comparisons were non-significant (p > 0.05) and illustrated small to medium effects.
Figure 3 illustrates the variation in HA from 2000/01 to 2024/25 seasons in all four tiers of the English rugby union system. Figures 4–7 presents the XmR control charts of each tier pertaining to longitudinal variability in home advantage for the considered duration. Importantly, as shown in the ACF plots in Figure 8, the lag-1 autocorrelations for all tiers were below the 0.4 threshold (Gallagher Premiership: r = -0.21, RFU Championship: r = 0.12, National League 1: r = -0.09, National League 2: r = 0.36). Thereby, no changes to control limits were necessary.
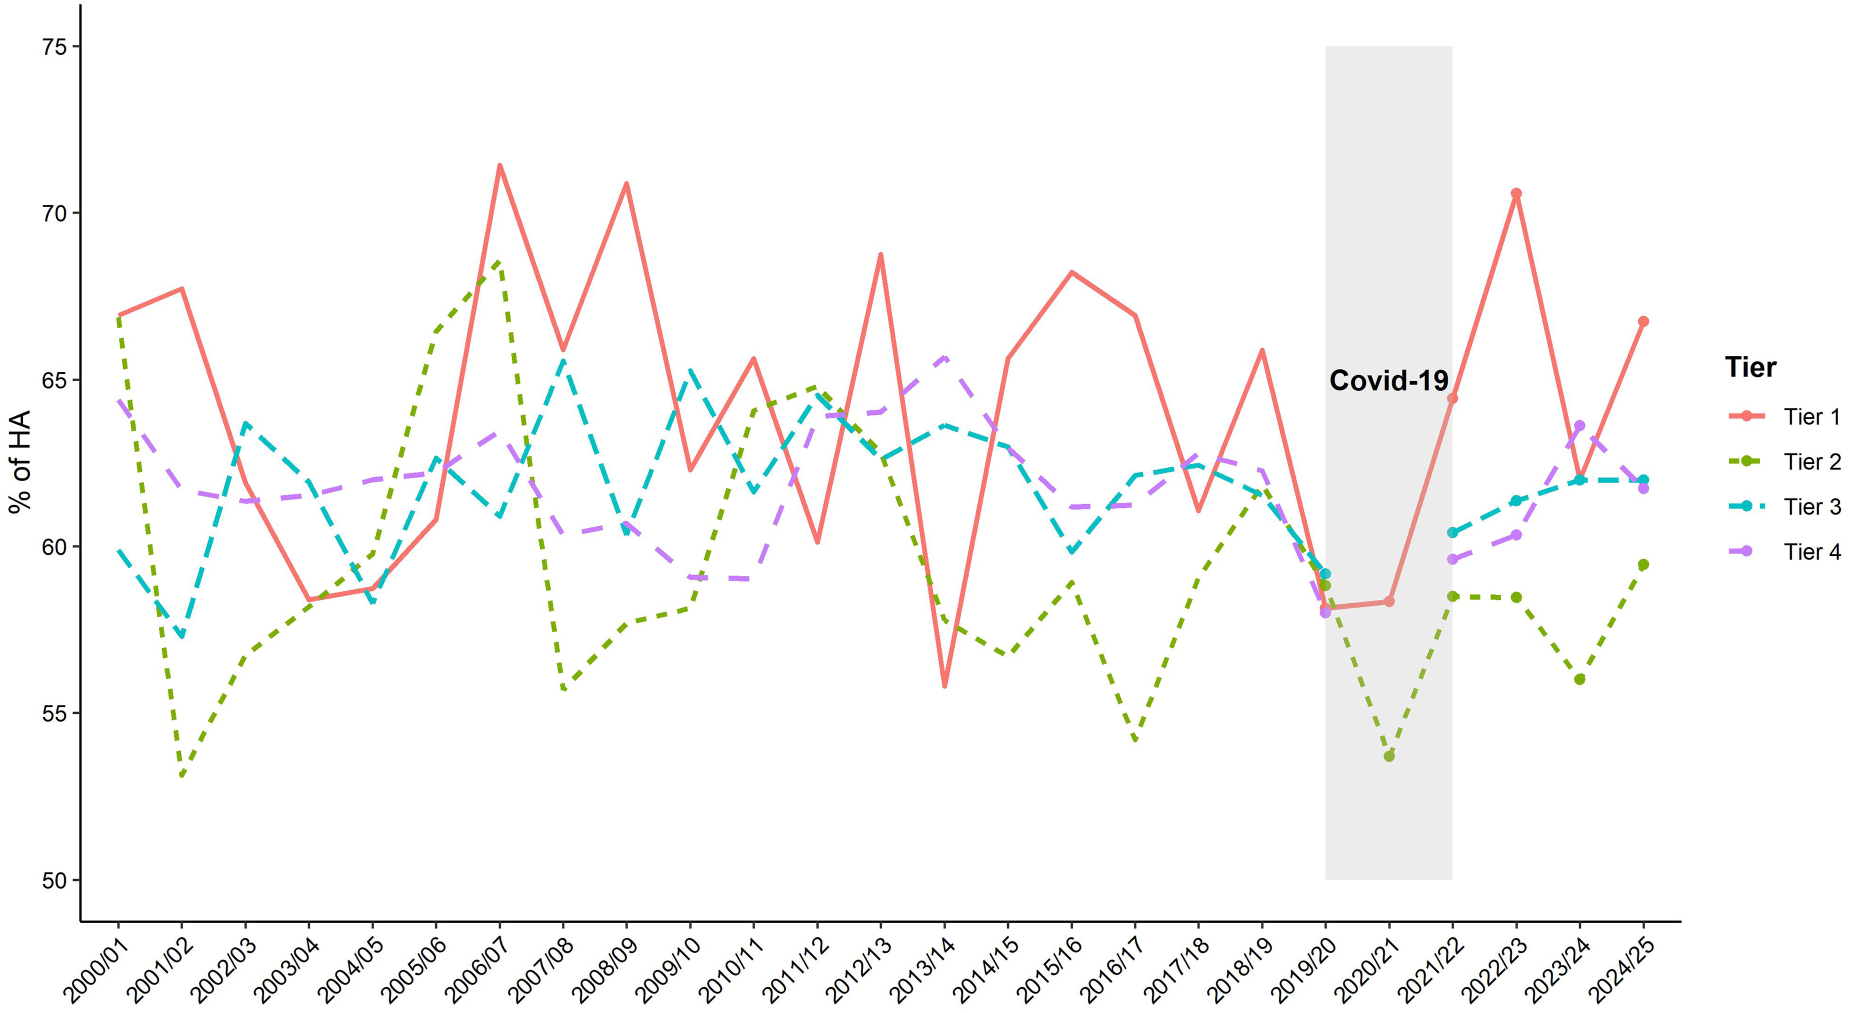
Home advantage in English Rugby union since 2000/01 season.
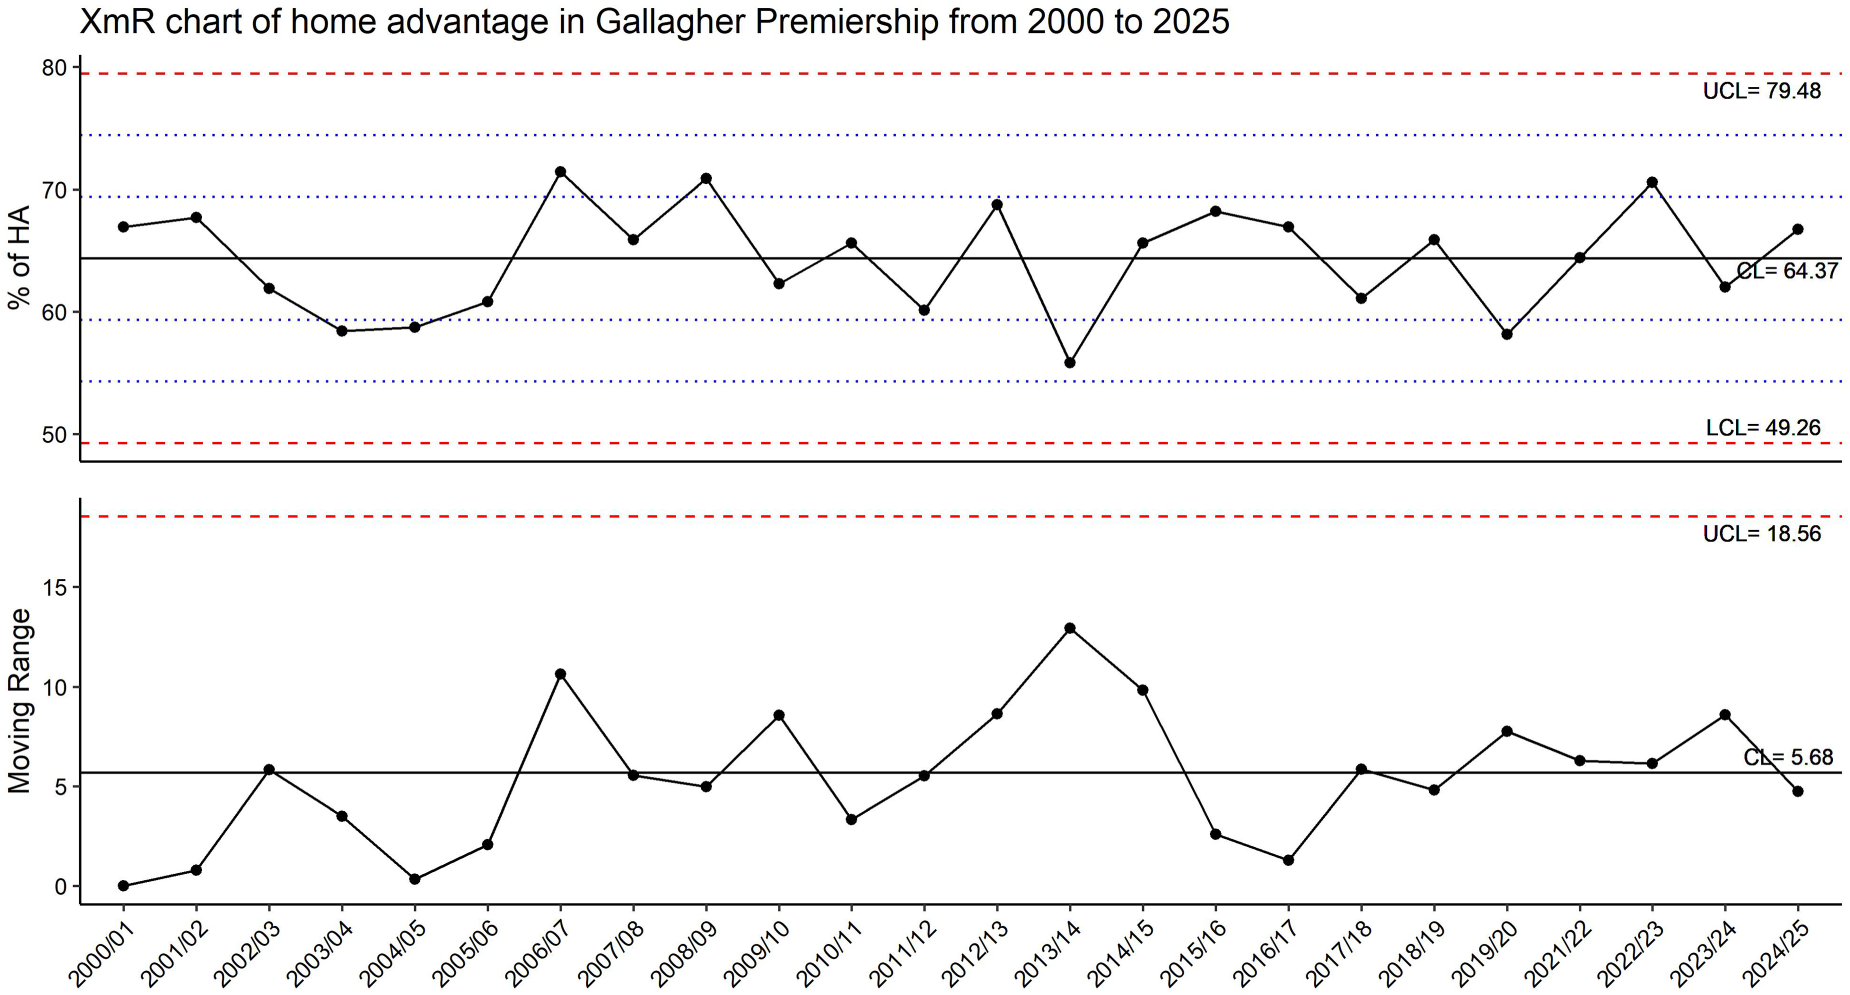
XmR chart of home advantage in Gallagher Premiership from 2000/01 to 2024/25 seasons.
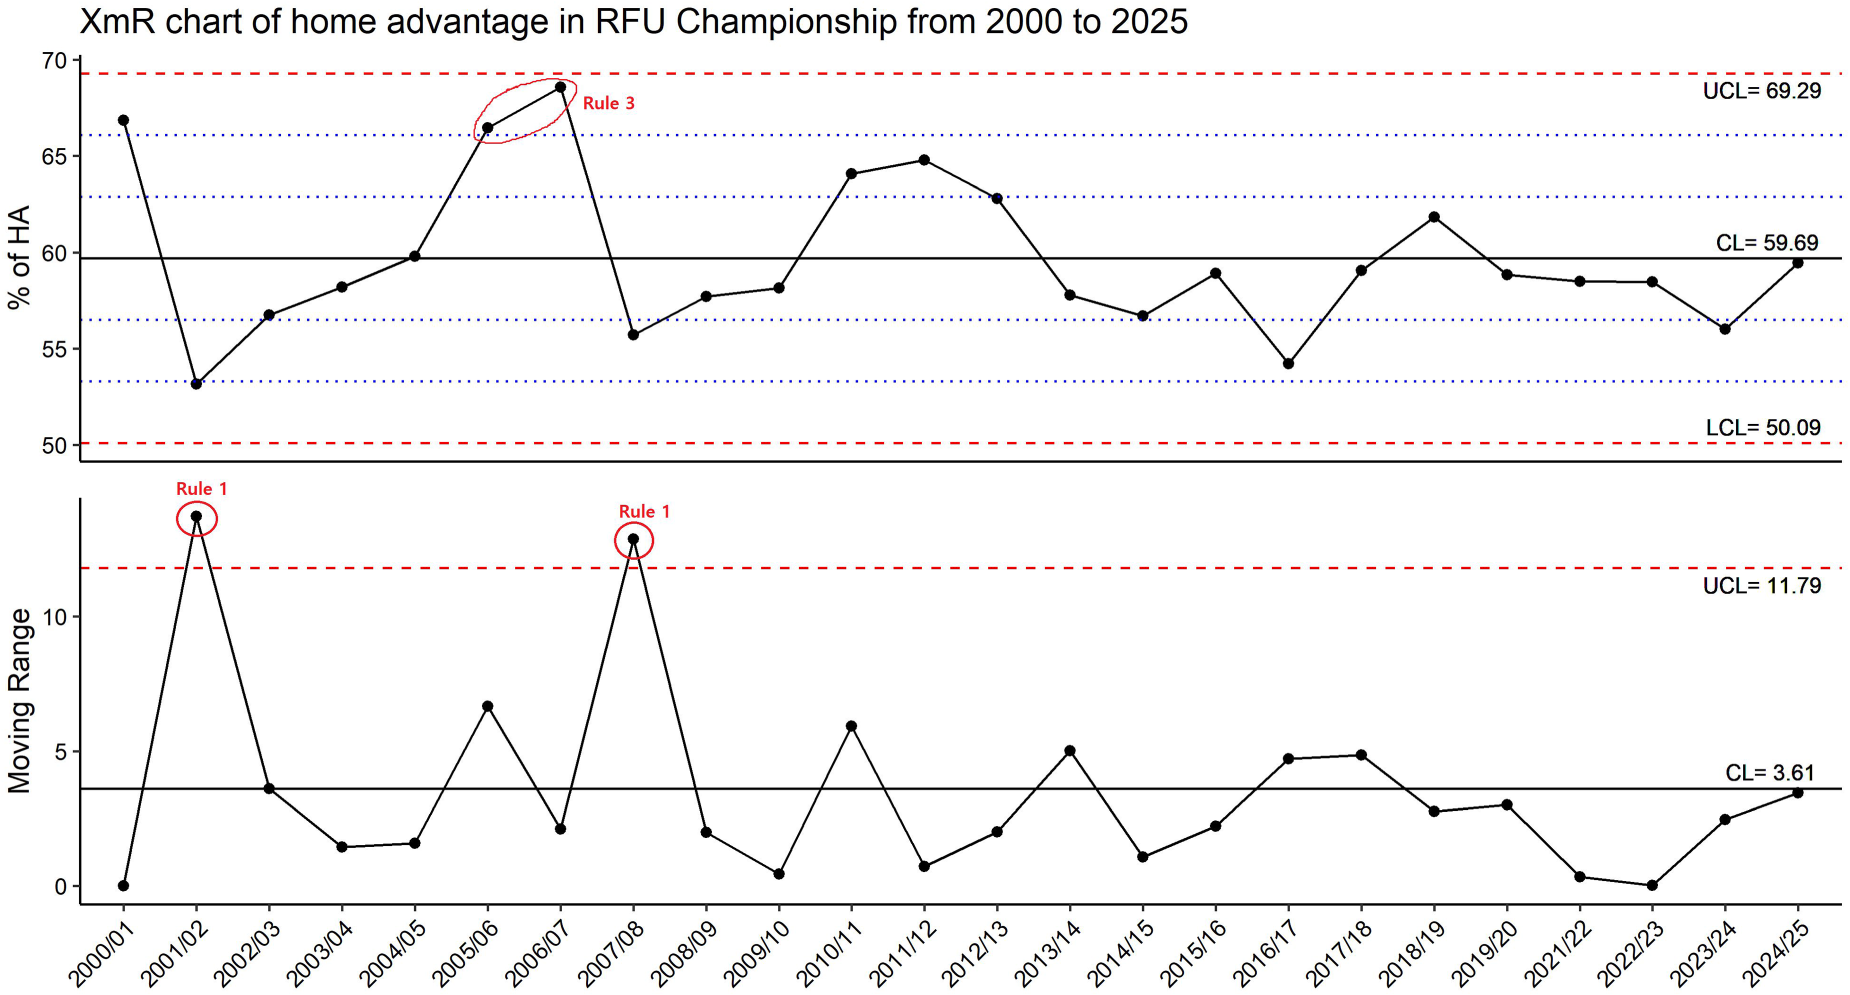
XmR chart of home advantage in RFU Championship from 2000/01 to 2024/25 seasons.
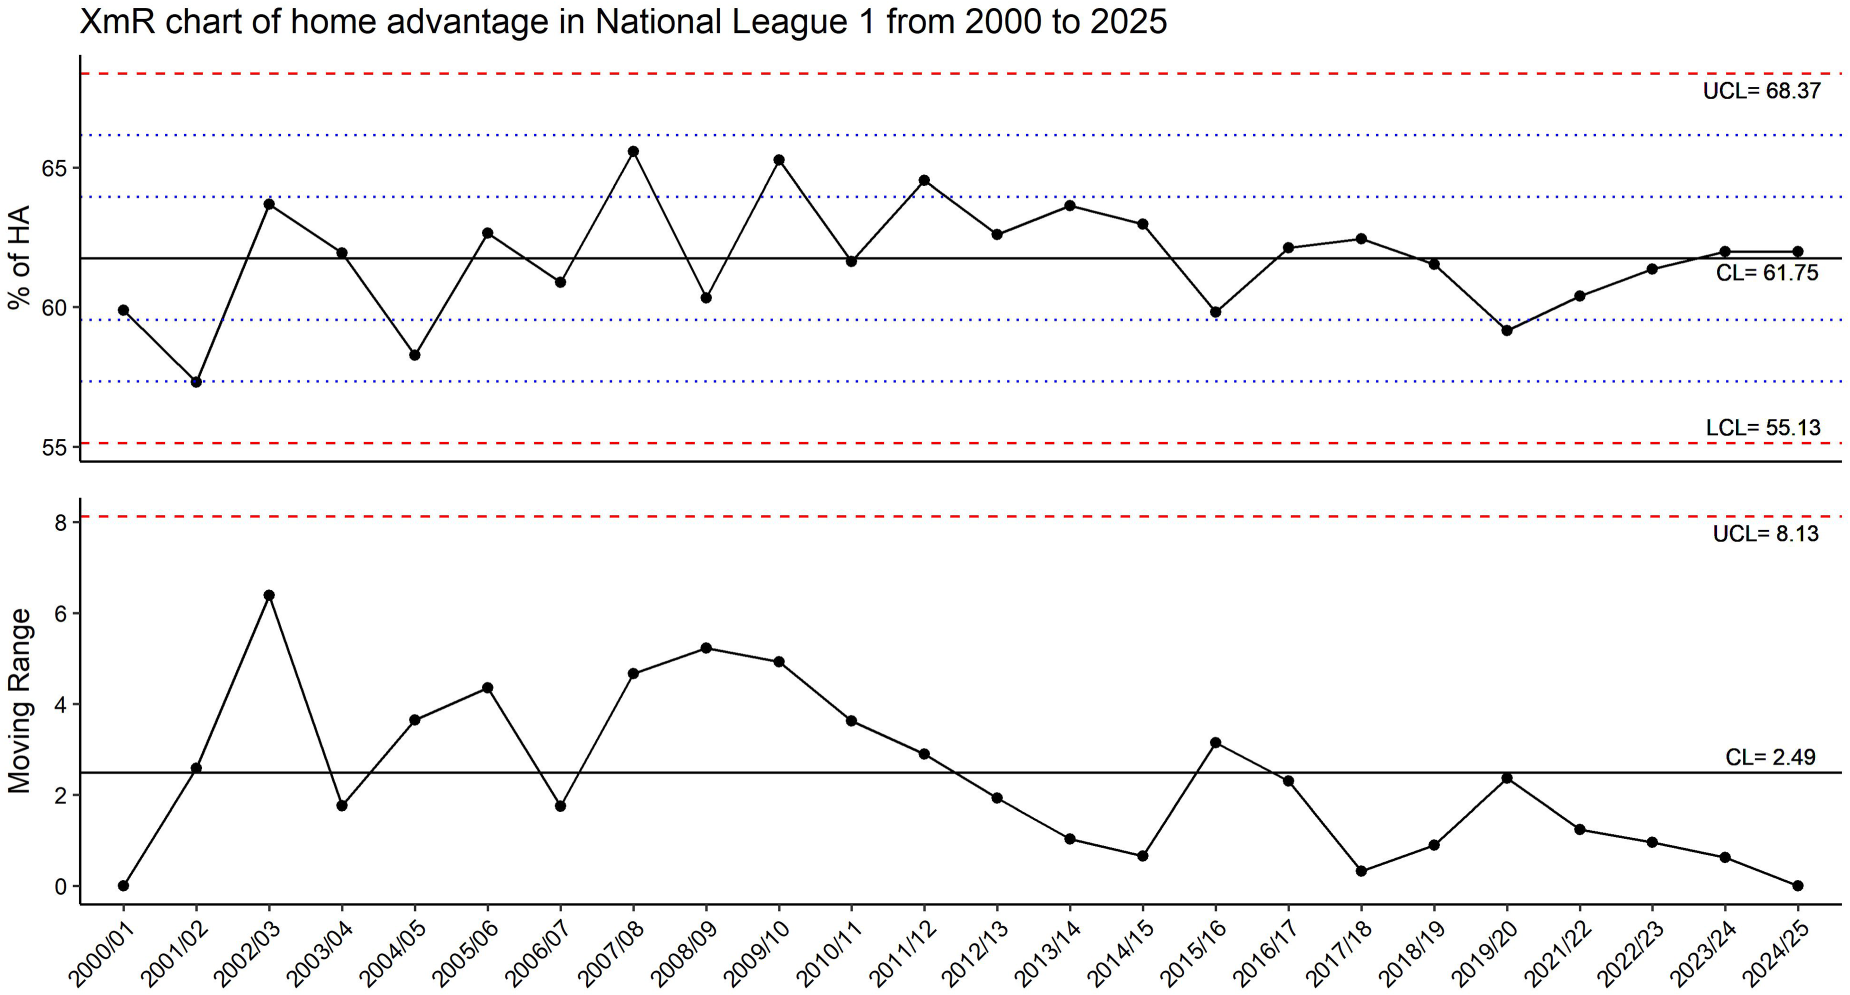
XmR chart of home advantage in National League 1 from 2000/01 to 2024/25 seasons.
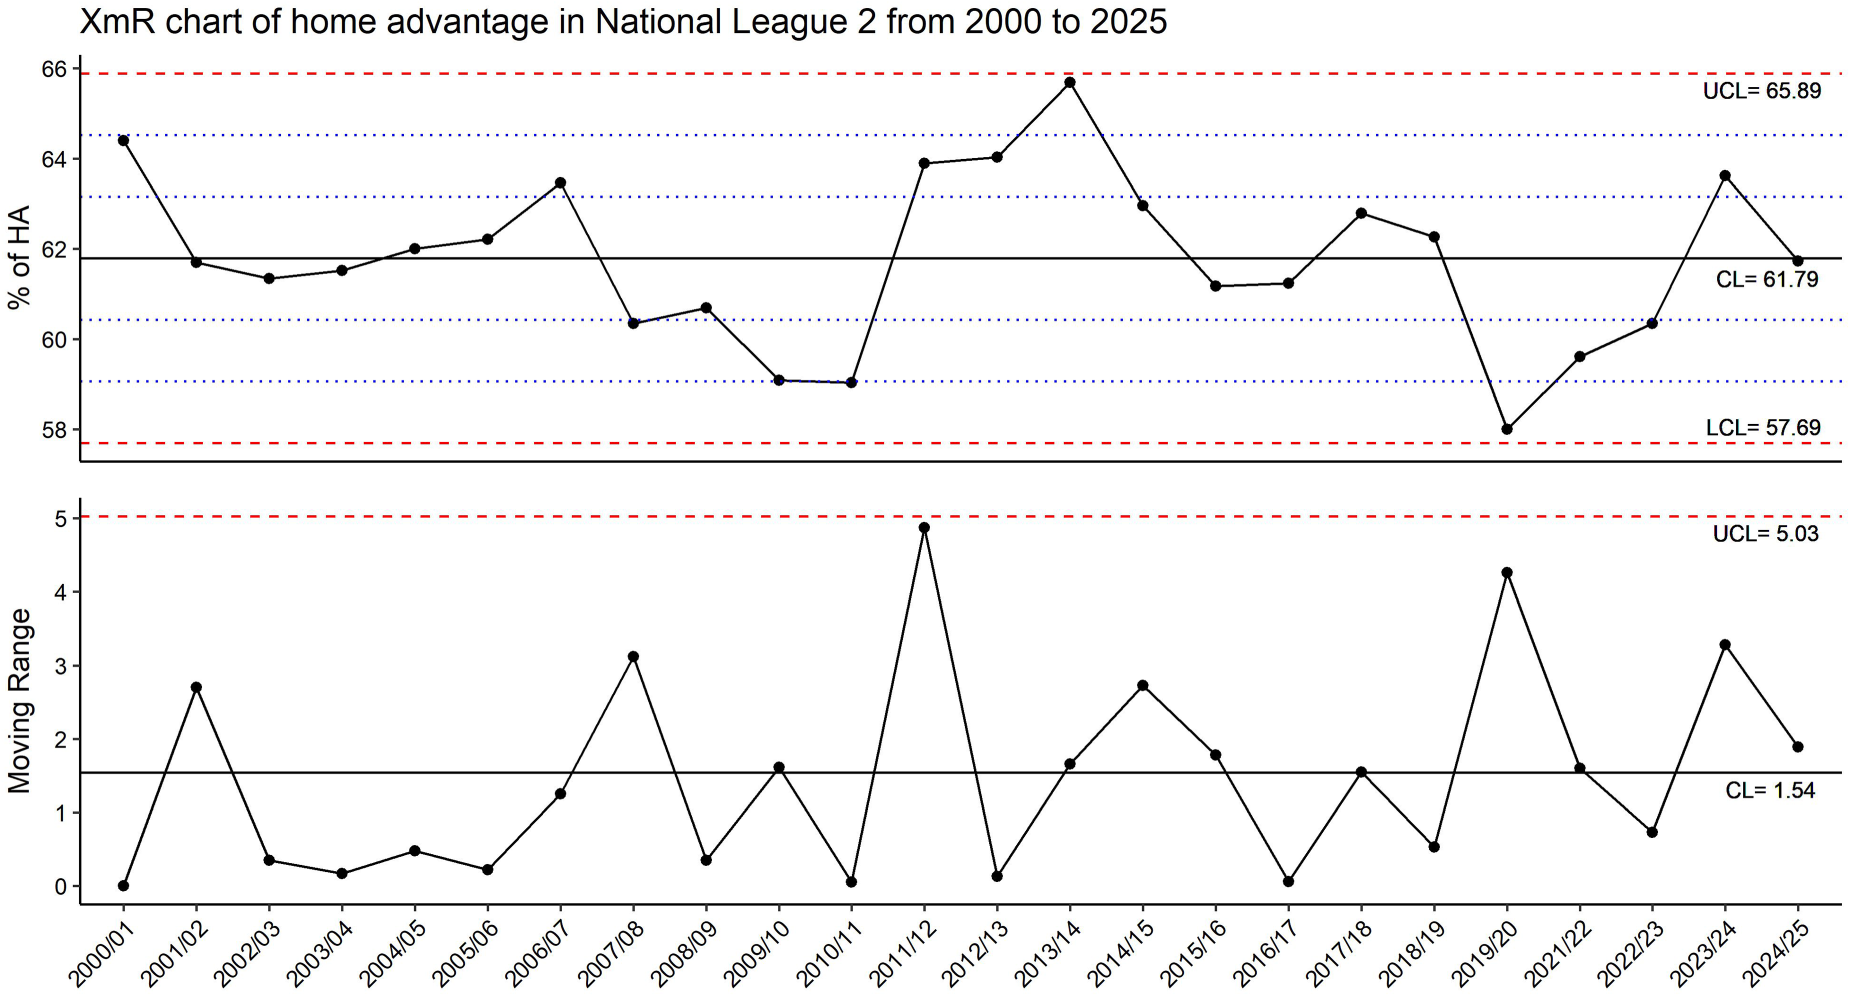
XmR chart of home advantage in National League 2 from 2000/01 to 2024/25 seasons.
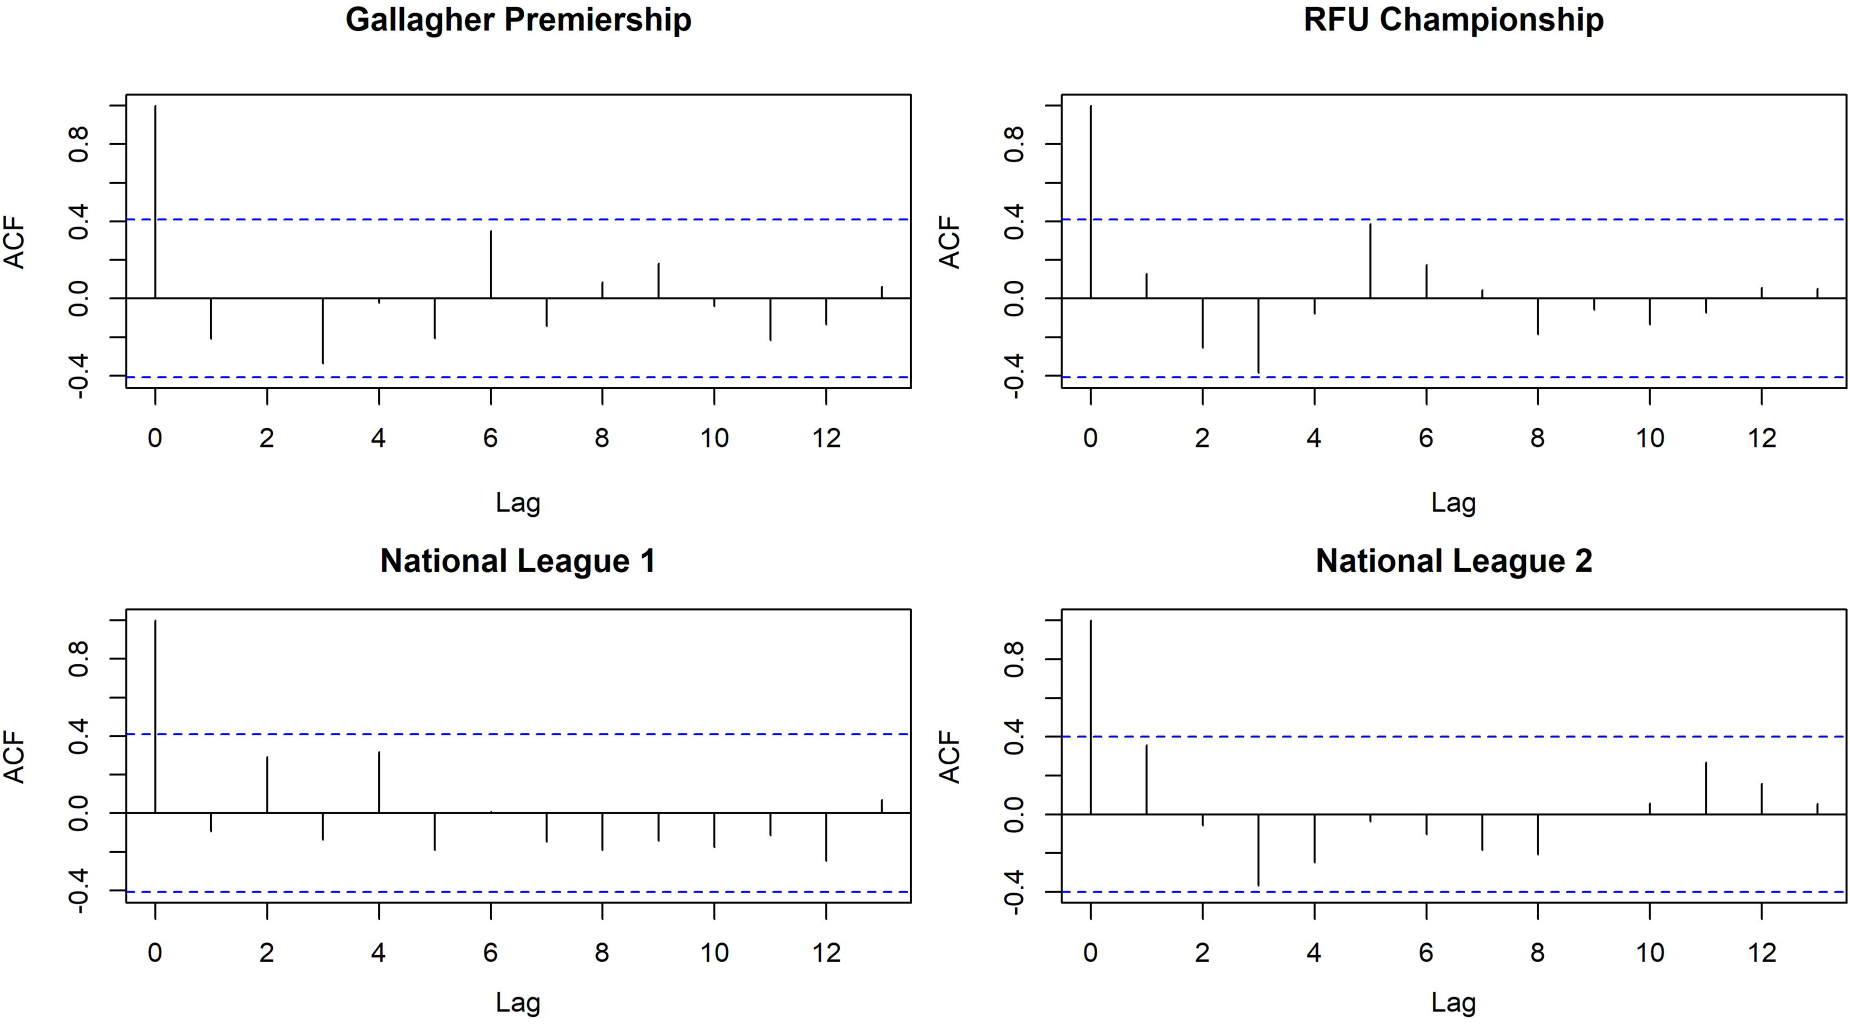
ACF plots representing the autocorrelation of home advantage data in all the considered tiers.
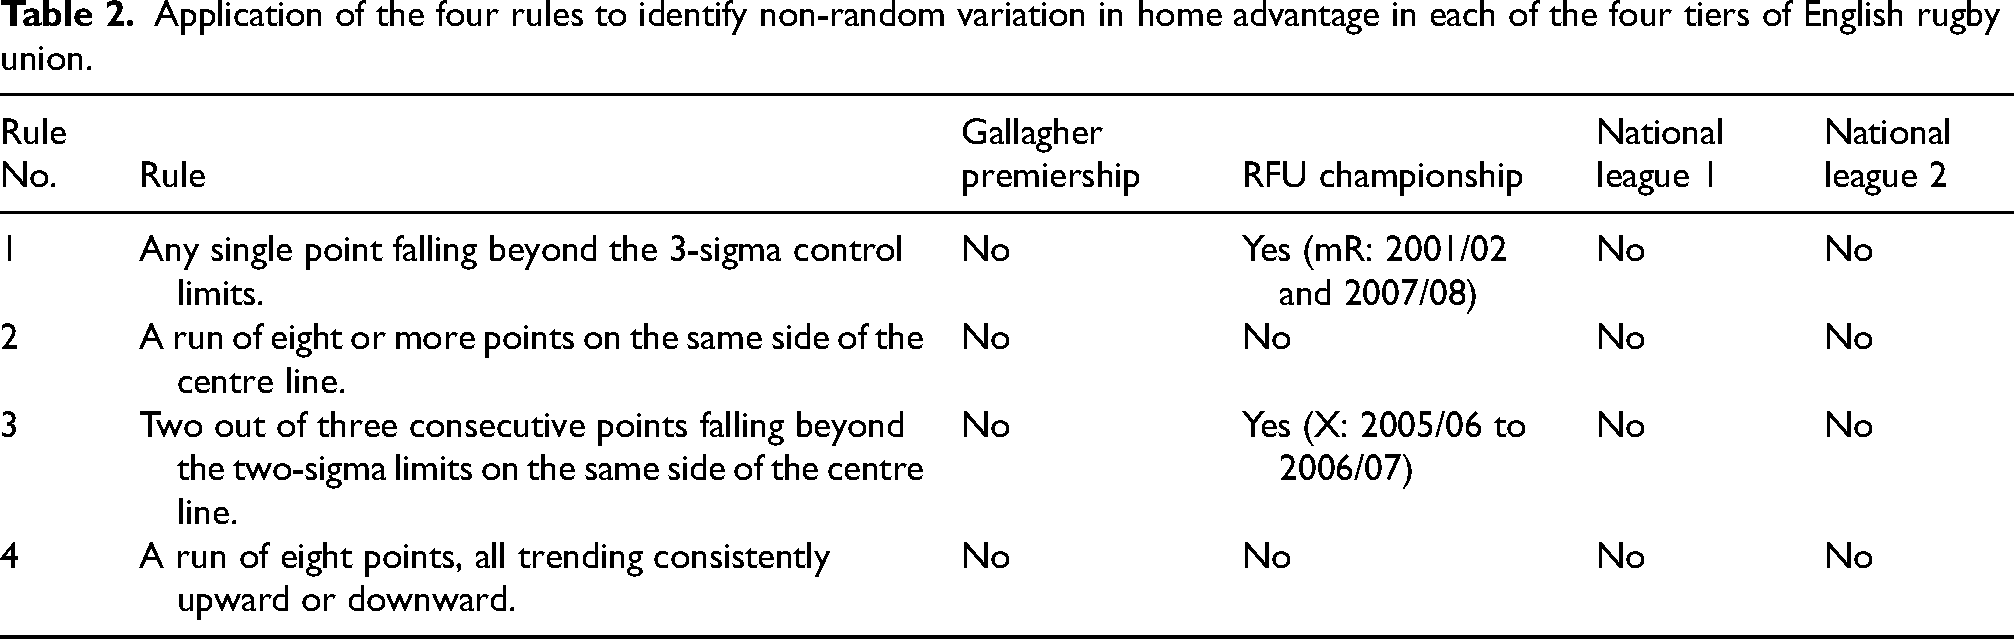
Application and interpretation of previously stated rules to identify non-random variation in HA have been depicted in Table 2. Among all tiers, only RFU Championship demonstrated instances of such variation in home advantage within the considered period. Specifically, the moving range chart illustrated two sudden drops in home advantage in the RFU Championship when shifting from 2000/01 to 2001/02 and 2006/07 to 2007/08 seasons. Additionally, the X-chart of the same league highlighted that HA remained considerably high between 2005/06 to 2006/07 seasons. Particularly, suggesting the presence of non-random variation in home advantage in the RFU championship between 2005 to 2008 period. All other tiers (specially Gallagher Premiership) demonstrated a stable presence of home advantage since the 2000/01 season.
Application of the four rules to identify non-random variation in home advantage in each of the four tiers of English rugby union.
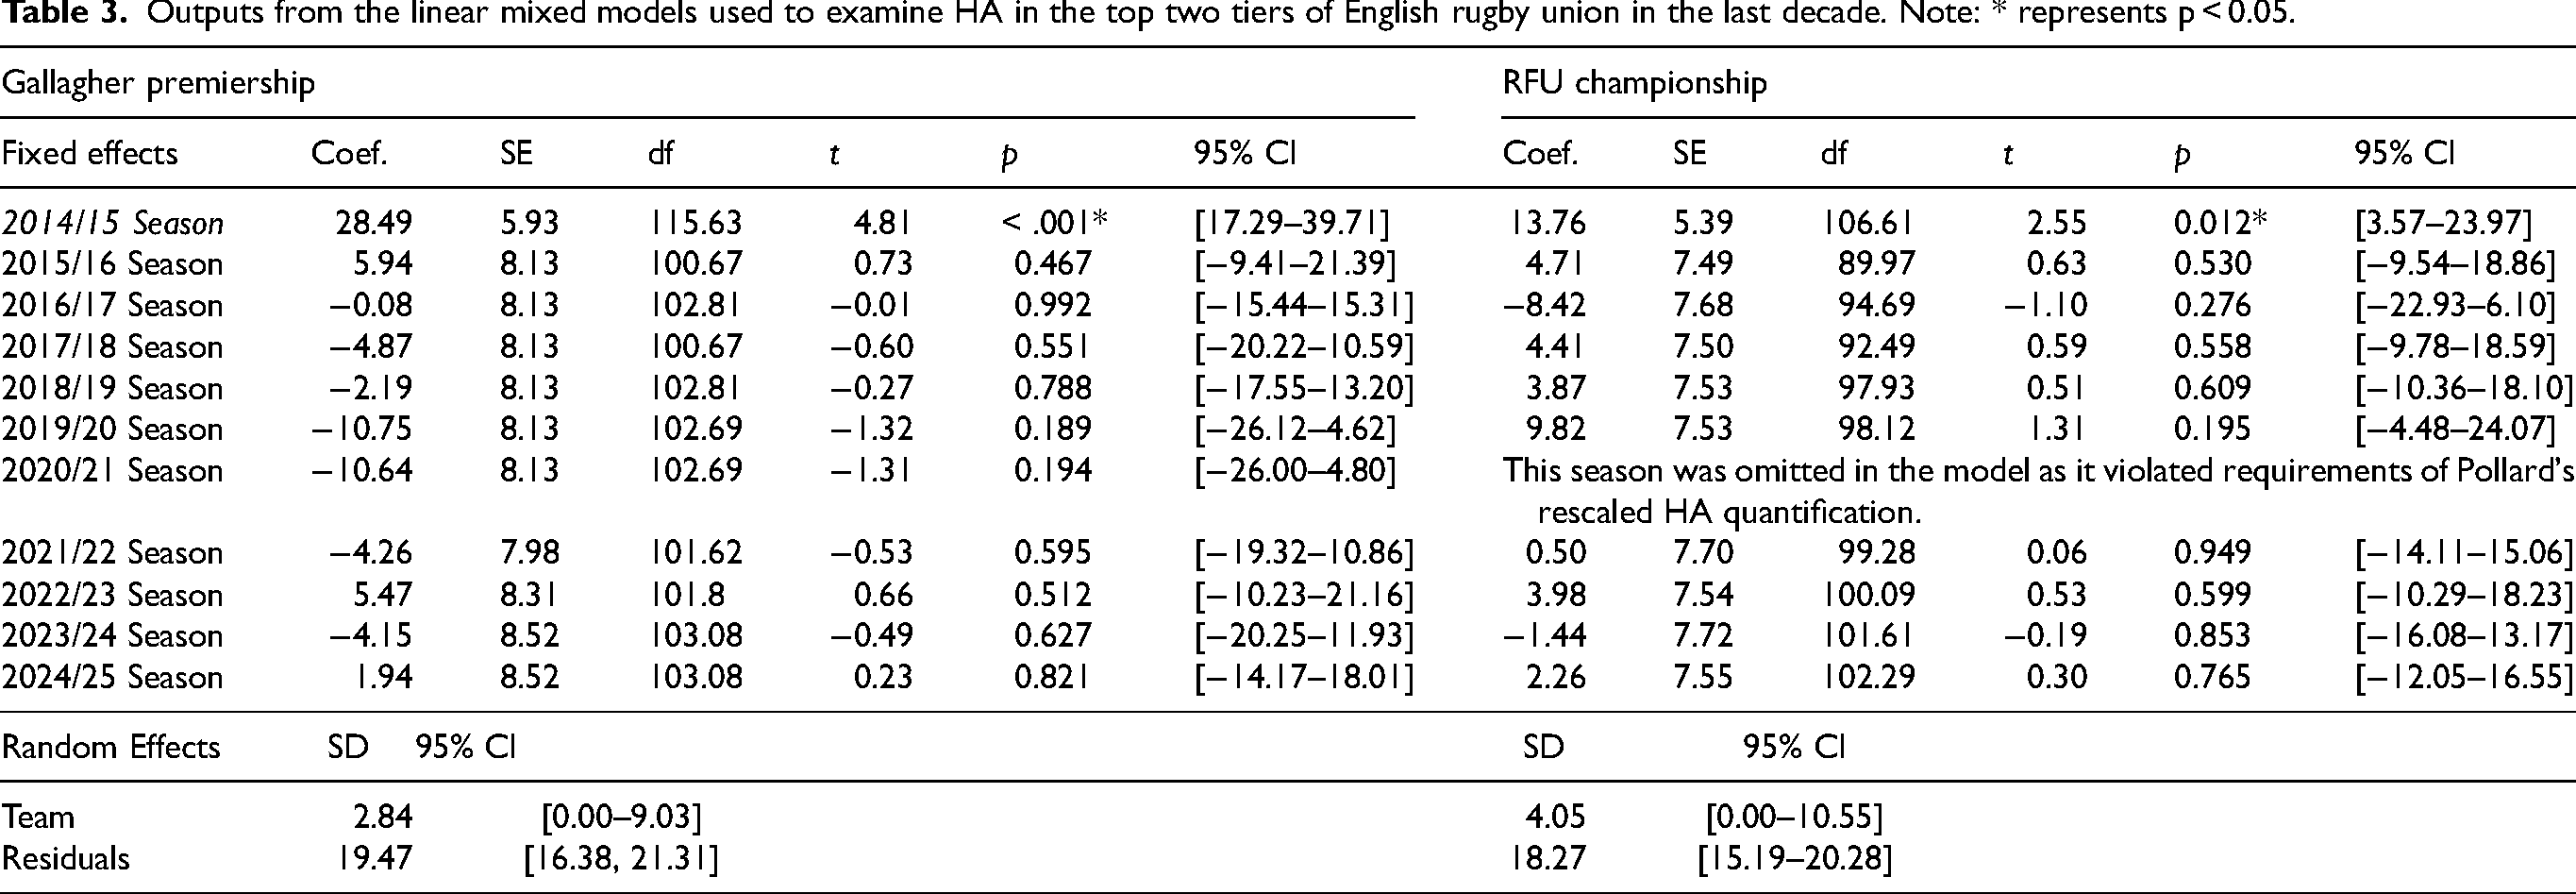
Since the post-hoc ANOVA results highlighted only significant differences in home advantage were prevalent between the top tiers in English rugby union, the sensitivity analysis focused on examining HA in the Gallagher Premiership and RFU Championship in the last decade. The subsequent outcomes from the LMM are presented in Table 3 and Figure 9. In this instance, data from 2020/21 season were excluded in the analysis pertaining to RFU Championship since each team did not play every other team both home and away (due to the impact of COVID-19), leading to violations in the requirements for Pollard's scaled HA quantification discussed previously in the methods (Matos et al., 2019). Overall, whilst the results indicate the presence of HA in the two top tiers (see coefficients of the fixed effect levels in Table 3), no significant differences in HA were found between seasons when compared against the initial 2014/15 season. This is further supported by the likelihood ratio tests, where as a group, the seasons did not significantly differ in their associated home advantage scores (Gallagher Premiership: χ2(10) = 9.99, p = 0.442; RFU Championship: χ2(9) = 7.39, p = 0.597). Nonetheless, as per Table 3, the direction and magnitude of the fixed effects suggest a decrease in home advantage during the 2019/20 and 2020/21 Gallagher Premiership seasons, whilst it appears to have increased in the RFU Championship in 2019/20 season, potentially reflecting the impact of real-world disruptions such as COVID-19. However, as these estimates did not reach statistical significance (p > 0.05) (see Table 3), they should be interpreted with caution. Finally, the large residual variations observed in both tiers (Gallagher Premiership: SD = 19.47; RFU Championship SD = 18.27) suggest that unmeasured factors, may have had a greater influence on home advantage than the between-team differences captured by the fitted models (Gallagher Premiership: SD = 2.84; RFU Championship: SD = 4.05).
Residual analysis of the linear mixed models.
Outputs from the linear mixed models used to examine HA in the top two tiers of English rugby union in the last decade. Note: * represents p < 0.05.
Discussion
Guided by a descriptive study design, this study aimed to explore the influence of home advantage (HA) in the top four tiers of the English rugby union system. Based on HA data examined since 2000/01 season in relation to the considered metrics, the results indicated that each of those tiers in English rugby union experienced significant effects (p < 0.001 for all tiers) of home advantage. Outcomes from a repeated measures ANOVA further signified the prevalence of potential significant differences (p < 0.001) in HA between the top four tiers of the English rugby union system. Specifically, post-hoc tests revealed that the main differences in HA may exist only between the top two tiers of English rugby union (i.e., Gallagher Premiership and RFU Championship) (p = 0.003). Further analysis of longitudinal variation in HA across the considered period, examined using XmR control charts illustrated potential non-random variation in home advantage was prevalent in the RFU Championship from 2005 to 2008. Whereas HA appears to have a stable presence in the other tiers of English rugby union. Particularly, a deeper analysis of the last decade using LMM showed no statistically significant variation in HA across Gallagher Premiership and RFU Championship seasons from 2014/15 to 2024/25.
Home advantage in English rugby union
The presence of home advantage in all four tiers of English rugby union (greater than or equal to approximately 60% in each level), quantified using Pollard's traditional method, illustrated that the findings of this study are consistent with previous research examining the existence of HA in different contexts of rugby union. For instance, Thomas et al. (2008) identified that there was 61% HA in the Six Nations tournament from year 2000–2007. Similarly, Morton (2006) identified the existence of HA in the main rugby union tournaments played in the southern hemisphere between 2000–2004. Moreover, Gómez et al. (2011) also revealed that there was 67% home advantage in rugby union played in Spain between 2005–2010. Interestingly, in this latter study, the researchers found particularly high HA for rugby union (67.0%) in comparison to other sports such as volleyball (55.7%), water polo (56.2%) and roller hockey (58.3%) in Spain. The authors highlight that such observations may be due to the “continuous, aggressive, and intense nature of rugby union” as a sport (Gómez et al., 2011). However, comparing rugby union HA effects in countries like Spain to England should be considered with care. Mainly because higher tiers of rugby union played in Spain within the considered time frame may not contain similar professional contexts to those observed in the English system. Although comparison of HA between different sports is beyond the scope of this study, holistically, it is interesting to note that the existence of HA in English rugby union found in this study aligns with those discussed in other sports elsewhere in the literature (Agnew and Carron, 1994; Nevill and Holder, 1999; Pollard et al., 2017). For instance, Almeida and Volossovitch (2017) found that HA had a significant effect on all levels of Portuguese football, where there was 58.31% HA in the professional level. Therefore, further research like systematic/scoping reviews could look to dissect these inter-sport similarities and differences in the magnitudes of home advantage. Furthermore, the very large effect sizes of the one-sample t-tests used to examine the presence of HA in English rugby union also aligns with those found previously in football research (Almeida and Volossovitch, 2017).
Differences in home advantage between English rugby union tiers
As specified previously, the results further illustrated that significant differences in HA may exist only between the top two tiers in English rugby union. Importantly, due to the lack of similar literature in rugby union, it becomes challenging to critically analyse those findings. However, when compared against football research, early studies found that HA was greater in upper divisions of football leagues (Nevill et al., 1996; Pollard, 1986). For instance, Pollard's (1986) original study found that professional English football leagues had significantly higher levels of HA when compared to semi-professional league. Meanwhile, Nevill et al. (1996) found a significant relationship between league level and HA% in English football. Interestingly, contrasting results to those discussed previously are also prevalent in football literature. For instance, the study by Almeida and Volossovitch (2017) illustrated that professional football in Portugal (i.e., highest tier) had the lowest home advantage effect when compared with the other tiers. Perhaps those findings indicate the potential differences that may prevail in HA across different nations. Importantly, when examining the key factors effecting HA discussed in the introduction, perhaps crowd factors can be used to justify the HA differences observed in the top two tiers of English rugby union. Mainly because average attendances will likely be greater in the Gallagher Premiership in comparison to the RFU Championship, thus justifying the greater HA observed in the former. Yet, the non-significant differences in HA observed between other tiers in the results cannot be explained via crowd factors. For example, it is expected that crowd sizes in Tier 4 would be lower than those found in Tier 2 of English rugby union. Thus, it fails to provide a valid rationale for the reduction in HA unravelled in Tier 2 in comparison to Tier 4 based on crowd factors. Thereby, leading to conflicting judgements on how crowd size may have influenced HA.
Nonetheless, another key consideration for the lower home advantage visible in the RFU Championship in relation to the Gallagher Premiership could be explained due to the structure of the two tournaments. Specifically, although promotion and relegation between the two top tiers of English rugby union were inconsistent (with some seasons seeing no movement), in seasons where relegation did occur, the relegated Gallagher Premiership team often won the subsequent RFU Championship season by performing well both at home and away. Particularly, by consistently demonstrating better away performances than other teams in Tier 2. This likely contributed to lower observed home advantage scores in the RFU Championship. This is perhaps due to the competitive imbalance occurring from performance gaps between relegating Gallagher Premiership teams and those consistently competing in the RFU Championship. Although team-level judgements generated from the sensitivity analysis should be handled with caution owing to the large residual standard deviations reported in the results, random effect estimates may somewhat support the prior claim by illustrating team-level variation in home advantage within the RFU Championship. This is indicated by the random effect estimates (with 95% confidence intervals) from the LMM fitted for the sensitivity analysis covering the 2014/15 to 2024/25 seasons of the two top tiers depicted in Figure 10. For instance, the random effects from the fitted model for the RFU Championship (Figure 10(a)) suggests that Bristol Bears exhibited the lowest deviation from the overall mean HA among the teams (RE = -2.39). Interestingly, considering relegations from the Gallagher Premiership occurred consistently during the pre-COVID period (2014/15 to 2019/20), Bristol finished top of the RFU Championship regular season in three of those six campaigns (2014/15, 2015/16, and 2016/17).
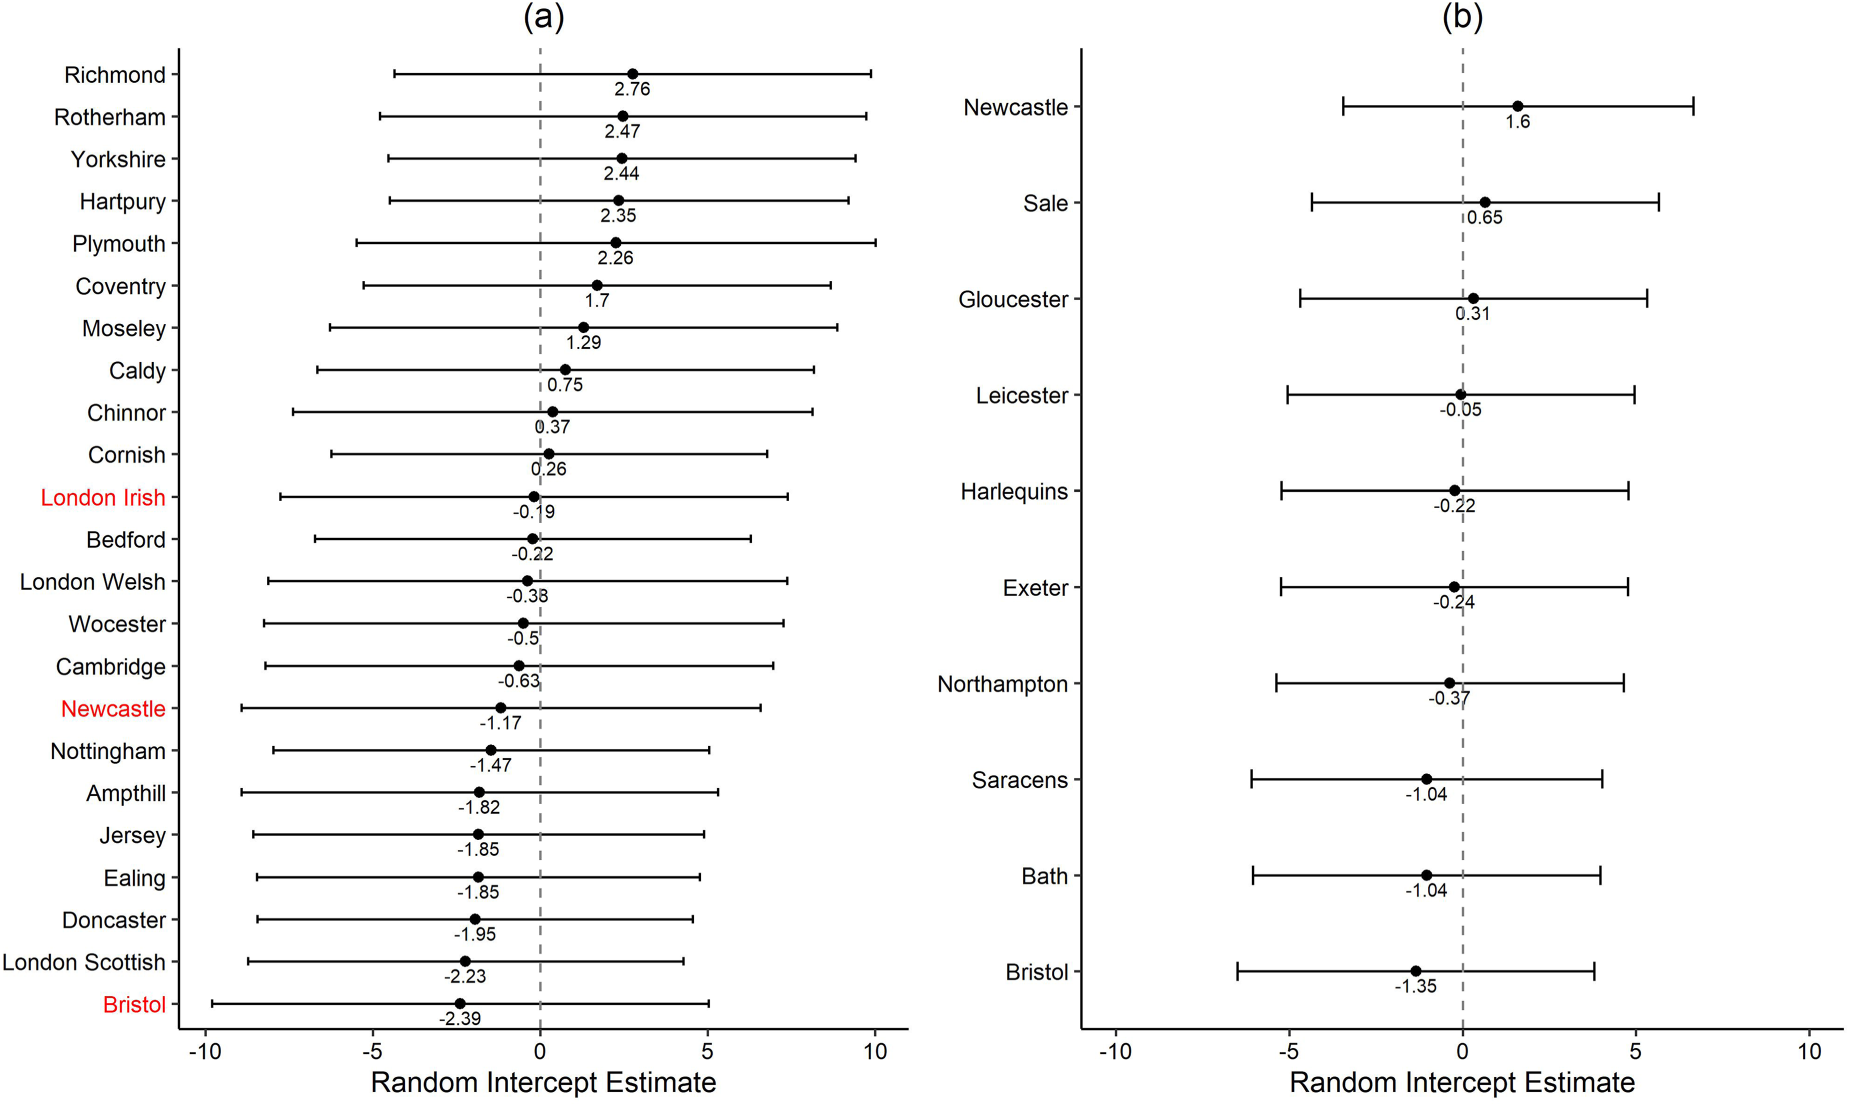
Random effect estimates representing team-specific deviations from the overall intercept in the linear mixed models assessing seasonal variation in home advantage across the top two tiers of English rugby union since the 2014/15 season (a) Teams that had competed in the RFU Championship (those in red finished top of the immediate regular season after being relegated from the top tier (b) Current teams competing the Gallagher Premiership.
Another factor that could potentially explain differences in home advantage is travel distances. Specifically, random effect estimates (with 95% confidence intervals) from the linear mixed model used in the sensitivity analysis of home advantage during recent Gallagher Premiership seasons (2014/15 to 2024/25) indicate that Newcastle Falcons (RE = 1.6) deviate most notably from the overall mean score among other current teams (see Figure 10(b)). Importantly, this does not necessarily indicate a higher home advantage for this team. Instead, rather than indicating strong home dominance, it suggests that, when Newcastle do acquire points, they earn a greater proportion of points at home than away when compared to others. Notably, Newcastle is geographically more isolated from most Gallagher Premiership teams. Thereby, consistently facing more travel demands, which may adversely affect their performance in away fixtures and contribute to a better performance at home than away. Moreover, travel factors may not adequately explain similarities in HA between National League 1 (Tier 3) and National League 2 (Tier 4), despite Tier 3 being a national league and Tier 4 being a regional league with far shorter travel distances. However, such findings are expected based on the literature, which only supports travel factors in scenarios where multiple time zones are crossed (Carron et al., 2005; Pollard et al., 2017; Pollard and Gómez, 2014). Interestingly, such research in other sports has investigated cases where travel or familiarity factors were neutralised using approaches like considering matches played as same-stadium derbies (Ponzo and Scoppa, 2016) or changes in home venue (Loughead et al., 2003; Moore and Brylinsky, 1995). However, as shown in Figure 10(b), sharing of home venue appears to have some potential relevance when examining team-level variations in home advantage (HA) in the Gallagher Premiership. Notably, Bristol Bears exhibit the lowest deviation from the expected HA score among current Gallagher Premiership teams (RE = −1.35). This negative random intercept suggests that Bristol's performance deviates from the typical HA pattern (whether competing in the RFU Championship or the Gallagher Premiership), indicating they tend to perform comparatively better in their away matches than other teams since the 2014/15 season. This is particularly interesting as Bristol Bears is the only current Gallagher Premiership club that shares their home stadium with another sports team. Although from a different sport, Bristol Bears share their home stadium (i.e., Ashton Gate) with Bristol City Football Club, which currently competes in the EFL Championship of the English football system. Importantly, Ponzo and Scoppa (2016) found that home teams in shared-stadium derbies in Italian Serie A football may retain some advantage, their findings pertain to same-sport rivalries with more balanced crowd distributions. This distinction suggests a need for deeper exploration into how multi-sport stadium sharing might affect HA in professional rugby union (or other such team sports).
Importantly, whilst our findings highlight the potential for future research that can examine the influence of explanatory factors like crowd size, travel distance and venue familiarity on home advantage in rugby union, such analyses were beyond the scope of this exploratory study. Specifically, data generating mechanisms and models did not consider such variables in the design, as the study objectives were streamlined to understanding the influence of HA on the holistic level. Despite this, although statistically insignificant, the decline in home advantage in the COVID-19 affected 2020/21 Gallagher Premiership season and HA increase in 2019/20 RFU Championship season offer references for conducting future research on this matter (see Table 3). Perhaps by using those to conduct meaningful comparison in HA between seasons with and without spectators in rugby union.
Accordingly, Sedeaud et al. (2021) examined how COVID-19 restrictions, specifically the absence of spectators, impacted home and away victories in professional football and rugby union matches. While they found that home advantage significantly declined in empty stadiums across key European rugby union leagues, the analysis was limited by imbalanced data structures, particularly due to the scarcity of matches played without supporters. In contrast, a growing body of football literature has leveraged the COVID-19 context, to more robustly isolate the effect of crowd presence on home advantage, using designs that control for key confounders such as travel, team strength and venue familiarity (Bilalić et al., 2023, 2024; Leitner et al., 2023; Lyhagen, 2025; McCarrick et al., 2021; Wang and Qin, 2023). Recent systematic reviews of COVID-19 era football studies conclude that the absence of spectators generally lowered home advantage, due to aspects like reduced referee bias and diminished crowd-induced motivation (Leitner et al., 2023; Wang and Qin, 2023). In parallel, some studies have gone further by treating the pandemic as a natural experiment, allowing researchers to generate causal evidence on crowd effects in football (Bilalić et al., 2021, 2023, 2024). This shift toward causal inference represents a welcome evolution and opportunity for home advantage research, especially for sports like rugby union, where most existing studies are mainly correlational. However, it remains to be seen whether tools like directed acyclic graphs (DAGs) will be adopted to explicitly guide the data-generating processes of future sports analytics research that aim to examine the causality of home advantage (Tennant et al., 2021).
Longitudinal variations in home advantage
When examining longitudinal variability of home advantage, the XmR charts illustrate that it remained relatively stable within the Gallagher Premiership since the 2000/01 season, since none of the four rules were violated (see Figure 4 and Table 2). Similar seasonal fluctuations in HA were observed in National League 1 (Figure 6) and National League 2 (Figure 7). That said, HA values corresponding to 2011/12 season in the moving range chart and 2012/14 and 2019/20 seasons in the X-chart of National League 2 (Figure 7) depict points that are extremely close to the three-sigma limit. Moreover, HA values in the consecutive 2009/10 and 2010/11 seasons are also borderline with the two-sigma limit on the same side of the centre line (see Figure 7). Whilst none of those points explicitly violated the considered rules, this context nevertheless signifies potential HA fluctuation in Tier 4. Importantly, travel and crowd factors would change more in National League 2 than in National League 1, as it is split into multiple divisions (depending on the season). Subsequently, there are constant changes in the league structure and teams that compete in the lowest tier due to constant promotions and relegations occurring in each season. For example, in National League 1, four teams change every season (one is promoted into the RFU Championship and three are relegated into National League 2). Whereas in Tier 4 (i.e., National League 2), due to the combination of two regional divisions in its makeup, nine teams would usually change between seasons in this division. In turn, leading to more variation in crowd sizes, stadia size and travel distance in Tier 4 than the others.
However, the most notable longitudinal variations in home advantage were observed in relatively earlier seasons of the RFU Championship (Figure 5). Firstly, there was a large drop in HA when shifting from 2000/01 to 2001/02 season. Although it is challenging to clearly identify a root cause for this non-random variation, the 2001/02 RFU Championship season featured a concentration of teams based in London and the midlands, which likely reduced average travel distances compared to the previous season that included more northern teams. While this geographic shift could have influenced home advantage (HA), the evidence supporting travel distance as a strong or consistent driver of HA in rugby union is still relatively weak. Interestingly, after the sudden drop in HA observed in 2001/02, it gradually increased until the 2006/07 RFU Championship season, before suddenly dropping again beyond the three-sigma limit in the 2007/08 season. Coincidently, Exeter Chiefs, Nottingham RFC and Cornish Pirates all changed stadia between 2006/07 and 2007/08 RFU Championship seasons. This environmental shift likely disrupted familiar home conditions, potentially contributing to the observed drop in home advantage during that period. Such judgements are supported by early HA research, notably Pollard (2002), who found that home advantage significantly declined during the first season after teams moved to a new stadium, compared to their final season in the previous venue, across multiple North American sports. However, Loughead et al. (2003) suggested that such reductions in HA may only be true when the team quality is factored. Specifically, higher-quality teams may encounter a reduction in HA immediately after moving to a new stadium. Resultantly, such environmental factors that could impact home advantage in rugby union should warrant deeper scientific investigation. Although such fluctuations in HA had existed in earlier seasons, the XmR charts (Figures 4–7) indicate that it appears to have settled in the last decade (i.e., from 2014/15) among all tiers of the English rugby union system.
Study limitations
Statistical judgements
Although results of the one-way repeated measures ANOVA used to examine divisional differences in HA in the current study may support claims to reject the null hypothesis (i.e., no difference in HA between the tiers of English rugby union), final judgements on this matter should be undertaken with care. Firstly, at a fixed sample size of 24 seasons and an alpha level of 0.05, only effect sizes f > 0.69 may achieve the desired 80% pre-set power for this test. However, as the true effect size (f = 0.54) of the test is lower than the relevant minimum threshold set within the prior conditions, the experiment poses enhanced risks of generating a Type II error. Yet, the contradiction to the latter occurs owing to the low risk of making a Type I error for this test. Specifically, because the results of the ANOVA yielding a p-value < 0.001 signifies that there is less than 0.1% chance of making a Type I error. Thus, providing sufficient evidence to support the claim of rejecting the null hypothesis. Considering all prior contexts, from a pure statistical viewpoint, the contrasting result of this test indicates that the sample considered for this study (i.e., HA of the 24 seasons) may lead to a biased estimate of the population and may require replication studies to strengthen judgements regarding the second hypothesis. Similarly, high probability of Type II error could also exist when generating inferential judgements from the LMM due to the low sample sizes available for the sensitivity analysis.
However, from a practical viewpoint, we can hypothesise that there can be limited risks of generating Type II errors in the final judgements of this research study. This is because, as discussed in the methods, it is important to note that the data collection has factored almost all relevant datapoints pertaining to the considered study design (i.e., rugby union seasons from 2000/01 to 2024/25) and only seasons from 1995/96 to 1999/00 are missing to represent the available population of data. Thereby, illustrating that the sample is an adequate representation of the population. Interestingly, such limitations in study designs appear to have influenced existing research on HA in football discussed previously, where in the study by Almeida and Volossovitch (2017), only 11 seasons of data were considered, with HA measures defined as an aggregation per season. Thus, illustrating a high likelihood of Type II errors present in the inferences.
Metrics used to quantify home advantage
Importantly, the prior statistical dilemma is created fundamentally because HA is calculated in Pollard's traditional method as a single metric for the whole season by aggregating the effects of all games during the considered season and on the team level when using the rescaled method. While the consideration of more than 22,264 matches in the analysis is a core strength of this study, from a statistical viewpoint, HA calculated as an aggregation of all games per season or all points per team may have somewhat jeopardised the benefit obtained from the large sample of games. Although those HA metrics have been frequently used in previous literature (Almeida and Leite, 2021; Almeida and Volossovitch, 2017; Matos et al., 2019), another criticism against them is that they rely heavily on outcomes that may not reflect real performance dynamics. In turn, not truly representing home advantage. For example, when considering Pollard's traditional method, it can be perceived as a measure of aggregate performance at home, but not necessarily reflecting any advantage, as it doesn’t account for a team's away performance. Similarly, whilst the Pollard's rescaled method appears to overcome those drawbacks by quantifying team level performances, it only indicates how much a particular team performs better at home compared to away and not necessarily how strong that team is at home compared to others. Thereby, ignoring total strength and interpreting weak, inconsistent teams to possess home advantage in leagues with highly competitive imbalances or where structural features (e.g., promotion/relegation or scheduling irregularities) may distort overall league outcomes (e.g., English rugby union system). To illustrate, as discussed previously in the results, Newcastle Falcons deviated most from the overall HA mean scores among other teams in the Gallagher Premiership (see Figure 10(b)) since the 2014/15 season. Whist this could be easily interpreted as Newcastle Falcons having better home advantage than others, this is not the case. Instead, when competing in the Gallagher Premiership in the last decade, Newcastle Falcons often finished at the bottom of the league table (bottom three, except in 2016/17 and 2017/18 seasons), losing most games. Consequently, HA value from Pollard's rescale method in this instance only illustrates that when this team does acquire points, they tend do so more at home than away. This highlights the importance of deeply examining the contextual relevance of such metrics for quantifying home advantage. Nevertheless, from a study design perspective, future research aiming to examine HA in rugby union should factor such limitations to either define HA in more granular forms to maximise the benefits from the large sample size of matches (e.g., quantifying home advantage at the match level) or devising different statistical approaches to analyse the prevalence of home advantage.
Conclusion
Based on a descriptive design, this study explored the influence of home advantage in English rugby union from 2000/21 to 2024/25 seasons. Overall, findings of the study indicate the prevalence of HA in the top four tiers of English rugby union. Specifically, Gallagher Premiership (Tier 1) demonstrated the highest mean HA across the considered seasons in comparison to all other tiers. Interestingly, the two lowest tiers (3 and 4) had almost identical presence of HA during the considered period. Moreover, the outcomes also suggest that HA differs significantly between the top two tiers of the English rugby union system (i.e., Gallagher Premiership and RFU Championship). While no differences in HA between other tier combinations were observed in the results, this judgement is currently inconclusive due to potential sample size limitations in the corresponding inferential analysis. Moreover, the outcomes also suggest that non-random variation in home advantage may have existed in relatively earlier RFU Championship seasons. Nevertheless, it appears to have stabilised in the last decade among all tiers of English rugby union.
Although potential reasons for the observed variations in HA across the divisions are discussed in this paper, due to its exploratory nature, this study encourages future research to examine and unravel the factors (i.e., root causes) that may have influenced the prevalence of home advantage between the top two tiers in English rugby union. Additionally, for further synthesis on this subject domain, the results also highlight opportunities to analyse the inter-sport variations in the magnitudes of home advantage. Finally, from a methodological perspective, future research that aims to examine HA in rugby union should ideally avoid aggregating effects (e.g., points, wins) in all games to define HA as a single measure for the whole season. Nevertheless, if HA is quantified as a single measure per each season (or even a team), potential limitations due to low sample sizes should be considered to guide the statistical approaches used for the inferential analysis.
Footnotes
Funding
The authors received no financial support for the research, authorship, and/or publication of this article.
Declaration of conflicting interests
The authors declared no potential conflicts of interest with respect to the research, authorship, and/or publication of this article.