
Abstract
This study proposes a novel machine learning–based approach for assessing leadership capability by quantifying the season-level impact of head coaches in the National Basketball Association (NBA). Harnessing 24 seasons of NBA data (1999–2023), we estimate each team's theoretical win probability for every game using only the prior season's player statistics, deliberately excluding coaching effects. The discrepancy between these predictions and actual outcomes is interpreted as the coach's marginal contribution. To validate the robustness of this framework, we applied multiple machine learning algorithms, with LightGBM achieving the highest prediction accuracy at 68.50%. Although the improvement over the baseline accuracy is modest (1.25%), this finding carries nontrivial implications in professional sports, where small performance margins can yield substantial competitive and economic benefits. In contrast to traditional win–loss or tenure-based metrics, our method establishes a performance-adjusted baseline for leadership evaluation applicable to both sports and non-sports contexts. Furthermore, the study advances leadership assessment by providing benchmarks that transcend conventional win-rate metrics, thereby offering scalable, data-driven tools to measure managerial effectiveness in high-performance settings. Overall, this framework contributes to both sports analytics and organizational leadership by furnishing an interpretable model for evaluating leadership capability.
Keywords
Introduction
The role of head coaches in professional sports teams is widely recognized as critical to organizational success (Berri et al., 2009). Yet despite their central importance, reliable methods for evaluating coaching effectiveness remain scarce. Conventional assessments, which predominantly rely on raw win–loss records or postseason appearances, fail to account for underlying roster quality and contextual constraints (Fort et al., 2008).
Recent research has attempted to isolate coaching performance by benchmarking observed outcomes against measures of team potential. For example, Brown et al. (2020) analyzed playoff data to correlate coaching experience with postseason efficiency, while Zhou et al. (2024) examined the performance of player-turned-coaches to illustrate how leadership backgrounds shape outcomes. Although these models provide valuable insights, they are predominantly retrospective and depend heavily on season-ending metrics (Levine, 2009).
In contrast, this study introduces a predictive framework for evaluating coaching effectiveness. We conceptualize head coaches as strategic actors who design tactics, optimize resource allocation, and shape team environments (Bass and Avolio, 1994; Greenleaf, 2013; Schein, 2010). This perspective aligns with strategic leadership theories that regard leaders as architects of internal systems and key drivers of performance (A’yuninnisa and Saptoto, 2015; Banks et al., 2016; Chen et al., 2007).
Effective coaches extend well beyond the role of mere play-callers. They coordinate the efforts of assistant coaches, training staff, and analysts, while also communicating personnel needs to management under conditions of constrained hiring authority. Such functions reflect advanced resource mobilization and system-level oversight. Moreover, social exchange theory posits that leadership behaviors shape perceptions of support and fairness, while leadership cascading effects (Bass et al., 1987) and the emphasis on individual consideration in transformational leadership (Bass and Avolio, 1994) highlight the need to address factors such as player fatigue, mental readiness, and injury prevention.
To operationalize this framework, our study employs a machine learning model that predicts NBA team outcomes using only preseason variables—intentionally excluding coach identity. The discrepancy between actual wins and the model's predicted wins—the “coaching margin”—is interpreted as the coach's marginal contribution. Although single-game outcomes may be influenced by luck or injuries, full-season analysis captures the broader responsibilities of coaching, including workload management, tactical evolution, cohesion building, and responses to adversity. Thus, the coaching margin provides a cumulative measure of leadership impact, and our analysis spans nearly all NBA team–seasons to ensure comprehensive coverage beyond sample-based inference.
Our framework is situated within a broader movement in sports analytics toward predictive modeling (Breiman, 2001). In this investigation, we compare the predictive performance of logistic regression, support vector machines (SVMs), extremely randomized trees, and LightGBM. Notably, ensemble methods such as LightGBM excel at detecting complex variable interactions under dynamic contexts. These techniques have been robustly validated for performance prediction (Hastie et al., 2009), outcome forecasting (Mekhaznia et al., 2023), multi-agent modeling (Wen et al., 2024), and hybrid statistical–knowledge modeling approaches (Berrar et al., 2024). Broader trends in analytics confirm their strategic relevance (Davenport, 2006).
This study offers a replicable, predictive framework for evaluating leadership in team sports that is firmly grounded in both predictive logic and organizational realism. By addressing persistent gaps in coaching evaluation, our method supports scalable, data-informed assessment practices. Based on this framework, we propose the testable hypothesis that teams led by coaches with higher coaching margins—indicative of value added beyond baseline team potential—will display significantly stronger season-level performance outcomes over time.
Theoretical background
Leadership and coaching in team sports
In the realm of professional sports, head coaches are increasingly recognized not merely as tactical strategists but also as organizational leaders—comparable to high-level executives in business or public institutions—who shape systems, align resources, and cultivate team culture (Bass and Avolio, 1994; Greenleaf, 2013; Schein, 2010). A coach's influence extends well beyond in-game tactical decisions, encompassing the coordination of assistant staff, the implementation of injury prevention protocols, and the development of mental conditioning programs (Yukl, 2012; Day et al., 2004). These responsibilities exemplify the principles of transformational leadership, particularly the idea of individual consideration, whereby a leader addresses the unique needs of each team member to optimize overall performance throughout a season (Bass and Avolio, 1994).
Furthermore, the cascading effect of leadership (Bass et al., 1987; Byun et al., 2018; Margolis and Ziegert, 2016; Murphy, 2005) suggests that a coach's leadership philosophy is disseminated through intermediary figures, such as assistant coaches, thereby shaping player behavior, preparation, and response under pressure. This dynamic reinforces the conceptualization of the head coach as a pivotal node within a broader leadership network.
Social exchange theory also enhances our grasp of how coaches influence team dynamics (A’yuninnisa and Saptoto, 2015; Casimir et al., 2014; Epitropaki and Martin, 2013; Wayne et al., 1997). When athletes perceive that they are receiving support, fairness, and empowerment, they are more likely to reciprocate with heightened commitment and improved performance. This reciprocal process is further strengthened in environments where coaching leadership establishes consistent values, clear communication, and robust systemic structures.
In addition, research on strategic leadership has emphasized the critical importance of resource orchestration—the capacity to mobilize and align internal and external resources to secure a competitive advantage (Banks et al., 2016). In the context of professional sports teams, this entails the strategic selection of supporting staff, negotiations with general managers to secure essential personnel, and the agile adaptation of strategies in accordance with the evolving talents of the roster. Even in contexts where coaches do not wield direct hiring authority, their ability to articulate needs and influence support structures emerges as a key leadership competency. This perspective is further substantiated by studies that underscore the coach's role in orchestrating various team subsystems to achieve optimal performance (Gibson and Groom, 2018; Jones and Ronglan, 2017).
Moreover, system-level perspectives derived from complexity leadership theory (Uhl-Bien et al., 2007) and competence-based management (Sanchez, 2004) reinforce the notion that the impact of coaching is an emergent phenomenon, arising from adaptive coordination across organizational subsystems. From this viewpoint, a coach's role is not to exercise unilateral control but to foster structural responsiveness and dynamic adjustments within the organization. Similarly, human resource attribution theory posits that the manner in which coaches communicate organizational intentions can significantly influence player attitudes and behaviors (Katou et al., 2020). Collectively, these perspectives—as reinforced by resource orchestration theory (Sirmon et al., 2007)—underscore that a coach's true effectiveness lies in their ability to align both human and structural assets with the continuously evolving needs of the team.
Taken together, these theoretical foundations suggest that a coach's influence cannot be adequately captured by surface-level metrics alone. In essence, coaching capabilities extend far beyond isolated tactical decisions during games. Over the long term, they shape organizational systems, mold cultural norms, and guide the behavior and vision of team members—thereby creating the conditions for sustainable efficiency and high performance. This enduring impact is embedded in the manner in which coaches manage organizational systems, motivate individuals, and shape the cultural and operational contexts in which performance ultimately emerges.
Data-Driven approaches to coaching evaluation
Despite growing scholarly interest in coaching performance, empirical approaches have struggled to isolate the coach's contribution from broader contextual factors. Conventional evaluation metrics—such as win–loss records or postseason appearances—are often confounded by variables like roster quality, injury volatility, and scheduling irregularities (Gómez et al., 2013). Consequently, more nuanced approaches have been proposed, including technical efficiency models (Berri et al., 2009), playoff-specific success indices (Brown et al., 2020), and positional adjustment frameworks (Zhou et al., 2024).
However, many of these studies rely heavily on season-end outcomes and utilize methodologies that are retrospective rather than predictive. Moreover, some adopt demographic or survey-based indicators—such as coaching tenure or perceived leadership style—to infer capability (Fort et al., 2008). These approaches may lack objectivity and fail to capture the dynamic, system-level competencies that are central to modern coaching effectiveness.
However, many of these studies rely heavily on season-end or postseason outcomes and employ methods that explain rather than predict performance. Moreover, some adopt demographic or survey-based indicators—such as coaching tenure or perceived leadership style—to infer capability (Fort et al., 2008). These approaches may lack objectivity and fail to capture the dynamic, system-level competencies central to modern coaching effectiveness.
In contrast, our study introduces an alternative predictive framework based on machine learning, which circumvents these limitations. In our approach, the influence of the coach is removed by estimating team performance solely based on preseason player and team attributes—observable prior to the season's commencement. This procedure reflects the underlying potential of the team independently of its leadership. Given this structure, machine learning models are particularly well suited because they do not require assumptions of linearity or fixed parametric forms. In comparison with traditional statistical models such as linear regression, machine learning enables more flexible modeling of complex relationships among variables, rendering it a more appropriate tool to evaluate the nuanced, system-level contributions of head coaches.
By training models on preseason variables that deliberately exclude coach identity and comparing these predictions with actual performance, we quantify the unique impact attributable to the head coach—termed the ‘coaching margin. This metric encapsulates not only isolated tactical decisions but also the comprehensive value that a coach contributes over an entire season. Because machine learning algorithms are optimized for predictive accuracy, the deviation between predicted outcomes (excluding coach information) and actual outcomes is posited as a more credible estimate of coaching influence, particularly when contrasted with traditional explanatory models that rely on fixed parametric assumptions and limited covariate scopes.
Moreover, machine learning offers significant advantages over traditional regression methods, particularly in handling high-dimensional and non-linear relationships among team features and outcomes. In this study, we employed models such as logistic regression, support vector machines, extremely randomized trees, and LightGBM to assess predictive accuracy. By framing evaluation in terms of predictive success rather than retrospective fit, our approach supports more objective and scalable assessments of coaching effectiveness.
Thus, our framework not only contributes to the empirical evaluation of coaching performance but also aligns with a broader methodological shift in organizational research toward predictive validity as a tool for assessing complex leadership phenomena. Furthermore, our approach addresses key limitations in prior studies that rely on fixed seasonal endpoints or subjective leadership surveys. By leveraging complete panel data over multiple seasons and evaluating discrepancies between predicted and actual point differentials, our model captures systematic coaching contributions rather than circumstantial successes. As previous research has suggested (Peteraf and Barney, 2003), leadership effectiveness is better assessed through the sustained alignment of organizational resources with performance outcomes. Building on this premise, we empirically test whether the coaching margin—a leadership-derived construct—is associated with team performance differentials over multiple seasons.
Teams coached by head coaches with higher positive coaching margins—calculated as the difference between actual and model-predicted team performance excluding coach identity—will demonstrate significantly better season outcomes (e.g., win differentials) across multiple seasons.
Methodology
Data and sample
This study employs panel data from all NBA regular seasons between 2000–2001 and 2022–2023, comprising a total of 772 team-seasons. The dataset encompasses performance and roster information for all 30 NBA teams, obtained from publicly available sources such as Basketball Reference and NBA.com. The unit of analysis is a team-season, with each observation representing a unique team in a specific year.
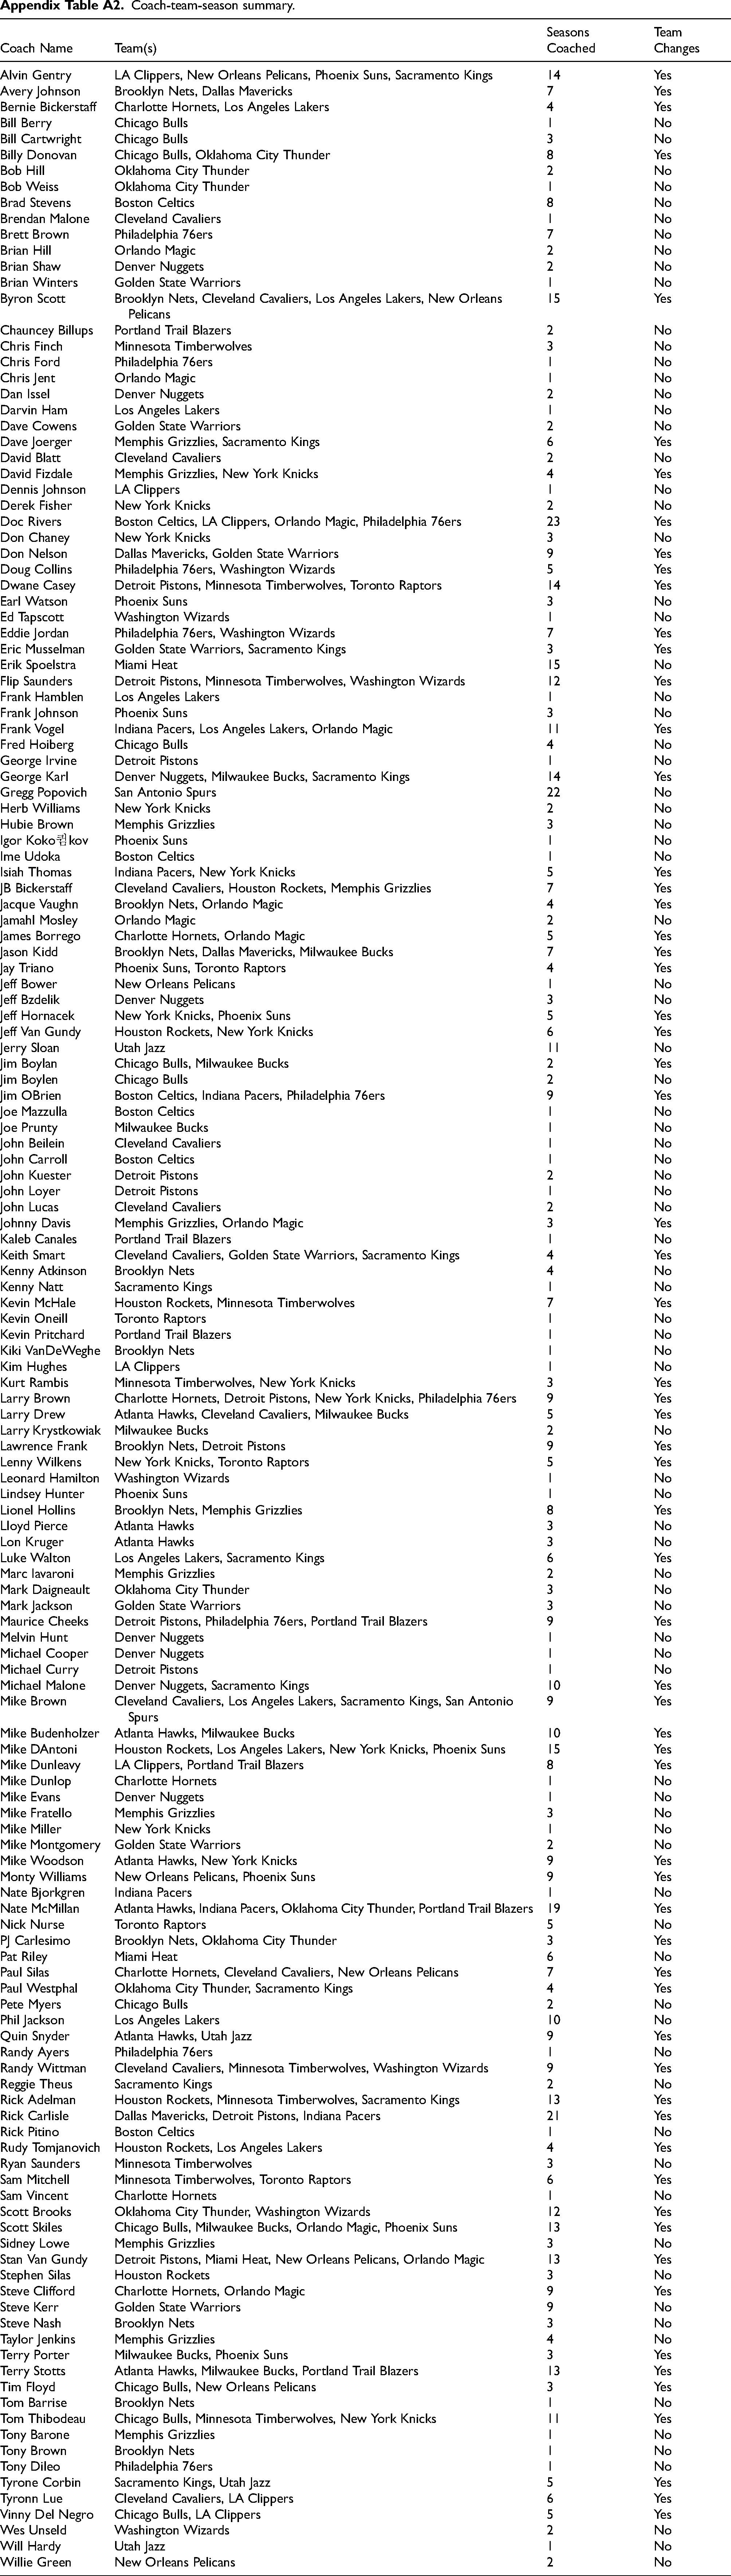
To evaluate coaching effectiveness, we restricted the coaching sample to head coaches with at least one full season of data during the analysis period. In instances where a coach was dismissed mid-season or hired after the season began, only the games managed by the target coach were included, provided that the coach oversaw the majority of that season's games. This selection criterion resulted in a sample of 155 unique head coaches. Appendix Table A2 provides descriptive statistics for the coaching sample, including the average number of seasons coached, team changes, and tenure distribution. On average, coaches served 4.98 seasons (SD = 4.17); among them, 101 remained with a single team throughout the period, while 54 coached multiple teams, with tenure ranging from one season to 27 seasons, indicating a wide variation in coaching careers.
Variable construction
The dependent variable for our machine learning models is the team's win differential, defined as the difference between total wins and total losses over a season. Independent variables were constructed using all preseason-available team and player statistics, which were engineered to reflect team-level characteristics prior to each season. The variables are categorized as follows:
Metadata and Identifiers: Variables include Season, Date, Team, MANAGER, Opponent (OP), OP_MANAGER, H1A0 (home/away indicator), and Player. Box Score Totals (Team Performance): Variables include FGM, FGA, 3PM, 3PA, FTM, FTA, OREB, DREB, REB, AST, STL, BLK, TO, PF, and PTS. Efficiency and Advanced Metrics: Variables include Margin, FG%, 3P%, FT%, TS%, 3PAr, FTr, eFG%, OREB%, DREB%, REB%, AST%, STL%, BLK%, TOV%, USG%, OFFRTG, DEFRTG, and BPM. Opponent Statistics (Relative Strength Adjustment): This category comprises variables such as OP_Player, OP_FGM, OP_FGA, OP_3PM, OP_3PA, OP_FTM, OP_FTA, OP_OREB, OP_DREB, OP_REB, OP_AST, OP_STL, OP_BLK, OP_TO, OP_PF, and OP_PTS, together with derived metrics such as OP_Margin, OP_FG%, OP_3P%, OP_FT%, OP_TS%, OP_3PAr, OP_FTr, OP_eFG%, OP_OREB%, OP_DREB%, OP_REB%, OP_AST%, OP_STL%, OP_BLK%, OP_TOV%, OP_USG%, OP_OFFRTG, OP_DEFRTG, and OP_BPM. Game Outcome Metrics: Variables include PTS_Team, Lose_Team, and Score.
All variables were carefully selected and engineered to capture team-level attributes before each season's onset. Descriptive statistics for these variables are provided in Appendix Table A1, ensuring data quality and distributional context. Importantly, the head coach's identity and historical performance were deliberately excluded from model training to ensure that predictions reflect baseline team potential absent coaching influence.
Individual player game logs were standardized to per-minute seasonal statistics to account for variations in playing time. These standardized metrics were then aggregated to construct comprehensive team-level input features. Each game was represented as a discrete data point, created by merging the prior season's per-minute statistical profiles of both competing teams along with relevant game context features and the actual game outcome. Additionally, rookie players were assigned group average statistics based on draft position tiers (1–7, 8–14, 15–30); Figure 1 illustrates the standardized performance profile by rookie draft tier, demonstrating relative consistency in scoring, minutes, and starting frequency.
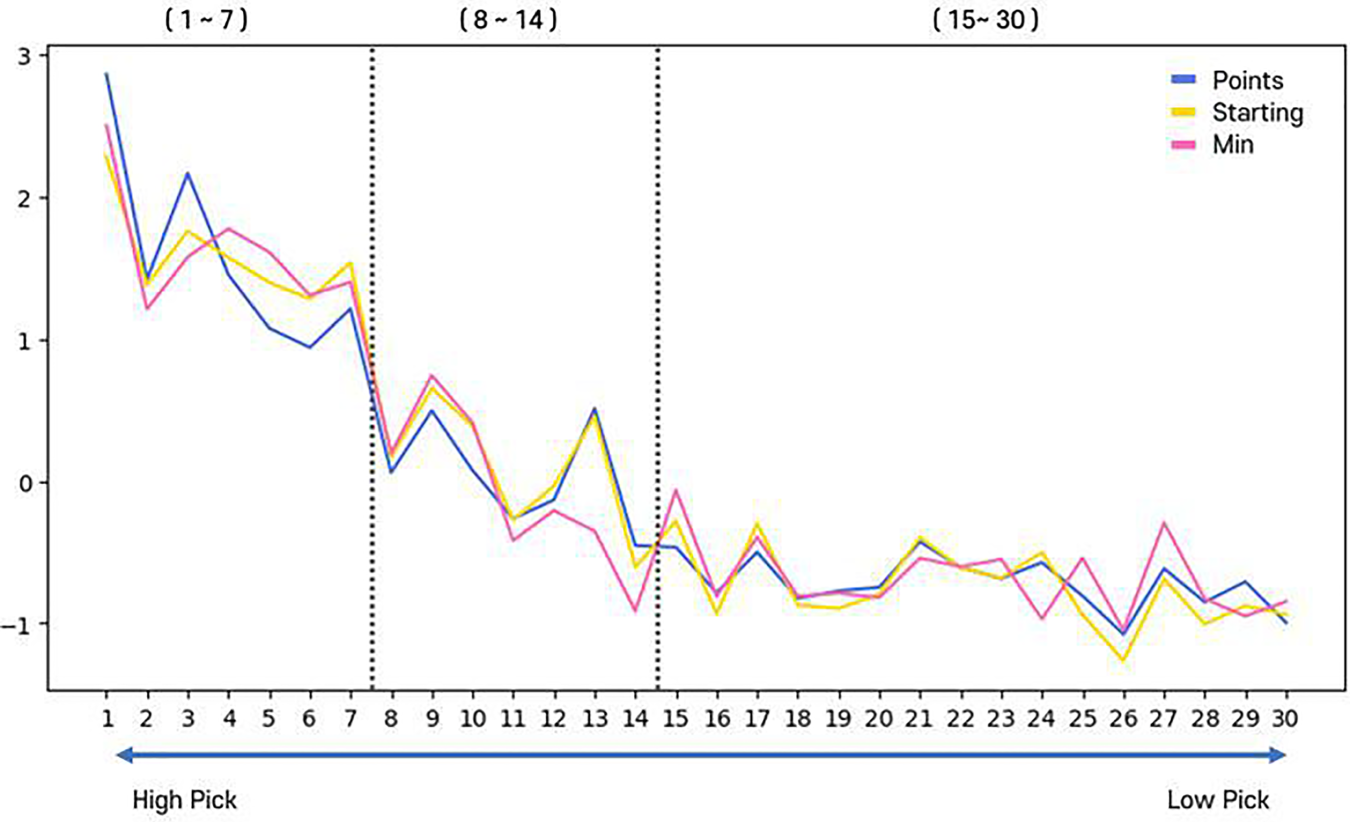
The standardized performance profile by rookie draft.
For players returning after absence, their most recent full-season data were used. An exception to our standard imputation procedure was made in the case of Michael Jordan's 2000–2001 season. Given his unique circumstance of having been retired for the two preceding years, we utilized his 1994–95 statistical profile to ensure model consistency and avoid skewing the results due to a lack of recent data. This decision reflects a pragmatic approach to handling exceptional cases while upholding the integrity of our analytical framework.
Machine learning algorithms selection
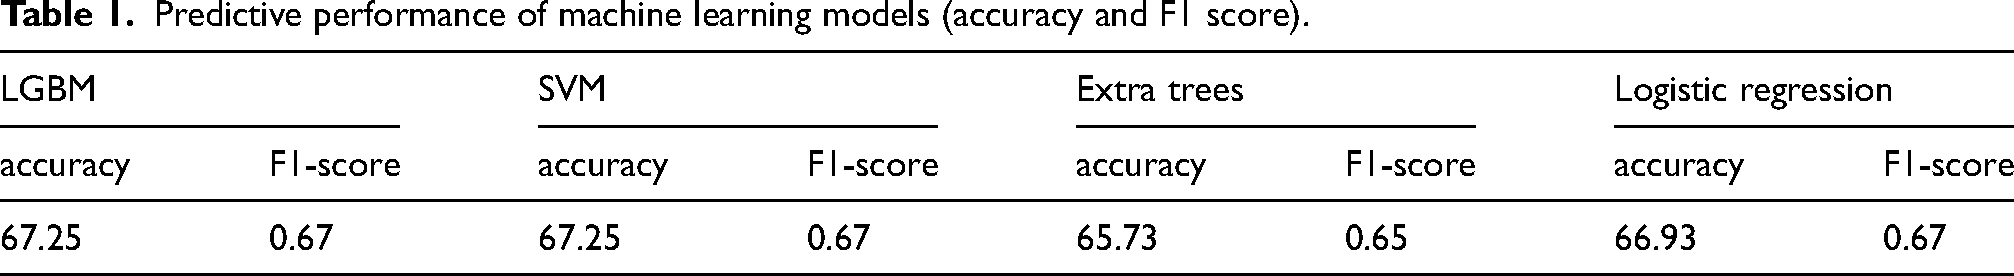
We applied four machine learning algorithms to predict the win differential: LightGBM, Support Vector Machines (SVM), Extra Trees (ET), and Logistic Regression (LR). These algorithms were chosen for their diverse interpretability and structure, ranging from linear (LR) to non-linear ensemble methods (LightGBM and ET). All models were implemented using default parameters—without additional hyperparameter tuning—to align with practical, reproducible modeling conditions. Predictive performance was evaluated using accuracy and F1-score, as is standard in classification-based predictive modeling. Among these models, LightGBM exhibited the highest performance and was thus selected for estimating coaching margins.
To avoid look-ahead bias, we employed seasonal forward-chaining cross-validation, whereby for each test season, the models were trained exclusively on data from all prior seasons. This approach simulates real-world forecasting conditions in which future information is unavailable. Predictions for each regular-season game were then aggregated to estimate the total win count for each team.
Light-GBM: An efficient gradient boosting framework employing a leaf-wise tree growth strategy, LightGBM optimizes both speed and predictive accuracy (Li, 2018). Although it is susceptible to overfitting in high-dimensional settings, we mitigated this risk through rigorous parameter tuning and cross-validation. Our objective was to construct a robust, generalizable model capable of inferring overall leadership capability from deviations in team performance, rather than isolating individual feature contributions. Light-GBM's strength lies in its ability to capture complex, non-linear relationships within the data, making it well-suited for this purpose. Support Vector Machine (SVM): SVM is an effective classification algorithm that construct optimal hyperplanes to separate data points into distinct classes. They are inherently robust to overfitting in high-dimensional spaces, which makes them a valuable complement to ensemble methods. However, SVMs can be computationally intensive, necessitating careful consideration of kernel selection and optimization techniques). Extra Trees (ET): This ensemble method builds multiple decision trees from bootstrapped subsets of the training data, introducing additional randomization in cut-point and feature selection compared to traditional Random Forests. This extra layer of randomization helps reduce variance and overfitting, thereby enhancing model robustness (Padmaja et al., 2020). Logistic Regression (LR): Logistic Regression serves as a benchmark model for comparison. Despite its simplicity, Logistic Regression provides a readily interpretable framework for binary classification tasks. Its linear nature allows for easy identification of the features that most strongly influence the predicted outcome, providing valuable insights into the underlying relationships between player statistics and team performance (Baker and Kwartler, 2015).
Analytical process and validation
To ensure the temporal validity of our findings and avoid look-ahead bias, we employed a seasonal forward-chaining methodology. For each test season, the models were trained exclusively on data from prior seasons, effectively simulating real-world forecasting conditions. After merging the datasets for teams A and B, along with the game data and results, we performed this training-testing procedure iteratively across seasons. The dataset was structured as a collection of game-level observations. Each season was held out sequentially as a test set, while models were trained on all prior seasons—a forward-chaining cross-validation procedure to simulate real-world prediction without future data leakage. This rigorous procedure ensures that our model's predictive capabilities are evaluated using only historical data, mirroring the constraints faced in real-time decision-making.
The target variable in our analysis was binary, indicating a win (1) or loss (0) for each game. Input features included team-level player statistics from the prior season, capturing the collective talent and performance potential of each team, as well as game-level context variables, such as home/away status and rest days. The predicted win probabilities generated by our models were then summed across each team's regular-season games to estimate the expected win total for that season.
The coaching margin was computed as follows:
To further validate the robustness of the coaching margin, we incorporated it as a feature in a secondary predictive model aimed at forecasting future season outcomes. Significant improvements in predictive performance with the inclusion of the coaching margin would provide compelling evidence that the margin effectively captures a stable and persistent leadership capability. Notably, our model intentionally omits in-season contextual factors such as travel distance, venue type, or mid-season injuries. We posit that a head coach's ability to anticipate and manage these complexities is itself a fundamental aspect of leadership. Excluding these variables allows our model to capture the coach's implicit systems-thinking and adaptive capacity—qualities that differentiate truly effective coaching from mere tactical adjustments. Including such variables might inadvertently dilute the leadership traits we seek to measure.
Statistical testing
To assess model stability and the construct validity of the coaching margin, we compared coaches with above-average and below-average margins using group mean tests and regression models that incorporate team and year fixed effects. Robustness checks conducted for periods before and after 2015 further corroborated model stability. Additional contextual and distributional information is provided in Appendix Tables A1 and A2. Table 3 presents descriptive statistics comparing coaches by margin group, thereby supporting the coaching margin's validity as an indicator of leadership effectiveness
Results
Model performance
Among the four machine learning algorithms evaluated—Logistic Regression, Support Vector Machine (SVM), Extra Trees, and LightGBM—LightGBM yielded the highest predictive performance. Its accuracy and F1-score consistently outperformed the other models across all seasons, thereby validating its suitability for estimating coaching margins. Accordingly, the final coaching margin in this study is derived from the LightGBM model's predictions. Table 1 summarizes the predictive performance results for each model.
Predictive performance of machine learning models (accuracy and F1 score).
Distribution of coaching margins
The distribution of coaching margins across the 772 team–seasons ranged from −18 to +17 wins, with a mean near zero, thereby indicating model calibration. As depicted in Figure 2, the distribution approximates a normal curve centered around the expected performance line. Teams exhibiting strong positive margins tended to exceed their expected performance, whereas teams with negative margins underperformed relative to their roster potential. This pattern supports the validity of the model in capturing systematic deviations attributable to coaching effectiveness
Distribution of coaching margins across team-seasons.
Illustrative cases of outlier coaches
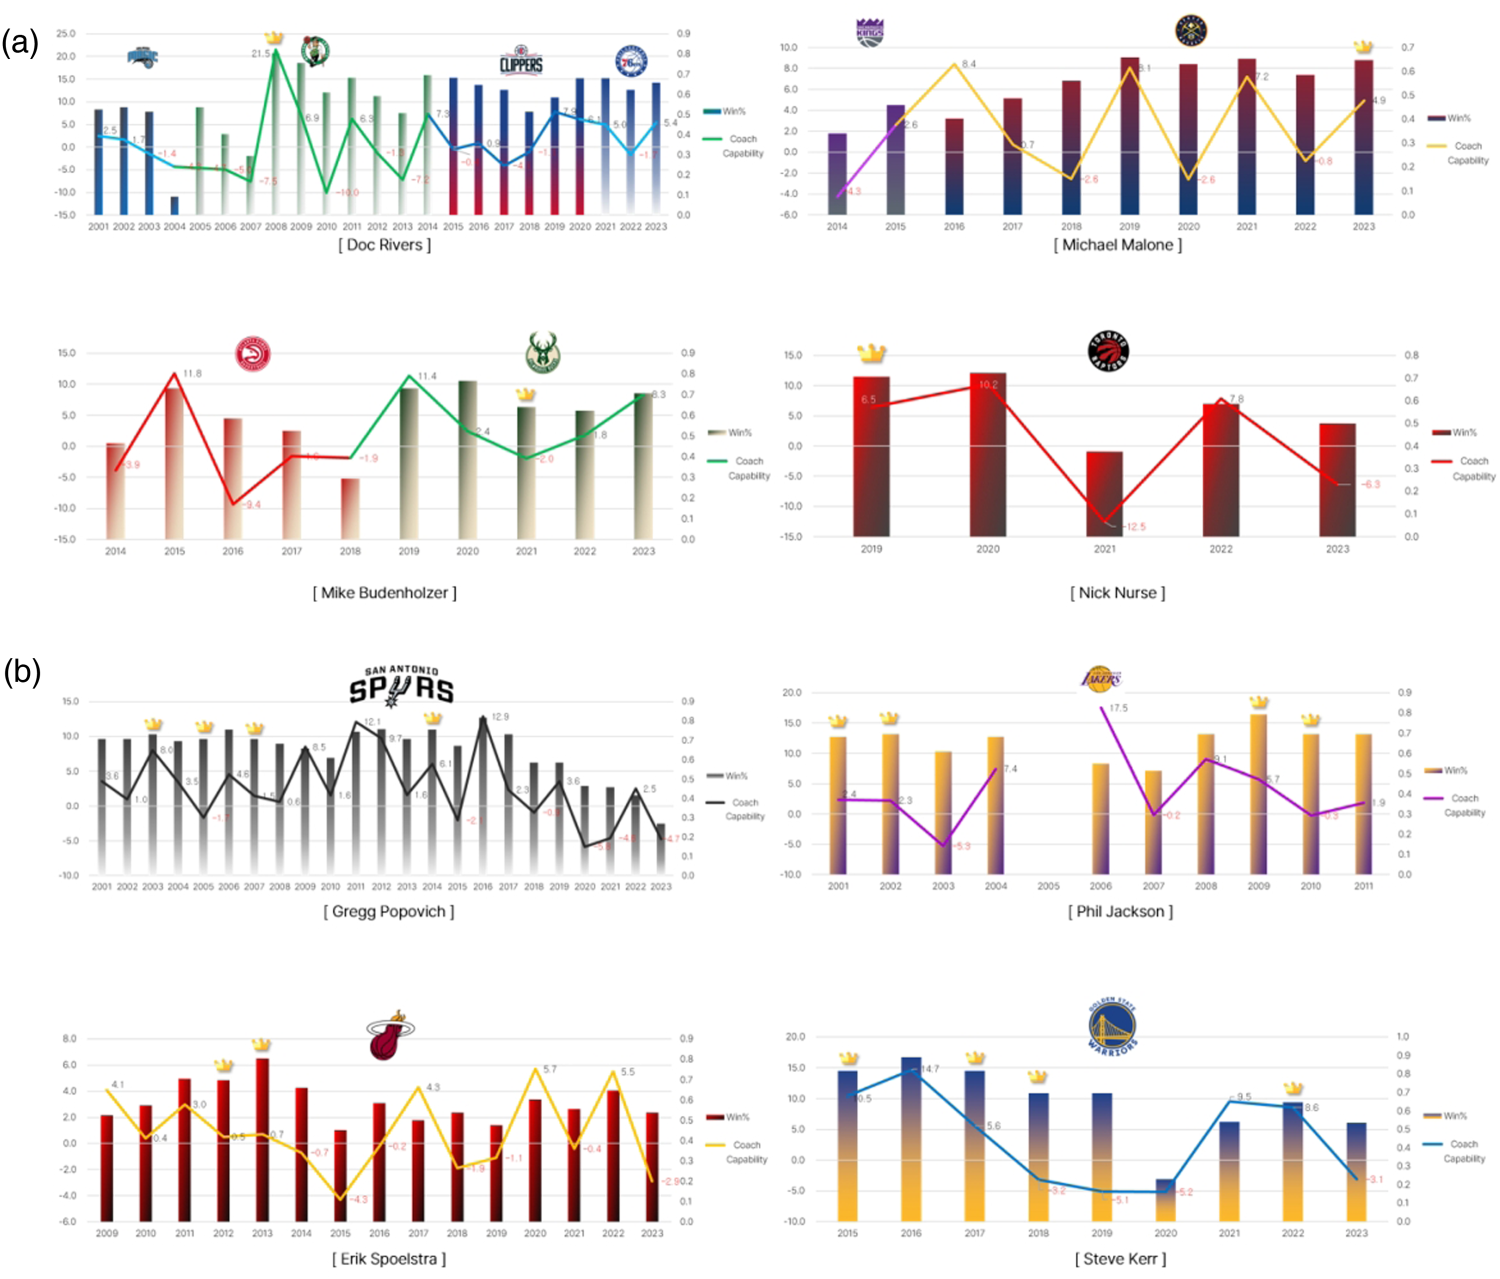
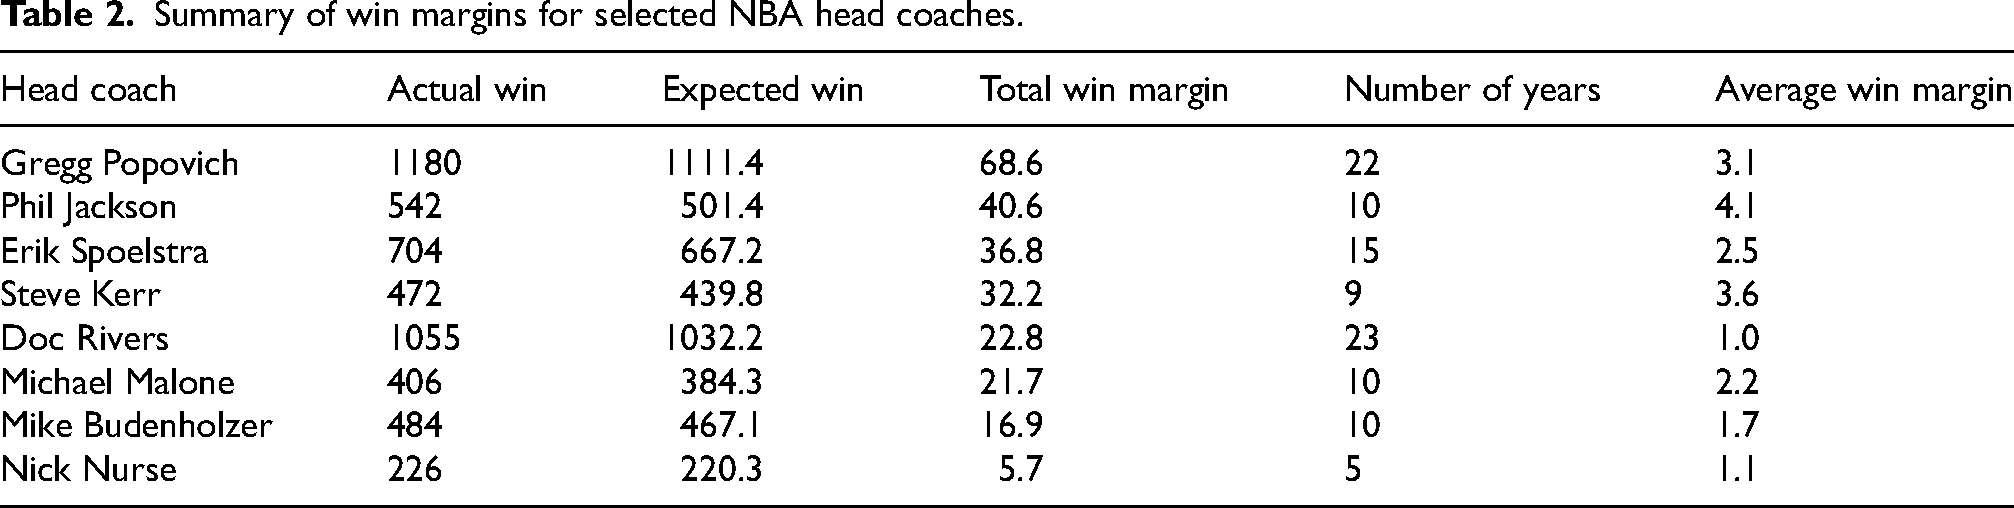
To further assess the validity of the coaching margin as an indicator of leadership impact, we identified outlier coaches—those with extreme positive or negative margins. Table 2 presents six case studies (three with the highest positive margins and three with the lowest), with each case contextualized by roster composition, preseason expectations, and actual outcomes. These examples demonstrate that the coaching margin metric captures not only the outcomes but also the context in which those outcomes are achieved, thereby offering a nuanced perspective on leadership influence
Summary of win margins for selected NBA head coaches.
Group comparison: high vs. low margin coaches
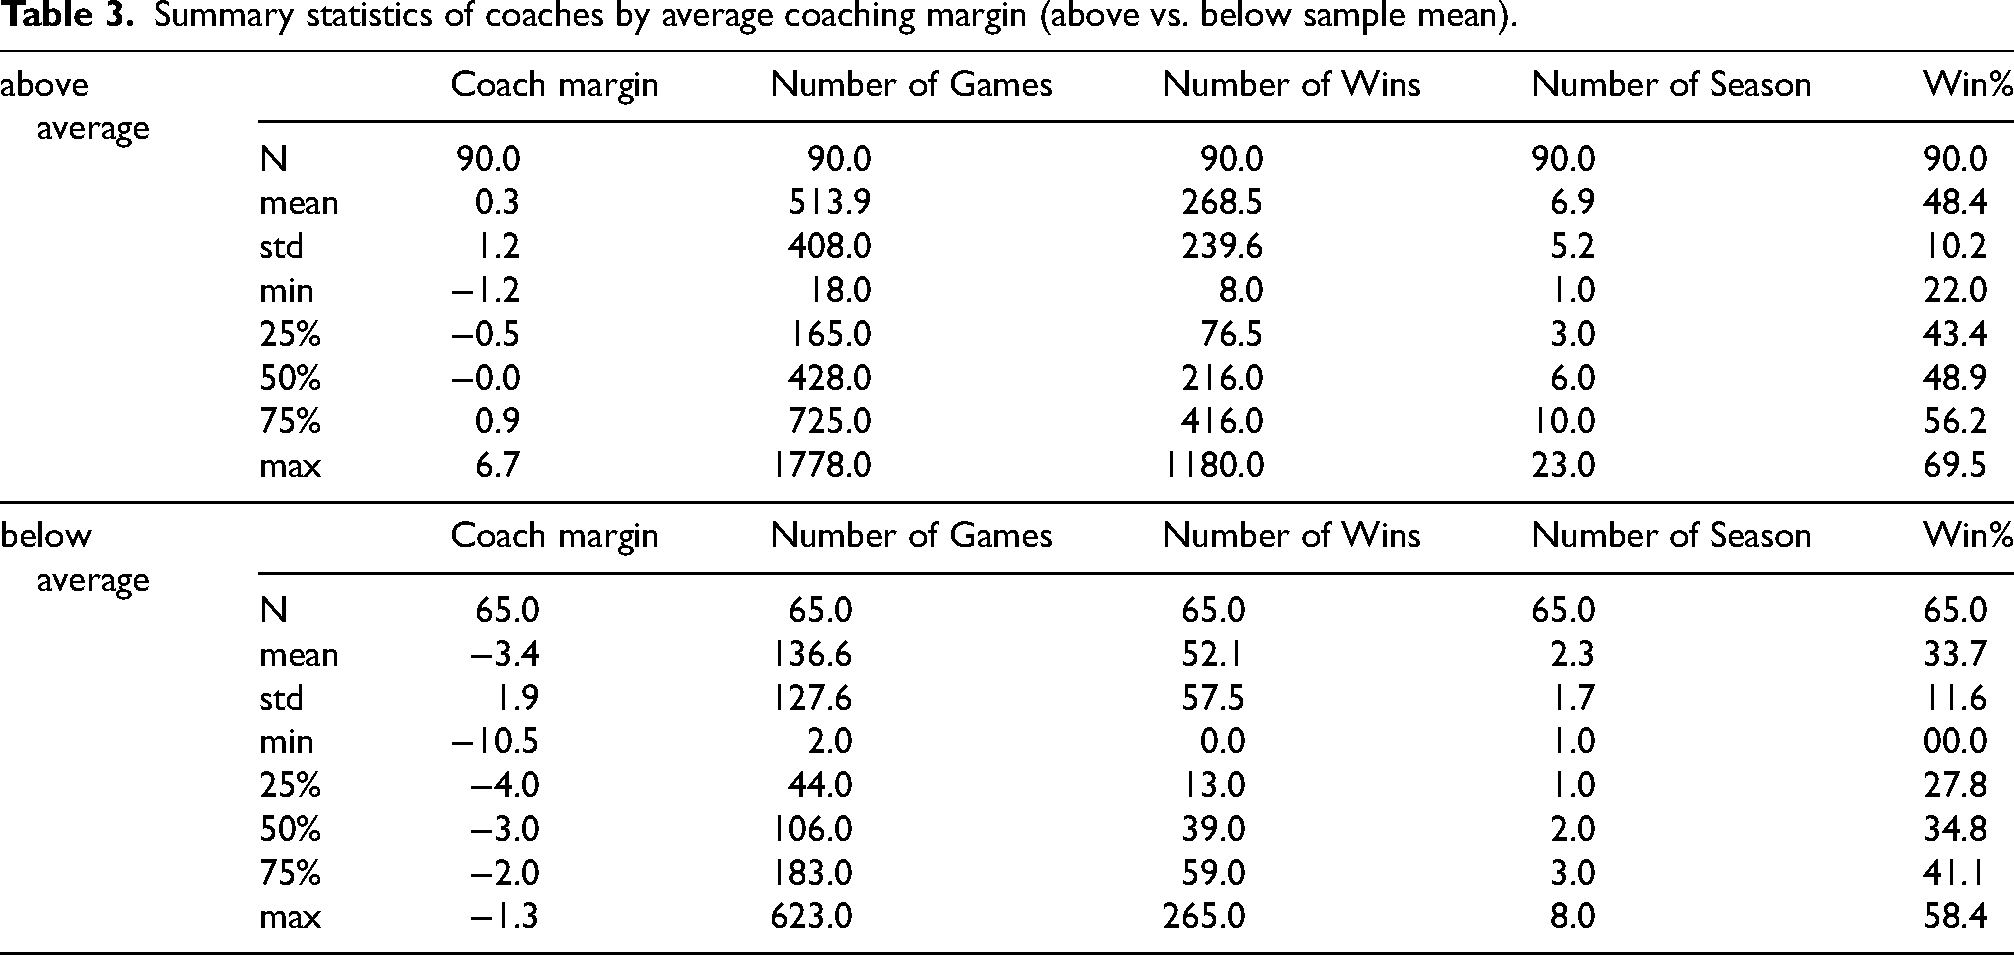
To test our primary hypothesis, we bifurcated the coaching sample into two groups based on whether the average career coaching margin was above or below the overall sample mean. Table 3 displays the descriptive statistics for each group. Notably, coaches with above-average margins (n = 90) won a combined 22 NBA championships, whereas those with below-average margins (n = 65) secured only one title. This pronounced disparity supports the construct validity of the coaching margin as a reflection of leadership effectiveness and long-term contribution to team success. These findings substantiate our hypothesis that teams led by head coaches with higher positive coaching margins—defined as the gap between actual and predicted performance (excluding coach identity)—achieve significantly superior outcomes across seasons
Summary statistics of coaches by average coaching margin (above vs. below sample mean).
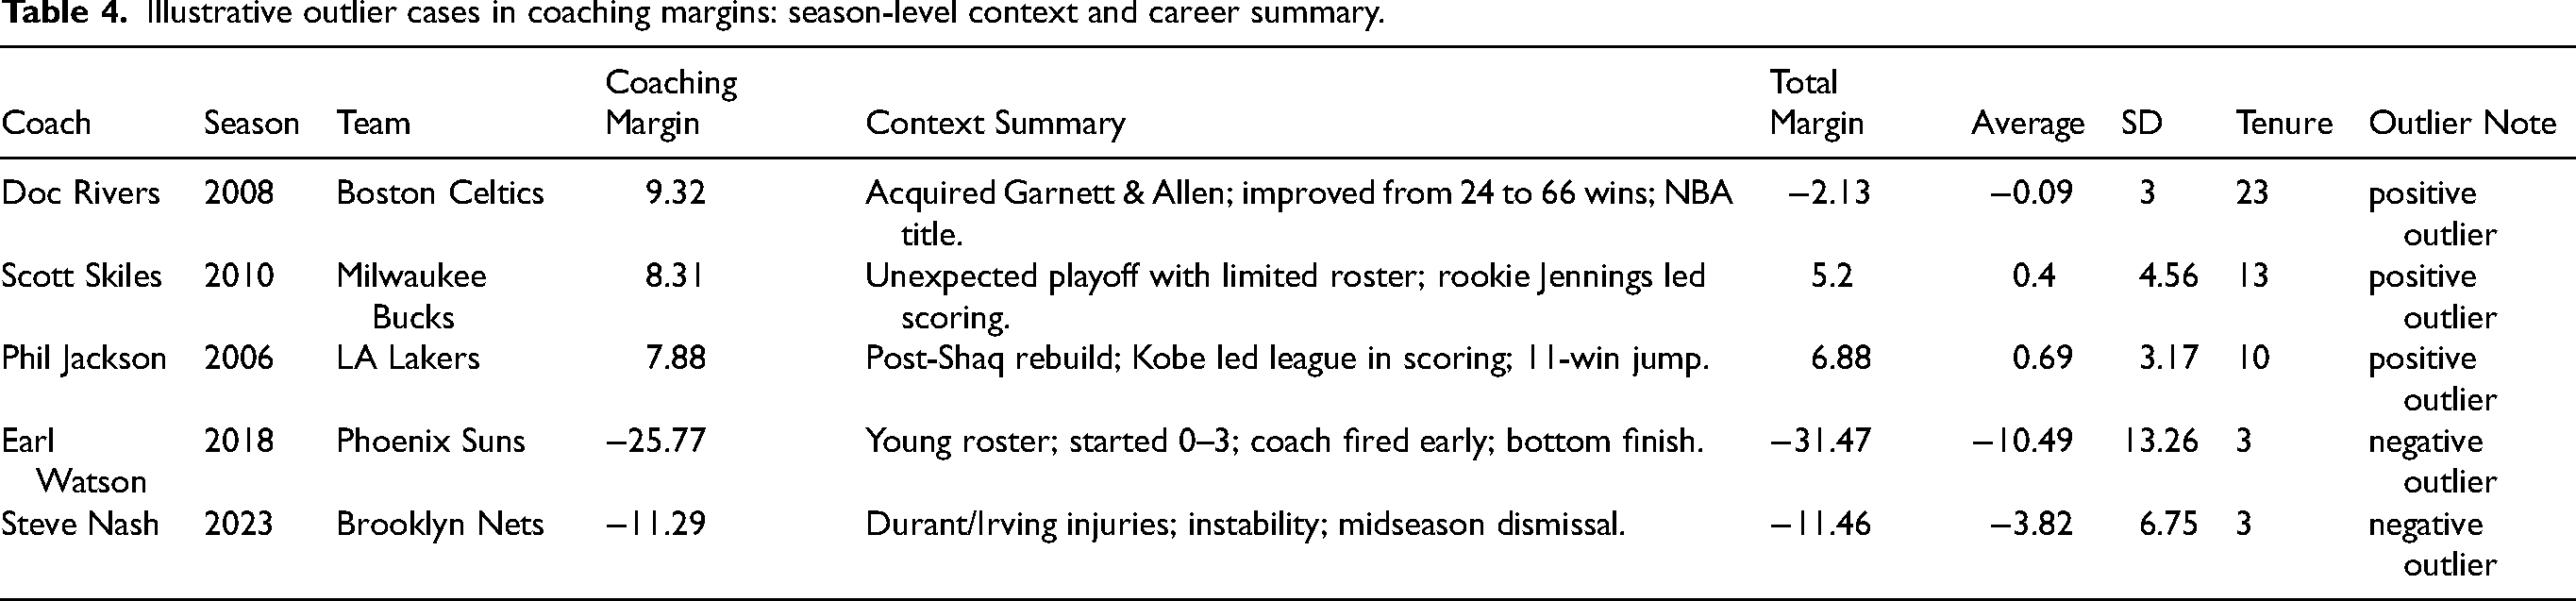
In addition to group-level comparisons, we examined individual outlier seasons that deviated markedly from the overall distribution. For instance, Steve Nash's 2022–23 season with the Brooklyn Nets produced a strongly negative coaching margin despite a highly talented roster, suggesting leadership misalignment, whereas certain low-profile coaches attained high margins under constrained circumstances. Table 4 details these representative outliers, including season-level performance and career summaries, thereby enriching the interpretation of coaching performance beyond aggregate trends.
Illustrative outlier cases in coaching margins: season-level context and career summary.
Robustness checks
We conducted two sets of validation analyses to assess the robustness of the coaching margin. First, we examined the average and standard deviation of coaching margins across seasons for each coach, which confirmed persistent directional effects for most head coaches. Second, we evaluated the impact of incorporating the coaching margin as a feature in a secondary model designed to predict future team success. Models were run with and without the coaching margin, and the results—presented in Table 5—demonstrated that including coach capability significantly enhanced model accuracy and F1-scores, particularly in ensemble-based models such as LightGBM.
Model performance with vs. without head coach capability as a feature.
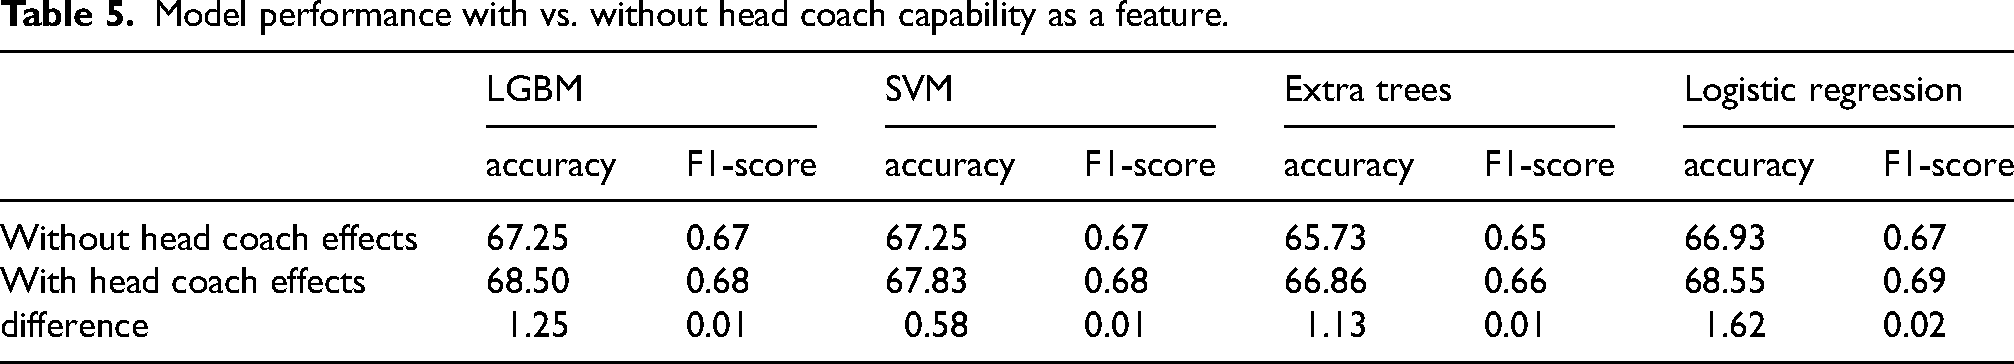
These robustness checks confirm that the coaching margin not only encapsulates past performance but also exhibits predictive utility for future outcomes. This result provides strong empirical support for our main hypothesis, which posits that teams led by head coaches with higher positive coaching margins demonstrate significantly greater season outcomes. While Table 3 highlights retrospective group-level success (e.g., championship counts), Table 5 provides compelling evidence that coaching margins contribute to improved forward-looking performance estimates, thereby empirically supporting our central hypothesis.
Discussion
Summary of findings
This study introduced and validated a novel machine learning–based framework for evaluating the leadership effectiveness of NBA head coaches. By predicting season win totals using only preseason team and player data—and deliberately excluding coach identity—we derived a metric termed the “coaching margin,” which represents the residual impact attributable to coaching. Our findings reveal that teams led by coaches with above-average coaching margins significantly outperformed those with below-average margins, a disparity that is evident in both regular-season outcomes and championship achievements. For example, Table 3 shows that the 90 coaches with above-average margins collectively secured 22 NBA titles, in stark contrast to the single title won by the 65 coaches with below-average margins (the latter including an outlier season by Pat Riley in 2005–06). Furthermore, Table 5 illustrates that incorporating the coaching margin into predictive models yields measurable improvements in both accuracy and F1-score, confirming its empirical and predictive validity. These findings provide robust empirical support for our central hypothesis that coaching margins serve as a meaningful proxy for leadership capability in professional sports.
Notably, our framework reconceptualizes head coaches as strategic leaders in accordance with Schein's (2010) view of leadership as system design and vision-setting. By positioning the head coach as the architect of team culture, structure, and resource allocation, our model transcends conventional play-by-play metrics, offering a holistic measure of leadership influence across an entire season. Implementing this model within a data-rich and competitive league such as the NBA further reinforces its generalizability and scalability.
Contributions and implications
This study makes several notable contributions to both theory and practice. From a theoretical perspective, this study has several implications. First, it provides a replicable, data-driven methodology to objectively assess leadership performance, addressing the limitations associated with traditional survey-based leadership research (Podsakoff et al., 2003). By employing sports analytics principles for leadership evaluation, our approach provides a replicable, data-driven methodology that can be generalized across diverse domains.
Second, our study broadens the scope of machine learning applications to leadership assessment. Although ML methods are widely utilized in human resource analytics and outcome prediction (Pap et al., 2022), few studies have explored their potential for inferring stable leadership traits from longitudinal performance data. Our findings demonstrate how predictive modeling can be aligned with leadership theory in practice.
Third, the research bridges the gap between sports analytics and leadership theory by leveraging the well-defined temporal structure of NBA seasons. Building on the work of Berri et al. (2009), we show that systematic modeling of coach effects can effectively isolate leadership value from player performance and other exogenous variables. Moreover, the coaching margin integrates multiple theoretical constructs—including transformational leadership (Bass and Avolio, 1994), resource orchestration (Sirmon et al., 2007), cascading influence (Margolis and Ziegert, 2016; Murphy, 2005), and complexity leadership (Uhl-Bien et al., 2007)—thereby enhancing our understanding of how leadership influences are transmitted throughout an organization.
Fourth, our framework reinforces the notion of leadership as a systemic, embedded influence rather than a purely interpersonal or stylistic trait, consistent with Schein's (2010) emphasis on culture and strategy formulation. Finally, by proposing a performance-based alternative to self-report measures, our work addresses critiques of common method bias in leadership research and supports calls for triangulated, multi-source evaluation techniques (Podsakoff et al., 2003).
From a practical standpoint, the coaching margin offers an objective, data-driven indicator of leadership effectiveness that transcends conventional win–loss records and media narratives. Sports organizations can leverage this metric to inform decisions regarding head coach selection, contract renewals, compensation strategies, and talent identification. In addition, the framework is adaptable to non-sports settings. For instance, human resource departments in corporate, governmental, or healthcare organizations can modify this approach to assess managerial performance using internal indicators such as productivity, employee turnover, or job satisfaction. Analogous to the coaching margin, a “managerial margin” could thereby isolate leadership contributions from structural or contextual factors (Reddy and Lakshmikeerthi, 2017). Moreover, while our model does not explicitly quantify the influence of assistant coaches or front-office executives, it underscores the notion that successful head coaches function as system orchestrators—demonstrating an ability to negotiate, align, and optimize critical resources. This can be seen as a practical manifestation of strategic leadership (Banks et al., 2016). Consequently, organizations should evaluate not only tactical expertise but also a leader's systems-thinking capacity when selecting or developing leadership talent.
Future research directions
This study lays a robust foundation upon which future investigations can build to further enhance the utility, interpretability, and generalizability of AI-based leadership evaluation frameworks across various domains. First, although our model estimates coaching effectiveness via season-level discrepancies in predicted versus actual win totals, future research should integrate psychological and behavioral constructs—such as player trust, emotional security, and motivational climate—to strengthen construct validity. Incorporating these intangible leadership dimensions could yield a more holistic understanding of leadership impact (Inceoglu et al., 2018).
Second, while the NBA provides an ideal and data-rich testbed for our framework, future studies should extend the model to other professional sports with comparably structured data, such as Major League Baseball (MLB), European professional soccer (e.g., the English Premier League, Spanish La Liga, Italian Serie A, German Bundesliga, or French Ligue 1), volleyball leagues, or the National Football League (NFL). These sports offer extensive statistical repositories, standardized seasons, and clearly delineated coaching roles, making them appropriate environments for testing the external validity and adaptability of the coaching margin concept. Moreover, applying the model across different team structures and tactical paradigms may reveal whether coaching impacts are universal or context-specific.
Third, beyond sports, future research should adapt our methodology to organizational contexts—such as corporate, governmental, or healthcare settings—where leadership similarly influences team performance. For instance, a “managerial margin” could be devised to assess department-level success or project execution outcomes, thereby enabling objective comparisons across organizational units. Such an extension would contribute to the growing field of evidence-based leadership assessment and performance forecasting. Also, exploration on shifting strategic paradigms—such as the rise of a three-point-centric style of play post-2015—suggest that the influence of coaching may evolve over time. Future studies should consider stratified models or interaction terms between era and coaching variables to examine whether leadership effects change across different periods.
Fourth, while our current study intentionally excluded in-season disruptions (e.g., injuries, trades, or mid-season acquisitions), subsequent work could explore how these external shocks interact with coaching strategies. In addition, incorporating social network analysis or examining intra-team role distributions may provide deeper insights into how leadership is embedded and diffused within the organization.
Finally, as predictive modeling becomes increasingly central to leadership evaluation, the need for interpretability grows. Future research should leverage explainable AI tools, such as SHAP-based feature importance analyses, to offer intuitive insights into the contributions of specific factors to leadership performance. These advances would bolster both practitioner confidence and academic rigor. Taken together, these avenues offer promising directions for future research that will undoubtedly strengthen the explanatory power and cross-domain relevance of our proposed framework, thereby advancing the scholarly integration of machine learning, leadership theory, and organizational performance.
Conclusion
This study introduced a novel, data-driven framework for evaluating the leadership effectiveness of NBA head coaches by estimating a “coaching margin"—the difference between predicted and actual team performance using solely preseason variables. Drawing on a structured, data-rich environment, our results demonstrate that this metric captures significant differences in coaching effectiveness across seasons and contexts. Coaches with higher coaching margins delivered superior long-term outcomes, including a markedly greater number of championships.
By framing head coaches as strategic leaders—consistent with system-centric leadership theories (Bass and Avolio, 1994; Schein, 2010)—our model extends leadership evaluation beyond isolated tactical decisions to encompass system design, resource alignment, and adaptive team management. This holistic conceptualization aligns with contemporary theories of transformational, cascading, and complexity leadership, which emphasize leadership as an embedded, emergent influence across organizational subsystems.
Empirically, our findings validate the coaching margin as both a credible and predictive proxy for leadership capability. The metric correlates with historical success (as shown in Table 3) and enhances the accuracy of future performance forecasts (as demonstrated in Table 5), underscoring its utility in both retrospective and forward-looking analyses.
Importantly, this framework contributes to the broader field of organizational science by offering a transparent, scalable, and theory-aligned alternative to traditional, self-report-based leadership assessments. As AI and machine learning continue to transform human resource management and performance analytics, our study provides a solid methodological foundation and a compelling argument for integrating predictive modeling into leadership evaluation practices.
Although our framework was developed within a sports context, its implications extend far beyond athletics, offering a model for evidence-based leadership assessment across diverse organizational domains. The principles underlying the coaching margin—structural baseline estimation, longitudinal validation, and leadership attribution—are readily adaptable to diverse organizational settings, thereby offering a new direction for evidence-based leadership research and practice.
Footnotes
Funding
The author received no financial support for the research, authorship, and/or publication of this article.
Declaration of conflicting interests
The author declared no potential conflicts of interest with respect to the research, authorship, and/or publication of this article.
Appendix
Descriptive statistics of model features. Coach-team-season summary.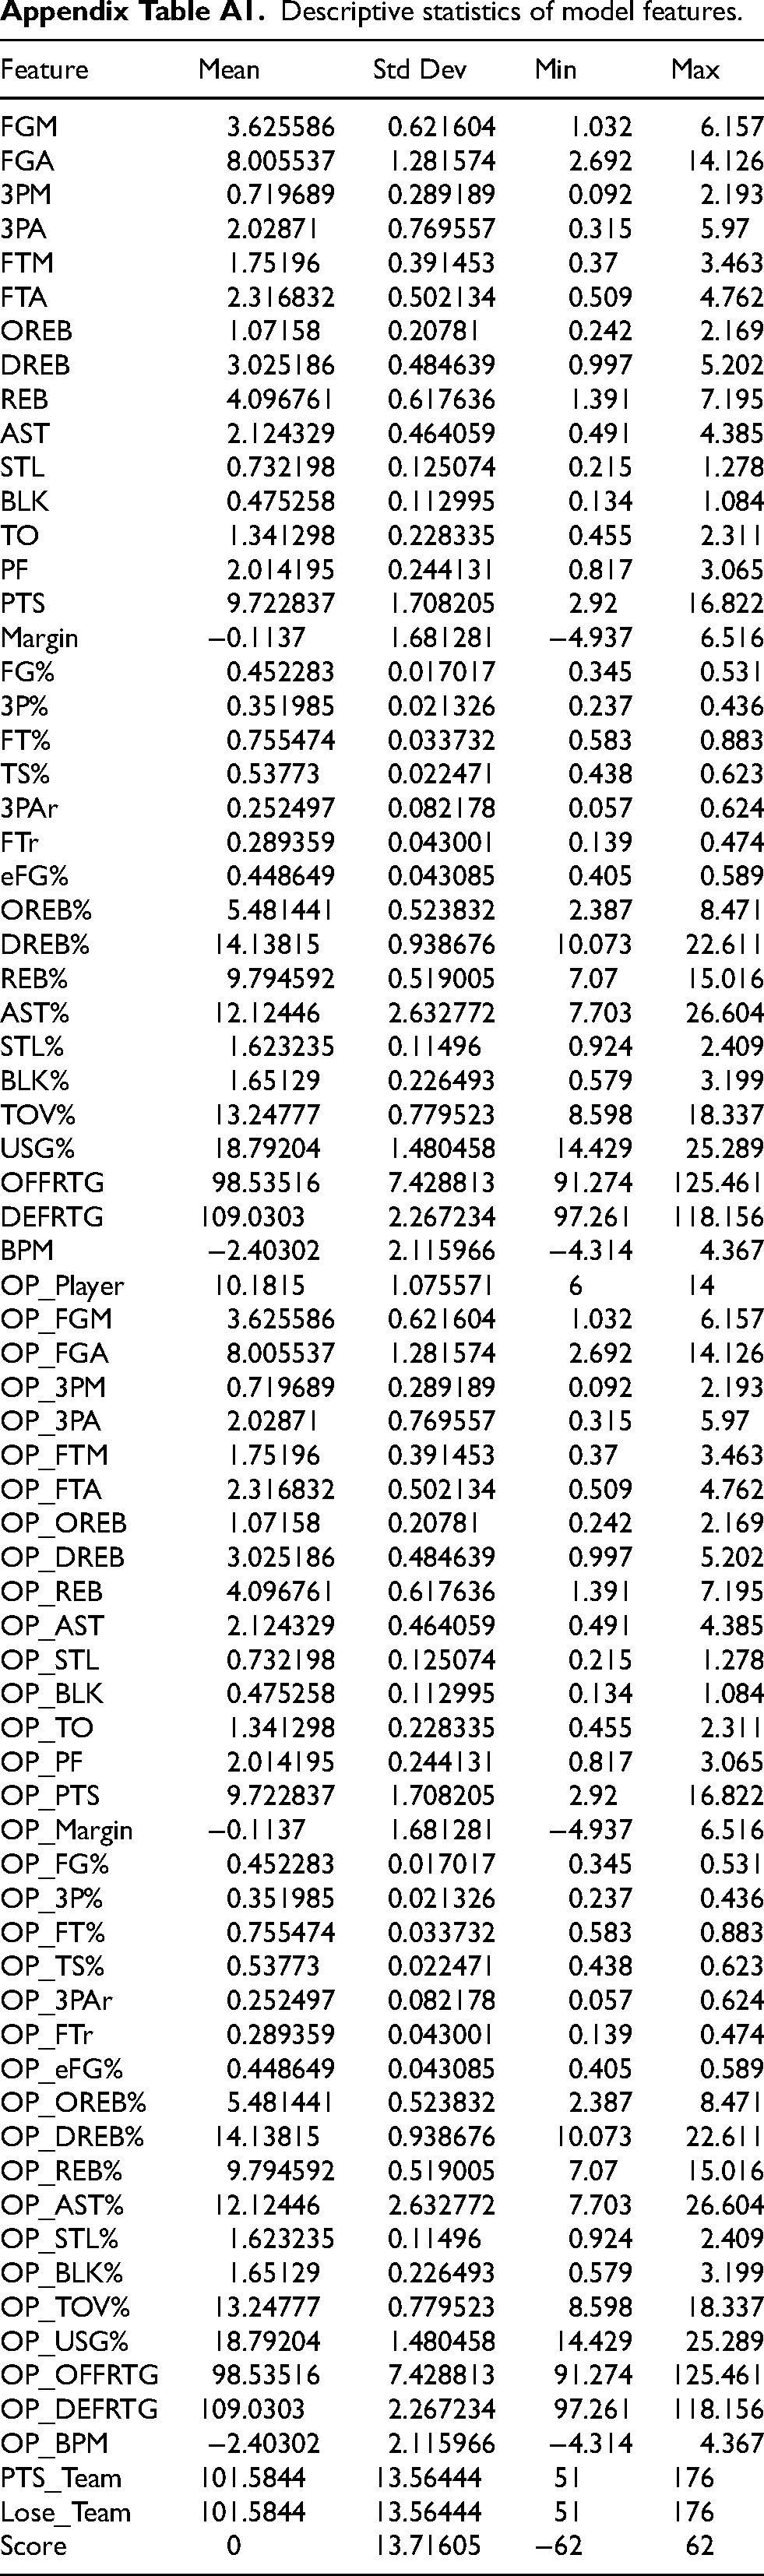
Feature
Mean
Std Dev
Min
Max
FGM
3.625586
0.621604
1.032
6.157
FGA
8.005537
1.281574
2.692
14.126
3PM
0.719689
0.289189
0.092
2.193
3PA
2.02871
0.769557
0.315
5.97
FTM
1.75196
0.391453
0.37
3.463
FTA
2.316832
0.502134
0.509
4.762
OREB
1.07158
0.20781
0.242
2.169
DREB
3.025186
0.484639
0.997
5.202
REB
4.096761
0.617636
1.391
7.195
AST
2.124329
0.464059
0.491
4.385
STL
0.732198
0.125074
0.215
1.278
BLK
0.475258
0.112995
0.134
1.084
TO
1.341298
0.228335
0.455
2.311
PF
2.014195
0.244131
0.817
3.065
PTS
9.722837
1.708205
2.92
16.822
Margin
−0.1137
1.681281
−4.937
6.516
FG%
0.452283
0.017017
0.345
0.531
3P%
0.351985
0.021326
0.237
0.436
FT%
0.755474
0.033732
0.583
0.883
TS%
0.53773
0.022471
0.438
0.623
3PAr
0.252497
0.082178
0.057
0.624
FTr
0.289359
0.043001
0.139
0.474
eFG%
0.448649
0.043085
0.405
0.589
OREB%
5.481441
0.523832
2.387
8.471
DREB%
14.13815
0.938676
10.073
22.611
REB%
9.794592
0.519005
7.07
15.016
AST%
12.12446
2.632772
7.703
26.604
STL%
1.623235
0.11496
0.924
2.409
BLK%
1.65129
0.226493
0.579
3.199
TOV%
13.24777
0.779523
8.598
18.337
USG%
18.79204
1.480458
14.429
25.289
OFFRTG
98.53516
7.428813
91.274
125.461
DEFRTG
109.0303
2.267234
97.261
118.156
BPM
−2.40302
2.115966
−4.314
4.367
OP_Player
10.1815
1.075571
6
14
OP_FGM
3.625586
0.621604
1.032
6.157
OP_FGA
8.005537
1.281574
2.692
14.126
OP_3PM
0.719689
0.289189
0.092
2.193
OP_3PA
2.02871
0.769557
0.315
5.97
OP_FTM
1.75196
0.391453
0.37
3.463
OP_FTA
2.316832
0.502134
0.509
4.762
OP_OREB
1.07158
0.20781
0.242
2.169
OP_DREB
3.025186
0.484639
0.997
5.202
OP_REB
4.096761
0.617636
1.391
7.195
OP_AST
2.124329
0.464059
0.491
4.385
OP_STL
0.732198
0.125074
0.215
1.278
OP_BLK
0.475258
0.112995
0.134
1.084
OP_TO
1.341298
0.228335
0.455
2.311
OP_PF
2.014195
0.244131
0.817
3.065
OP_PTS
9.722837
1.708205
2.92
16.822
OP_Margin
−0.1137
1.681281
−4.937
6.516
OP_FG%
0.452283
0.017017
0.345
0.531
OP_3P%
0.351985
0.021326
0.237
0.436
OP_FT%
0.755474
0.033732
0.583
0.883
OP_TS%
0.53773
0.022471
0.438
0.623
OP_3PAr
0.252497
0.082178
0.057
0.624
OP_FTr
0.289359
0.043001
0.139
0.474
OP_eFG%
0.448649
0.043085
0.405
0.589
OP_OREB%
5.481441
0.523832
2.387
8.471
OP_DREB%
14.13815
0.938676
10.073
22.611
OP_REB%
9.794592
0.519005
7.07
15.016
OP_AST%
12.12446
2.632772
7.703
26.604
OP_STL%
1.623235
0.11496
0.924
2.409
OP_BLK%
1.65129
0.226493
0.579
3.199
OP_TOV%
13.24777
0.779523
8.598
18.337
OP_USG%
18.79204
1.480458
14.429
25.289
OP_OFFRTG
98.53516
7.428813
91.274
125.461
OP_DEFRTG
109.0303
2.267234
97.261
118.156
OP_BPM
−2.40302
2.115966
−4.314
4.367
PTS_Team
101.5844
13.56444
51
176
Lose_Team
101.5844
13.56444
51
176
Score
0
13.71605
−62
62
Coach Name
Team(s)
Seasons Coached
Team Changes
Alvin Gentry
LA Clippers, New Orleans Pelicans, Phoenix Suns, Sacramento Kings
14
Yes
Avery Johnson
Brooklyn Nets, Dallas Mavericks
7
Yes
Bernie Bickerstaff
Charlotte Hornets, Los Angeles Lakers
4
Yes
Bill Berry
Chicago Bulls
1
No
Bill Cartwright
Chicago Bulls
3
No
Billy Donovan
Chicago Bulls, Oklahoma City Thunder
8
Yes
Bob Hill
Oklahoma City Thunder
2
No
Bob Weiss
Oklahoma City Thunder
1
No
Brad Stevens
Boston Celtics
8
No
Brendan Malone
Cleveland Cavaliers
1
No
Brett Brown
Philadelphia 76ers
7
No
Brian Hill
Orlando Magic
2
No
Brian Shaw
Denver Nuggets
2
No
Brian Winters
Golden State Warriors
1
No
Byron Scott
Brooklyn Nets, Cleveland Cavaliers, Los Angeles Lakers, New Orleans Pelicans
15
Yes
Chauncey Billups
Portland Trail Blazers
2
No
Chris Finch
Minnesota Timberwolves
3
No
Chris Ford
Philadelphia 76ers
1
No
Chris Jent
Orlando Magic
1
No
Dan Issel
Denver Nuggets
2
No
Darvin Ham
Los Angeles Lakers
1
No
Dave Cowens
Golden State Warriors
2
No
Dave Joerger
Memphis Grizzlies, Sacramento Kings
6
Yes
David Blatt
Cleveland Cavaliers
2
No
David Fizdale
Memphis Grizzlies, New York Knicks
4
Yes
Dennis Johnson
LA Clippers
1
No
Derek Fisher
New York Knicks
2
No
Doc Rivers
Boston Celtics, LA Clippers, Orlando Magic, Philadelphia 76ers
23
Yes
Don Chaney
New York Knicks
3
No
Don Nelson
Dallas Mavericks, Golden State Warriors
9
Yes
Doug Collins
Philadelphia 76ers, Washington Wizards
5
Yes
Dwane Casey
Detroit Pistons, Minnesota Timberwolves, Toronto Raptors
14
Yes
Earl Watson
Phoenix Suns
3
No
Ed Tapscott
Washington Wizards
1
No
Eddie Jordan
Philadelphia 76ers, Washington Wizards
7
Yes
Eric Musselman
Golden State Warriors, Sacramento Kings
3
Yes
Erik Spoelstra
Miami Heat
15
No
Flip Saunders
Detroit Pistons, Minnesota Timberwolves, Washington Wizards
12
Yes
Frank Hamblen
Los Angeles Lakers
1
No
Frank Johnson
Phoenix Suns
3
No
Frank Vogel
Indiana Pacers, Los Angeles Lakers, Orlando Magic
11
Yes
Fred Hoiberg
Chicago Bulls
4
No
George Irvine
Detroit Pistons
1
No
George Karl
Denver Nuggets, Milwaukee Bucks, Sacramento Kings
14
Yes
Gregg Popovich
San Antonio Spurs
22
No
Herb Williams
New York Knicks
2
No
Hubie Brown
Memphis Grizzlies
3
No
Igor Koko큄kov
Phoenix Suns
1
No
Ime Udoka
Boston Celtics
1
No
Isiah Thomas
Indiana Pacers, New York Knicks
5
Yes
JB Bickerstaff
Cleveland Cavaliers, Houston Rockets, Memphis Grizzlies
7
Yes
Jacque Vaughn
Brooklyn Nets, Orlando Magic
4
Yes
Jamahl Mosley
Orlando Magic
2
No
James Borrego
Charlotte Hornets, Orlando Magic
5
Yes
Jason Kidd
Brooklyn Nets, Dallas Mavericks, Milwaukee Bucks
7
Yes
Jay Triano
Phoenix Suns, Toronto Raptors
4
Yes
Jeff Bower
New Orleans Pelicans
1
No
Jeff Bzdelik
Denver Nuggets
3
No
Jeff Hornacek
New York Knicks, Phoenix Suns
5
Yes
Jeff Van Gundy
Houston Rockets, New York Knicks
6
Yes
Jerry Sloan
Utah Jazz
11
No
Jim Boylan
Chicago Bulls, Milwaukee Bucks
2
Yes
Jim Boylen
Chicago Bulls
2
No
Jim OBrien
Boston Celtics, Indiana Pacers, Philadelphia 76ers
9
Yes
Joe Mazzulla
Boston Celtics
1
No
Joe Prunty
Milwaukee Bucks
1
No
John Beilein
Cleveland Cavaliers
1
No
John Carroll
Boston Celtics
1
No
John Kuester
Detroit Pistons
2
No
John Loyer
Detroit Pistons
1
No
John Lucas
Cleveland Cavaliers
2
No
Johnny Davis
Memphis Grizzlies, Orlando Magic
3
Yes
Kaleb Canales
Portland Trail Blazers
1
No
Keith Smart
Cleveland Cavaliers, Golden State Warriors, Sacramento Kings
4
Yes
Kenny Atkinson
Brooklyn Nets
4
No
Kenny Natt
Sacramento Kings
1
No
Kevin McHale
Houston Rockets, Minnesota Timberwolves
7
Yes
Kevin Oneill
Toronto Raptors
1
No
Kevin Pritchard
Portland Trail Blazers
1
No
Kiki VanDeWeghe
Brooklyn Nets
1
No
Kim Hughes
LA Clippers
1
No
Kurt Rambis
Minnesota Timberwolves, New York Knicks
3
Yes
Larry Brown
Charlotte Hornets, Detroit Pistons, New York Knicks, Philadelphia 76ers
9
Yes
Larry Drew
Atlanta Hawks, Cleveland Cavaliers, Milwaukee Bucks
5
Yes
Larry Krystkowiak
Milwaukee Bucks
2
No
Lawrence Frank
Brooklyn Nets, Detroit Pistons
9
Yes
Lenny Wilkens
New York Knicks, Toronto Raptors
5
Yes
Leonard Hamilton
Washington Wizards
1
No
Lindsey Hunter
Phoenix Suns
1
No
Lionel Hollins
Brooklyn Nets, Memphis Grizzlies
8
Yes
Lloyd Pierce
Atlanta Hawks
3
No
Lon Kruger
Atlanta Hawks
3
No
Luke Walton
Los Angeles Lakers, Sacramento Kings
6
Yes
Marc Iavaroni
Memphis Grizzlies
2
No
Mark Daigneault
Oklahoma City Thunder
3
No
Mark Jackson
Golden State Warriors
3
No
Maurice Cheeks
Detroit Pistons, Philadelphia 76ers, Portland Trail Blazers
9
Yes
Melvin Hunt
Denver Nuggets
1
No
Michael Cooper
Denver Nuggets
1
No
Michael Curry
Detroit Pistons
1
No
Michael Malone
Denver Nuggets, Sacramento Kings
10
Yes
Mike Brown
Cleveland Cavaliers, Los Angeles Lakers, Sacramento Kings, San Antonio Spurs
9
Yes
Mike Budenholzer
Atlanta Hawks, Milwaukee Bucks
10
Yes
Mike DAntoni
Houston Rockets, Los Angeles Lakers, New York Knicks, Phoenix Suns
15
Yes
Mike Dunleavy
LA Clippers, Portland Trail Blazers
8
Yes
Mike Dunlop
Charlotte Hornets
1
No
Mike Evans
Denver Nuggets
1
No
Mike Fratello
Memphis Grizzlies
3
No
Mike Miller
New York Knicks
1
No
Mike Montgomery
Golden State Warriors
2
No
Mike Woodson
Atlanta Hawks, New York Knicks
9
Yes
Monty Williams
New Orleans Pelicans, Phoenix Suns
9
Yes
Nate Bjorkgren
Indiana Pacers
1
No
Nate McMillan
Atlanta Hawks, Indiana Pacers, Oklahoma City Thunder, Portland Trail Blazers
19
Yes
Nick Nurse
Toronto Raptors
5
No
PJ Carlesimo
Brooklyn Nets, Oklahoma City Thunder
3
Yes
Pat Riley
Miami Heat
6
No
Paul Silas
Charlotte Hornets, Cleveland Cavaliers, New Orleans Pelicans
7
Yes
Paul Westphal
Oklahoma City Thunder, Sacramento Kings
4
Yes
Pete Myers
Chicago Bulls
2
No
Phil Jackson
Los Angeles Lakers
10
No
Quin Snyder
Atlanta Hawks, Utah Jazz
9
Yes
Randy Ayers
Philadelphia 76ers
1
No
Randy Wittman
Cleveland Cavaliers, Minnesota Timberwolves, Washington Wizards
9
Yes
Reggie Theus
Sacramento Kings
2
No
Rick Adelman
Houston Rockets, Minnesota Timberwolves, Sacramento Kings
13
Yes
Rick Carlisle
Dallas Mavericks, Detroit Pistons, Indiana Pacers
21
Yes
Rick Pitino
Boston Celtics
1
No
Rudy Tomjanovich
Houston Rockets, Los Angeles Lakers
4
Yes
Ryan Saunders
Minnesota Timberwolves
3
No
Sam Mitchell
Minnesota Timberwolves, Toronto Raptors
6
Yes
Sam Vincent
Charlotte Hornets
1
No
Scott Brooks
Oklahoma City Thunder, Washington Wizards
12
Yes
Scott Skiles
Chicago Bulls, Milwaukee Bucks, Orlando Magic, Phoenix Suns
13
Yes
Sidney Lowe
Memphis Grizzlies
3
No
Stan Van Gundy
Detroit Pistons, Miami Heat, New Orleans Pelicans, Orlando Magic
13
Yes
Stephen Silas
Houston Rockets
3
No
Steve Clifford
Charlotte Hornets, Orlando Magic
9
Yes
Steve Kerr
Golden State Warriors
9
No
Steve Nash
Brooklyn Nets
3
No
Taylor Jenkins
Memphis Grizzlies
4
No
Terry Porter
Milwaukee Bucks, Phoenix Suns
3
Yes
Terry Stotts
Atlanta Hawks, Milwaukee Bucks, Portland Trail Blazers
13
Yes
Tim Floyd
Chicago Bulls, New Orleans Pelicans
3
Yes
Tom Barrise
Brooklyn Nets
1
No
Tom Thibodeau
Chicago Bulls, Minnesota Timberwolves, New York Knicks
11
Yes
Tony Barone
Memphis Grizzlies
1
No
Tony Brown
Brooklyn Nets
1
No
Tony Dileo
Philadelphia 76ers
1
No
Tyrone Corbin
Sacramento Kings, Utah Jazz
5
Yes
Tyronn Lue
Cleveland Cavaliers, LA Clippers
6
Yes
Vinny Del Negro
Chicago Bulls, LA Clippers
5
Yes
Wes Unseld
Washington Wizards
2
No
Will Hardy
Utah Jazz
1
No
Willie Green
New Orleans Pelicans
2
No