
Abstract
While football analytics has changed the way teams and analysts assess performance, there remains a communication gap between machine learning practice and how coaching staff talk about football. Coaches and practitioners require actionable insights, which are not always provided by models. To bridge this gap, we show how to build wordalisations (a novel approach that leverages large language models) for shots in football. Specifically, we first build an expected goals model using logistic regression. We then use the coefficients of this regression model to write sentences describing how factors (such as distance, angle and defensive pressure) contribute to the model’s prediction. Finally, we use large language models to give an engaging description of the shot. We describe our approach in a model card and provide an interactive open-source application describing shots in recent tournaments. We discuss how shot wordalisations might aid communication in coaching and football commentary, and give a further example of how the same approach can be applied to other actions in football.
Introduction
The field of soccer analytics has witnessed a rapid evolution, with machine learning models playing a crucial role in evaluating player and team performance (Decroos et al., 2019; Dick and Brefeld, 2023; Fernandez et al., 2019; Gyarmati and Stanojevic, 2016; Peralta Alguacil et al., 2020; Rahimian et al., 2022, 2023). One of the most widely used models is the Expected Goals (xG) model, which is used to evaluate the quality of scoring opportunities by assigning probabilities to shots based on factors such as location, angle, and defensive pressure (Pollard and Reep, 1997; Sumpter, 2016). Several studies train machine learning models using predictors such as shot type, distance to goal, and angle to goal to estimate xG (e.g., Bransen and Davis, 2021; Eggels et al., 2016; Herbinet, 2018; Pardo, 2020; Rathke, 2017; Sarkar and Kamath, 2021; Tippana, 2020; Wheatcroft and Sienkiewicz, 2021). Recent work has also explored integrating tracking and performance data to improve predictive performance and model explainability in xG modelling, highlighting the importance of both accurate classification and interpretable feature contributions (Cefis and Carpita, 2025a, 2025b). Additionally, detailed studies have investigated the role of data sources on model performance (Davis and Robberechts, 2020); how defensive positioning and goalkeeper placement enhances the estimation of goal probabilities (Lucey et al., 2015); and the use of neural networks to estimate scoring probabilities (Ruiz et al., 2015).
An important consideration when building xG models is that we should be able to explain their implications to coaching staff. Many xG models are black boxes, producing numerical probabilities without offering clear explanations of how the different features of a shot determine the probability that it will result in a goal (Davis et al., 2024). To address this challenge, one approach is to use SHAP (SHapley Additive Explanations) (Lundberg and Lee, 2017) to explain the contribution of each feature to a model’s prediction. Anzer and Bauer (2021) applied SHAP to xG models, demonstrating that shot distance is the most influential factor in goal probability. Another approach is to build models that are interpretable by design. For example, building on work by Morales (2016), Sumpter (2016) proposes a logistic regression model that incorporates how much of the goal the shooter can see and distance from goal as variables. This expected goals model can thus be explained in terms of the shooter sight on goal, a simple to communicate coaching concept.
Even when adopting these approaches, there remains a gap between what a machine learner practitioner and coaching staff might consider as an explanation. Indeed, while SHAP values give a numerical representation of feature contributions, these do not automatically translate into actionable insights for football practitioners. This is part of a larger issue within sports analytics where very few studies explain how adopting recommendations from a model impact performance (Goes et al., 2021). To bridge this gap, we adapt an approach introduced by Caut et al. (2025) known as Wordalisation. The key idea is to use large language models (LLMs) to convert numbers into natural language narratives. One example in Caut et al. (2025) is a football scout, which uses rankings of players in key metrics to describe their skills. Wordalisations are thus concise, easily digestible narratives that summarize data-driven observations without directly reporting numerical values. Prompt engineering, the practice of crafting effective input instructions for LLMs, is a key to using these systems (Brown et al., 2020; Reynolds and McDonell, 2021; Wei et al., 2022). By careful framing of prompts, users of LLMs can significantly improve the relevance, accuracy, and creativity of generated outputs. By engineering prompts from data, we can transform abstract metrics into accessible explanations.
Our contribution extends this concept by shifting from the wordalisation of raw data values to the wordalisation of machine learning model outputs–specifically, xG predictions and their feature-level contributions. This enables the communication of how each input factor influenced the predicted xG value of a shot, providing coaches and analysts with meaningful, contextualised interpretations rather than just descriptive statistics or abstract numbers. Unlike prior work that primarily focuses on developing more accurate xG models, the goal of this paper is to enhance the interpretability of model outputs for non-technical users. We do not aim to introduce a novel predictive model for xG estimation–instead, instead we build on the models that already exist in the literature and in practice to make them interpretable by coaches. Our emphasis is on generating understandable, actionable textual explanations from model predictions. While we use logistic regression in this study due to its interpretability and established effectiveness in xG modelling, the system is model-agnostic and can be adapted to other machine learning models with decomposable or explainable outputs (e.g., SHAP-compatible models).
Figure 1 illustrates the overall workflow of our proposed approach, which is divided into two main components: the model pipeline and the wordalisation process. The data pipeline extracts data from databases and APIs, generates relevant features, trains corresponding machine learning models, and calculates the contribution of each feature to the output. The second component, wordalisation, uses LLMs to generate intuitive, text-based narratives that explain xG values based on feature contributions. To document our approach, we provide a structured model card (Mitchell et al., 2019) detailing design, capabilities, and limitations for transparency and reproducibility. We provide an open-source Streamlit application that enables users to import their own shot dataset and explore xG explanations interactively. The tool is available at https://shotsgpt.streamlit.app/. We also provide the code online: https://github.com/Peggy4444/shotsGPT/tree/main.
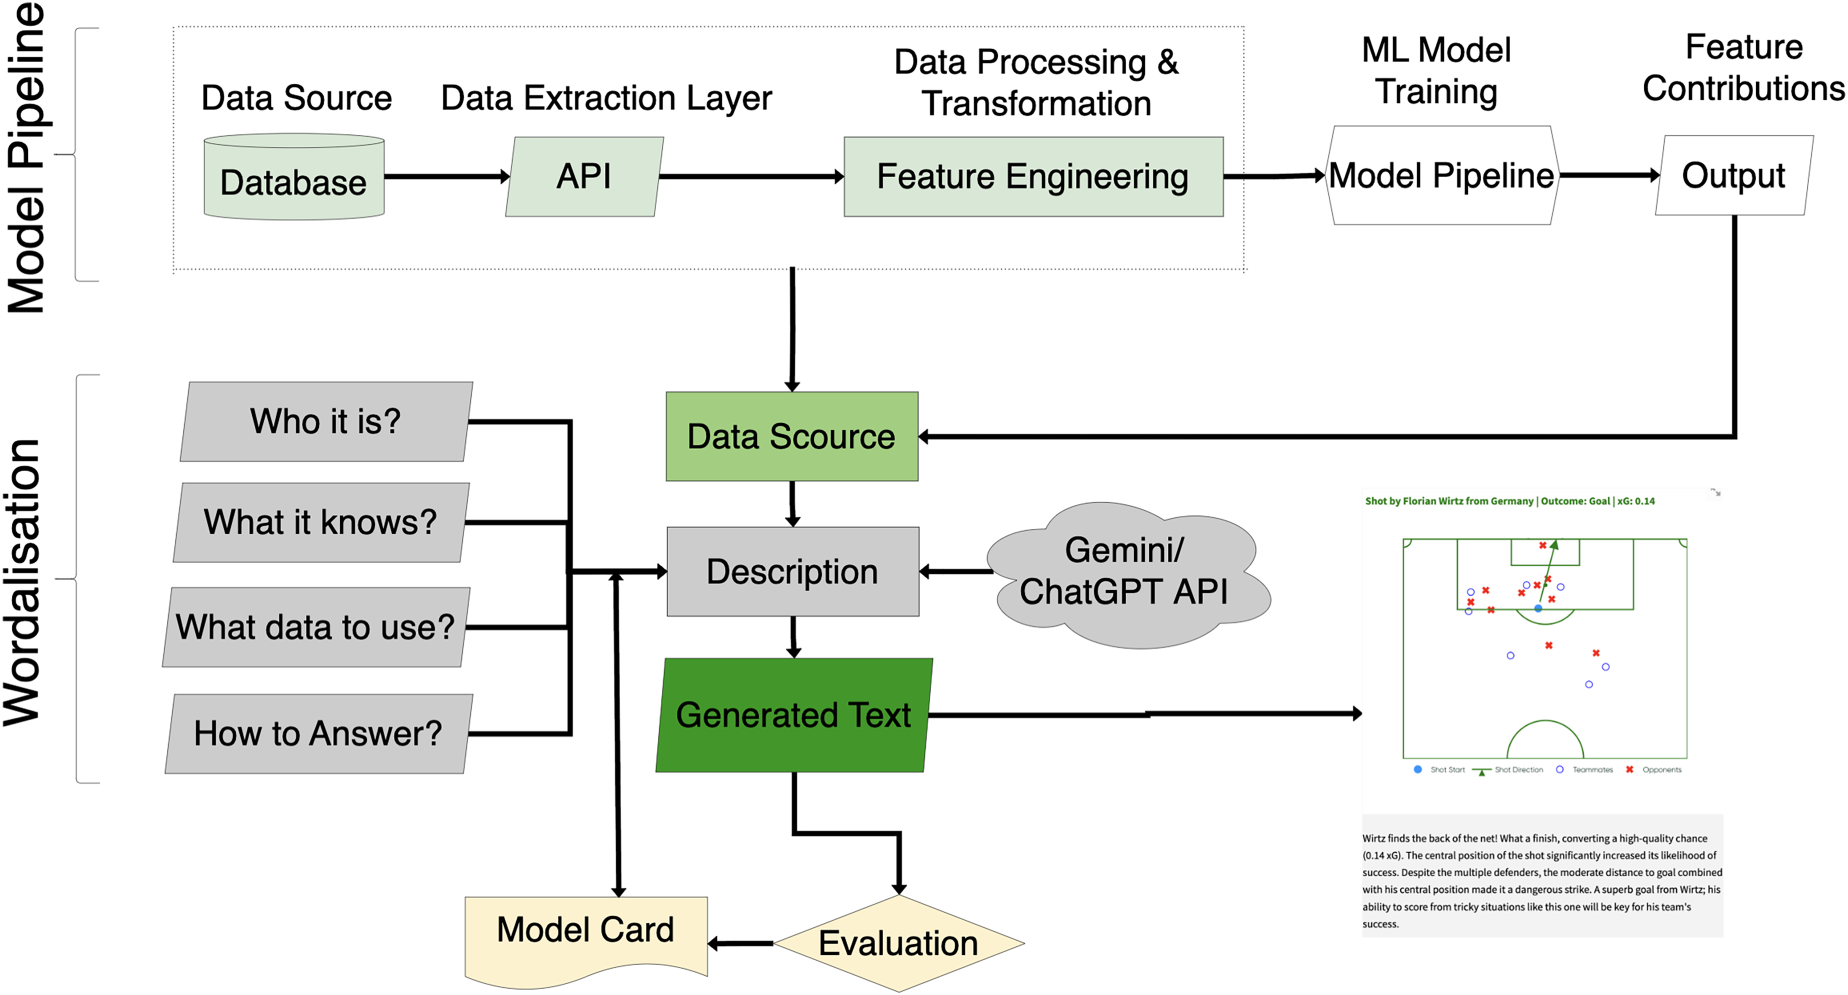
Overview of the proposed workflow, comprising the data pipeline for feature extraction, model training, and feature contribution analysis, along with the wordalisation process that integrates data source, description, and LLM chat modules. The output is an engaging and accurate LLM generated text.
Materials and methods
We start by describing the dataset and features used to train the xG model. We then explain the model justification and interpretability. Next, we outline the steps for constructing prompts in our wordalisation process. Finally, we introduce metrics to evaluate the wordalisation by analyzing the trade-off between engagement and accuracy.
Data description and feature generation
The dataset used in this study was obtained from the Hudl-StatsBomb events and StatsBomb360 datasets for the following available competitions: EURO Men 2024 and 2022, National Women’s Soccer League (NWSL) 2018, FIFA 2022, Women’s Super League (FAWSL) 2017, and Africa Cup of Nations (AFCON) 2023.
1
These datasets were accessed using the
From the shot data, we generated a set of features categorized into body part-related, play pattern-related, goalkeeper-related, shot location-related, and opponent-related features. These features collectively provide a detailed understanding of the shot and its surrounding context. We assume a fixed pitch size of 105 meters in length and 68 meters in width for all games.
The body part-related features include a binary indicator for whether the shot was taken with the left foot, called
Shot location-related features encompass the vertical distance from the shot to the centerline of the pitch (
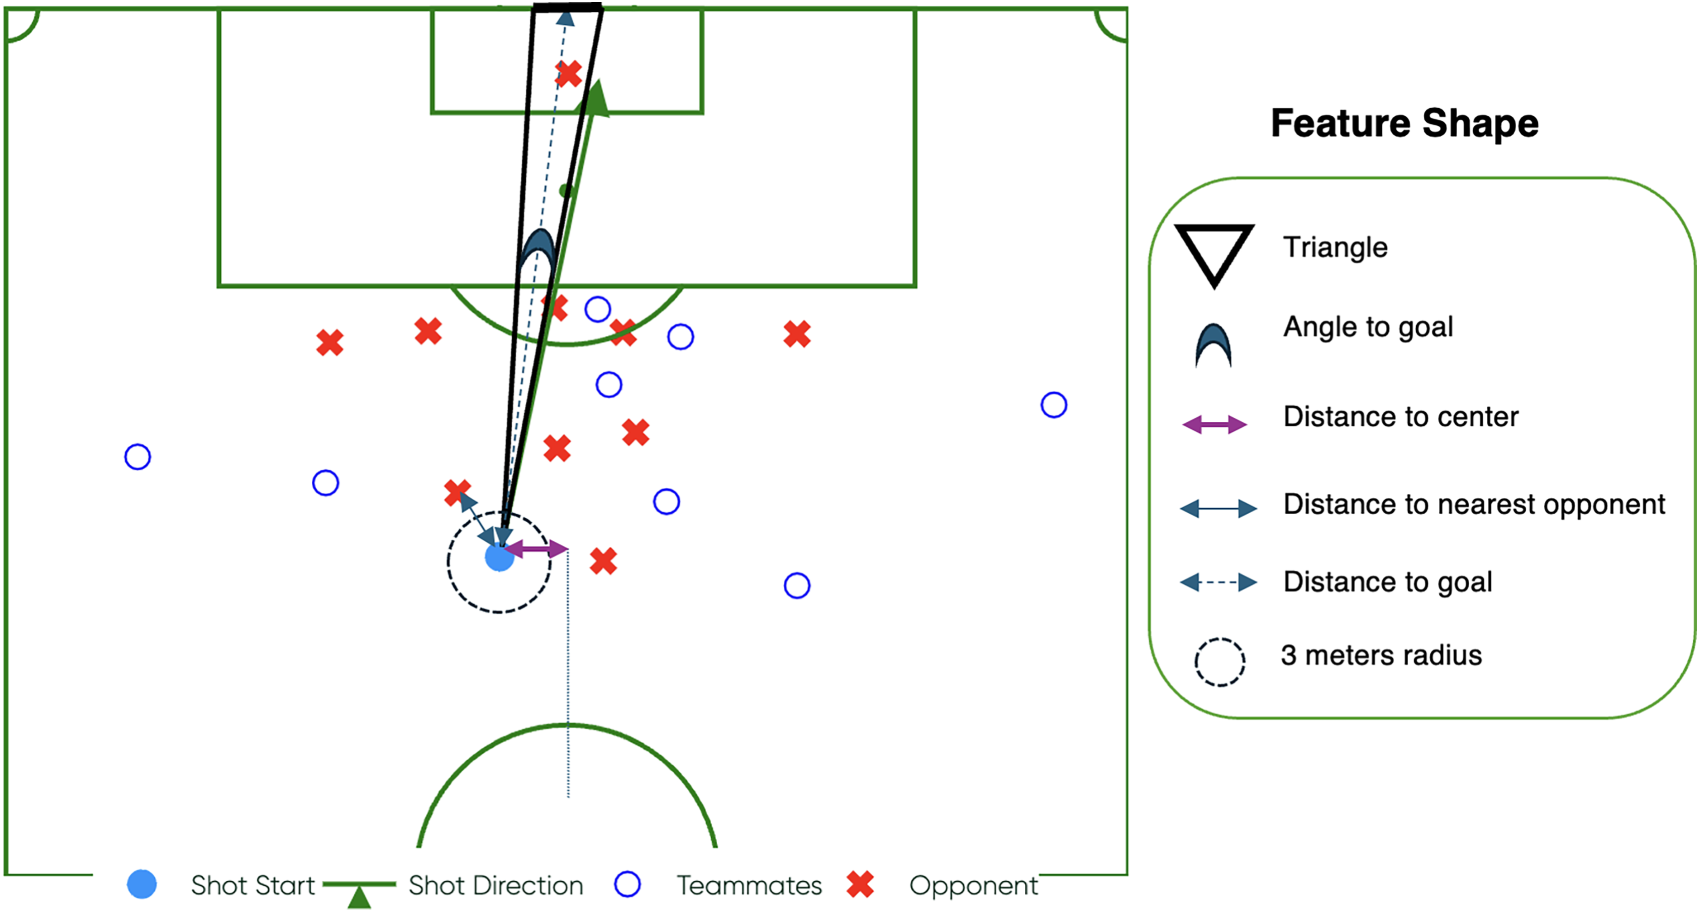
Illustration of various football features including shot location, goalkeeper position, opponent pressure, and teammates’ positions.
Feature selection and model training
Our data pipeline is designed to fit a model to that data and build wordalisations which compare the importance of features of a particular shot compared to other shots in that dataset. This means we fit different logistic regression xG models independently to each of the six competitions (to see the individual models go into https://shotsgpt.streamlit.app/shots and select the competition of interest from drop-down in the left sidebar and look at the summary table of the trained model for the selected competition). Our aim is not to build the “best” expected goals model but to be able to explain the probability of scoring a particular shot relative to other shots in the same competition. Depending upon the competition we expect different variables to have different weights in the final model.
In designing this pipeline, we used one of the competitions (Euros 2024) to identify if any of the variables could be dropped. We found that
While accuracy is a concern when building predictive models, for our study interpretability is emphasised because we want to build wordalisations to explain the underlying factors that contribute to a shot’s outcome. For this reason, we maintain certain features in the model even if their p-value is greater than 0.05, as they provide valuable insights into the shot context. For instance, features like
After this feature selection and transformation process, we arrive at the final set of features that are either (or both) statistically significant and interpretable. The features retained for the final xG models are as follows:
Explainable components and feature contribution weights
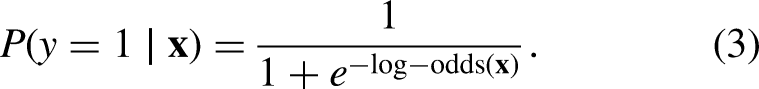
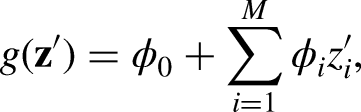
In logistic regression, the predicted probability of an event is modelled as a function of the input features using log-odds. The log-odds can be expressed as a linear combination of the input features, where each feature contributes to the final prediction based on its coefficient. The log-odds for a given shot (feature vector) are defined as:
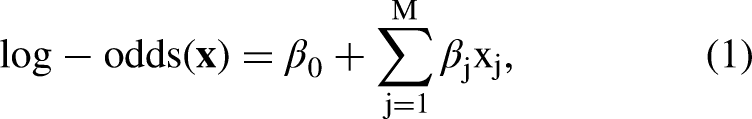
We calculate the contribution of each feature to the log-odds by first mean-centreing the feature values. This step adjusts each feature value
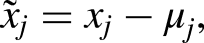
The contribution of each feature

Note that the log-odds are converted to a probability via the logistic function, yielding the final predicted xG:
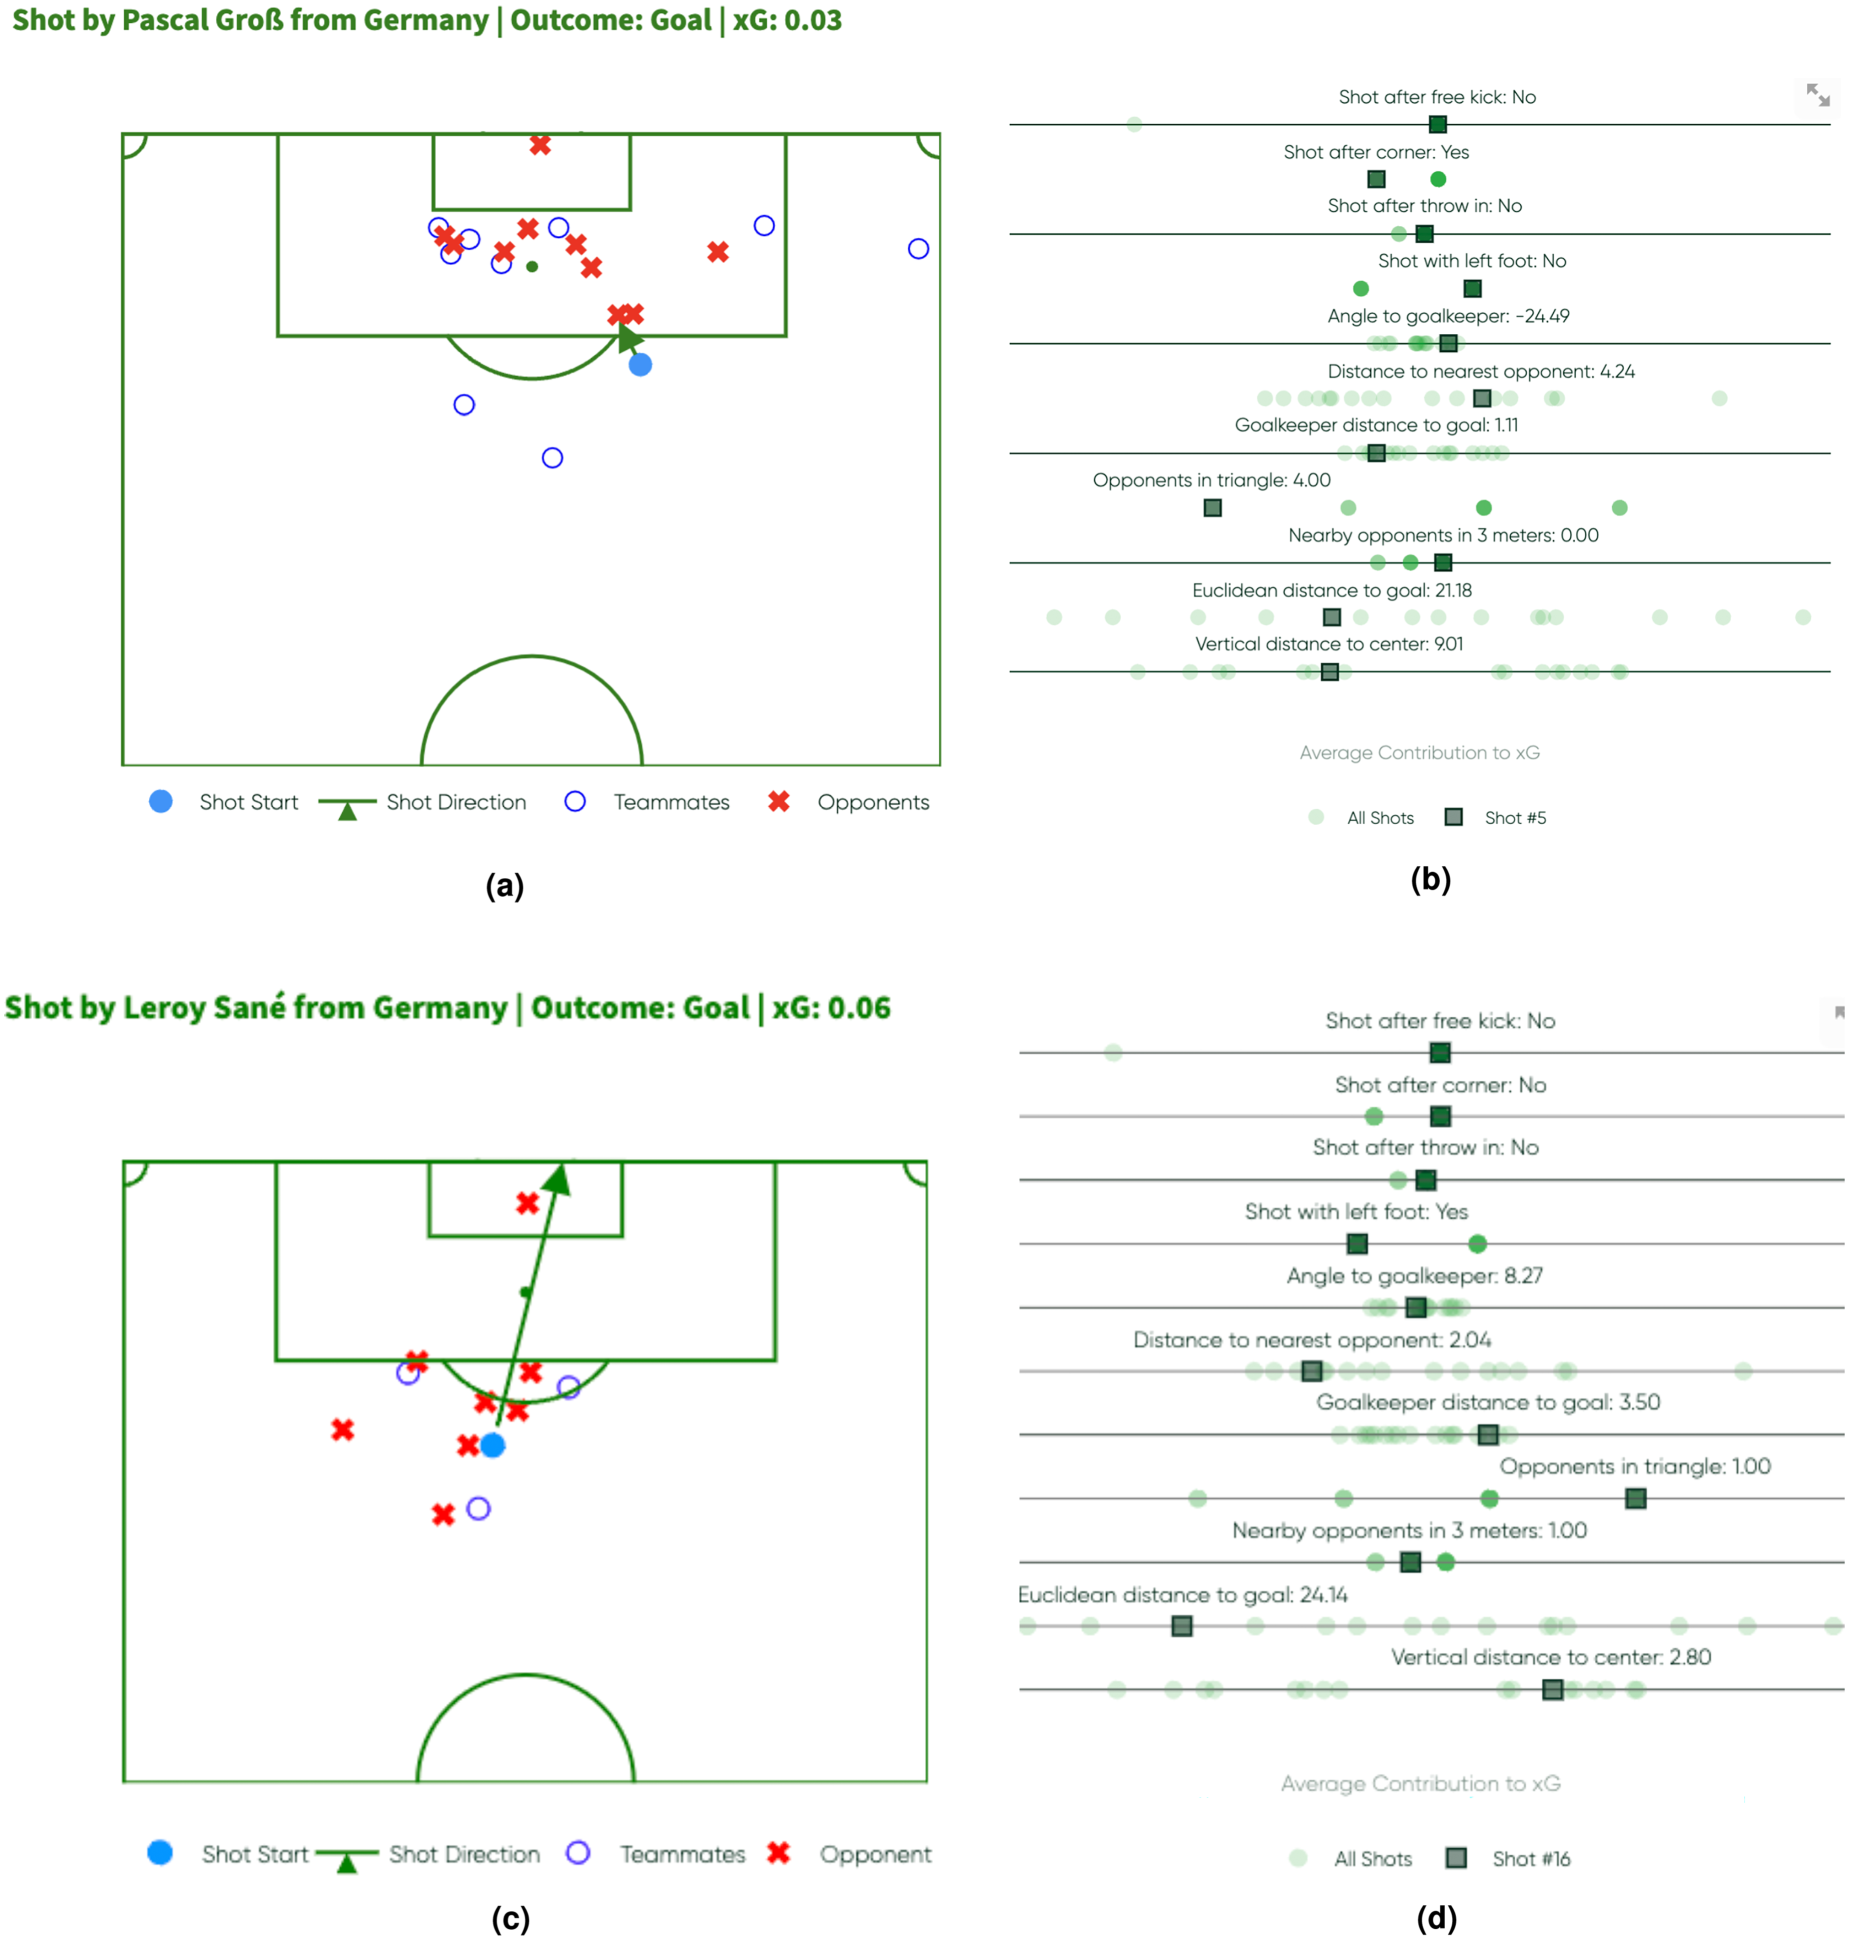
Analysis of two shots from Germany vs. Scotland in EURO 2024. The top row shows the 56th-minute shot, with the pitch visual on the left and the contribution plot on the right. The bottom row shows the 85th-minute shot, with the pitch visual on the left and the contribution plot on the right. (a) 56th minute shot - Pitch Visual, (b) 56th minute shot - Contribution Plot, (c) 85th minute shot - Pitch Visual and (d) 85th minute shot - Contribution Plot.
In contrast, the second successful shot, in Figures 3(c) and 3(d), features a slightly higher xG than the first shot. In this instance, there is only one opponent (the goalkeeper) in the triangle blocking the path, and this results in a positive contribution to the xG. The distribution plot shows the
Wordalisation: Step by step prompt
While the approach above explains shot success in terms of the variables, such as defensive pressure (measured by the number of opponents in the shooting triangle), these do not automatically allow communication with practitioners. Visualizations like distribution plots can fall short in conveying actionable or intuitive understanding to coaches, players, or non-technical stakeholders. To address this gap, we adapt the wordalisation approach of Caut et al. (2025), described in the introduction.
There is a structured, four-step approach for creating prompts underlying wordalisations. Each step is designed to provide clarity and context, ensuring the generated descriptions are coherent, aligned with practitioner needs and accurate. These steps are as follows: 1) Tell it who it is, 2) Tell it what it knows, 3) Tell it what data to use, 4) Tell it how to answer. In our case, the aim is to describe these steps tailored for interpreting the contributions of different variables to estimated xG values. An overview of the approach is given in Figure 4. We now outline the four Wordalisation steps, for, what we call, a shot commentator.
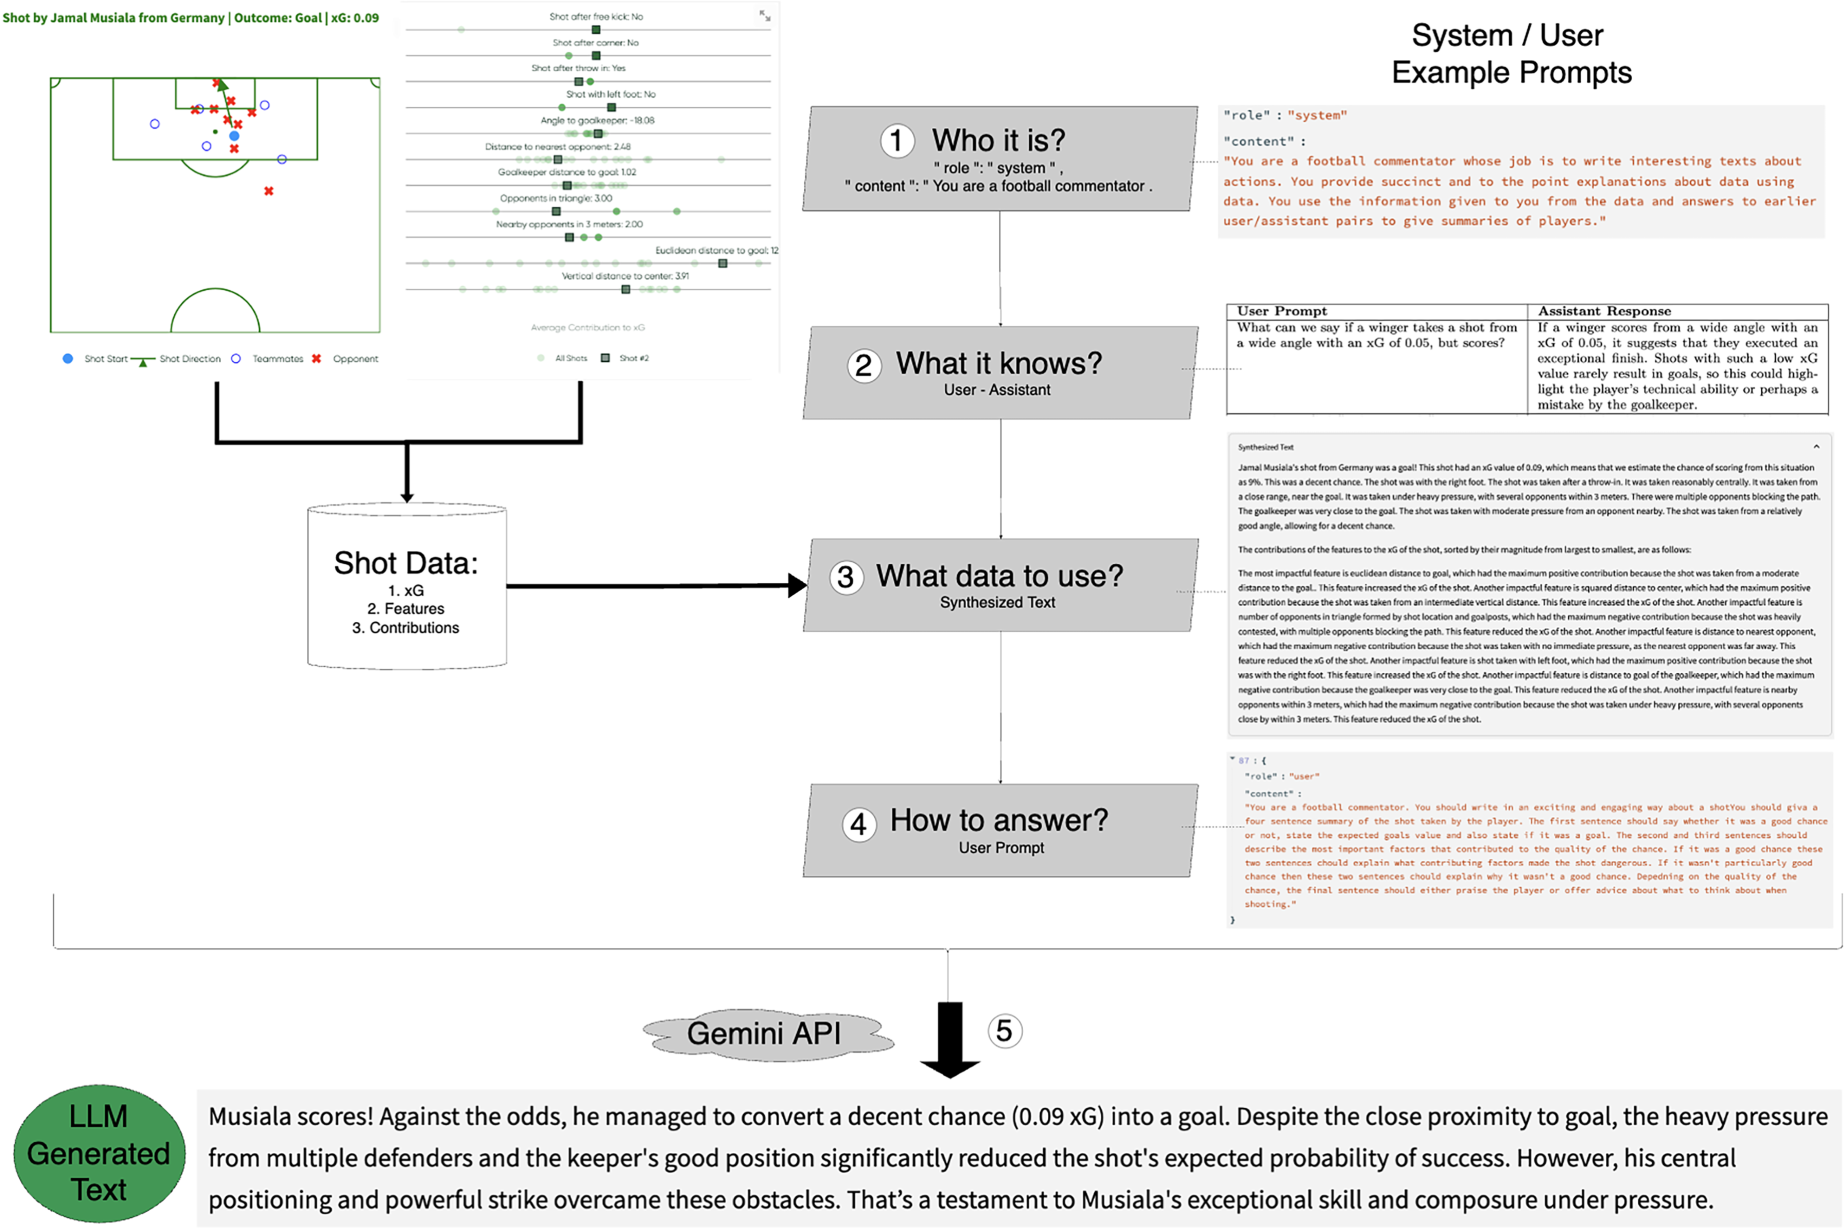
Wordalisation workflow for shots.
The xG value (from equation (3)) quantifies the likelihood of scoring. Instead of giving a numerical value, we use percentiles. Specifically, we translate xG values into qualitative descriptions of scoring chances. We categorize the xG values based on predefined percentiles into five categories: “slim chance” for the 25th percentile (
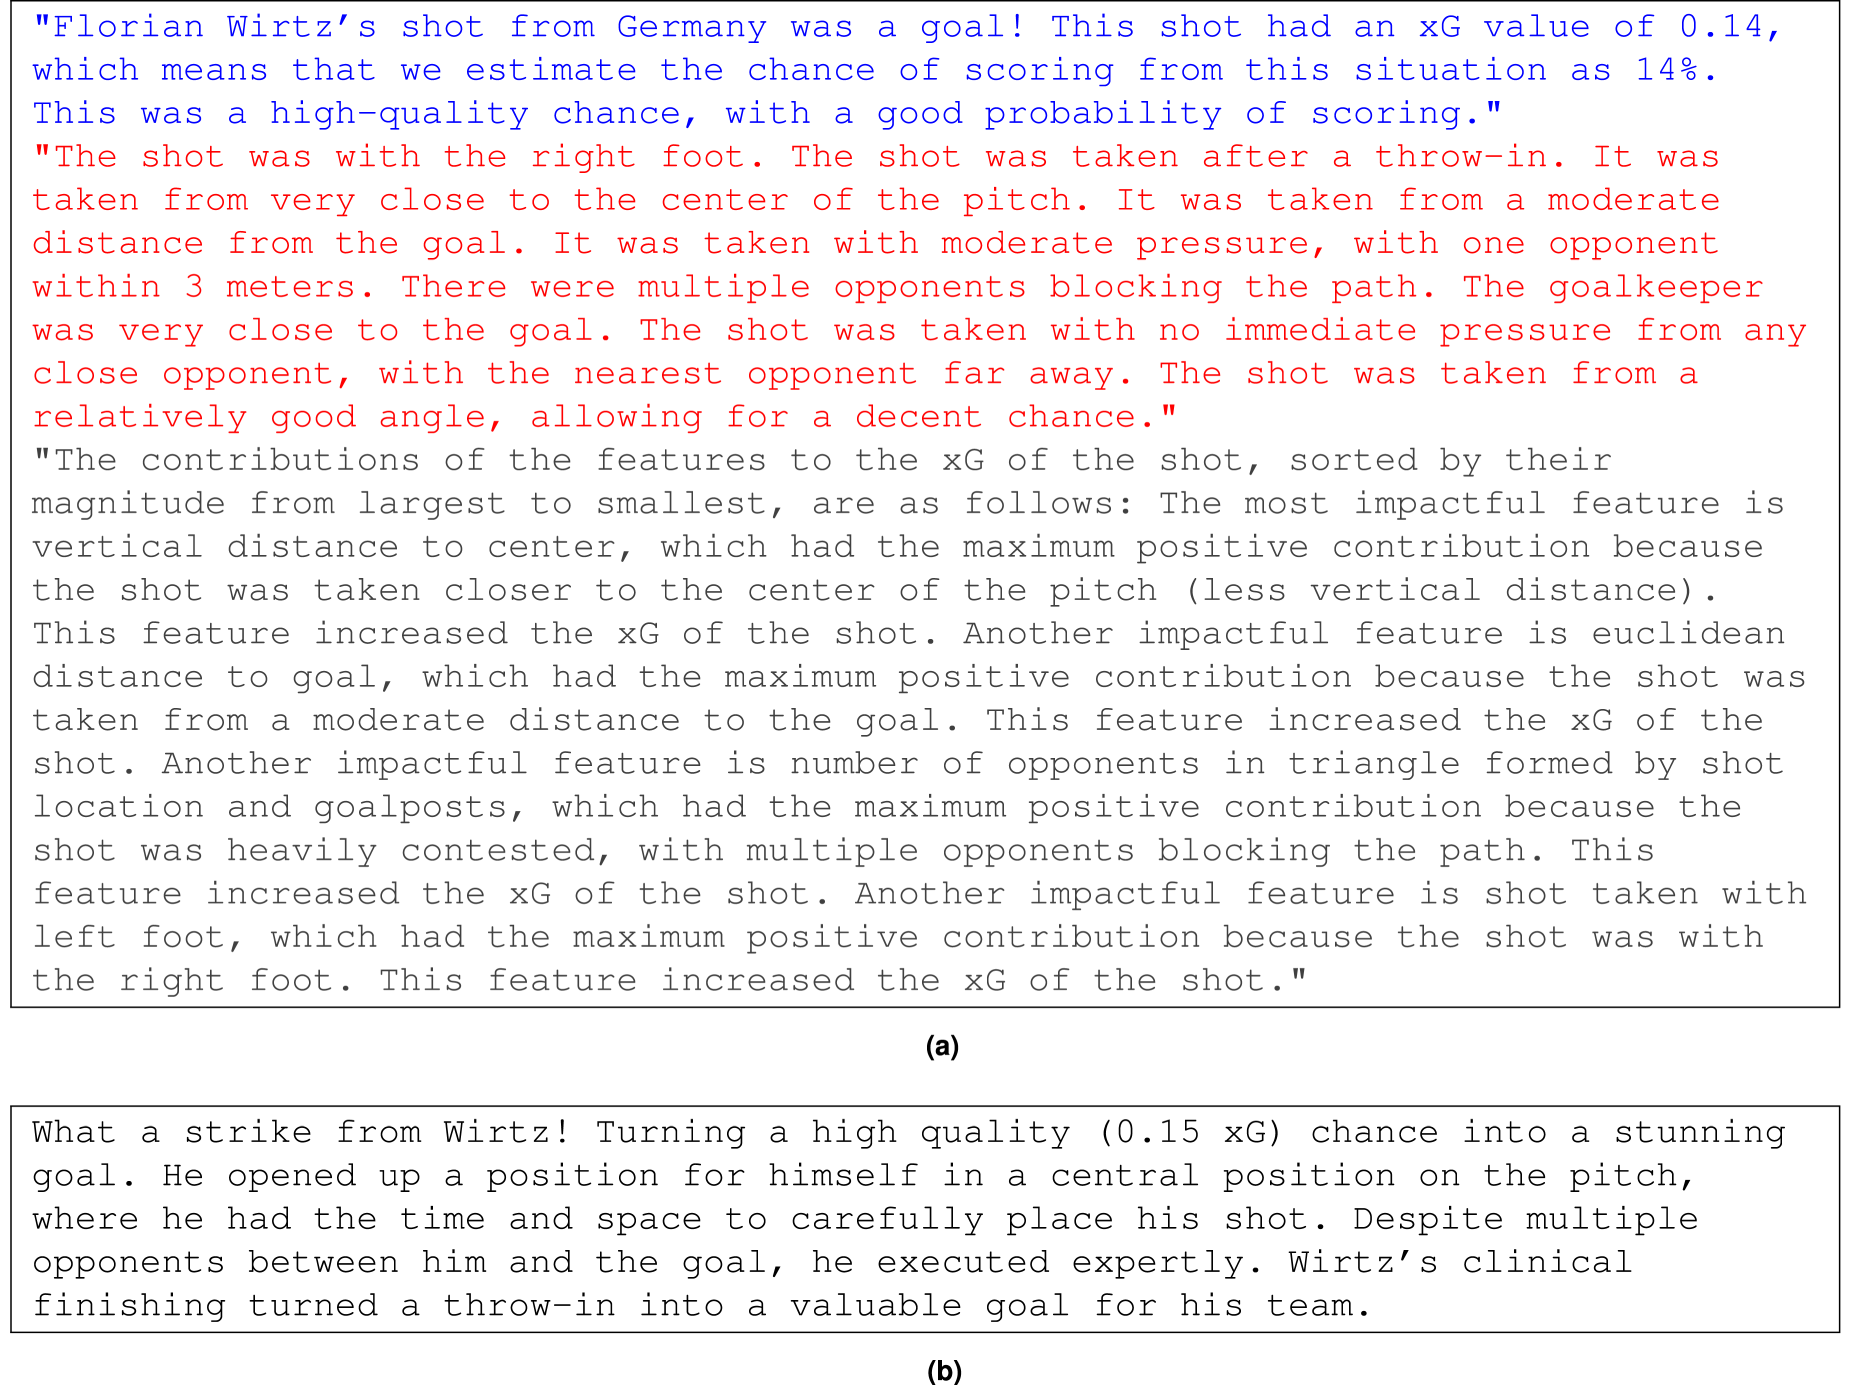
Example synthesized text and few-shot example prompt. (a) Synthesized text. The text highlighted in blue is the initial description of the expected goals. The red text explains the features in footballing terms, and the grey text describes the feature contributions and (b) Few-shot example.
We also use percentile ranges to describe continuous features such as ”The shot was taken with the left foot.” if the value of
An example of these contributions is shown in red in Figure 5(a).
To then explain how different factors contributed to the xG value, we use the contributions as shown in Figure 3. By ranking these contributions, positive factors (e.g., ”close proximity to the goal”) and negative factors (e.g., ”poor shooting angle”) are highlighted in the text. For example, if a shot shows large contribution values for the following features: ”The high chance of scoring was influenced by the player’s close position to the goal and minimal defensive pressure.”
Only features with contributions greater than 0.1 or less than
It is noteworthy that this synthesis step is fully automated: we define a function once that dynamically generates a per-shot textual summary by extracting and transforming the relevant shot data. The function can be applied to thousands of shots without additional manual intervention. A full list of such functions used for assigning contributions can be found in the description class of our code https://github.com/Peggy4444/shotsGPT/blob/main/classes/description.py. The gray text in Figure 5(a) explains the impact of individual characteristics on the xG value, ranked by their contribution magnitude.
Engagement and accuracy
We do automated evaluation of our wordalisations based on two key criteria: engagement and accuracy. We compare five distinct cases. For case 1, the text provided to the evaluation (denoted as [Case text] in the evaluation prompts below) consists only of shot quality and features (as shown as coloured texts in Figure 5(a)). The idea is to test whether the LLM (Gemini in the examples used here) already has the ability to assess shot value just from a description of the shot, but without additional data. Case 2 extends the text provided in the evaluation prompt to include contributions (as well as shot quality and features). This provides a comprehensive explanation of the shot and the factors influencing its quality. Case 2 tests the engagement and accuracy of a purely descriptive text.
Cases 3 and 4 test the wordalisations. Case 4 produces a text following the complete wordalisation approach by following all the steps described in section “Wordalisation: Step by Step Prompt”. Case 3 omits the ‘tell it what it knows’ and ‘tell it how to answer’ stages, to help assess how important these parts of the prompts are in shaping an accurate answer. Finally, case 5 serves as a baseline, providing only numerical feature values without any textual explanation or narrative.
The aim of our
For
Results
Shot description application
In order to demonstrate our approach we built a shot description application in Streamlit https://shotsgpt.streamlit.app/. The application allows the user to select a match from one of the available tournaments, then a shot from that match and it compares the selected shot to the other shots in the match in a distribution plot, shows the location of players and the ball in that shot and writes a short commentary about the shot. The application also allows the user to see the steps used in building the wordalisation: the model summary of the fitted logistic regression; the synthesized text at the “tell it what data to use” stage; and the full sequence of messages sent to the language model. We provide the full code for this application on Github: https://github.com/Peggy4444/shotsGPT/tree/main.
Feature contributions
The contribution plots visualize feature importance (Figure 6). Each horizontal band in the plot represents a feature, with its width indicating the magnitude of its contribution. Shots with values to the right of the vertical axis have more xG, while those to the left have less xG. In these plots,
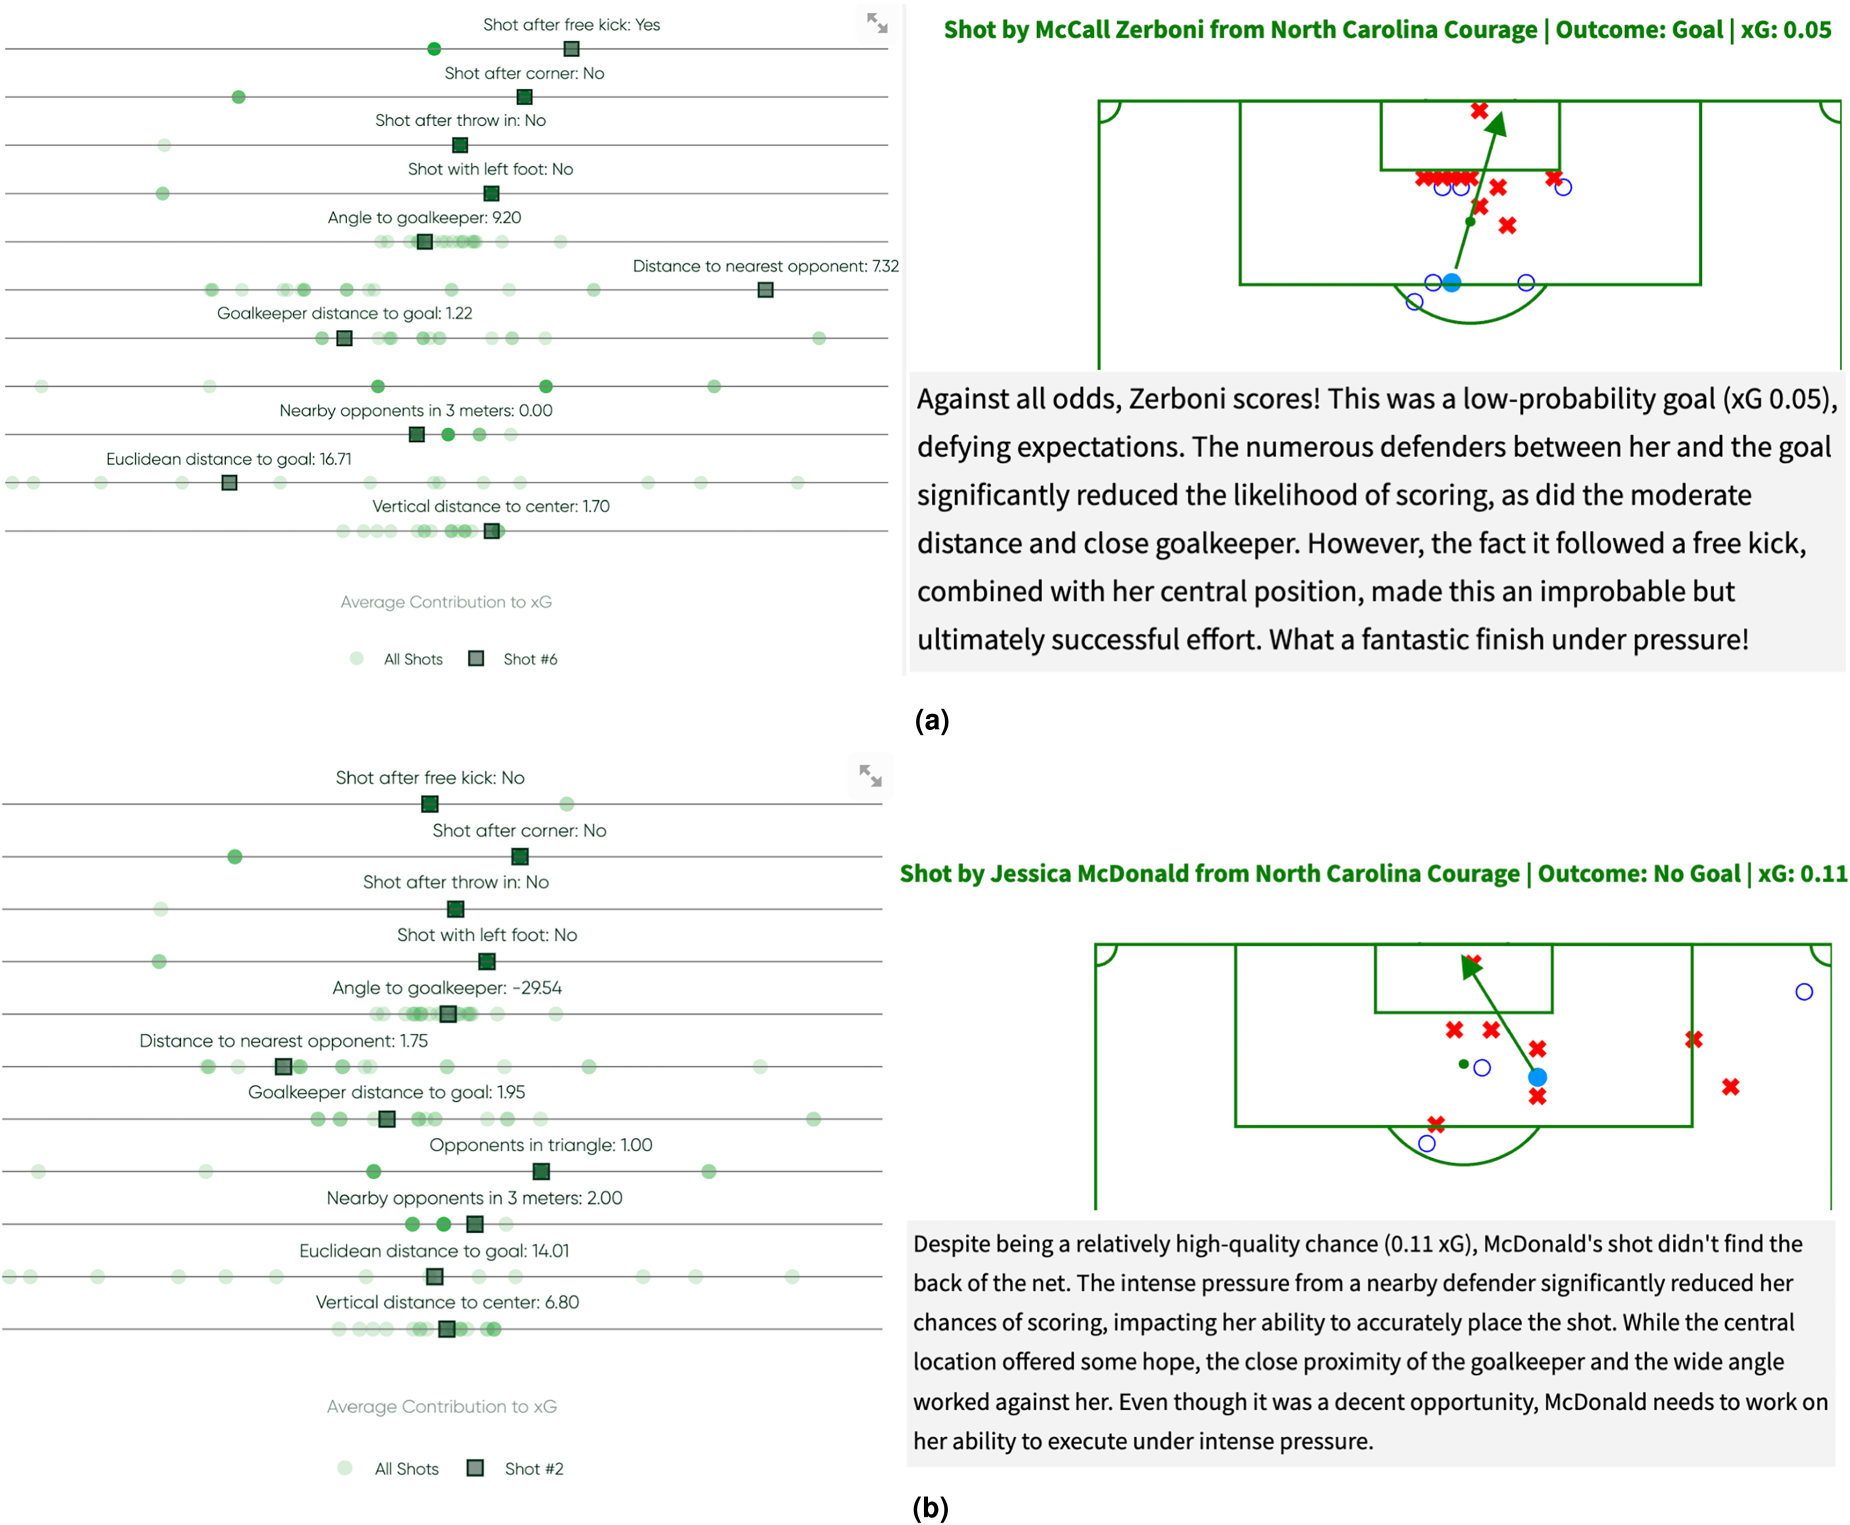
Feature contribution analysis and LLM generated text of two shots from Washington Spirit - North Carolina Courage in National Women’s Soccer League (NWSL) 2018. (a) 2th minute shot by McCall Zerboni and (b) 10th minute shot by Jessica McDonald.
Model card
The model card provides a comprehensive overview of the system’s design, capabilities, and limitations. It documents both components of the pipeline: the xG prediction model and the language model used for wordalisation. For the xG model, the card specifies the use of logistic regression, the rationale for its selection (interpretability), and details of the training data used per competition. To ensure transparency about predictive performance, the model card includes evaluation metrics for each competition, namely ROC-AUC (discrimination), Brier score (calibration), and log-loss (probabilistic confidence). These metrics are reported separately for datasets such as EURO 2024, FIFA 2022, FAWSL, and AFCON 2023, allowing the assessment to the robustness and reliability of the xG estimates across contexts. The card also includes structured prompt templates used for generating natural language explanations from feature contributions, as well as limitations of the language model outputs, including sensitivity to input phrasing and lack of domain-specific grounding. Under ethical considerations, the model card highlights issues related to dataset bias (e.g., league-specific play styles), reproducibility (open-sourced code and reproducible data pipeline), and responsible AI usage (exclusion of goalkeepers, and transparency of feature attribution logic). It follows the model card framework (Mitchell et al., 2019) and aims to support informed deployment in decision-making environments. The full model card is publicly accessible via: https://github.com/Peggy4444/shotsGPT/blob/main/model%20cards/model-card-shot-xG-analysis.md
Evaluation
Figure 7 shows that there is a trade-off between engagement and accuracy in the generated descriptions. Case 2 (i.e., descriptive shot quality + features + contributions) achieves the highest accuracy, for key features such as
Further applications
So far we have applied this method to evaluating shots, but the same concept can be used to evaluate other actions in football. An example is shown in Figure 8 for both attacking (8a) and defensive (8b) actions. For attack, we assign an “expected threat” value to every pass and carry made by a player and use this to describe the most common type of pass the player makes. The first step in this process was to create an action-based expected threat model (Sumpter, 2023), using three seasons of event data across the French, English, German, Spanish and Italian leagues. This model is a logistic regression predicting the probability that a pass, will eventually be part of a chain of actions leading to a goal. The model is then interpreted in the context of individual players by creating synthetic descriptions which summarises the best passes and carries by a player, and also including details of where those passes occurred on the pitch. These synthesized texts are then passed to GPT4o along with both ”Tell It What It Knows” question-answer pairs and ”Tell It How To Answer” examples. The output is an engaging text, explaining how the player’s passes contribute to the team.
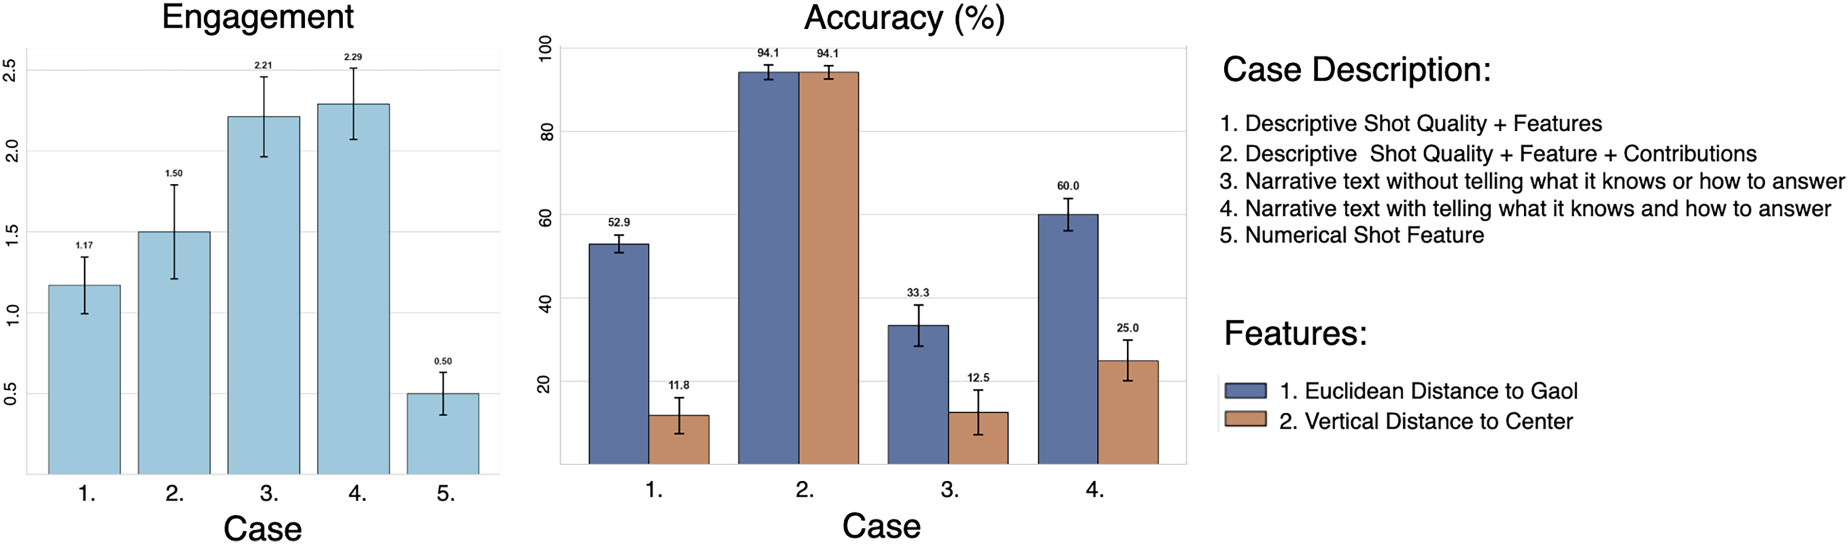
Engagement and Accuracy scores. The results are averaged over 10 runs and standard deviation is shown on top of the bars.
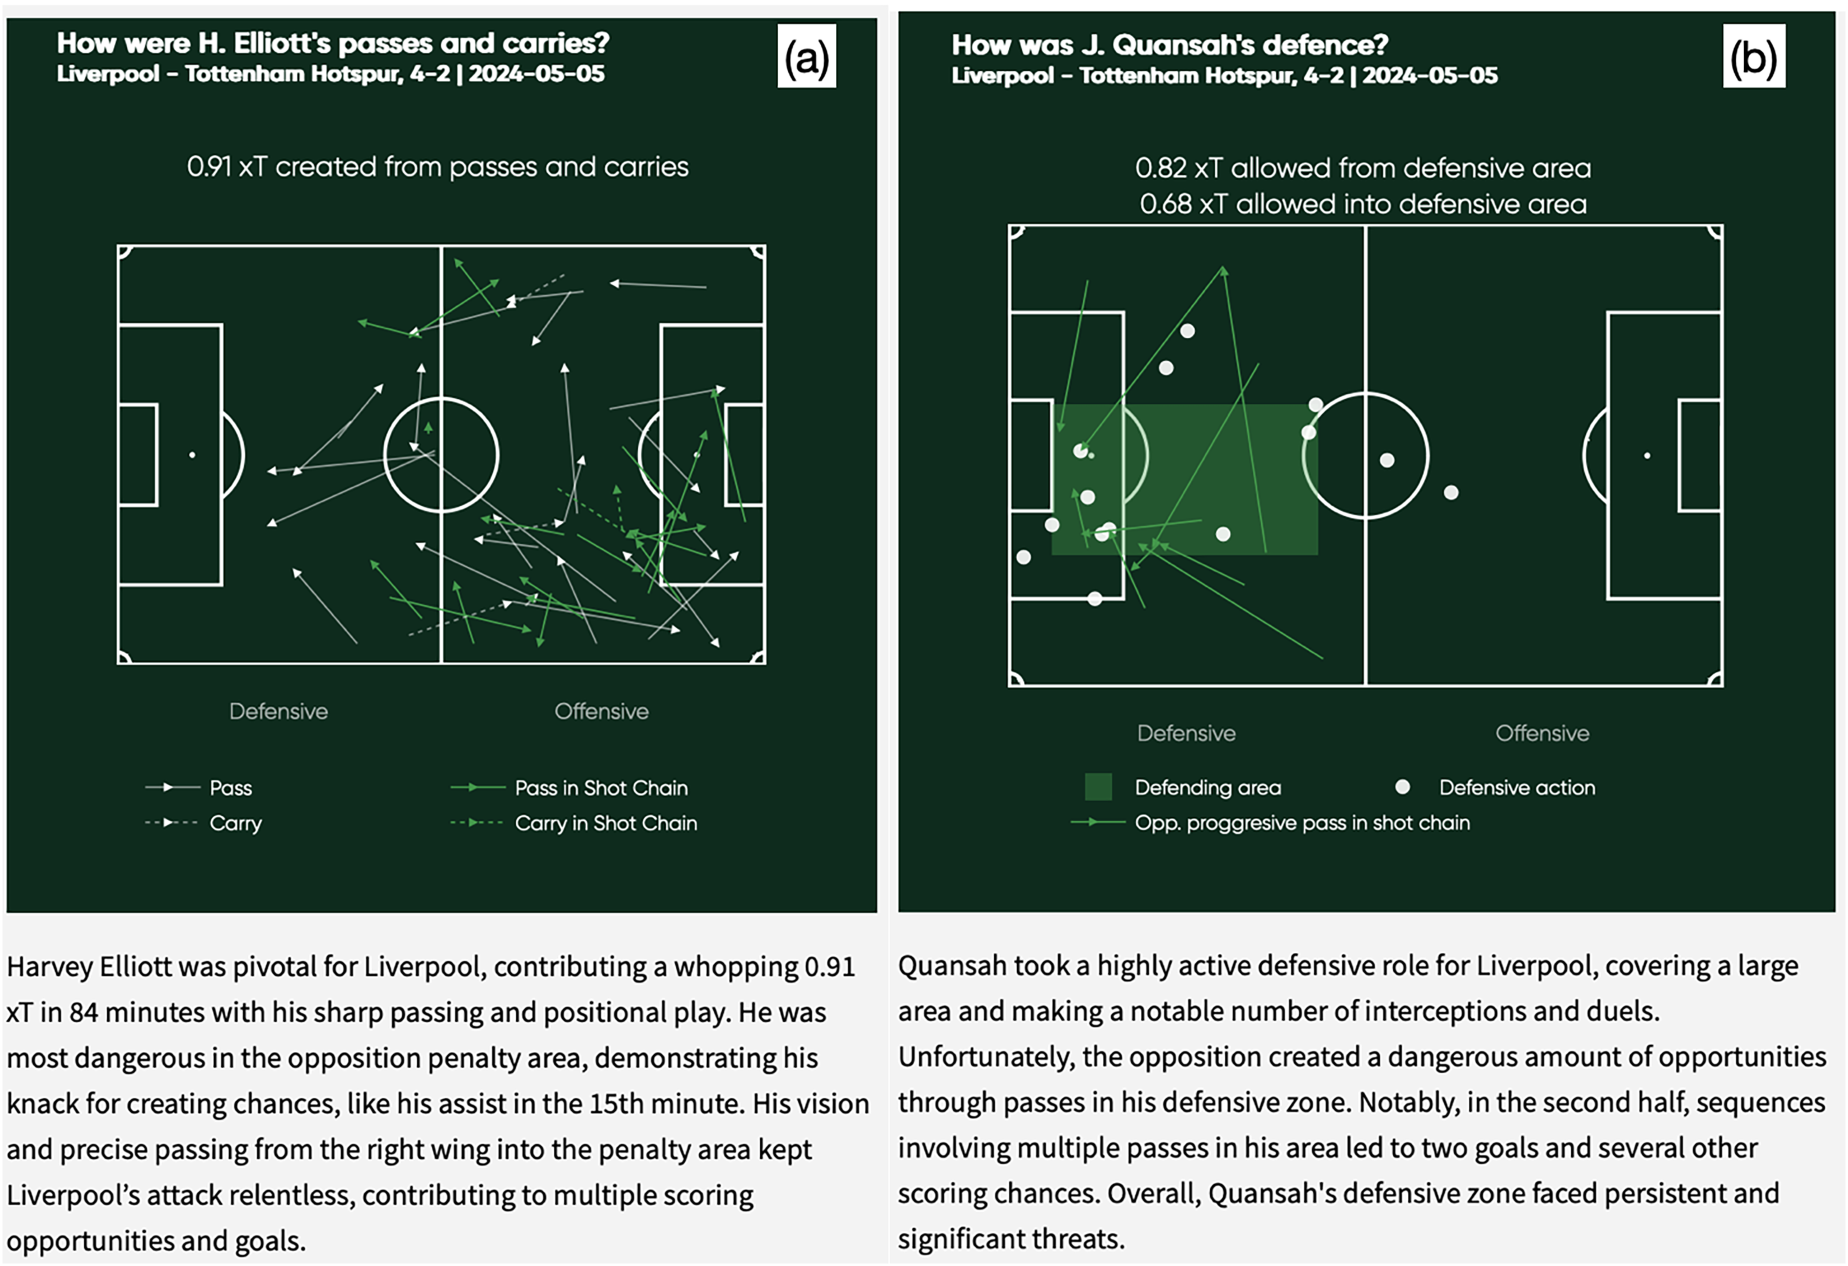
Wordalisation applications in passes, carries and defensive actions.
Discussion
There are three steps to the process we have outlined for generating natural language narratives describing football shots. The first is to create a mathematical model of the probability of a shot being a goal, in our case a logistic regression. By focusing on variables which are interpretable, we ensure that, at the second step, we can convert the outcome of this model into words. Neither of these steps uses language models and instead we use ”old-fashioned” statistical models to fit an expected goal model to data. The linear nature of the logistic regression ensures that we make a correct interpretation of the variables. The third and final step involves combining the ”tell it what data to use” text with a series prompts to produce an engaging text about the shots. The resulting text is both engaging and factually correct.
In terms of explaining what makes a chance good (or poor), we see our approach as an improvement on the SHAP-based feature importance approach Anzer and Bauer (2021). The wordalisations not only retain the model’s accuracy but also make its outputs more accessible and actionable for end-users. Our automated evaluation methods show that there is a trade-off between an engaging description and an accurate description of all aspects of the shot. This is to be expected, if a coach were to describe the quality of a shot to a player, we would not expect them to give all details in every description.
Our work contributes to the theoretical foundation of wordalisations (Caut et al., 2025), by extending its application to logistic regression models and LLM-generated explanations. Unlike previous implementations that focused on raw numerical rankings, we ask LLMs to interpret the output of machine learning models. Our approach can be extended to other models, such as the expected threat model in Figure 8. Similarly, any model — such as pitch control (Spearman et al., 2017) and off-ball runs (Peralta Alguacil et al., 2020)— which describes positioning and actions of players can, by following the three steps outlined here, be converted into an informative wordalisation.
Broadly speaking, models of football can be divided into two approaches: those which give an explicit description of a mechanisms (as discussed in the previous paragraph) and those which use machine learning to make predictions. Although we don’t do so here, our approach can potentially be adapted to a more general machine learning setup through the SHAP values of a model (Anzer and Bauer, 2021; Lundberg and Lee, 2017). When introducing SHAP, Lundberg and Lee (2017) let
Coaches often require insights that are not only accurate, but also easily digestible and actionable Forcher et al. (2024); Goes et al. (2021). Our system provides insight by converting complex numerical outputs into intuitive, text-based narratives that highlight key factors influencing xG values, such as shot distance, angle, and defensive pressure. This could allow coaches or players to quickly grasp why a shot has a high or low xG value, enabling more informed decision-making during training and matches. Our system is designed to generalise across competitions by training separate logistic regression models for each dataset using the same set of input features. This ensures that while the explanatory framework remains consistent, the model coefficients–and hence, the weighting of contextual factors–are tailored to the specific style and dynamics of each competition. The modular design also allows for domain-specific adaptation: practitioners can revise the feature set based on league-specific knowledge, and the resulting wordalisations will automatically reflect these changes. We see this as an opportunity for future work, particularly in supporting analysts working across different footballing environments.
The current system’s output has been evaluated using large language models (LLMs), which rated the descriptions based on engagement and alignment with feature contributions. While this provides a scalable proxy for quality of the texts, future work will involve designing structured evaluation studies. These will assess how textual explanations affect the perception and understanding of xG by users with varying levels of football and statistical expertise, evaluating both the practical impact of the narratives on decision-making, as well as the accuracy of the automated evaluation. A natural next step is to look at human evaluation by coaching staff. Do the coaches find these descriptions accurate? And, even more importantly, are they useful in coaching situations?
In summary, we have taken an approach which emphasizes model explainability, not just in a statistical sense, but also in the sense that our models explain the value of a shot in plain language. We believe that machine learning practitioners should endeavour to take this approach, which will further help analysts and coaching staff better utilize data without requiring deep expertise in machine learning.
Footnotes
Funding
The author(s) received no financial support for the research, authorship, and/or publication of this article.
Declaration of conflicting interests
The author(s) declared no potential conflicts of interest with respect to the research, authorship, and publication of this article.