
Abstract
This article presents evidence of a dramatic decrease in the importance of differences in team fielding quality in major league baseball. Over the course of the last three decades, the share of variance in runs allowed that is explained by fielding has steadily declined as the share accounted for by fielding-independent pitching has steadily risen. The paper uses a variety of non-digital and digital fielding metrics, including MLB's Statcast, to chart this trend. It also illustrates the practical effect of it on season-long outcomes and on the evaluation of individual player WAR.
Introduction
Baseball has changed. Once characterized by the skillful dance of pitchers and fielders seeking to interrupt the fine-tuned consistency of keen-eyed batsmen, major league games today feature a succession of violent showdowns between lab-grown strikeout assassins and swing-happy home run bombardiers (McCullough, 2024; Verducci, 2017) (Figure 1).
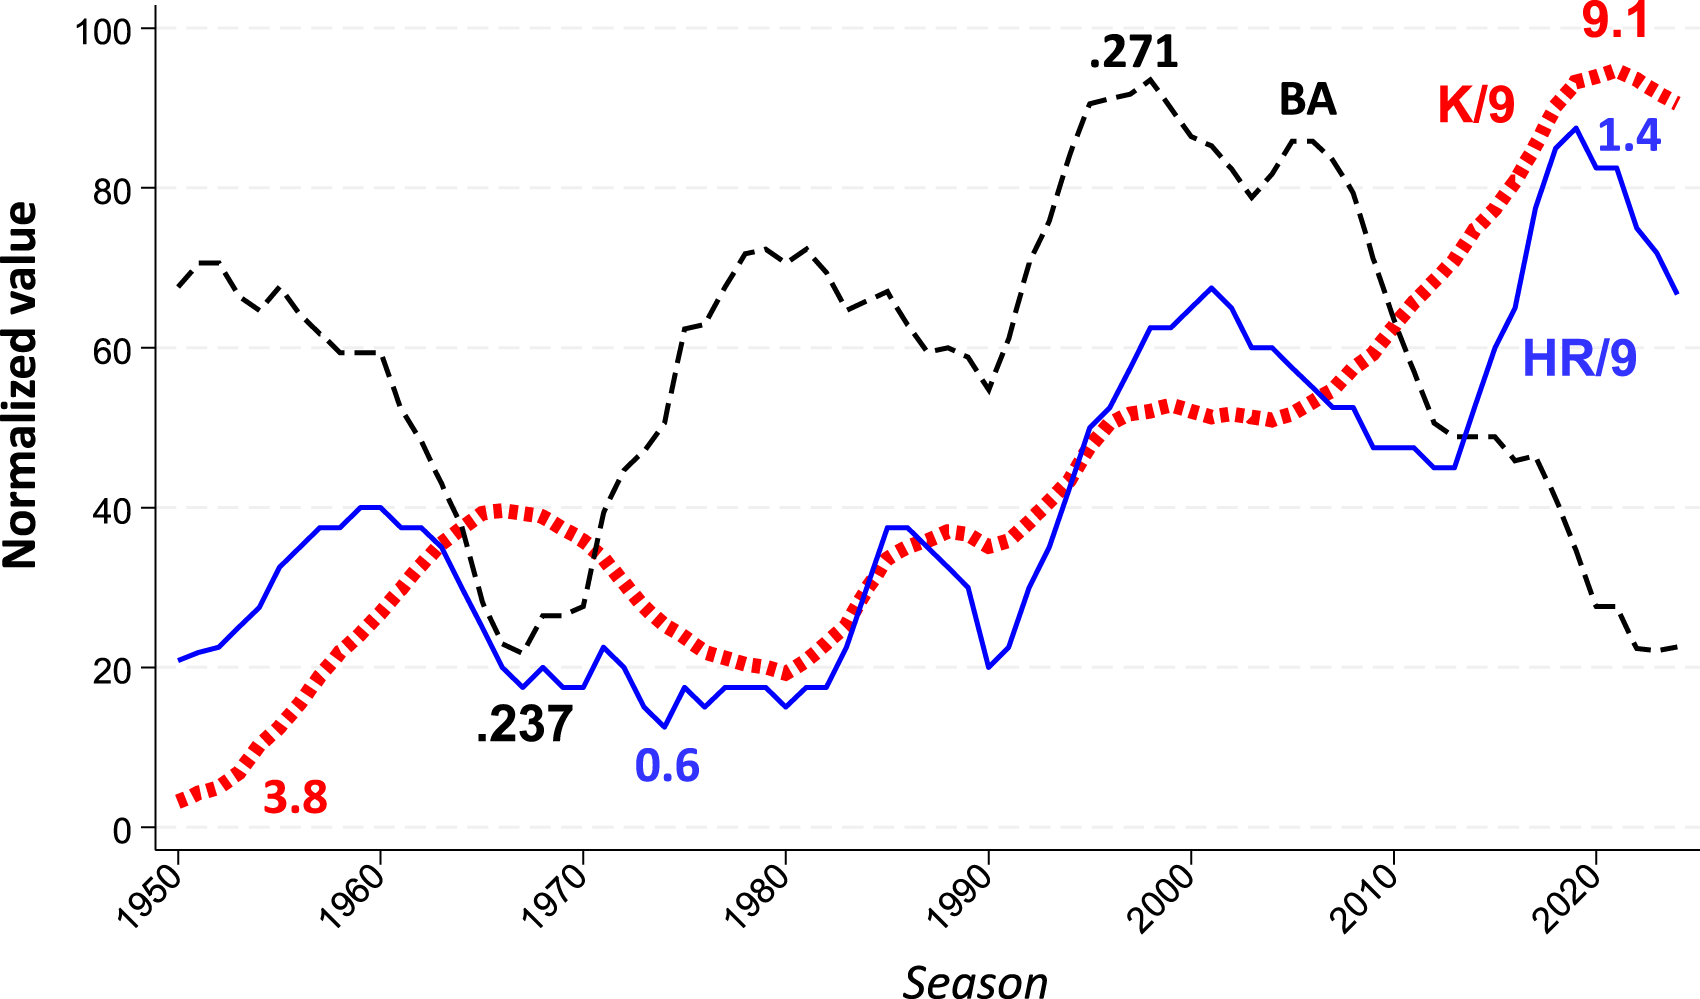
MLB trends in batting averages, strikeouts per 9 innings pitched, and team home runs per game. Values normalized on 0–100 scale with high and low points marked for reference. Trend lines reflect 5-year rolling averages. Data sources: Lahman database; Baseball Reference.
My principal goal in this article is to examine a consequence of this “Great Transformation,” one that flows naturally from it but that has nonetheless evaded systematic measurement: the diminishing consequence of disparities in the quality of team fielding. In a game in which home runs and strike outs matter more and more, we should expect differences in the proficiency of teams’ fielders to matter less and less. I will present evidence to substantiate this “fielding shrinkage” hypothesis and to quantify the practical significance of fielding's diminished role. 1
The paper also has a secondary aim: to empirically test pre-digital fielding-quality metrics. Indeed, the success of my primary goal presupposes the validity of these measures. The evolution of the game toward the dominance of strikeouts and home runs has occurred largely (but not entirely) since the advent of fielding analytics driven by video data of the location, speed, and trajectory of batted balls. Substantiating the shrinkage hypothesis, then, requires determining the relative impact of fielding and pitching in earlier periods of baseball history.
In the course of this analysis, I will also report some collateral findings. They relate principally to performances measures that currently figure in calculation of player WAR.
Methods
To conduct my examination, I assembled data on the impact of fielding and pitching across every season of the American and National Leagues since 1900. The basic strategy was to examine the incremental contribution of fielding to runs allowed at the team level after taking account of team pitching.
To assesses the latter, I used FIP or fielding-independent pitching (McCracken, 2001; Tango, 2004), Because it measures pitching quality independent of fielding, FIP is ideally suited as a foundation or control variable for assessing the incremental contribution of fielding to runs allowed. In addition, FIP features strikeouts and home runs given up, and can thus be used to gauge the impact of the two game outcomes one would expect to be most responsible for any decline in the impact of differences in team fielding proficiency.
For fielding metrics, I used two pre-digital measures and three digital ones. The pre-digital systems were the fielding-runs allowed components of Total Zone Rating (TZR) and Defensive Efficiency Record (DER). Developed by Sean Smith (2024) via his painstaking coding of Retrosheet data, both of these measures rely principally on the proportion of balls in play that a proximate fielder converts into outs. TZR is relatively more discriminating, excluding from its tallies outs that fielders can be expected to make more routinely. The TZR fielding-runs measure is used to compute player WAR by both Baseball Reference and FanGraphs before 2003. I used Baseball Reference's “rfield” measure as my source for TZR data.
I supplemented the analysis with DER, which is available from Smith's Baseballprojection.com site, for two reasons. First, as Smith (2024) has recounted, the TZR ratings for the decade of the 1990s were attenuated by his temporary substitution of data from “Project Scoresheet” for his own Retrosheet coding. Second, whereas TZR is not available for seasons after 2003, Smith continues to update DER. The latter's fielding-runs saved component can thus be used to establish directly how well pre-digital fielding measures correspond with the digital measures that cover seasons since then.
From the 2003 season onward, both Baseball Reference and FanGraphs use digitally derived fielding metrics to calculate player WAR. Baseball Reference uses Defensive Runs Saved (DRS). For the seasons of 2003 to 2015, FanGraphs employs an adjusted version of Ultimate Zone Rating (UZR) (Lichtman, 2017); for 2016 to 2024, it uses the runs-prevented element of Statcast's Outs Above Average scheme (OAA). Both DRS and UZR use data generated by Baseball Info Solutions, while Statcast uses data generated by Major League Baseball itself. DRS, UZR, and OAA all derive runs saved from models of the probability that a ball hit to a particular sector of the field will be turned into an out, although Statcast uses more fine-grained information on the speed and trajectory of the ball (Lichtman, 2017; Schoenfeld, 2016). For my analyses, I used the DRS data available from Baseball Info Solution's Fielding Bible website, the UZR data available on FanGraphs, and the Statcast runs-saved data available from MLB's Baseball Savant website.
All the reviewed measures are conceptually and functionally similar. They use diverse sources of evidence. But all translate rates of successful fielding of balls in play into estimates of runs saved. They are thus well suited for comparative analysis. 2
The basic analytical strategy involved regressing team runs allowed, first, on FIP alone, and then on FIP together with each of the five fielding measures, one at a time. This method makes it possible to identify the incremental contribution of each fielding measure to the percentage of variance explained (R2) in runs allowed.
These analyses use team-level versions of the fielding measures, formed by aggregating teams’ individual players’ runs-saved scores. The explained variance attributable to team-level fielding measures so calculated depends on the validity and accuracy of the individual-level scores summed to derive them. Accordingly, the incremental R2s of the models necessarily reflect the explanatory power of the relevant fielding measures at the individual level. Indeed, because actual fielding runs saved at the individual level are not observable, the power of aggregated individual scores to explain team-level variance in runs allowed is the only method available for empirically validating measures of individual fielding proficiency.
Results and analysis
The performance of pre-digital measures
As reflected in Figure 2, from 1900 to 1990, TZR consistently explained over 30% of the variance in team runs allowed after controlling for FIP. Together, FIP and TZR consistently explained 80% to 85% of the variance (consult the on-line Supplemental Information [“SI”] for more fine-grained details).
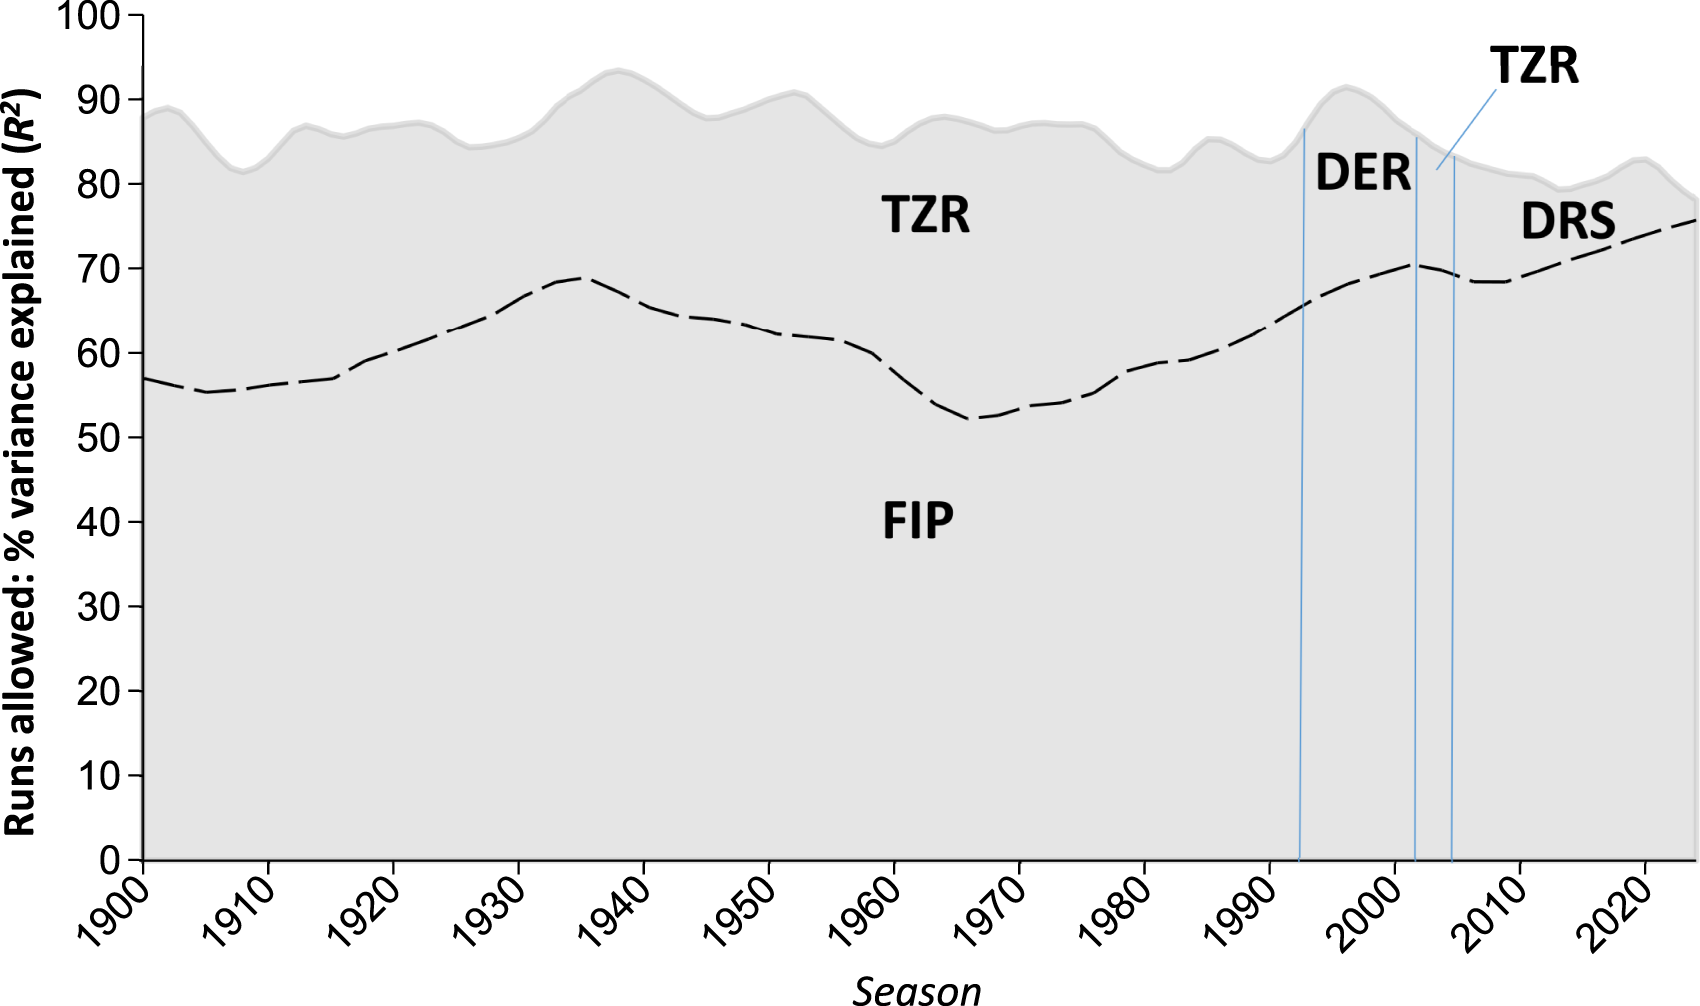
Relative contributions of pitching and fielding to variance in team runs allowed, 1900–2024. AL/NL only. Gray region reflects overall variance explained (R2) for single season models in which runs allowed are regressed on FIP and the indicated fielding measure; the area below the dashed line represents the contribution of the former, the area above the latter (SI Note 1). DER is substituted for TZR for 1990–1999 due to the latter's reliance on inferior data in that period (Smith, 2024). DRS is used for 2003 to 2024 as the digital metric with highest R2 (SI Table 2). Local polynomial smoothing applied to changes in yearly R2s for graphic purposes.
Derived straightforwardly from individual fielding performance records, there is nothing except differences in fielding skill that TZR could be understood to be adding to the power of the models to explain differences in runs allowed. The impressively high degree of variance explained in these models furnish compelling evidence of the validity and power of TZR as a measure of fielding proficiency in the twentieth century.
The ascendance of FIP, the decline of fielding
Although the trend begins as early as 1980, the expanding impact of FIP on differences in team runs allowed accelerates through the 1990s and has continued to grow every decade thereafter. From a value of around 50% to 55% of variance explained through the 1960s and 1970s, FIP balloons to 77% for the last decade (SI Table 1); Figure 2). Concurrently, the incremental contribution of fielding runs saved becomes progressively smaller. This trend strongly supports the principal “fielding shrinkage” hypothesis.
The trend supports the hypothesis—but not to the exclusion of another potential explanation. For differences in team fielding to explain variance in runs allowed, there must be meaningful variance in team fielding. It is at least possible that with advances in understanding and execution of fielding mechanics, teams have converged on a uniform level of defensive excellence that has effectively eliminated differences in team fielding as a source of differentiation in runs allowed. Puzzles would remain, principal among them why parallel advances and convergence have not reduced the impact of differences in team pitching, too. Nevertheless, this sort of team asymmetry in the distribution of fielding and pitching proficiency would also generate the sort of variance-explained hegemony for FIP reflected in Figure 2, and is thus well worth considering.
The way to test this “fielding-quality convergence” hypothesis is to consider variance in team fielding runs saved over time. Because they measure fielding runs saved above average, the various systems used to chart the impact of team fielding in Figure 2 are all designed to generate a mean of zero—and roughly do (M = 0.75 team runs saved per season over the course of the 125 seasons examined). The standard deviation for runs saved reflects the level of dispersion around the mean—or in other words, the level of variance in fielding proficiency across teams. If the “fielding-quality convergence” hypothesis is correct, then the standard deviation in team runs saved should begin to plummet at around the time that variance in runs allowed that FIP explains begins to soar.
That is not the case. As is clear from Figure 3, the standard deviation for fielding runs-saved has actually increased over that period. The level of variance in team fielding-runs saved has fluctuated over time. But beginning in the late 1980s, it began a steady ascent and is now higher than it has been at any point in AL/NL history aside from its high-water mark in the early 1970s. The standard deviation for FIP has fluctuated, too, but it actually declined between 2000–2010 before rebounding to a level near what it was in roughly the 1930s. In sum, differences in the extent of team fielding have not meaningfully changed in recent decades; they have simply become less consequential as their covariance with runs allowed has been swallowed up by differences in team pitching.
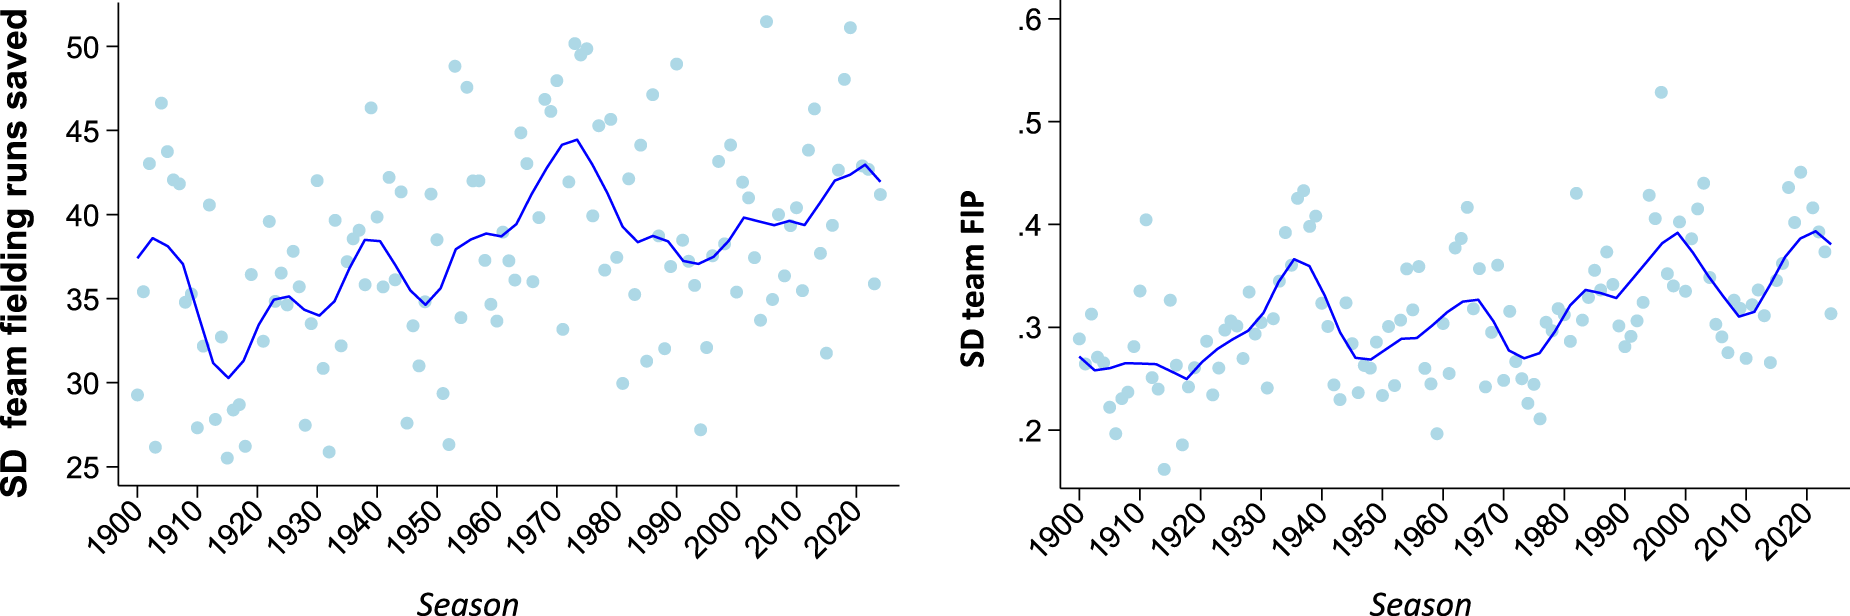
Standard deviations for team fielding and team FIP, 1900–2024. AL/NL only. Standard deviations for fielding runs saved correspond to measures used in Figure 2. Polynomial trend line applied for graphic purposes.
How much has the impact of differences in teams’ fielding skills contracted? The answer varies depending on what runs-saved measure one employs.
As indicated, digital fielding-proficiency measures are now used to determine player WARs. From 2015 to 2024, DRS accounted for 7% of the variance in runs allowed; UZR and Statcast (the latter from 2016) each accounted for about 4% (SI Table 1). Over the course of the 1960s and 1970s, fielding accounted for 30% of the difference in team runs allowed (SI Note 1). Accordingly, it could be estimated that differences in fielding have diminished over 75% since then as a contributor to differences in the number of runs that teams allow.
While still substantial, the impact is smaller if we assess the current effect of team fielding differences with Smith's DER measure. Over the last decade, DER explains 13% of the variance in team runs allowed (SI Table 1). Using this estimate, then, we might conclude that fielding differences have tailed off around 55% since FIP began to climb in significance.
DER's explanatory advantage over digital measures extends over the entire period in which the latter have been in use (Figure 4). Over the seasons from 2003 to 2024 combined, DER accounts for 17% of the variance in team runs allowed, as compared with 10% for DRS and 8% for UZR (SI Table 1). These results fortify confidence in the inferences that can be drawn about the relative importance of team-fielding differences over the period that spans the use of pre-digital and digital measures. Indeed, the power of DER to ferret out these effects suggests that it would be a mistake to discount pre-digital measures as a source of insight not only for the period before the advent of digital ones but for the seasons that have occurred thereafter as well.
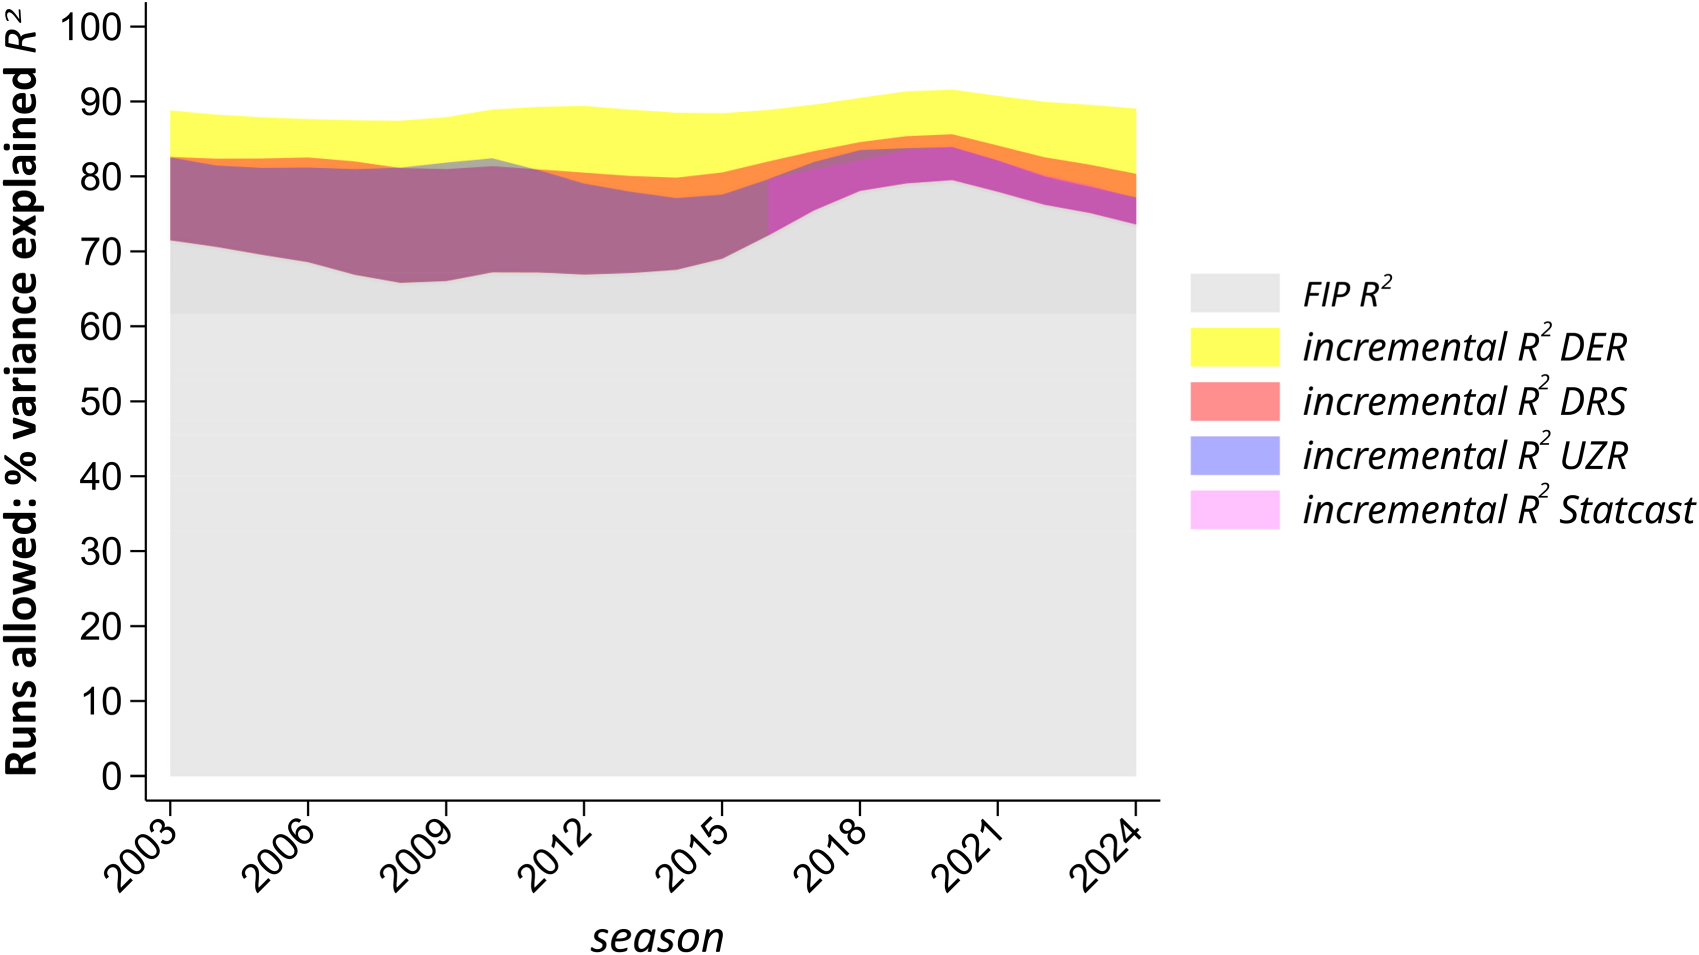
Relative incremental contributions of fielding measures to variance in runs allowed, 2003–2024. Gray region reflects overall variance explained (R2) for single season models in which Runs Allowed are regressed on FIP alone; the overlapping colored transparency regions reflect the incremental contributions when DER, UZR, DRS, and Statcast (post-2015) are added. Local polynomial smoothing applied to changes in yearly R2s for graphic purposes (SI Note 1).
Gauging the effect of fielding shrinkage
Universally attested to by all the examined measures, the phenomenon of fielding shrinkage does not mean that it is now irrelevant who occupies teams’ defensive positions. Obviously, if a team selected its fielders at random from a stadium of fans, it would be demolished. But so long as they confine themselves to players of reasonable defensive competence, teams whose fielders lag behind others in quality are unlikely to suffer much.
As a practical illustration of this point, we can use the analyses conducted here to re-examine the outcomes of various historical pennant races (Table 1). In 1948, for example, the Cleveland Indians and Boston Red Sox finished deadlocked with identical 96–58 records, resulting in a one-game playoff won by the Indians (Epplin, 2021). But had fielding borne the same significance that season that it did in 2024, it's likely no tiebreaker would have been necessary. Fielding shrinkage would have shaved 45 runs from the runs-saved advantage that shortstop Lou Boudreau (+20 TZR), second baseman Joe Gordon (+16), third baseman Ken Keltner (+12), and center fielder Larry Doby (+11) had secured the Indians in 1948. Based on the oft-confirmed finding that 10 runs scored or avoided over a season equate to approximately 1 win (e.g. Thorn et al., 2015), the Red Sox would have been expected to secure the pennant by 4½ games.
“What if” replays. “Then” and “now” pitching and fielding run advantages for pennant-winning team reflect regression-driven Monte Carlo simulations of the impact of teams’ respective FIP and “rfield” (TZR/DRS) scores. Simulations based on proximate four-season pooled data (SI Note 2).
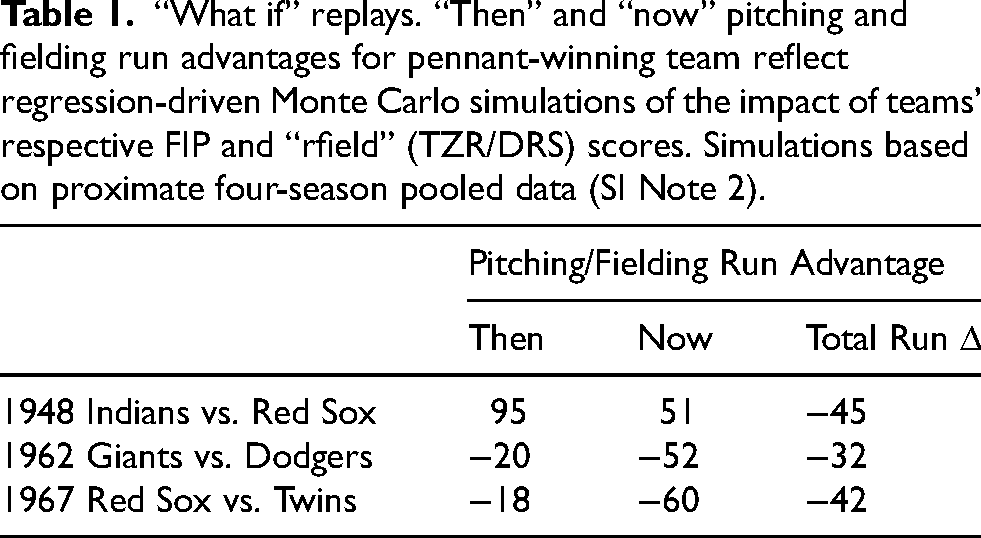
The 1962 Giants likewise won the pennant in a post-season playoff, defeating the Dodgers 3 games to 2 (Krell, 2021). The Giants would likely not have had the chance to advance, however, but for their superior defense. Led by Willie Mays's stellar performance in center field (+20 TZR), the Giants’ 49 fielding-runs-saved advantage would have largely neutralized the Dodgers formidable pitching advantage. Played in 2024, however, the Dodgers superior pitching would have swamped the Giant's glove men, tipping the runs-allowed balance in the Dodgers favor by 52 runs. The resulting net 32-run cushion should have been enough to eliminate the Giants from contention.
In 1967, three teams—the Red Sox, Twins, and Tigers—entered the last weekend of the season with realistic shots to win. When the dust settled, the Red Sox emerged victorious, a game ahead of both the Tigers and the Twins (Bright, 2018). Again, fielding was arguably decisive, at least as between Boston and Minnesota. Owing principally to the sure-handedness of left fielder Carl Yastrzemski (+23 TZR) and the reliable glove of shortstop Rico Petrocelli (+8), the Red Sox boasted an expected 67 runs-saved fielding advantage over the Twins, who had to endure the sloppy ball handling of third baseman Rich Rollins (−10), outfielder Bobby Allison (−8), and first baseman Harmon Killebrew (−5). The Twins, however, enjoyed the pitching edge: a 2.97 FIP versus the Red Sox's 3.50. The combined excellence of Jim Kaat (who recorded a league-best 2.55 FIP) and the solid work of Jim Perry (FIP 3.11) made the Twins staff harder to hit, notwithstanding Jim Lonborg's Cy Young campaign. In a 2024 replay, the Twins pitching advantage would far outpace the Sox's fielding lead—to the tune of a net gain of 42 additional runs saved, and thus an expected gain of approximately 4 wins (Table 1). The Twins would in all likelihood have returned to the World Series for the second time in three years.
These “what if” analyses are obviously confounded by differences in how these teams would have adjusted their rosters and lineups for a 2024 game environment. But that is exactly what an empirically enriched thought experiment of this sort tells us—how much teams should now discount the value of superior fielding relative to its impact in the middle of the last century.
Runs-saved calibration
A fielding “runs saved” measure is meant to convey what it says: a count of the runs averted by virtue of the quality of a fielder. My investigation, however, revealed that the actual runs prevented by a unit of fielding runs saved has tended to fall short of that, a trend that has grown over time. For example, whereas a unit of Baseball Reference's “rfield” was worth about 1 run in the 1960s (when based on TZR), it was worth only 0.55 on average in the decade ending in 2024 (Figure 5).
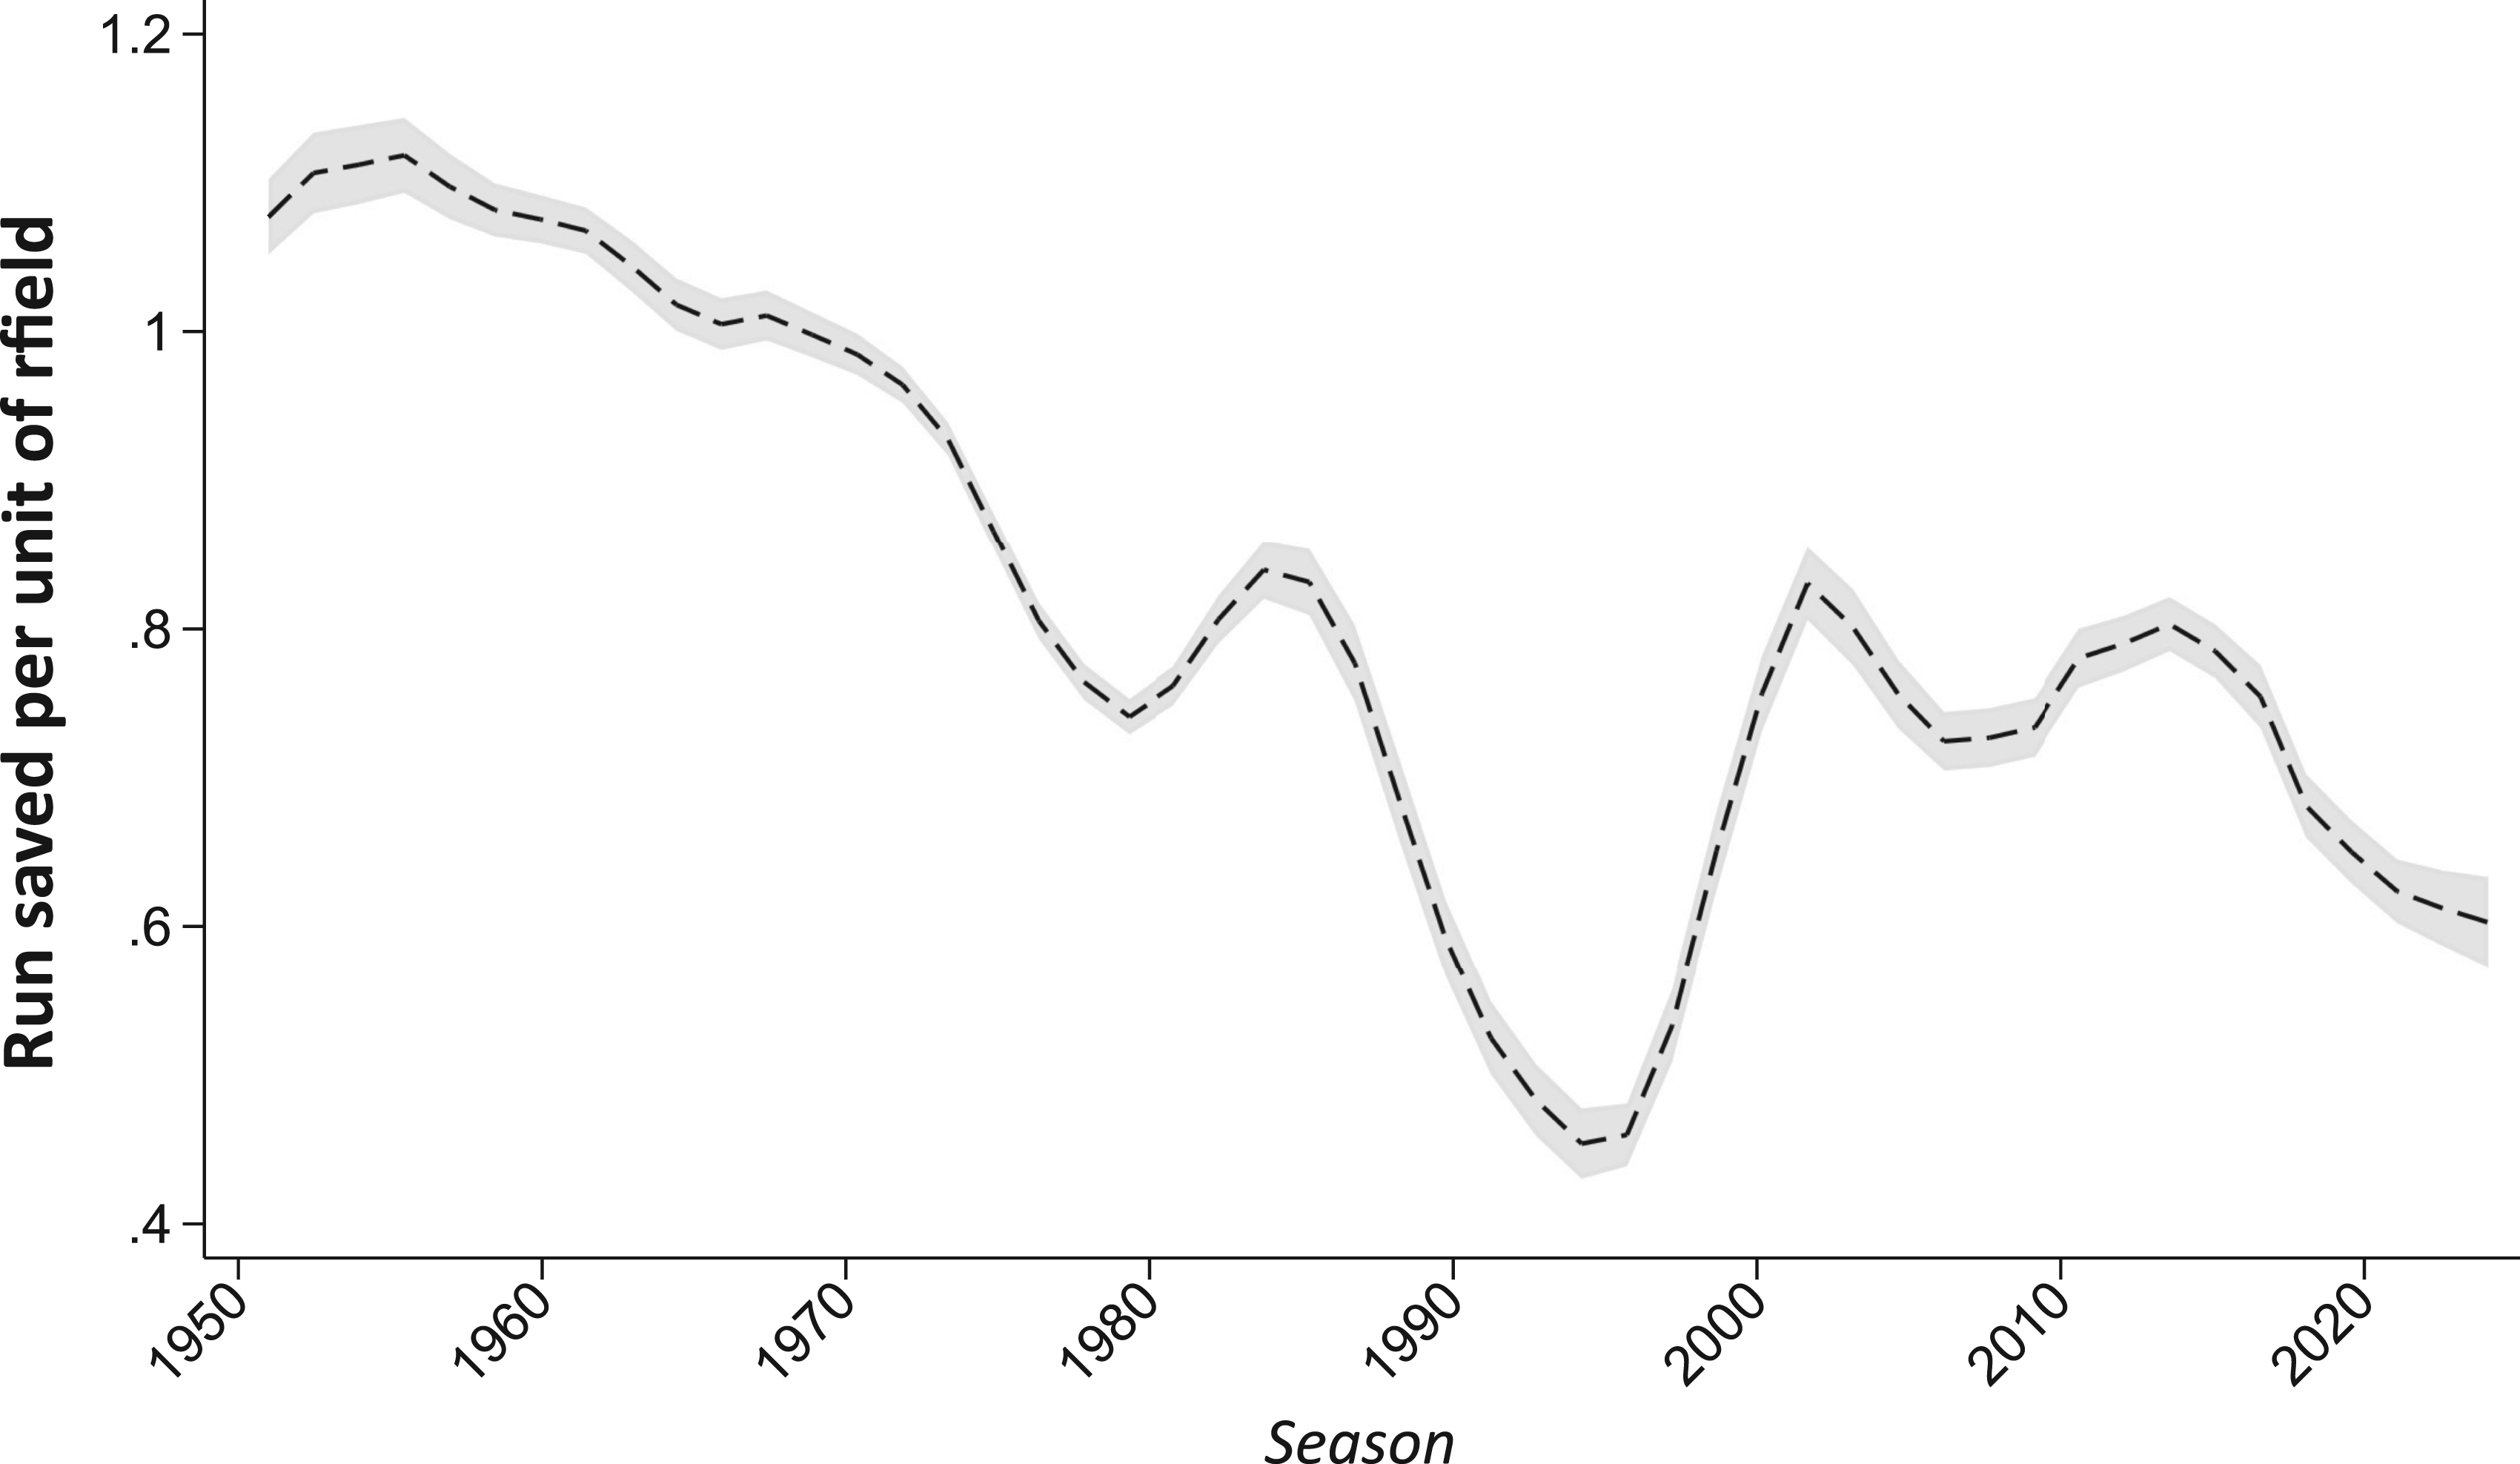
Calibration of baseball reference runs-saved measures. Plotted line reflect the correspondence between 1-unit of the rfield runs-saved measure and actual runs saved. Y-axis value are derived from single-season regression models of runs allowed on FIP and rfield (SI Note 1). Polynomial smoothing used for presentation. Note that the performance of rfield in the 1990s is not a consequence of miscalibration but rather the impact of the temporary use of inferior data in the calculation of TZR, as recounted by Smith (2024).
This dynamic—which I’ll call “runs-saved inflation”—is only an indirect consequence of fielding shrinkage. It is true that differences in team fielding matter less now than they did for most of the last century, before the contest between strikeouts and home runs came to dominate the game. But this development could easily be accounted for by appropriately crediting fielding skill with what it is actually worth when tallying team runs allowed. “Runs saved inflation” reflects the failure to recalibrate fielding-runs measures as differences in pithing quality have assumed a progressively larger role in determining differences in the number of runs that teams surrender.
Indeed, this calibration problem is less severe with other measures. Over the last decade, a unit difference in the DER runs-saved measure corresponded to an average of 0.79 runs. A unit of UZR was worth 0.89 on average over that period (Figure 6).
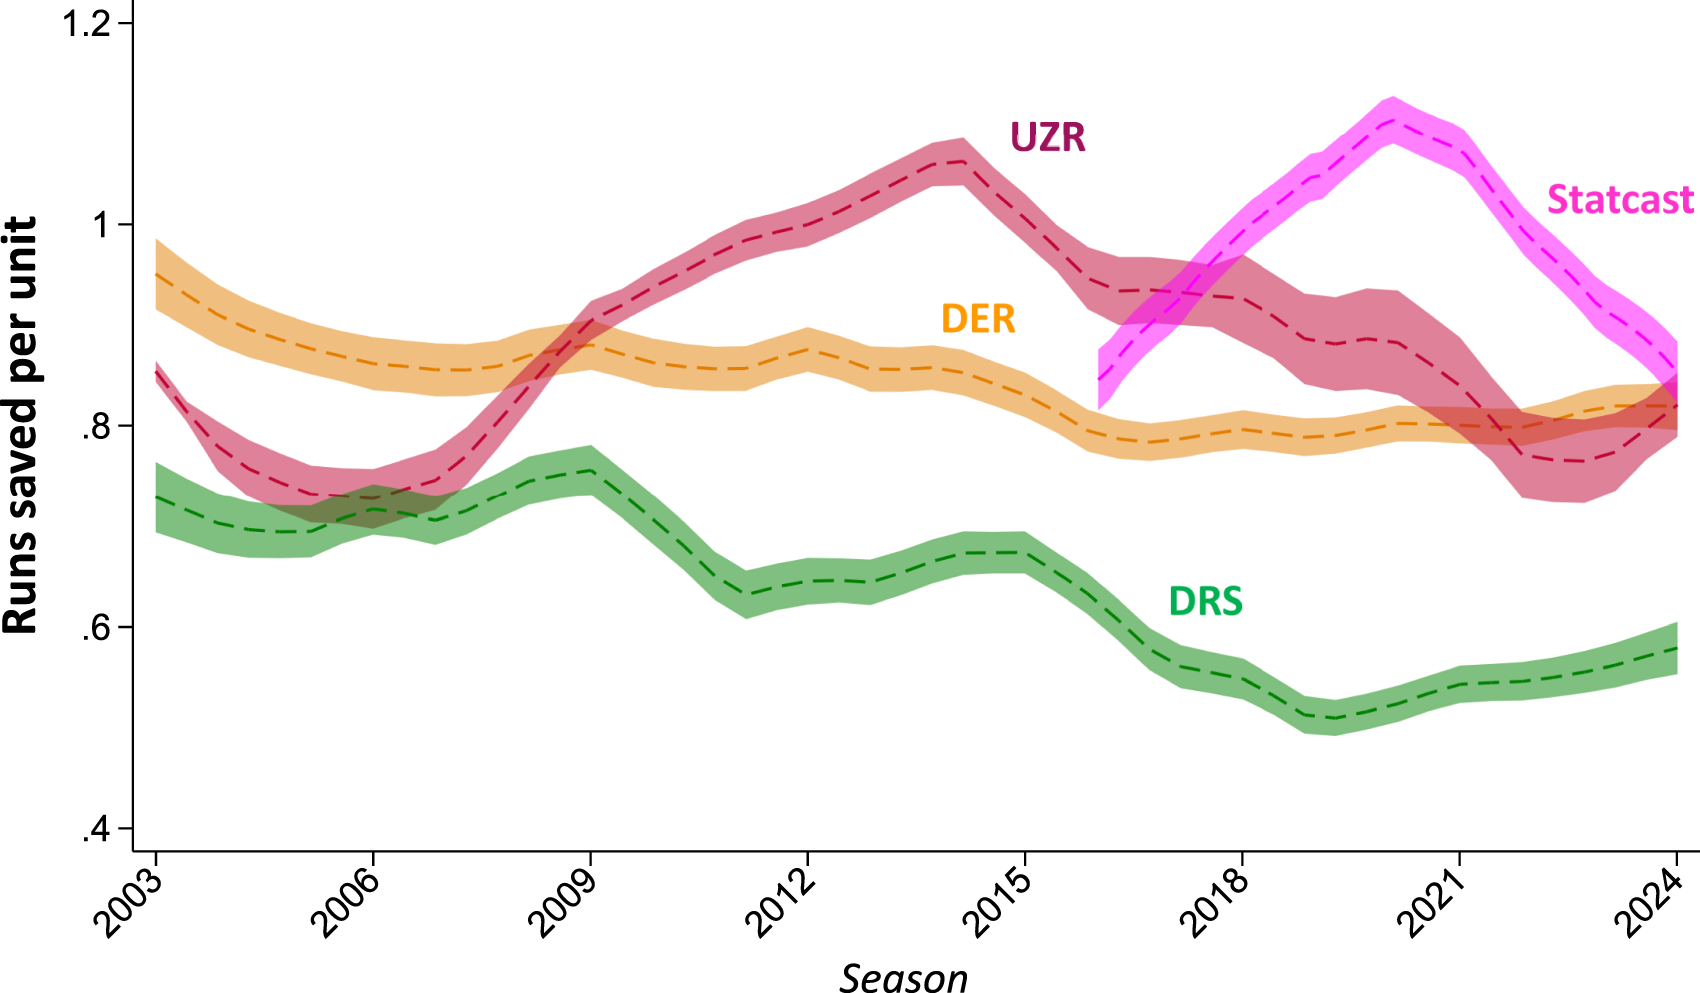
Calibration of UZR, DRS, DER, and Statcast runs-saved measures. Plotted lines reflect the correspondence between 1-unit of indicated the runs-saved measure and actual runs saved. Y-axis values are derived from single-season regression models of runs allowed on FIP and on each of the indicated runs-saved measure (SI Note 1). Polynomial smoothing used for presentation.
A one-run increment in Statcast's measure of fielding proficiency was worth 0.96 over the period from 2016 to 2024 considered as a whole. The trajectory of the measure, however, is characterized by a sharply inverted “V”: an initial overvaluation of runs saved, followed by a steep decline (Figure 6). That pattern extends “runs saved inflation” to “DEF,” the Statcast-based fielding-runs measure that FanGraphs uses to calculate player WAR: over the last two seasons, a unit of DEF is worth an average of 0.66 actual runs (SI Note 1).
Because “runs-saved inflation” bears only on the units in which fielding proficiency is measured and not on the validity of the systems being used to measure it, it does not pose any genuine barrier to empirical assessment of baseball performance. But to the extent that the runs-saved measures used to calculate player WAR are treated at face value, they risk overstating both the credit due good fielding, and the blame due bad, in determining teams’ fates. In particular, “runs saved inflation” tends to distort historical comparisons of fielding performance.
This point can be practically illustrated by considering the career fielding-runs-saved ranking of third basemen (Table 2). Brooks Robinson occupies the number one spot on Baseball Reference's runs-saved list; he not only played before “runs saved inflation” started to degrade runs-saved scores, but his rfield score is so far ahead of everyone else's that no amount of adjustment could possibly dislodge him from his place atop of the list. But three of the next four places are assigned to third basemen who played most or all of their careers in the current century: Adrian Beltré, Scott Rolen, and the still active Nolan Arenado. Because “runs saved inflation” was raging by that point, they are players whose contributions to avoiding runs is most likely overstated.
Adjusted runs saved. The “adjusted total” and “adjusted ranking” are based on removal of estimated impact of “runs saved inflation” (SI Note 1).
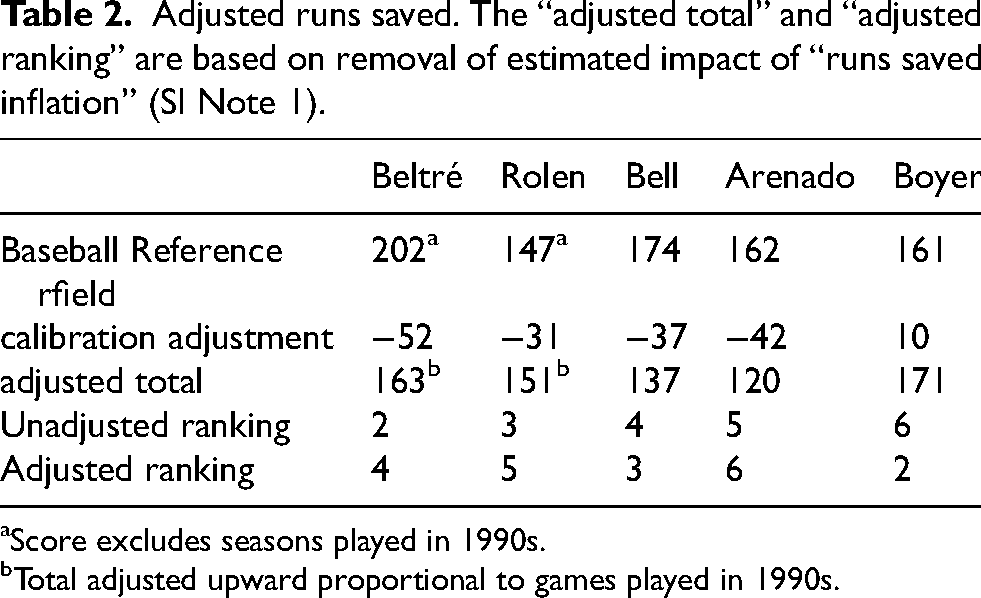
aScore excludes seasons played in 1990s.
bTotal adjusted upward proportional to games played in 1990s.
With an eye toward correcting this possible distortion, I re-examined the Baseball Reference rfield scores of these players as well as those of Buddy Bell and Clete Boyer, players whose rfield rankings—fourth and sixth, respectively—are the most likely to have been adversely affected by “runs saved inflation.” My principal adjustment was to replace the post-2000 rfield scores for Beltré, Rolen, and Arenado with the actual runs-saved associated with their scores, as determined by regression analyses for the relevant seasons. Because, as discussed, the TZR scores used to compute rfield scores for the 1990s are not reliable (Smith, 2024), I excluded those seasons from the analysis and adjusted upward Beltré and Scott Rolen runs-saved totals by an amount that reflects the (small) proportion of career games they played, respectively, before the 2000 season (SI Note 1)
The results are reported in Table 2. As can be seen, Clete Boyer is elevated to number two on the all-time fielding-runs saved list. Boyer leapfrogs Beltré, Rolen, and Arenado. He also edges ahead of Bell, both as a result of a modest undervaluation of fielding impact by TZR for part of the 1960s and a modest degree of overvaluation during parts of Bell's career. Nevertheless, Bell also overtakes Rolen, securing third on the revised all-time runs-saved list.
For these analyses, I used the TZR and DRS runs-saved measures that informed Baseball Reference's rfield measure. But as a check, I compared these results to ones derived from the DER measure. In addition to explaining more variance than DRS for the period after 2002, DER's run-saved measure displays a more faithful relationship to actual runs-saved: over the last decade, a unit difference in the DER runs-saved measure consistently corresponds to an average of 0.79 runs (Figure 6). In accord with my adjusted analysis, Basebeallprojection.com's DER-based system ranks Boyer second in third-base fielding runs saved (166), ahead of Beltré, Rolen, Arenado, and Buddy Bell.
A likely consequence of the inattention of those who compute runs-saved metrics to the reduced value of fielding in contemporary baseball, runs-saved inflation does not seem to have evaded the attention of those who operate major league teams. One relatively recent analysis concluded that when position players (excluding catchers) sign new contracts, FanGraphs-estimated fielding runs saved are worth about 40% of what players net for estimated runs generated by their hitting (Arthur, 2017). The analyses presented here suggest that the front office executives—who now compete just as hard in the field of analytics as athletes do on the diamond—are more accurately appraising fielding's worth in the modern baseball environment.
Conclusion
Baseball has always been and remains a beautiful game. But at least one dimension of its beauty no longer has the significance that it once had. For most of the twentieth century, superb fielding—such as that displayed by Orioles of late 1960s and early 1970s—was appropriately recognized as a key element of team success over the course of a 154- or 162-game campaign. Exquisite glove work might still garner admiration. But the truth of the matter is, it just doesn’t matter nearly so much in today's game environment, in which strike outs and home runs have assumed a preeminent place. Fielding accolades are effectively now awarded on basis of style points that satisfy esthetic sensibilities that are growing progressively more remote from game outcomes.
This development might be considered unfortunate, but it is almost certainly too late in the day to change it. What can be improved upon, however, are the quality and the calibration of measures of fielding, the imprecision of which have partially obscured this element of the great transformation that has characterized major league play in the twenty-first century.
There is also room for improvement of digital fielding measures generally. The point of this paper was not to determine which fielding measure is “best,” but only to assess how the escalating significance of strikeout-pitching versus home-run hitting has affected the consequence of differences in team fielding quality. But in testing the power of pre-digital measures to support such assessments, it was revealed that measures like TZR and DER remain more reliably attuned to the impact of fielding play today than do the formulas that drive digital fielding metrics. There is nothing necessary about that. On the contrary, with additional empirical fine-tuning of the models used to process the fine-grained evidence generated by digital technologies, the latter seem destined to emerge as superior (Lichtman, 2017). The analysis here, I hope, will contribute to the project to refine these metrics.
Supplemental Material
sj-docx-1-san-10.1177_22150218251349133 - Supplemental material for Fielding before and after baseball's great transformation
Supplemental material, sj-docx-1-san-10.1177_22150218251349133 for Fielding before and after baseball's great transformation by Dan M Kahan in Journal of Sports Analytics
Footnotes
Acknowledgement
I wish to thank Charles Pavitt for incisive comments on an earlier draft.
Ethical approval/informed consent
The reported study did not involve human subjects research.
Funding
The author received no financial support for the research, authorship, and/or publication of this article.
Declaration of conflicting interests
The author declared no potential conflicts of interest with respect to the research, authorship, and/or publication of this article.
Data availability statement
Notes
References
Supplementary Material
Please find the following supplemental material available below.
For Open Access articles published under a Creative Commons License, all supplemental material carries the same license as the article it is associated with.
For non-Open Access articles published, all supplemental material carries a non-exclusive license, and permission requests for re-use of supplemental material or any part of supplemental material shall be sent directly to the copyright owner as specified in the copyright notice associated with the article.