
Abstract
Performance analysts routinely perform game plan evaluations of their in possession play, breaking it down into phases: 1st Phase, 2nd Phase, Final Phase and Transition Defence to Attack. To evaluate a team's performance in relation to their game plan, this study showcases a framework to allow the measurement of tactical strategies in different phases of the game. This framework augments possession sequence data, a series of on-ball events until a stoppage or turnover, with notational analysis data (phases of play and phase outcomes) to evaluate team style and performance across 82 international football matches from 2018 to 2022. From this enhanced possession framework, we assessed the impact of specific events, i.e., progressive passes on phase outcomes, by conducting a series of mixed effects multivariable logistic regression models. Progressive passing showed increased odds of positive phase outcomes when attempting to enter the Final Phase including successful phase progressions (aOR 2.57 [2.19–3.02]), dangerous possession (aOR 1.79 [1.56–2.04]), shot (aOR 1.70 [1.44–2.01]), critical chance (aOR 1.91 [1.27–2.86]), and goal (aOR 2.05 [1.34–3.12]). This framework has allowed the development of novel metrics and visualisations, such as how teams create dangerous possessions, which aids the post-match review process.
Introduction
Data analysis is essential in football as the coach's subjective evaluation of the game plan is prone to some form of bias (Gauriot and Page, 2018). Therefore, performance analysts systematically collect relevant data via video (Wright et al., 2012) to support the coaching process. On top of in-house data collection, a wealth of information is collected in the elite setting on each possession sequence from multiple event and tracking data providers (Rein and Memmert, 2016). This has led to the growing need for data science support to process and analyse this data. For these methods to provide insights, they must have an output that is interpretable by the end users (coaches and performance analysts) so that it limits the disconnect seen between research and application (Carling et al., 2014; Mackenzie and Cushion, 2013; Sarmento et al., 2014). Focusing on the enhancement and integration of notational analysis data, such as phases of play collected by performance analysts (Bauer et al., 2023), combined with data from 3rd party data providers, could lead to more interpretable outputs for end users and be an ideal next step towards enhancing workflows.
Football is a low scoring sport, and therefore 1 goal has a much more significant impact on evaluating the efficacy of possession strategies due to the noise caused by the outcome of one shot. This has led to statistics such as shots and xG being used more widely in match analysis as process-based outcome measures (Anzer and Bauer, 2021). This change is justified by research showing pre-match win probability exhibiting lower levels of correlation for goals (r = .55) and ball possession (r = .71) compared to a measure of dangerous situations a team creates (r = .82) in the game (Link et al., 2016). As a result, we limit our understanding of effective playing styles if the sole focus remains on studying possessions leading to goals. Therefore, utilising a measure of dangerous possessions created will help us identify the efficacy of various possession strategies. While successful teams are more likely to have employed a possession-based style over a direct playing style, Kempe et al. (2014) noted that the two most successful teams in their study employed contrasting styles. It shows the challenge of dissociating the playing methods used by top-tier teams from the overall efficacy of the selected method. In addition, conflicting results are observed in passing sequence data, whereby some studies support the efficacy of sequences with ≥4 passes (Lago-Ballesteros and Lago-Peñas, 2010; Lago-Ballesteros et al., 2012), whilst other research supports the benefits of shorter passing sequences (Sarmento et al., 2018; Wright et al., 2011). This degree of variance in results is attributable to the variability of the outcome measure and the confounding effects at play within these studies. This affirms the need for a more frequent outcome measure and a multivariable approach to assessing possessions that captures its complexity and accounts for confounding.
Lucey et al. (2012) examined play segments using Opta data, describing spatio-temporal characteristics of ball movement over fixed time windows. They focused on how teams moved the ball across regions of the pitch within these fixed windows of time (with maximum entropy occurring at a 4–5 s window) and resulted in the creation of entropy maps to see how predictable team behaviour is by location. While they were able to assess how teams employed a more direct versus possession-based style, they could not further discriminate strategies of similar teams beyond locations used to progress the ball. They commented that the absence of strategy or contextual labels was the biggest hurdle to overcome in discriminating teams’ strategies in match analysis. Kim et al. (2019) referred to this as an analysis of the “developmental process” involved prior to chances to score. They described this as a systematic breakdown of how teams develop possessions, focusing on the “how”, for example, how teams initiate and progress during build-up. Therefore, research should move towards identifying innovative outcome measures which focus on “developmental processes”, such as phase outcomes, rather than outcome measures, such as goals and scoring opportunities, or even metrics derived from this such as expected goals (xG) (Lucey et al., 2015), dangerosity (Link et al., 2016) and expected possession value (EPV) (Fernández et al., 2021). Outcome measures can then be designed in alignment with game plan strategies for distinct phases of the game. Using these enhanced outcome measures will help detect recurrent patterns and more accurate signals regarding the efficacy of different in possession methods under various conditions, i.e., against an opposition press.
For example, progression rates from phase to phase would be an ideal outcome measure. Whilst the goal of any possession is to create high-quality chances and score, their primary focus is to progress to the next phase, making progression rates a key outcome measure. Furthermore, teams vary in their approach based on their playing style, where they balance the risks and rewards depending on the situation (i.e., game state or player characteristics). Fernández-Navarro et al. (2019) used a ball movement points score to value both successful and unsuccessful events based on the likelihood of scoring from that area of the pitch or the negative value of losing the ball based on the opposition team value creating a turnover in that location. Therefore, it is crucial to measure secondary outcomes alongside the progression rate, where we can further evaluate the risks and rewards of strategies. For risk, we would have a measure for the rate of turnover and the subsequent threat of those situations. For reward, we would want to measure the subsequent likelihood of progressing a further phase and a measure of dangerous situations, which Link et al. (2016) suggest is a better measure of team performance than traditional match statistics such as possession. Taking a balanced view in assessing the efficacy of possession sequences and understanding how game state and other contextual features affect these outcomes (Fernández-Navarro et al., 2019) will help coaches evaluate the effectiveness of their game plans in distinct phases of play.
Therefore, this study will (1) provide a methodology to evaluate team tactical strategies in elite international football. To implement this evaluation, we first (a) need to detect the phases and states within a possession for which a coach employs specific strategies for. This research will then provide a methodology to create a possession framework by (b) integrating individual player event data and notational analysis of team behaviours and phases in an augmented approach. At this point, (2) we will seek to understand the efficacy of key event types (progressive passes and carries) in these possession sequences using methodology defined in previous research (Deb et al., 2023). We hypothesise progressive actions have an increased occurrence in possessions leading to the next phase and will subsequently create more dangerous possessions and critical chances in the possession following progression to the next phase. Finally, we will explore applications of this data (3) to allow us in the future to create performance indicators within these augmented possession sequences (Hughes and Bartlett, 2002) to assess both the style and performance of a team in relation to different tactical contexts. To create performance indicators, we will measure the effectiveness of various methods by measuring the balance between positive and negative outcomes (Fernández-Navarro et al., 2019).
Methods
Data
Data was extracted from (n = 82) senior men's international football matches involving a Top 8 FIFA-ranked team (competitive and friendly internationals between 2018 and 2022, including qualification and finals from the European Championship, World Cup and UEFA Nations League). Event data was used from OPTA, which has shown good levels of inter-operator reliability with high levels of agreement in identifying primary events (with kappa values between 0.92 and 0.94 (Liu et al., 2013)). All notational analysis data was collected using HUDL Sportscode Elite v11 (HUDL, Lincoln, Nebraska, USA) by experienced performance analysts (ranging from 5 to 8 years of experience at the elite level) using standardised collection procedures. Operational definitions were devised, with accompanying training to enhance the reliability and validity of data collection.
Notational analysis data
Possessions can consist of one or multiple phases, which is a description which denotes the area of the pitch the game is currently played in, considering the location of players for both the in and out of possession teams. When a team is in possession, these phases are 1st Phase, 2nd Phase and Final Phase, whilst the related term for the out of possession team would be High Block, Mid Block and Low Block, respectively. We denote these phases not only by the ball location on the pitch in Figure 1, but also in context of the opposition shape. Within these phases, we further describe them with a possession state, which relates to information regarding both the teams in and out of possession shape. These possession states include the out of possession team either in a pressing or defending state in 1st/2nd Phase or High/Mid Block. In the Final Phase/Low Block, the possession states applied are either the out of possession team in a defending state or the in possession team in Dangerous Possession. Examples of these phases and states (sub-moments) are shown in Figure 1.
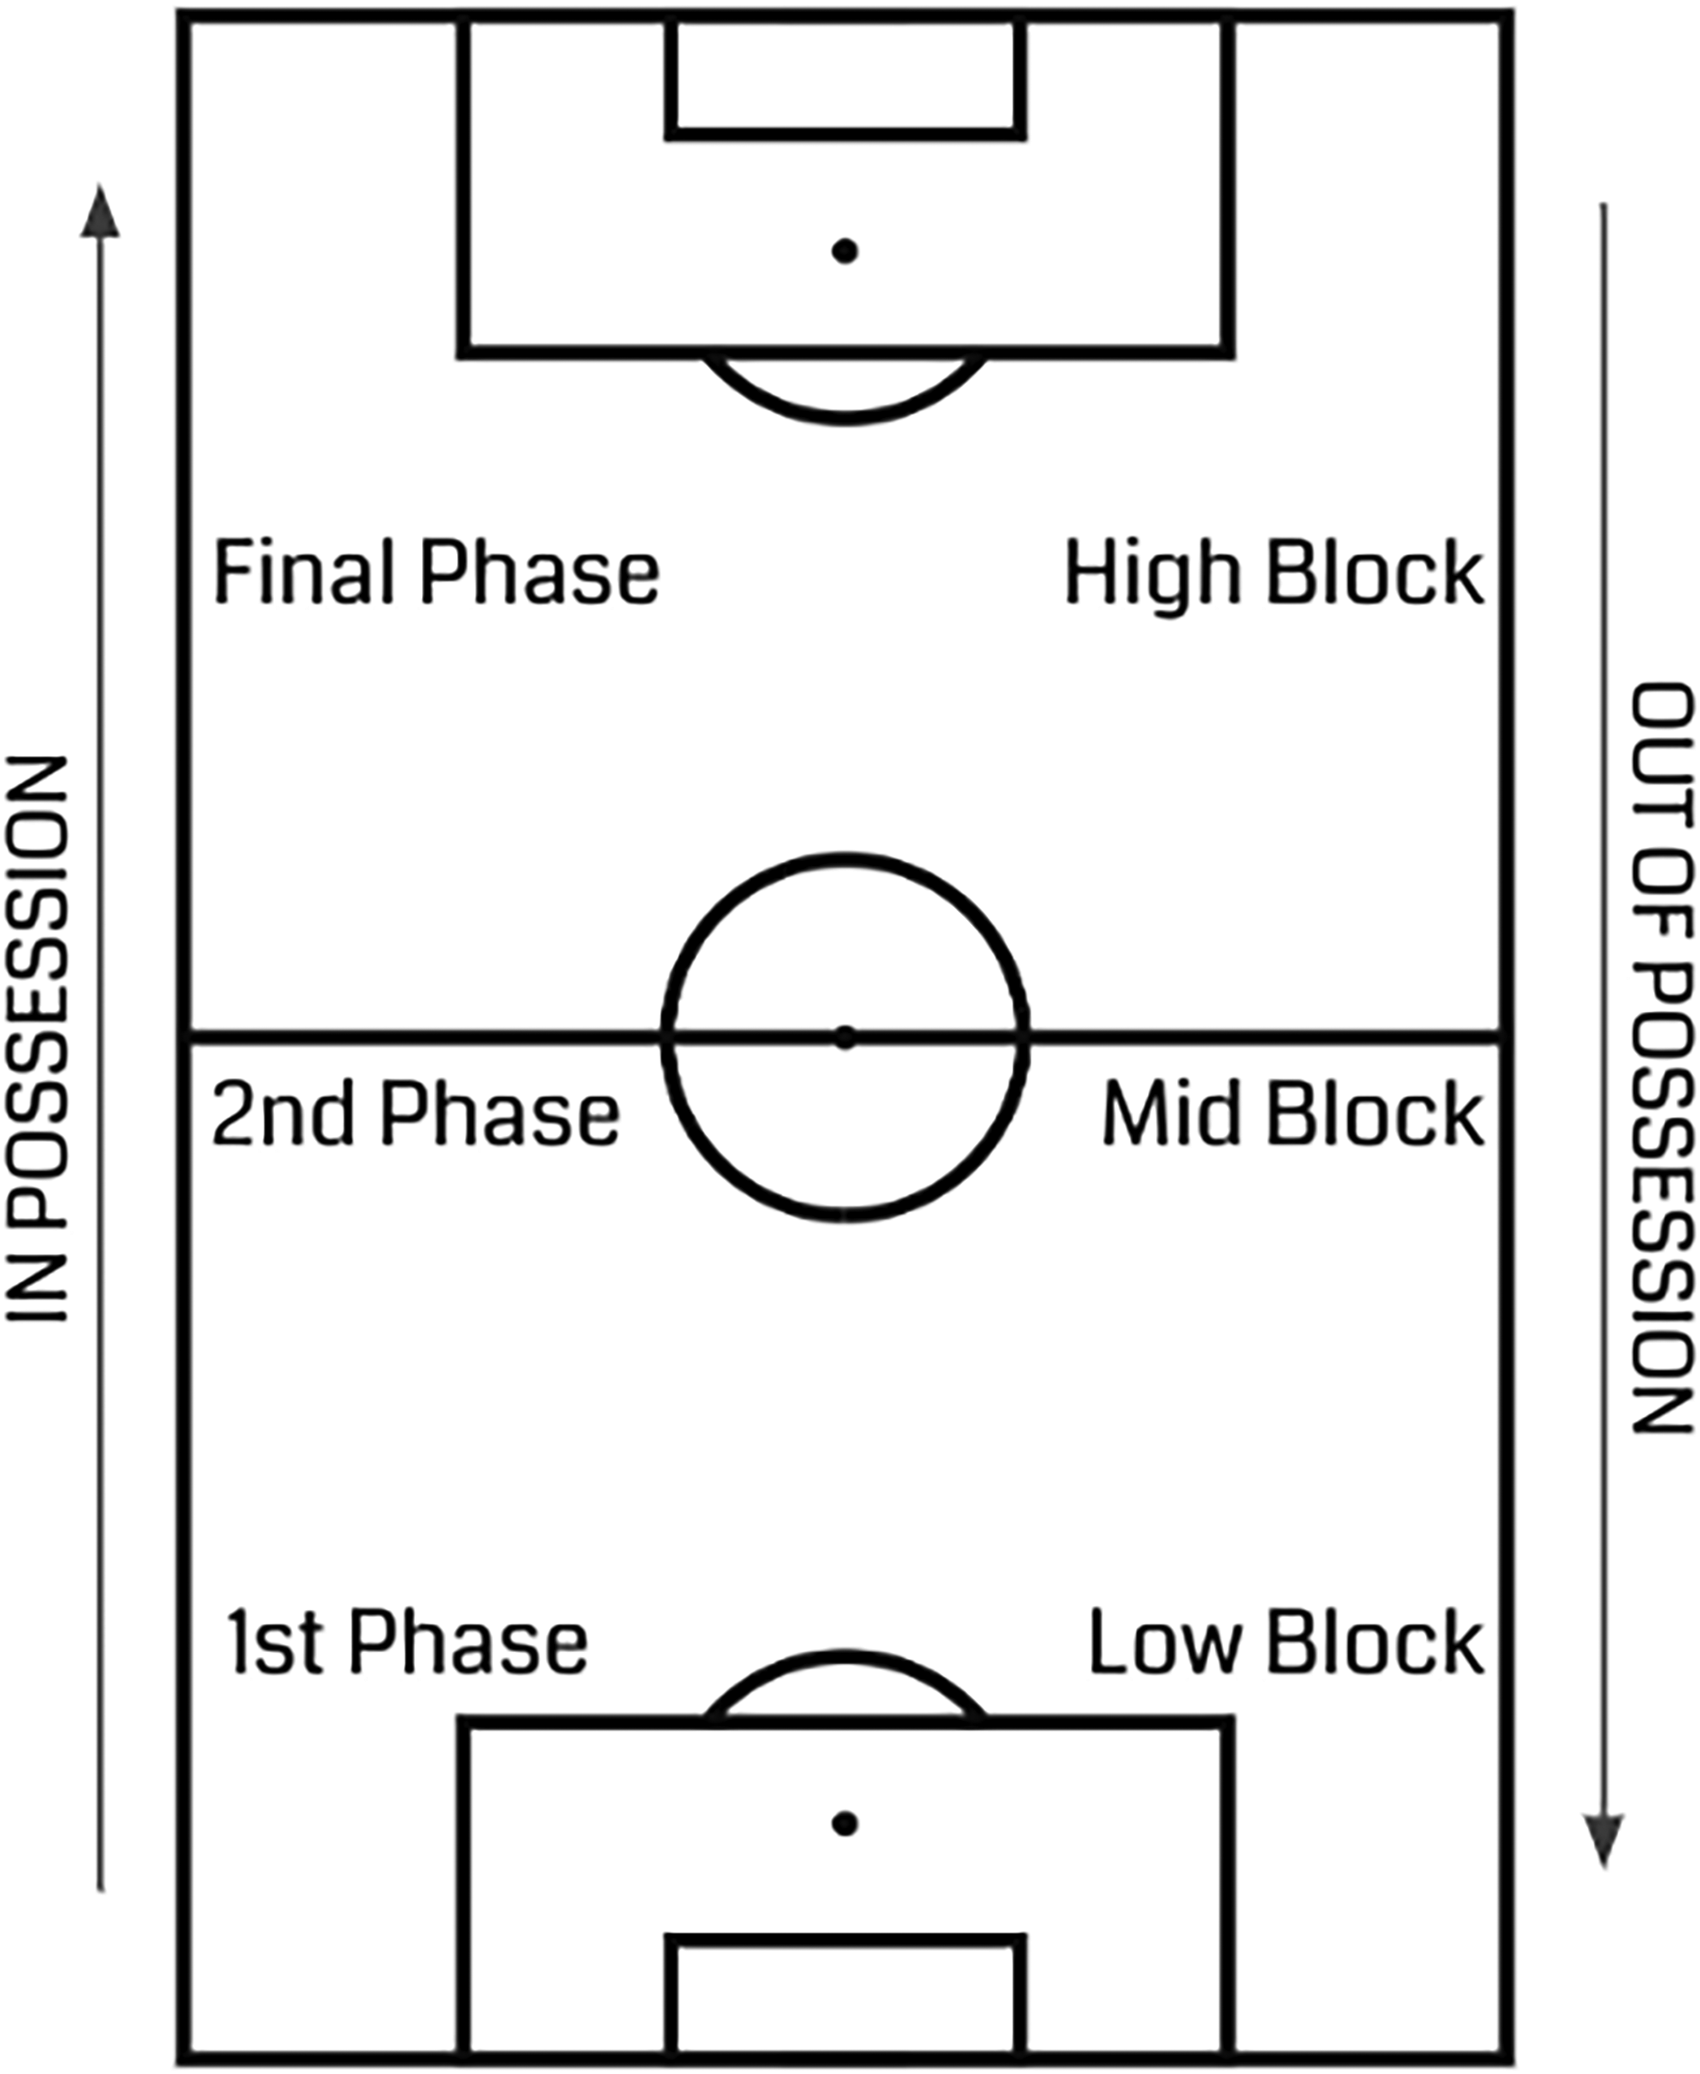
Describes the phases of the game for both in possession and out of possession by general location. Arrows indicate direction of play.
Reliability
The reliability assessments involved the performance analysts collecting data for using the same game footage. We calculated kappa values using R (version 4.05) to show the inter-rater reliability to detect Dangerous Possessions and distinguish them with three methods (Open Play, Counter Attack and Set Play) in the Final Phase. Across the three primary coders used within this study, it returned a kappa value of 0.82, which indicates a very good agreement beyond chance. We also performed the same analysis to assess the reliability of the analysts to detect the correct phase (1st Phase 2nd Phase, Final Phase, High Block, Mid Block and Low Block) and whether a successful or unsuccessful phase progression attempt occurred in the phase. This showed moderate to good agreement between analysts to assess phases and phase progressions, with kappa values of 0.73. Individual feedback was then provided to each performance analyst to align decision-making processes and improve operational definitions in the future. This was monitored by adding automated criteria for each instance and labels that were satisfied before data upload. These computerised checks would consist of checking for combinations of labels that should and should not occur together, further improving the quality of the collected data.
Event data
Traditional (OPTA) event data consists of on-ball events such as passes and shots, their locations, and descriptive qualifiers of the event, such as whether it originated from a set play or was a headed pass. Each on-the-ball event also has a possession and sequence number assigned. A sequence is a series of uninterrupted on-the-ball events by one team, ending when the opposition team makes a touch, but control of the ball may remain the same. Possession is defined as one or more sequences together for the same team, which is ended by the opposition gaining control of the ball. Extra pre-processing of the data was performed to determine ball carries (starting from where the player received the ball and ending at the location of the player's subsequent event), resulting in a more accurate ball path sequence (Lucey et al., 2012). Also, the possession framework provided by OPTA was adapted, so a new possession started after every dead ball situation (e.g., corner, free kick, goal kick, throw in, drop ball and restart), even if the same team retained possession of the ball, enabling these possessions to be analysed distinctly.
We utilise the operational definitions and methodology for identifying progressive passes outlined by Deb et al. (2023). We implement the same method to define progressive carries, determining that carries where a player takes the ball 10% distance closer to the goal or greater is a progressive carry.
Information relating to team possession phases and states was merged with these adapted possession sequences (passes, ball carries, shots) by determining overlapping time points with the event data and which team was in possession from both datasets. There was some information loss at this step of the process due to discrepancies between the data collection timestamps and definitions. However, this was limited to 5.6% of pass or carry event data not having the phase and state attributed.
Augmented event data
To combine event (OPTA) and notational analysis (HUDL), we ascertained the pass or carry (event) leading to an attempt to progress the possession to the next phase, i.e., a 1st Phase possession is progressed to the 2nd Phase (termed To 2nd Phase sequences) or when 1st/2nd Phase possessions are progressed to the Final Phase (termed To Final Phase). In addition to the event which attempts to progress to the next phase, we also take the two events proceeding this event to create the 3-event sequences. The possession state was also recorded, i.e., whether the opposition was pressing the in possession team in that phase. We then measure outcomes to see whether the 3-event sequence was successful, led to turnover, or was retained. In addition, we record the subsequent outcomes in the possession following the progression into the next phase, measuring whether a dangerous possession, a critical chance and a shot (including the xG value) were created and whether a goal was scored in the possession.
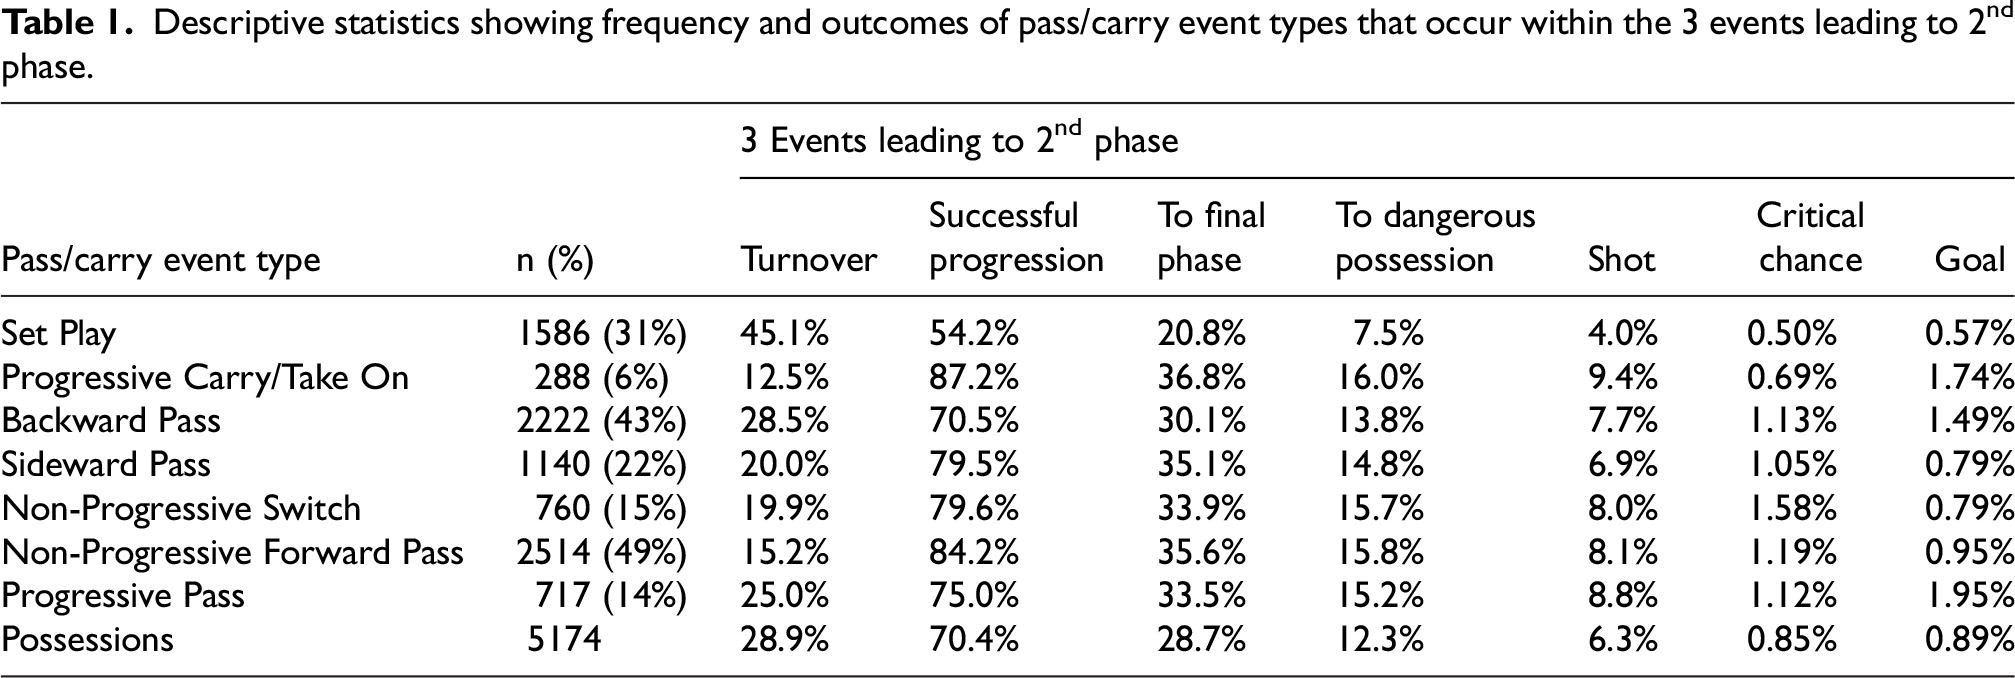
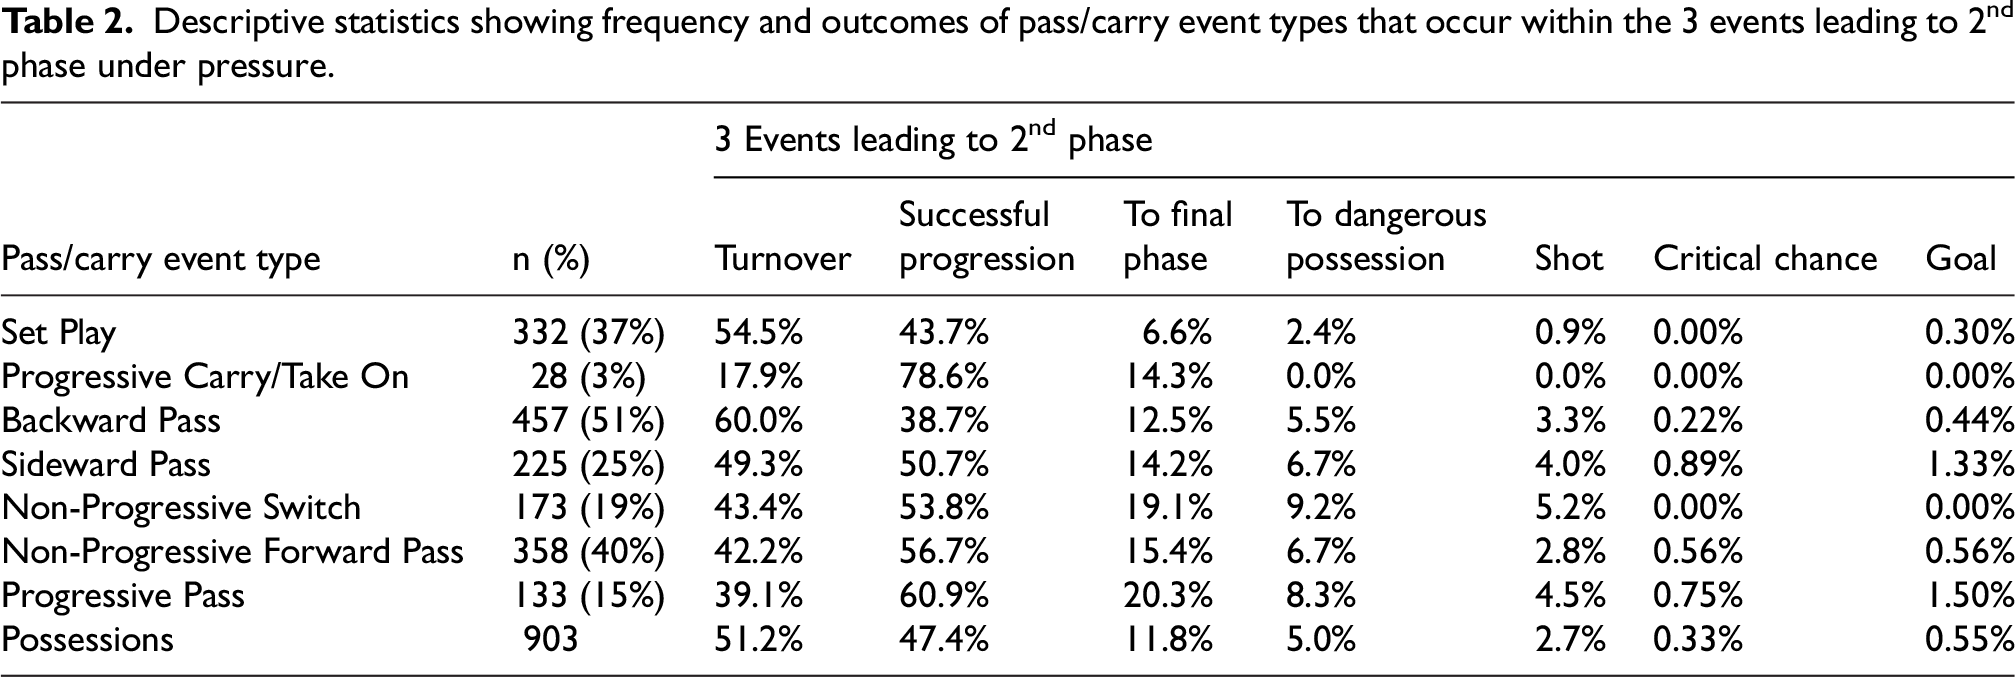
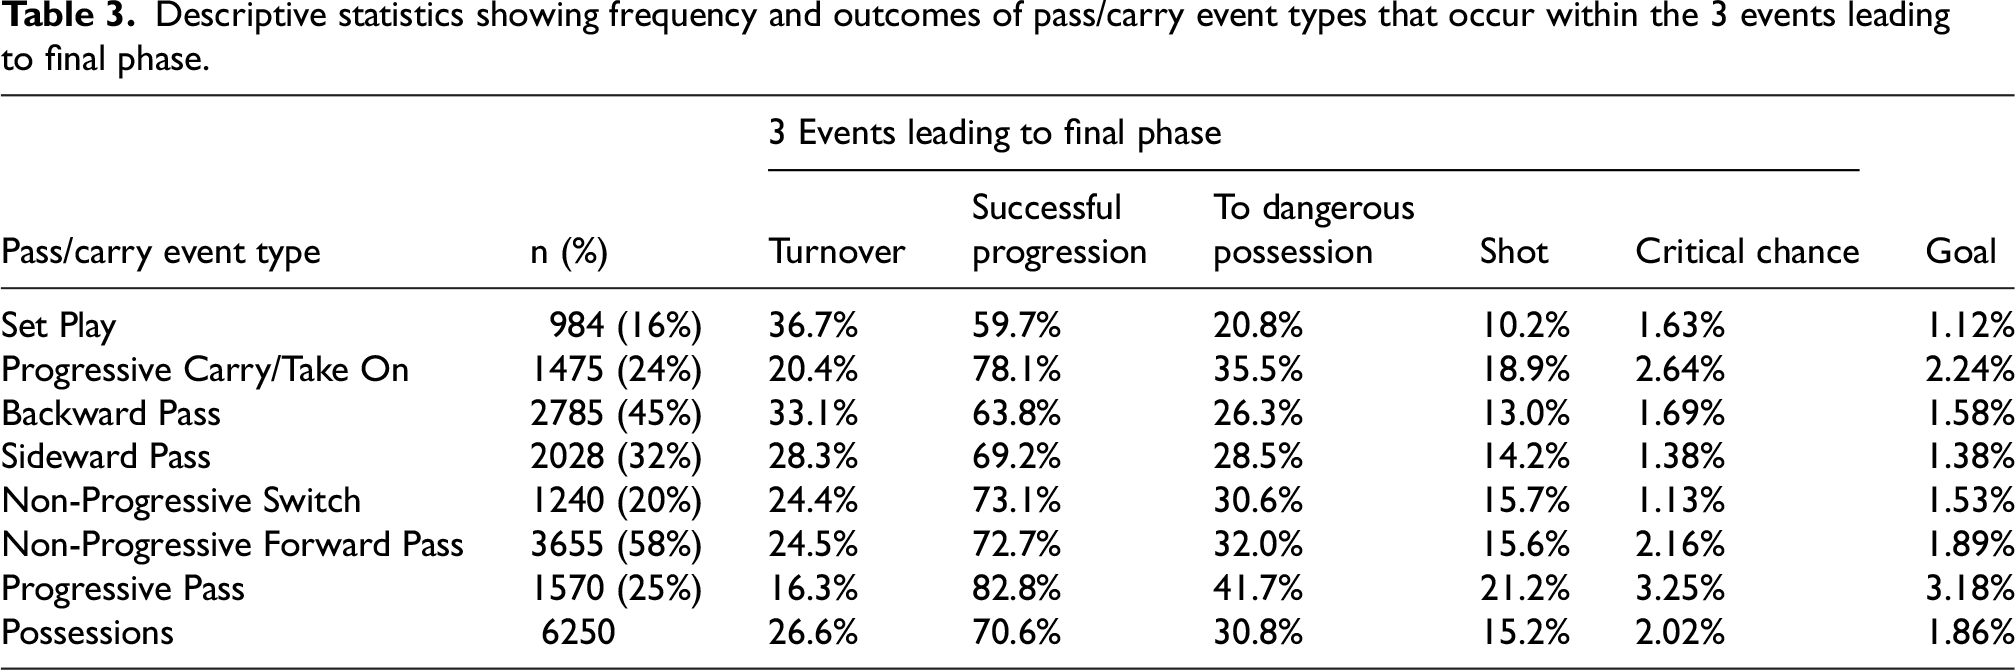
This leads to the following data sample: 5174 3-event sequences To 2nd Phase (Table 1), of which 903 are under opposition pressure (Table 2), 6250 3-event sequences To Final phase, of which 30.8% (n = 1925) led to Dangerous Possession (Table 3). We characterised each of the events within the 3-event sequences as one of the following: set play pass, ball touch, cross, shot, backwards pass, sidewards pass, non-progressive switch, non-progressive forward pass, progressive pass and progressive carry or take-on (see Appendix).
Descriptive statistics showing frequency and outcomes of pass/carry event types that occur within the 3 events leading to 2nd phase.
Descriptive statistics showing frequency and outcomes of pass/carry event types that occur within the 3 events leading to 2nd phase under pressure.
Descriptive statistics showing frequency and outcomes of pass/carry event types that occur within the 3 events leading to final phase.
Statistical analysis
Initial pre-processing and storage of the data was performed in Google BigQuery, with further pre-processing performed in R (R version 4.0.5) and statistical modelling was performed in R using the lme4 package (Bates et al., 2015).
We performed mixed-effects multivariable logistic regression models examining the relationship between the pass or carry event types (see Appendix) and the possession outcomes in the 3-event sequences, with each event type being treated as a separate fixed effect in the model. The in possession team was treated as a random effect to account for relative team strengths or biases. A binomial mixed-effects multivariable logistic regression models were conducted for each phase outcome (Successful Progression, Turnover, Dangerous Possession, Shot, Critical Chance and Goal), generating an Adjusted Odds Ratio (aOR) comparing the effects of each event type on subsequent phase outcomes. Mixed effects multivariable regressions reduce type 1 error by accounting for correlations between groups (event type) and outcomes, considering that up to 3 different event types can occur in these 3-event sequences leading to the next phase; this was a critical consideration in the model selection.
Results
Multivariable regression
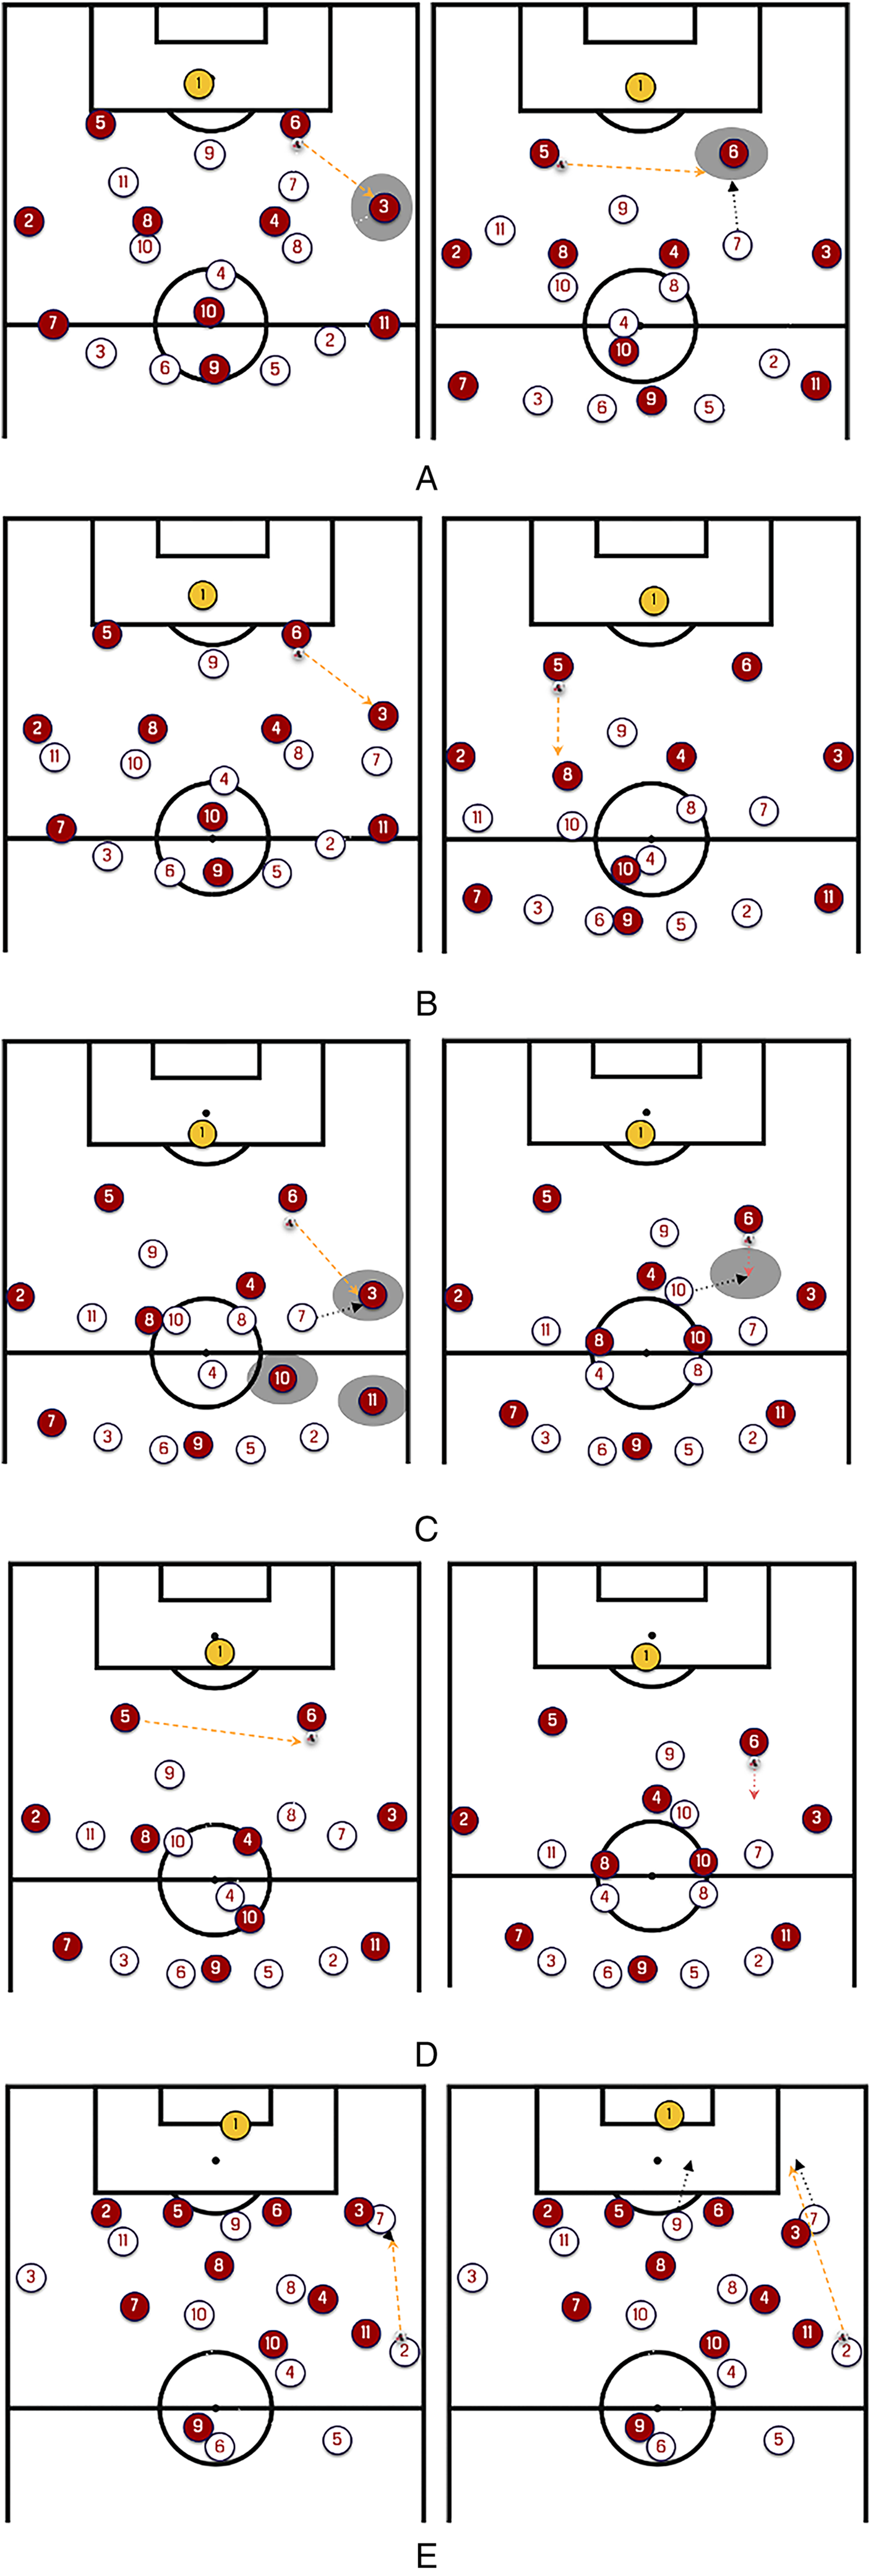
The results of the multivariable regression models looking at the effect of pass or carry event types in 3-event sequences attempting to progress to the 2nd phase are shown in Table 4. Non-progressive forward passes show the greatest odds of progressing the team to the 2nd phase with an Adjusted Odds Ratio (aOR) of 4.50 [3.83–5.30] compared to non-progressive switches, progressive passes and progressive carries, which have an aOR of 2.46 [2.00–3.05], 2.18 [1.77–2.70] and 2.49 [1.74–3.65] respectively. When the opposition applied pressure in a High Block (see Figure 2A), the efficacy of non-progressive forward passes shown in Table 5 drops to 2.11 [1.53–2.94], having been the most effective way of progressing to the 2nd phase, whilst progressive passes increase to 2.46 [1.63–3.73]. Non-progressive switches under pressure becomes the most effective in creating a dangerous possession later in the possession when under pressure in 1st Phase with an aOR of 2.75 [1.34–5.53], followed by progressive passes and then non-progressive forward passes, with an aOR of 2.41 [1.08–5.12] and 2.08 [1.03–4.23] respectively.
Logistic regression model summary showing relationship between occurrence of the pass/carry event type within the 3 events leading to 2nd phase and outcomes of the possession.
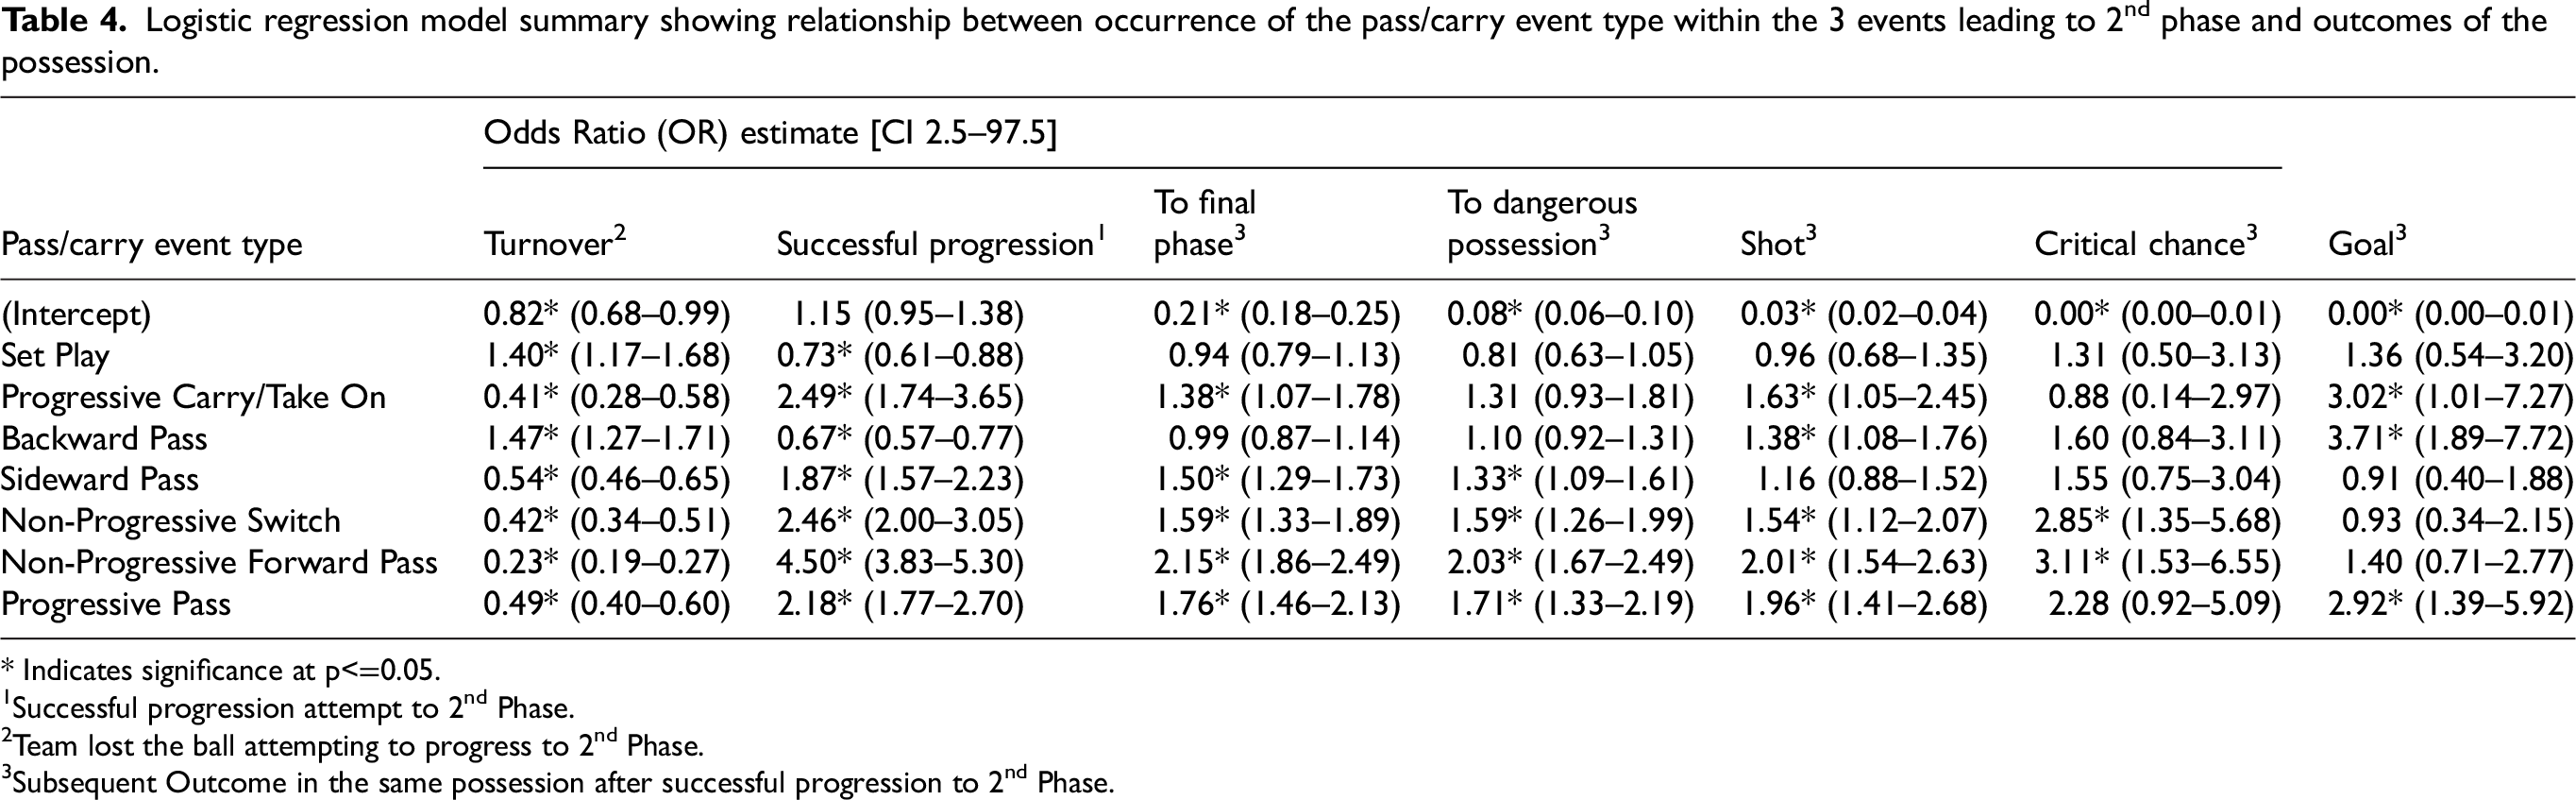
* Indicates significance at p<=0.05.
Successful progression attempt to 2nd Phase.
Team lost the ball attempting to progress to 2nd Phase.
Subsequent Outcome in the same possession after successful progression to 2nd Phase.
Logistic regression model summary showing relationship between occurrence of the pass/carry event type within the 3 events leading to 2nd phase under pressure and outcomes of the possession.
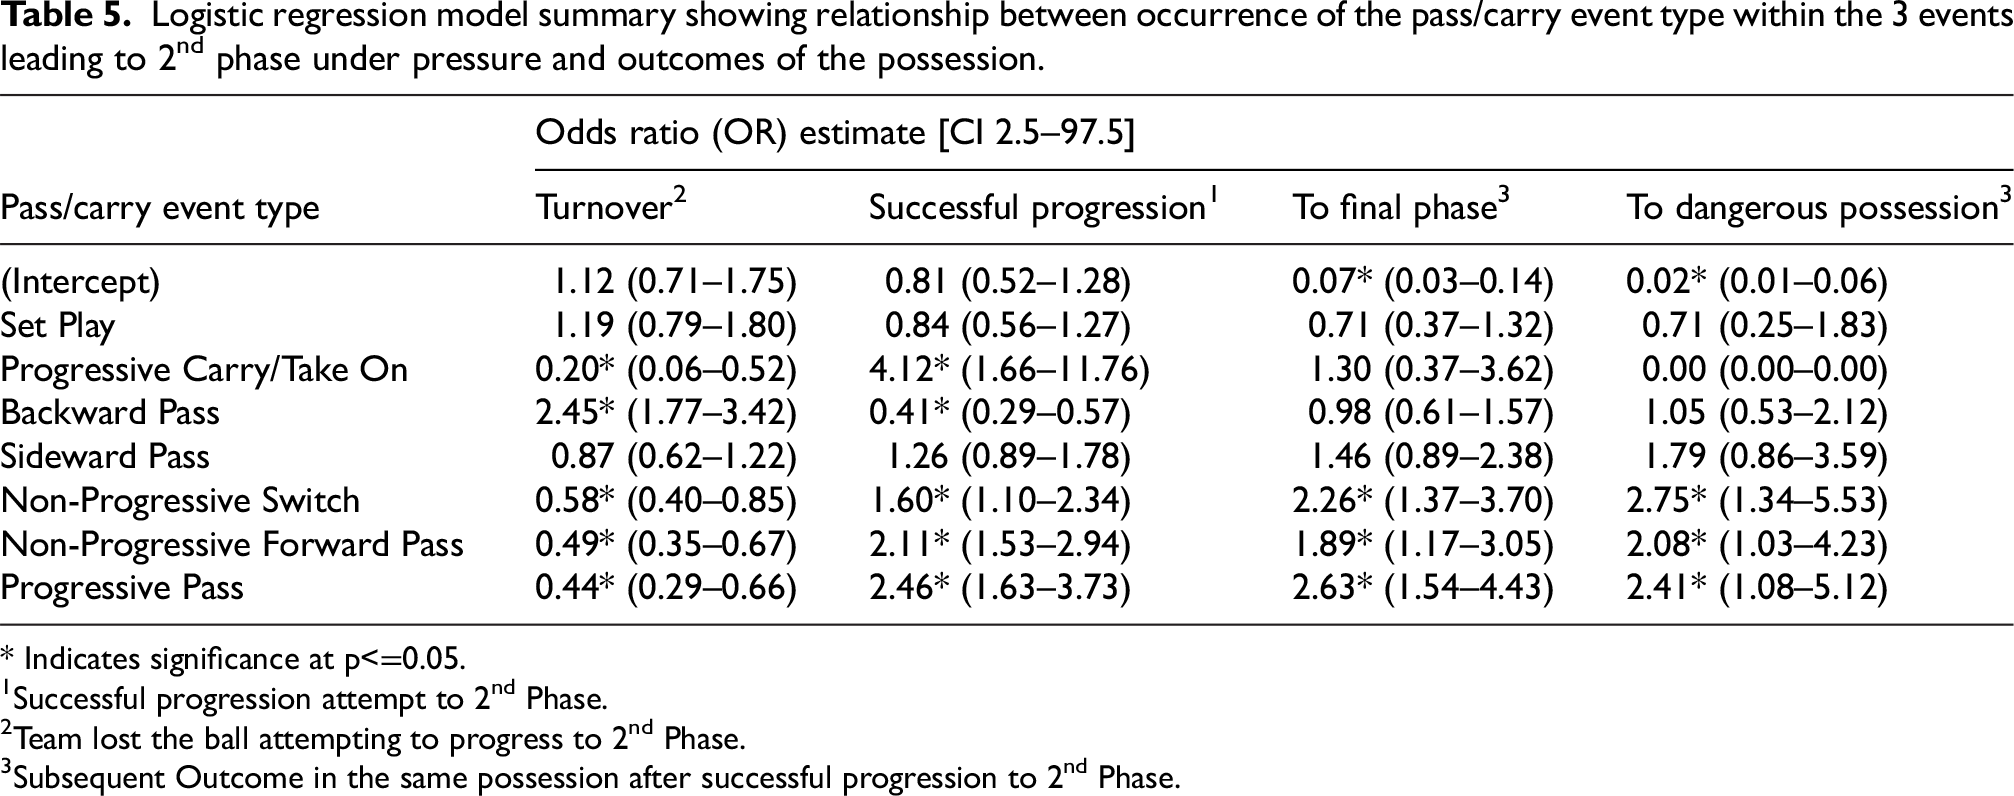
* Indicates significance at p<=0.05.
Successful progression attempt to 2nd Phase.
Team lost the ball attempting to progress to 2nd Phase.
Subsequent Outcome in the same possession after successful progression to 2nd Phase.
There are smaller differences in aOR compared to successful progression shown in Table 4 for positive outcomes in the subsequent possession between progressive passes and non-progressive forward passes with an aOR of 1.76 [1.46–2.13] and 2.15 [1.86–2.49], respectively, for final phase possession, aOR of 1.71 [1.33–2.19] and 2.03 [1.67–2.40] for achieving a dangerous possession and an aOR of 1.96 [1.41–2.68] and 2.01 [1.54–2.63] for creating a shot on goal following progression to the 2nd Phase.
The model results examined outcomes of the 3-event sequences that progress to the final phase in Table 6 shows greater odds of all positive outcomes occurring when a progressive pass is played within those three events proceeding a phase progression. They have greater success in their progression attempts with an aOR of 2.57 [2.19–3.02], almost double the next highest aOR for a non-progressive forward pass with an aOR of 1.38 [1.21–1.58]. A progressive pass was the only event which significantly increased the chances of a dangerous possession (aOR 1.79 [1.56–2.04]), a shot (aOR 1.70 [1.44–2.01]), a critical chance (aOR 1.91 [1.27–2.86]), and goal (aOR 2.05 [1.34–3.12]), occurring in the possession when reaching final phase or subsequently after.
Logistic regression model summary showing relationship between occurrence of the pass/carry event type within the 3 events leading to final phase and outcomes of the possession.
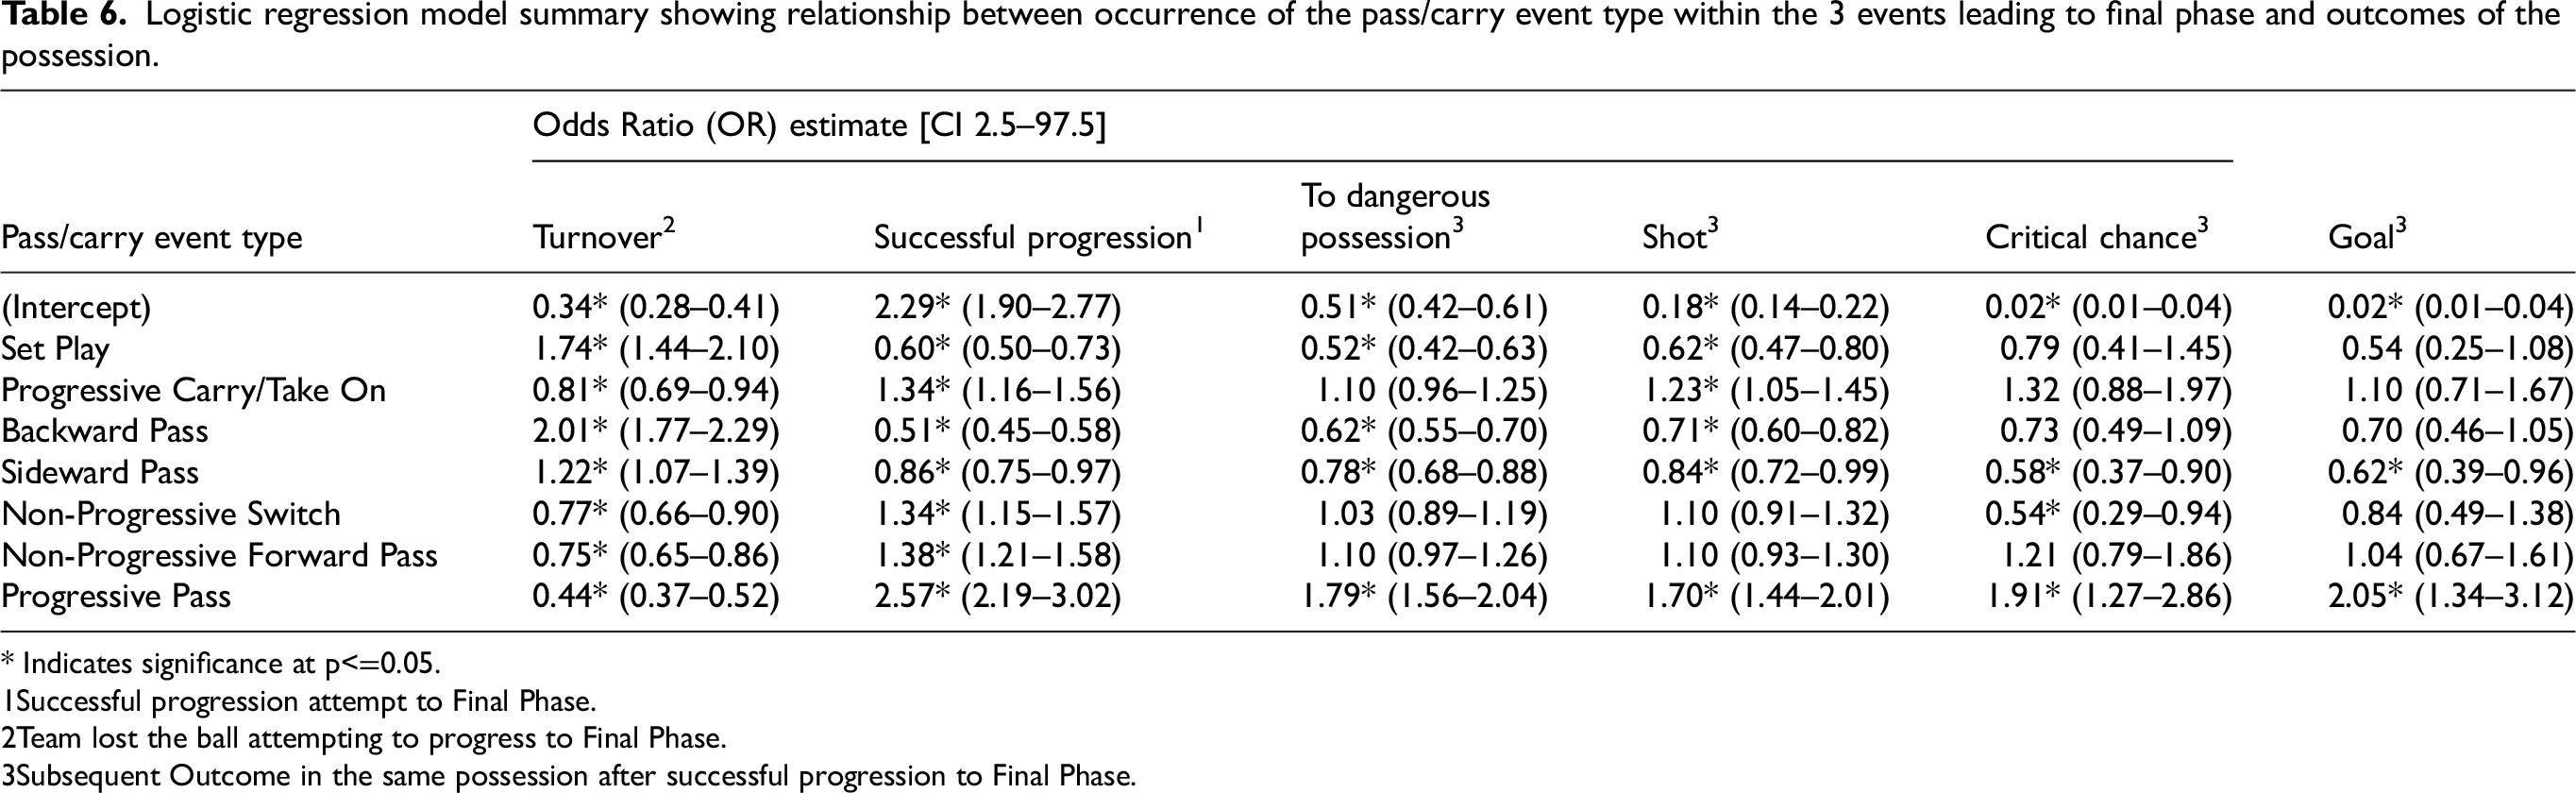
* Indicates significance at p<=0.05.
Successful progression attempt to Final Phase.
Team lost the ball attempting to progress to Final Phase.
Subsequent Outcome in the same possession after successful progression to Final Phase.
Discussion
The initial study aimed to provide a new framework to understand important events or features that allow for progression to the next phase through analysis of the 3-event sequences and subsequent outcomes of the possession. This was a novel methodological framework that combined traditional 3rd party event data and in-house data collection at the event level. This allowed us to understand possession sequences with rich contextual features around the phases and states within a possession from experienced practitioners, which would otherwise require a highly complex model or ruleset to replicate with a merged tracking and event dataset.
From the multivariable logistic regression models, the efficacy of progressive passes to get to the next phase is clear to see. For events leading to the final phase, progressive passes were the only event with positive outcomes following the possession, including dangerous possessions, shots on goal and critical chances created. This agrees with the work reported by Goes et al. (2018), finding forward passes were the most disruptive direction of pass to the opposition's defensive organisation, and (Tenga et al., 2010) showed that penetrative passes were positively correlated with penalty box entries with control. This is because progressive pass attempts aim for space behind the immediate defensive line which results in successful progression to the next phase. Further analysis of the progressive pass types will help further understanding of team style and performance.
For sequences going to 2nd Phase, it was less clear that progressive passes had the greatest efficacy compared to other event types. Whilst it led to more dangerous possession than other forward passes, non-progressive forward passes were more likely to lead to more successful phase progression attempts with less chance of turnover. This is because only 17.4% of these sequences were under opposition pressure (see Figure 2A), whilst 82.6% were against the opposition defending state (see Figure 2B). When 1st Phase possessions are under opposition pressure, i.e., the opposition defensive height is higher, we found that progressive passes had less impact in success to the 2nd phase in comparison to non-progressive passes, which may underline the limitations in our progressive pass definition. An example would be that progressive passes in 1st phase could contain more long balls into contested duels than in 2nd phase if the opposition's defensive shape is more compact and deeper. The higher efficacy of non-progressive forward passes going into 2nd Phase could also be inferring playing through an opposition shape with a higher defensive line and indicate a shorter passing based possession style. Also, the finding that a non-progressive switch under pressure led to greater dangerous possession later in the possession aligns with beliefs held that relieving pressure in this way helps create space during subsequent actions. This is because it will either allow for space to be exploited directly on the other side of the pitch or cause the adjustment of the opposition's defensive shape, resulting in space creation that can be exploited from subsequent actions.
We were able to build on the work and recommendations by Lucey et al. (2012) in implementing a multi-agent plan recognition (MAPR) framework, which uses labels that describe team behaviours by defining when teams attempt to progress to the next phase. We then seek to understand features within these play segments in more detail by exploring the frequency and efficacy of the pass progression clusters to describe the tactics employed by these teams. A limitation of the framework using on-ball event data, is that we cannot evaluate how off the ball movement and passing options available to the passer affect the efficacy of in possession strategies.
Applications of this framework allow us to evaluate elements of our game plan in different phases of the game. For example, if a game plan point for 1st phase was to “play through the opposition shape”, we would be able to see if the most frequently occurring progressive pass clusters (Deb et al., 2023) were through central areas to reach the 2nd Phase, likely inside the opposition shape. The addition of tracking data will allow us to answer this performance question more directly in future research.
Future research should also extend contemporary possession value models, such as the Expected Possession Value (EPV) model created by Fernández et al. (2021), where instead of assigning value based on how a pass affects the likelihood of scoring in the next 10 s, we can look to assign value based the phase outcomes and therefore can value every on and off ball event in relation the most pertinent outcomes in that phase. This, alongside additional contextual features, such as the current score line and time (game state) and measures of individual, team and opposition quality, can provide a more comprehensive insight into the efficacy of tactical strategies in different phases of the game, allowing for specific game plans to be developed for the upcoming opponent.
Case study
A practical application of this augmented possession framework is that it allows us to create metrics and visualisations that assess phase-specific game plan points aligned to the definitions of the coaching and performance analysis team in a post-match review. An example measurement of a specific game plan point is if we wanted to understand whether the team was “patient in build-up from our own half and exploit the opposition's right side in the final phase”. This framework allows us to visualise the enriched possession sequences of all possessions that led to dangerous possession in open play (see Figure 3). We can then show that for possessions starting in our own half, we exploited the right side in the final phase in eight out of the ten instances. Over time, this will enable us to create contextually relevant key performance indicators (KPIs) for specific game plan points and benchmark these performance indicators against the team's norms. It will also allow for further analysis and cluster the entire possession sequences to understand the patterns by which the team creates dangerous possessions in open play.
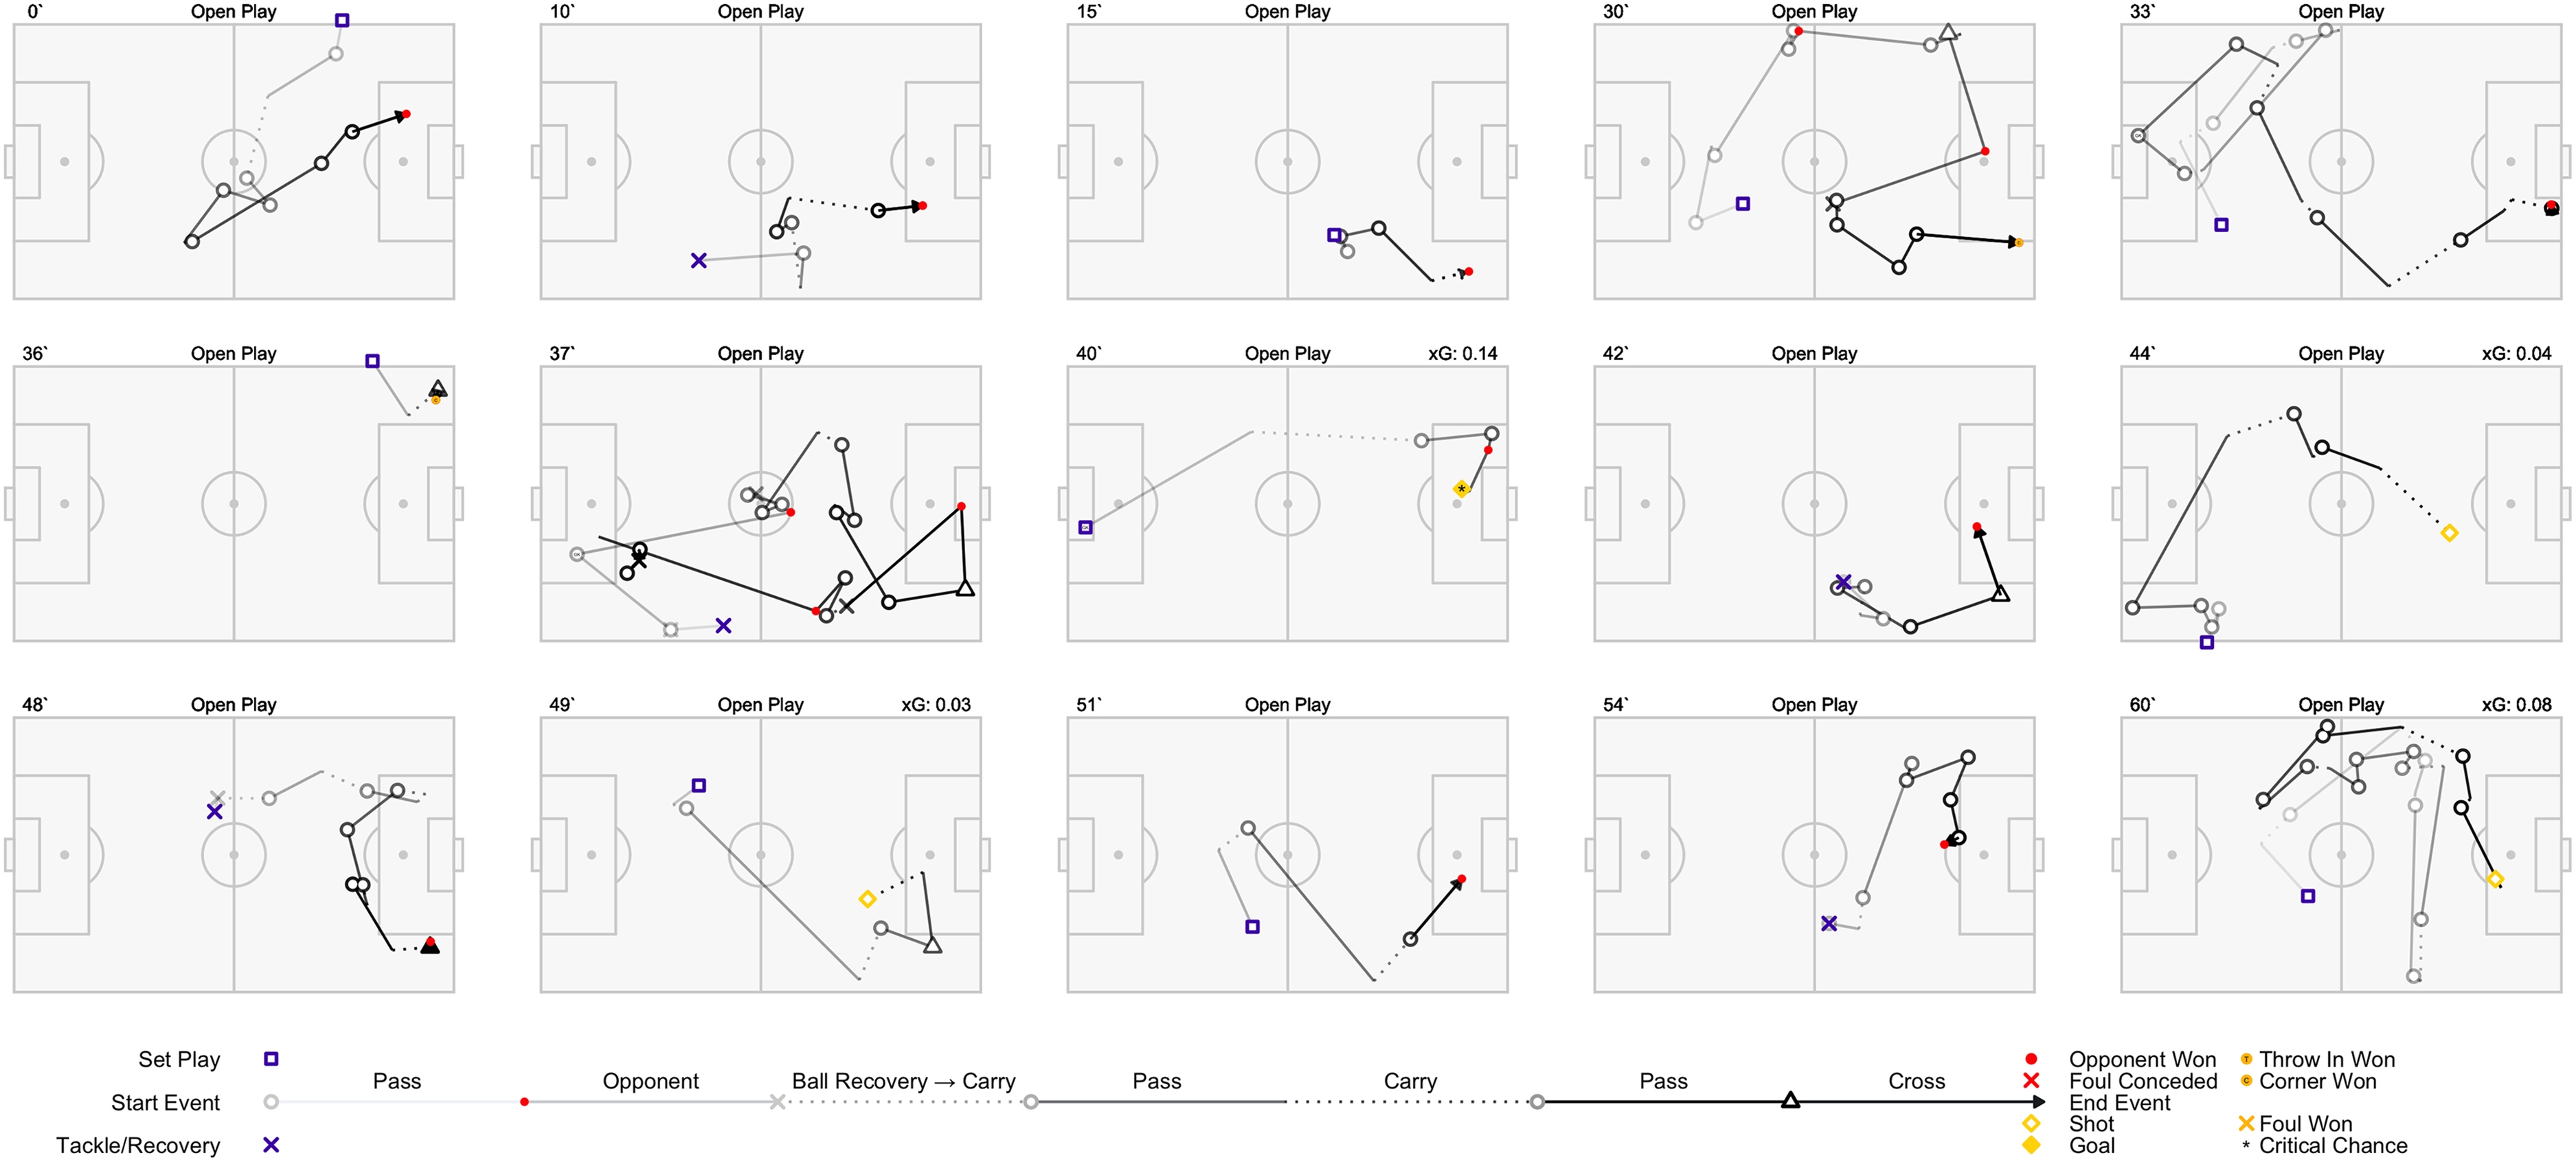
Figure showing a case study example of integrated event and notional analysis data for possessions in a game that lead to open play dangerous possession.
Conclusion
Combining 3rd party event data and notional analysis of the phases and phase outcomes provides a framework to create more contextually rich features in the language of the performance analysts and coaches working with the teams. It has shown us the importance of progressive passes to progress to the final phase and increasing the likelihood of subsequent dangerous possessions, shots, and critical chances created compared to other pass and carry types. The importance of notational analysis in providing context to event data, such as the opposition's defensive shape and pressure, has been established through results showing how pressure applied to the in possession team in 1st Phase changes the effectiveness of pass and carry events. Whereby, non-progressive switches of play when a team is under pressure can create space further into the possession sequence in subsequent phases of play. Ultimately, this framework allows us to produce detailed applications to evaluate a team in post-match or multi-game reviews.
Footnotes
The authors received no financial support for the research, authorship, and/or publication of this article.
The authors declared no potential conflicts of interest with respect to the research, authorship, and/or publication of this article.
Appendix A
Provider
Event Type
OPTA
Set Play Pass
When a player takes a goal kick, free kick, corner or restart.
Head Pass
A pass that is made with a player's head
Cross
A ball that is played in from wide areas into the penalty box
OPTA event x, y locations with internal definitions applied
Sidewards Pass
A pass angle between 75˚ and 105˚ or between −75˚ and −105˚
Forward Pass
A pass angle between 105˚ to −105 ˚ towards goal
Progressive Pass
A forward pass that travels 20% closer to goal and at least 5 m forward and excluding set play passes, crosses, head passes and passes that start in the opposition penalty box
Non-Progressive Switch
If ball does not travel 20% closer to goal and travels greater than 27.2 m horizontally (equivalent to 2 lanes on the pitch) and ends in either of the wide channels
Non-Progressive Forward Pass
A forward pass that doesn’t meet the criteria for a Progressive Pass outlined earlier
Carry
The difference between the end location of the successful pass the player received and the location of the subsequent event they made. Player had to move the ball greater than 1 m in any direction to show it wasn’t due to small differences in location coded by the operator
Progressive Carry/Take On
Where the player performs a carry as described above 10% closer to goal or when a player has attempted to dribble past an opponent.
Appendix B
Provider
Phase/State
Notational Analysis (Phases)
1st Phase
Team in possession and has the ball in build-up, mostly in own half and/or the opposition either in a high block where opposition team is pressing or defending high up the pitch
2nd Phase
Team in possession, mostly in middle third of the pitch and/or opposition have dropped back from a high press to mid block or have pushed up when in low block
Final Phase
Team in possession, mostly in the final third of the pitch and/or opposition team have defensive units that are deep with defending players likely in their own box
Notational Analysis (States)
Transition
After a team has recovered the ball, but does not have the ball under controlled possession
Defending
Where the opposition team is not actively putting pressure on the ball and likely have dropped back into their out of possession shape. This will have both a start and end time, till this state end
Pressing
Where the opposition are actively putting pressure on the ball. This will have both a start and end time, till this state end
Notational Analysis (Shot Detail)
Critical Chance
An opportunity that was deemed a clear-cut chance to score