
Abstract
Disease-modifying treatments (DMT) for spinal muscular atrophy (SMA) developed in the past decade have improved the prognosis of patients with this severe condition. However, treatment effects vary, highlighting the need for sensitive predictive biomarkers to identify individuals more likely to respond to DMT. A previous study detected changes in mitochondrial oxidative capacity in SMA arm muscles, using 31-phosphorus magnetic resonance spectroscopy (31P MRS). Here, we investigated whether 31P MRS can distinguish responders from non-responders to DMT. In this longitudinal observational cohort study, patients with SMA were assessed at baseline, two months, and ten months after initiation of DMT treatment. We used a 7 Tesla MR scanner equipped with a custom-built ergometer that allowed for individual mechanical loading and metabolic analysis of the upper arm muscles. Maximal voluntary contraction (MVC) force and motor functional scores were measured before each MR examination. Responders to DMT were defined as those who gained ≥20% in MVC after ten months of treatment. Seven non-ambulatory and five ambulatory patients with SMA starting DMT were included. Four patients fulfilled the MVC response criterion. While significant correlations were observed between MVC force and in vivo metabolic readouts of muscle phenotype, the latter could not longitudinally discriminate responders from non-responders to DMT. Our MR platform for single-arm muscle exercise provides a non-invasive tool for monitoring treatment response in both ambulatory and non-ambulatory patients. Further studies involving larger cohorts will be necessary to establish the diagnostic value of 31P MRS in evaluating DMT efficacy in SMA and other neuromuscular diseases.
Keywords
Introduction
Spinal Muscular Atrophy (SMA) is an autosomal recessive neurodegenerative disease caused by a homozygous loss of function of the survival motor neuron 1 (SMN1) gene. 1 The incidence is approximately one in 6000–10000 live births. SMA is characterized by the degeneration of spinal cord alpha-motor neurons. This leads to progressive, generalized weakness, as well as muscle fatigability, ultimately resulting in severe functional limitations. 2 It has a wide range of severity and is classified into four clinical types. The most severe phenotype is characterized by an onset of weakness in the first six months of life with rapid progression to respiratory insufficiency and death (SMA type 1). 3 The more chronic variants with childhood onset are characterized by the ability to sit but not to walk independently (SMA type 2), or deteriorating ambulation skills (SMA type 3). 4 Adult-onset SMA with mild impairments is rare (SMA type 4). 5
New disease-modifying treatments (DMT) that increase intracellular SMN protein levels have been developed in the past decade and have changed the prognosis of SMA. Therapy outcomes vary, in particular with longer disease duration, with responder rates in adults ranging from 25% to 70%.6–9 The treatment efficacy of DMT in SMA is currently objectified using motor functional tests such as the Hammersmith Functional Motor Scale Extended (HFMSE) and Revised Upper Limb Module (RULM).10,11 However, objectification is hampered both by ceiling and floor effects in very strong or very weak patients. 12 In addition, HFMSE has shown an unequal distribution of the constituent items in the total score, explained by multidimensionality and dependency of some of the motor function items.10,13
Against this background, there is a pressing need for more sensitive biomarkers for patients with SMA to identify individuals who are more likely to benefit from DMTs. Given the limitations of current functional outcome measures, imaging-based biomarkers offer a promising alternative. In vivo phosphorus MR Spectroscopy (31P MRS) has the potential to evaluate the effects of interventions such as physical training or pharmacological treatment of myopathies.14–17 31P MRS can detect changes to muscle at the microscopic, cellular level. 18 Specifically, increased mitochondrial biosynthesis in individual myofibers in response to a training intervention has been detected within eight weeks by 31P MRS, resulting in improved energy and pH balance during exercise and faster metabolic recovery post-exercise.18–20
The expected effect of DMTs for SMA is stabilization or rescue of motor neurons, in particular high-threshold motor neurons associated with fast-twitch (FT) myofibers that produce high force but at a higher adenosine triphosphate (ATP) cost per contraction than slow-twitch (ST) fibers. 21 The higher vulnerability of this particular population of motor neurons in SMA is evidenced by the common finding of fast-to-slow phenotypic transformation of skeletal muscles in SMA patients that contributes to the symptom of muscle weakness.22–25 On a macroscopic scale, any effect of DMT would hence manifest as a gain in muscle strength and physical function, while, on a microscopic scale, any availability of rescued FT motor units for daily use may be expected to stimulate mitochondrial biosynthesis in the associated myofibers. Therefore, in theory, a positive response to DMT in SMA may be identifiable both by longitudinal measurements of maximal voluntary contraction (MVC) force and motor functional scores as well as in vivo 31P MRS evaluation of, on the one hand, muscular ATP turnover and acidification during contractile work and, on the other hand, the speed of energetic recovery following muscular work.
Here, we tested this hypothesis in a longitudinal study of mechanical and metabolic biomarkers of upper arm muscle function in a cohort of 12 patients with SMA treated with the DMTs Nusinersen (Spinraza®, Biogen) or Risdiplam (Evrysdi®, Roche). We previously demonstrated that dynamic in vivo 31P MRS interrogation of upper arm muscles of patients with SMA in combination with arm-cycling exercise inside a wide-bore 3 Tesla (T) MR scanner is feasible. 22 For logistical reasons, the present study employed a narrow-bore 7 T MR scanner that we fitted with a novel MR-compatible ergometer affording individual mechanical loading of the m. biceps brachii (BB) and m. triceps brachii (TB) muscles. A minimal gain in MVC of ≥20% at 10 months after the start of DMT was used as a criterion for a positive response (‘responder’) to DMT.
Materials and methods
Participants
We recruited 12 patients with SMA types 2, 3, and 4 from the Dutch SMA registry, before initiation of Nusinersen and Risdiplam. Inclusion criteria were: 1) confirmed homozygous deletion of the SMN1 gene, 2) age ≥12 years, 3) ability to perform active arm exercise movements in supine position, 4) ability to follow test instructions, and 5) sufficient understanding of the Dutch language. Exclusion criteria were: 1) pregnancy, 2) comorbidities affecting exercise tolerance, 3) being under examination for a non-diagnosed disease at the time of investigation, 4) contra-indications to 7 T MR examination (University Medical Center Utrecht (UMCU) screening guideline) 5) risk factors for exercise testing registered by a Dutch version of the Preparticipation Questionnaire (American College of Sports Medicine and American Heart Association). Medications that influence metabolic processes were not used by the participants. We included participants between November 2020 and July 2021.
Sample size calculation
Due to the exploratory design and unknown effect size, no a priori power analysis was performed. In vivo 31P MRS accurately detects metabolic dysfunction by combining both static and dynamic indices (phosphocreatine (PCr), inorganic phosphate (Pi), and pH during rest, exercise, and recovery). Therefore, 31P MRS is highly suitable for metabolic assessment in orphan diseases with small sample sizes, such as SMA.26–28 We aimed to include ≥10 participants, consistent with or exceeding previous UMCU studies. 22
Study design
This longitudinal prospective clinical investigation consisted of five visits during approximately 300 days (Figure 1). At the first visit (test), the participants performed: 1) muscle function testing, 2) an incremental supine exercise test of the dominant upper arm, and 3) an endurance test at a personalized 80% of peak workload. The tests were repeated at the second visit (retest), either after a break or within two weeks. We established the test-retest reliability of the MR-compatible ergometer on the resistance achieved by the participants measured by the steep-ramp test and the time to fatigue during the endurance test (eTable 1). The third, fourth, and fifth visits (MR visits 1 to 3) were mostly coinciding with regular hospital visits of Nusinersen or Risdiplam treatment on day 0, day 60, and day 300. During MR visits 1 to 3, the participants performed: 1) muscle function testing and 2) an endurance test at a personalized 80% of peak workload inside the MR scanner.
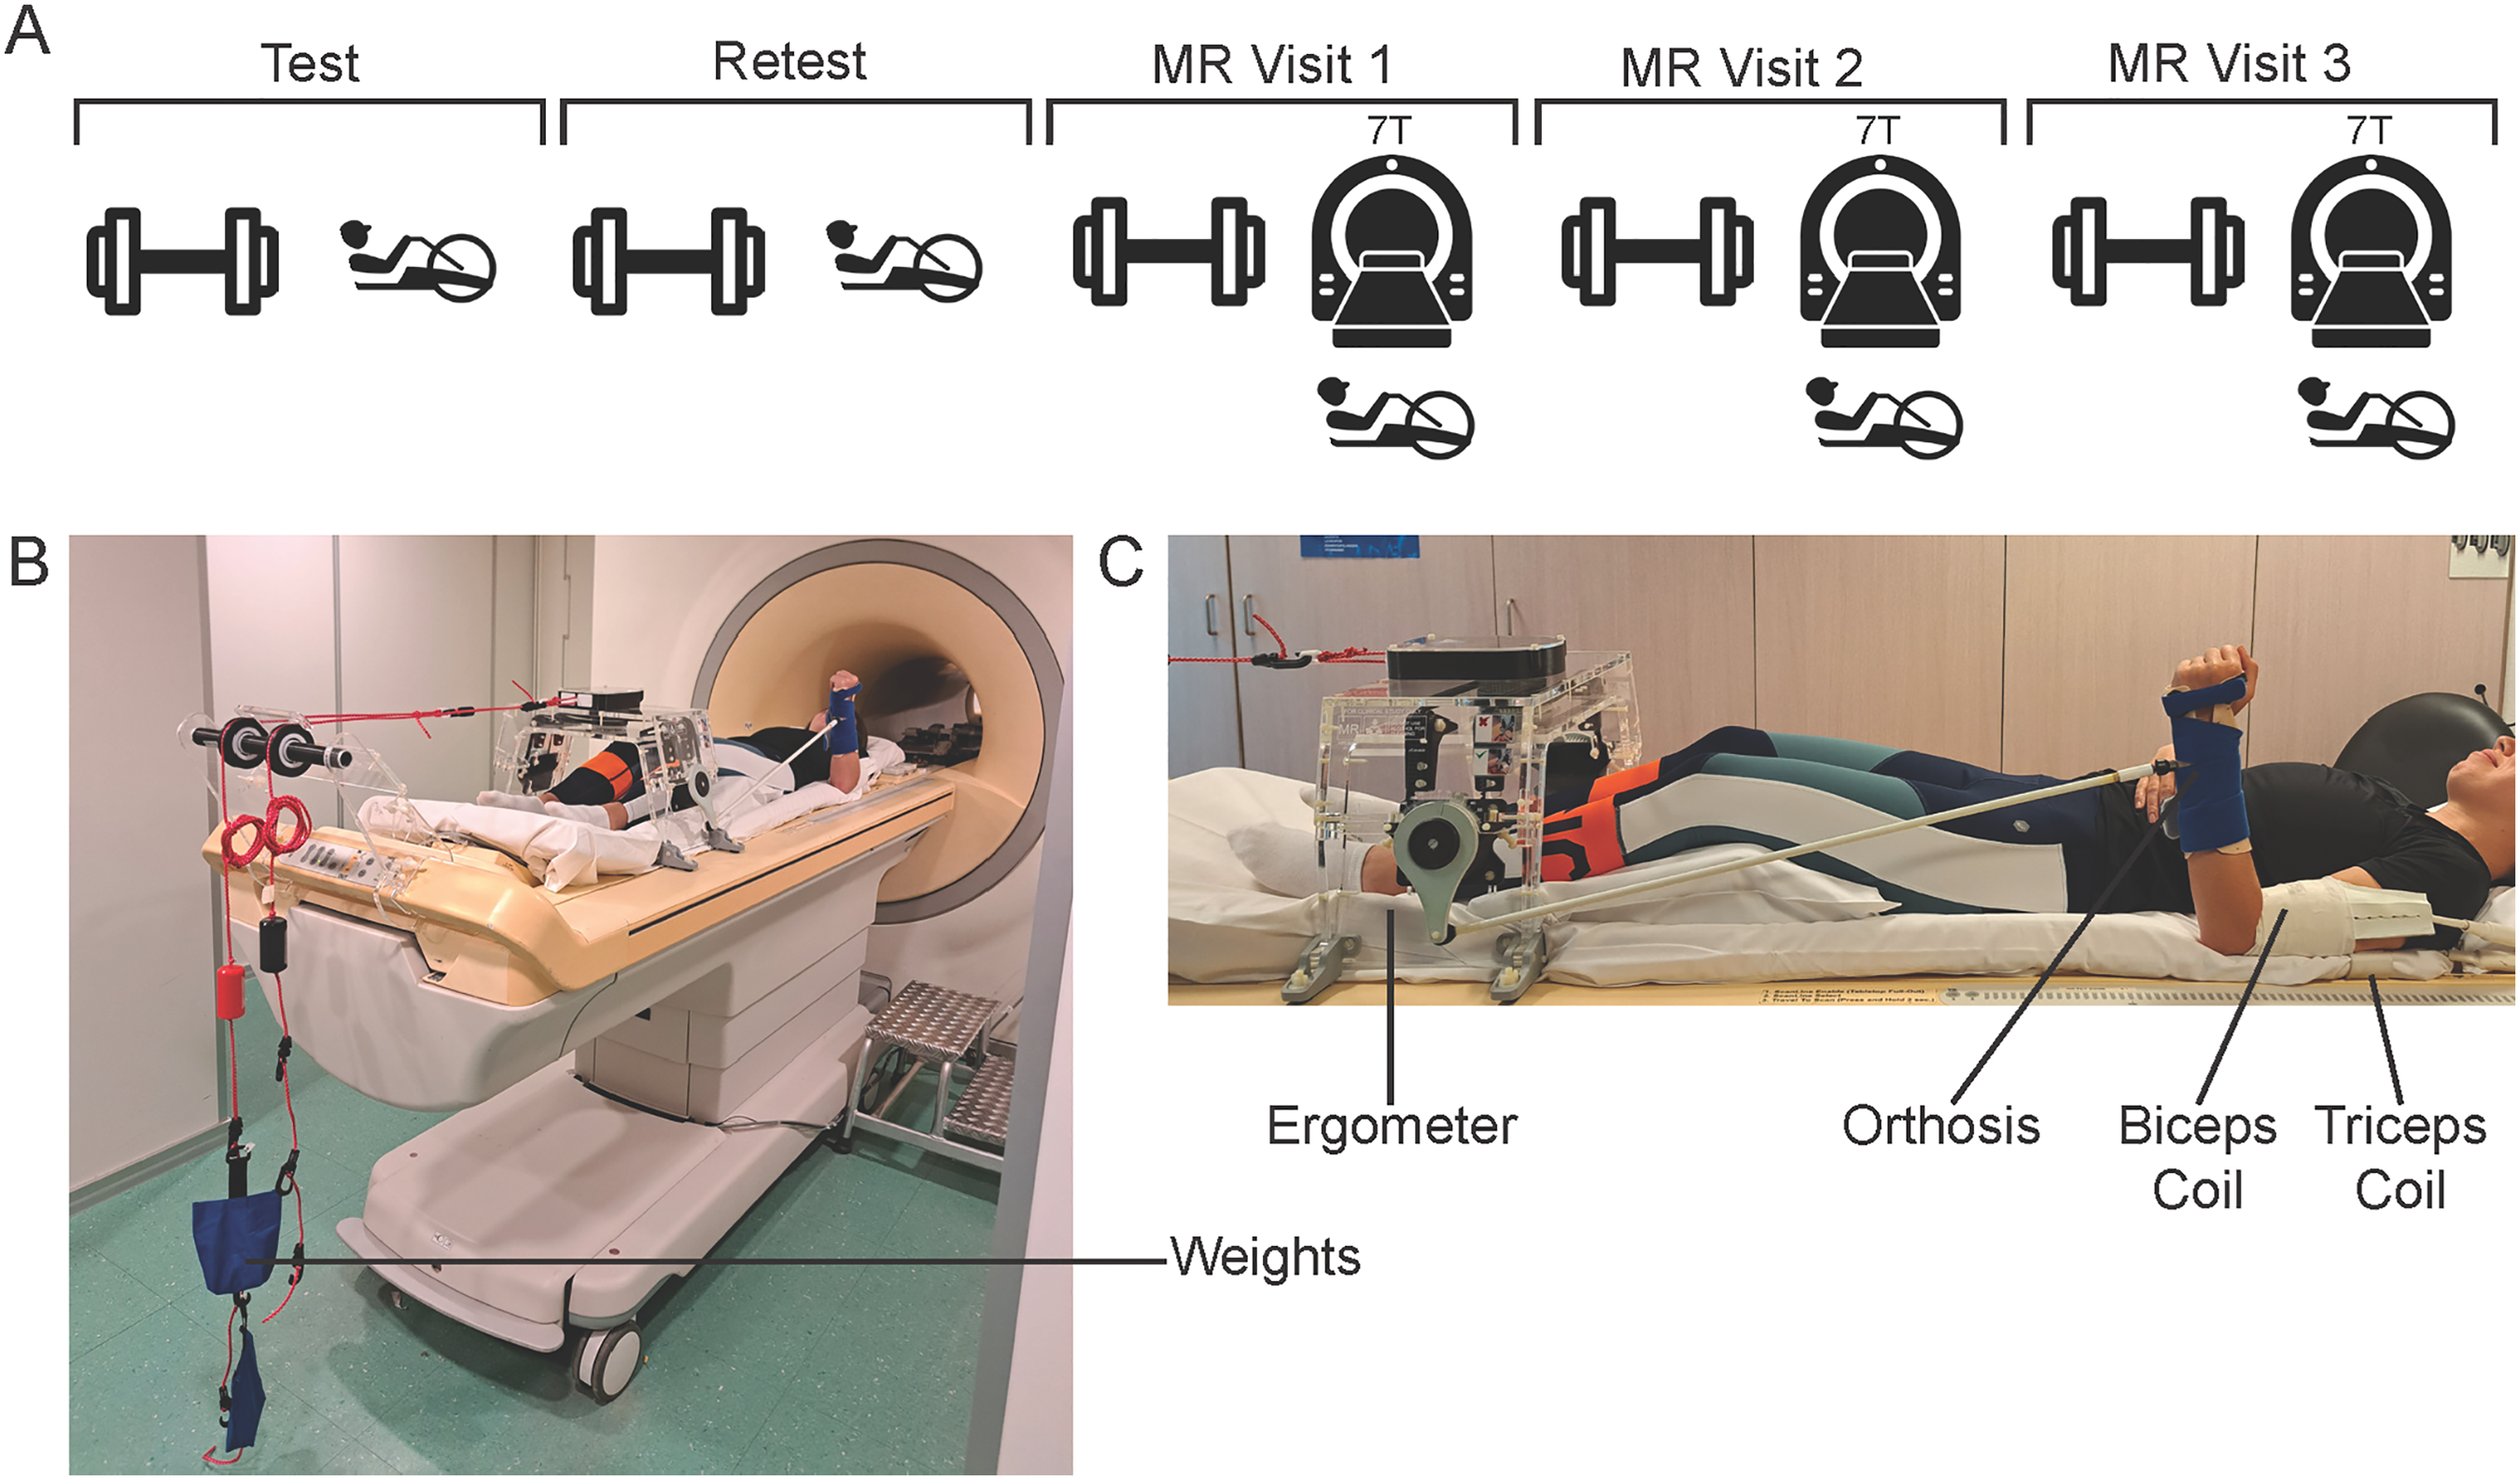
A) Schematic overview of the study visits, where during the test and retest, the participants performed muscle function testing, an incremental supine exercise test of the dominant upper arm, and an endurance test at a personalized 80% of peak workload. During Magnetic Resonance (MR) visits 1, 2, and 3, the patients performed muscle function testing and an endurance test at a personalized 80% of peak workload inside the 7 Tesla (7 T) MR scanner. (B and C) The setup of the dynamic supine MR-compatible upper arm exercise test with the 7 T MR-compatible supine arm ergometer. Permission was granted by the person depicted in the figure.
Ergometer
The MR-compatible ergometer was custom-made in collaboration with medical technicians and clinical physicians (Figure 1). The ergometer can be adjusted to be used on the 3 T and 7 T Philips Ingenia MR scanner and on a treatment table. With this ergometer, a load can be imposed on the upper arm muscles of participants unilaterally. The force can be varied by the use of weights, with a maximum of 5000 g. The ergometer was calibrated each time as friction of the system was present.
Demographics and anthropometry
Data concerning medical history were obtained from the Dutch SMA database. Height and weight were measured, and body fat percentage was obtained using a Bodystat scan (Quadscan 4000 Euromedix, Belgium).
Motor function
The gross motor function was assessed with the SMA-specific HFMSE at MR visits 1 to 3. The HFMSE has 33 items with a maximum total score of 66. 29 The upper limb motor function was assessed with the SMA-specific RULM at MR visits 1 to 3. The RULM has 20 items with a maximum score of 37. 30 We assessed the participants treated with Risdiplam only with the RULM. A clinically meaningful improvement is defined as a ≥2-point increase on the RULM total score. 30
Isometric muscle strength
We measured MVC of the BB and TB with a handheld dynamometer (MicroFET2, Hoggan Health Industries, USA), using the break test with the elbow in 90-degree flexion and supination of the lower arm. MVC was collected before the in-magnet supine exercise test at MR visits 1 to 3. A responder to DMT was defined as an increase of ≥20% in MVC over the approximately 10 months of treatment (difference in MVC between MR visit 1 and MR visit 3). This ≥20% threshold was chosen based on the minimal detectable change for this outcome measure. 31 Since MVC of the BB and TB muscles was measured in isolation, we defined responders separately for each muscle.
Dynamic supine MR-compatible upper arm exercise test
At the test and retest visits, participants were positioned supine with their dominant arm resting alongside, in a 90-degree elbow flexion at the neutral starting position. The lower arm was fitted in a hand-made orthosis to fixate the wrist and hand and to minimize involvement of the forearm muscles during the exercise test (Figure 1). To determine individualized peak workload, participants performed a Steep Ramp Test for elbow flexion and elbow extension. The lower arm moved between 60–90 degrees of elbow flexion or extension at 60 rpm, paced by an audio cue. After 10 s of unloaded exercise, we increased resistance with either 200 g (MVC <40 Newton (N)) or 500 g (MVC >40 N) every 10 s until exhaustion or a maximal test duration of 110 s. After ≥10 min (min) of rest and recovery to baseline levels of perceived fatigue, the participant performed an endurance exercise test at 80% of peak workload or the maximal resistance of 5000 grams. The audio cue was set at 60 rpm, with exercise continued until exhaustion or a maximal duration of 6 min. At MR visits 1 to 3, the endurance tests were repeated within the MR scanner with equal workloads (80% of the highest peak workload determined at the test or retest visit). After 30 s of rest, the participants started with dynamic elbow flexion against an 80% peak workload until exhaustion. After a recovery period of 10 min, the same protocol was executed for elbow extension. Perceived fatigue and muscle pain were rated on the OMNI 0–10 scale after the exercise tests.
Muscle 31P magnetic resonance spectroscopy
31P MRS data acquisition
A whole-body 7 T MR system (Philips Healthcare, Best, The Netherlands) equipped with an in-house designed double-tuned 2H/31P whole-body birdcage transmit coil embedded on the outside of the patient tube (Futura, Heerhugowaard, the Netherlands) was used for 31P MRS acquisition. 32 Two 31P surface receive coils (WaveTronica, the Netherlands) were fastened over the dominant frontal and dorsal upper arm, respectively. A series of scout MR images was acquired using a 1H dipole antenna (WaveTronica, the Netherlands) positioned at the lateral side of the upper arm to evaluate the correct positioning of the participant and the 31P coils. First- and second-order shim settings were optimized over the dominant upper arm with an MR image-based method using the MR Code software (TeslaDC, Zaltbommel, the Netherlands). 31P free induction decay signals were acquired following a 28° radio frequency block pulse (calibrated for each scan session) (repetition time 500 ms; number of signal averages 4; 512 data points; bandwidth 5000 Hz) with a time resolution of 2 s during 30 s of rest, exercise (variable time, with a maximum of 360 s), and recovery (variable time, with a minimum of 410 s) after completion of the exercise test.
31P MRS data analysis
Datasets were analyzed blindly by one observer (L.P.). Free induction decays were denoised using the principal component analysis-based denoising tool using Wolfram Research (Mathematica, version 14.2, IL). 33 Thereafter, 31P MRS data were processed in MATLAB (version 9.14.0 R2023a, The MathWorks Inc., USA), and analyzed using AMARES time domain fitting (www.jMRUI.org) with customized starting values and prior knowledge files. PCr (0.0 ppm = reference peak), alpha-ATP (−7.3 ppm), gamma-ATP (−2.3 ppm), and Pi (5.0, 4.4, and 4.0 ppm, respectively) were fitted. Myofiber pH was derived from the chemical shift difference between the Pi and PCr resonances. 34 Here, the mean chemical shift of the three Pi peaks was calculated, weighted by their amplitudes. Post-exercise metabolic recovery kinetics were determined by non-linear curve fitting of mono- or double-exponential functions using MATLAB. 35 Pi and PCr 95% recovery times (PCr 95RT; in s) were calculated similarly to previous methods. 22
Statistical analysis
We presented continuous variables as mean and standard deviation (SD) or median and interquartile range (IQR), whichever was more appropriate. The data of the patients treated with Nusinersen and Risdiplam were tested as one group. Missing data were addressed by performing the statistical analyses using all available (non-missing) data without imputation. Significant differences between responders and non-responders to DMT in isometric muscle strength were tested using a non-parametric Wilcoxon rank sum exact test. Due to the small and uneven group sizes between responders and non-responders, no statistical comparisons were made between responders and non-responders to DMT (based on isometric muscle strength or RULM total score) on 31P MRS metabolic measures. To test the linear correlation between variables, we used Spearman's rank correlation and used the data from MR visits 1 to 3 altogether or longitudinal changes between MR visit 1 and MR visit 3. All statistical analyses were performed using RStudio (version 2024.09.0 + 375, RStudio, Boston, USA), and the significance level was set at 0.05.
Results
Demographics
We included a total of 12 participants, of whom eight men and four women, with an age range of 19 to 55 years (Table 1). A total of three participants had SMA type 2, eight SMA type 3, and one SMA type 4. Nine of the participants started treatment with Nusinersen, and three with Risdiplam, following the regular dosing schedule.36,37
Cohort demographic characteristics at baseline.
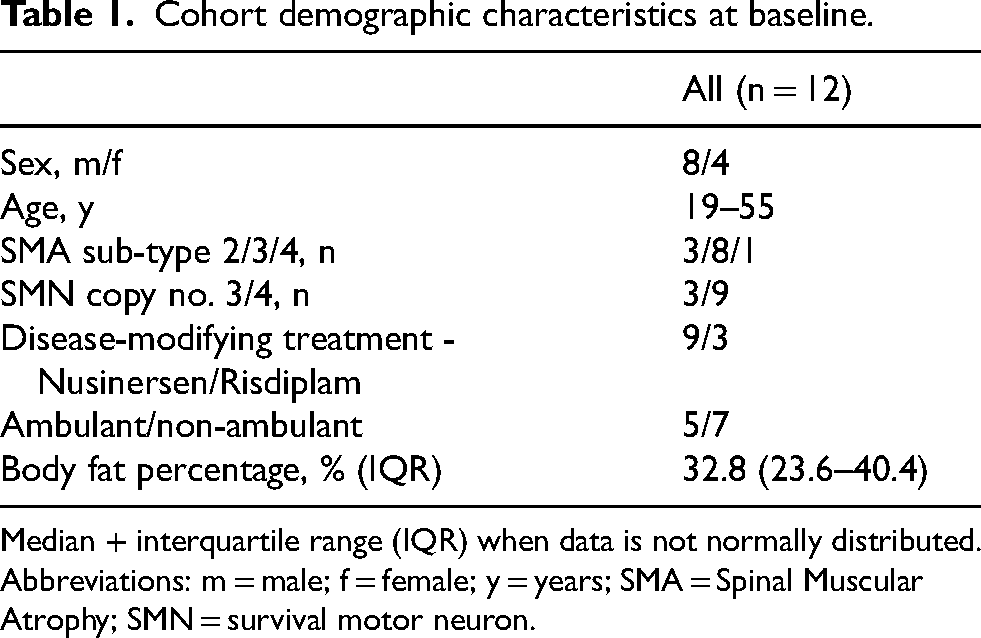
Median + interquartile range (IQR) when data is not normally distributed. Abbreviations: m = male; f = female; y = years; SMA = Spinal Muscular Atrophy; SMN = survival motor neuron.
Study execution
The study visits were typically planned simultaneously with the planned DMT visits to reduce the burden on the participants (Figure 2). Ten participants completed the BB MVC tests, and ten participants completed the TB MVC tests. Eight patients completed both MVC tests. The reason for not completing the MVC test was not being able to perform the test due to muscle weakness. Ten participants performed the BB MR exercise test, and eight participants performed the TB MR exercise test. Six participants performed both MR exercise tests. Missing data points were caused by muscle weakness. The increased number of dropouts in the MR exercise test is caused by the higher muscular demand required to complete the test compared to the MVC test. After the MR exercise tests, patients experienced pain scores of 0.8 out of 10 in the BB and 0 out of 10 in the TB, respectively, averaged over the three MR exercise tests.
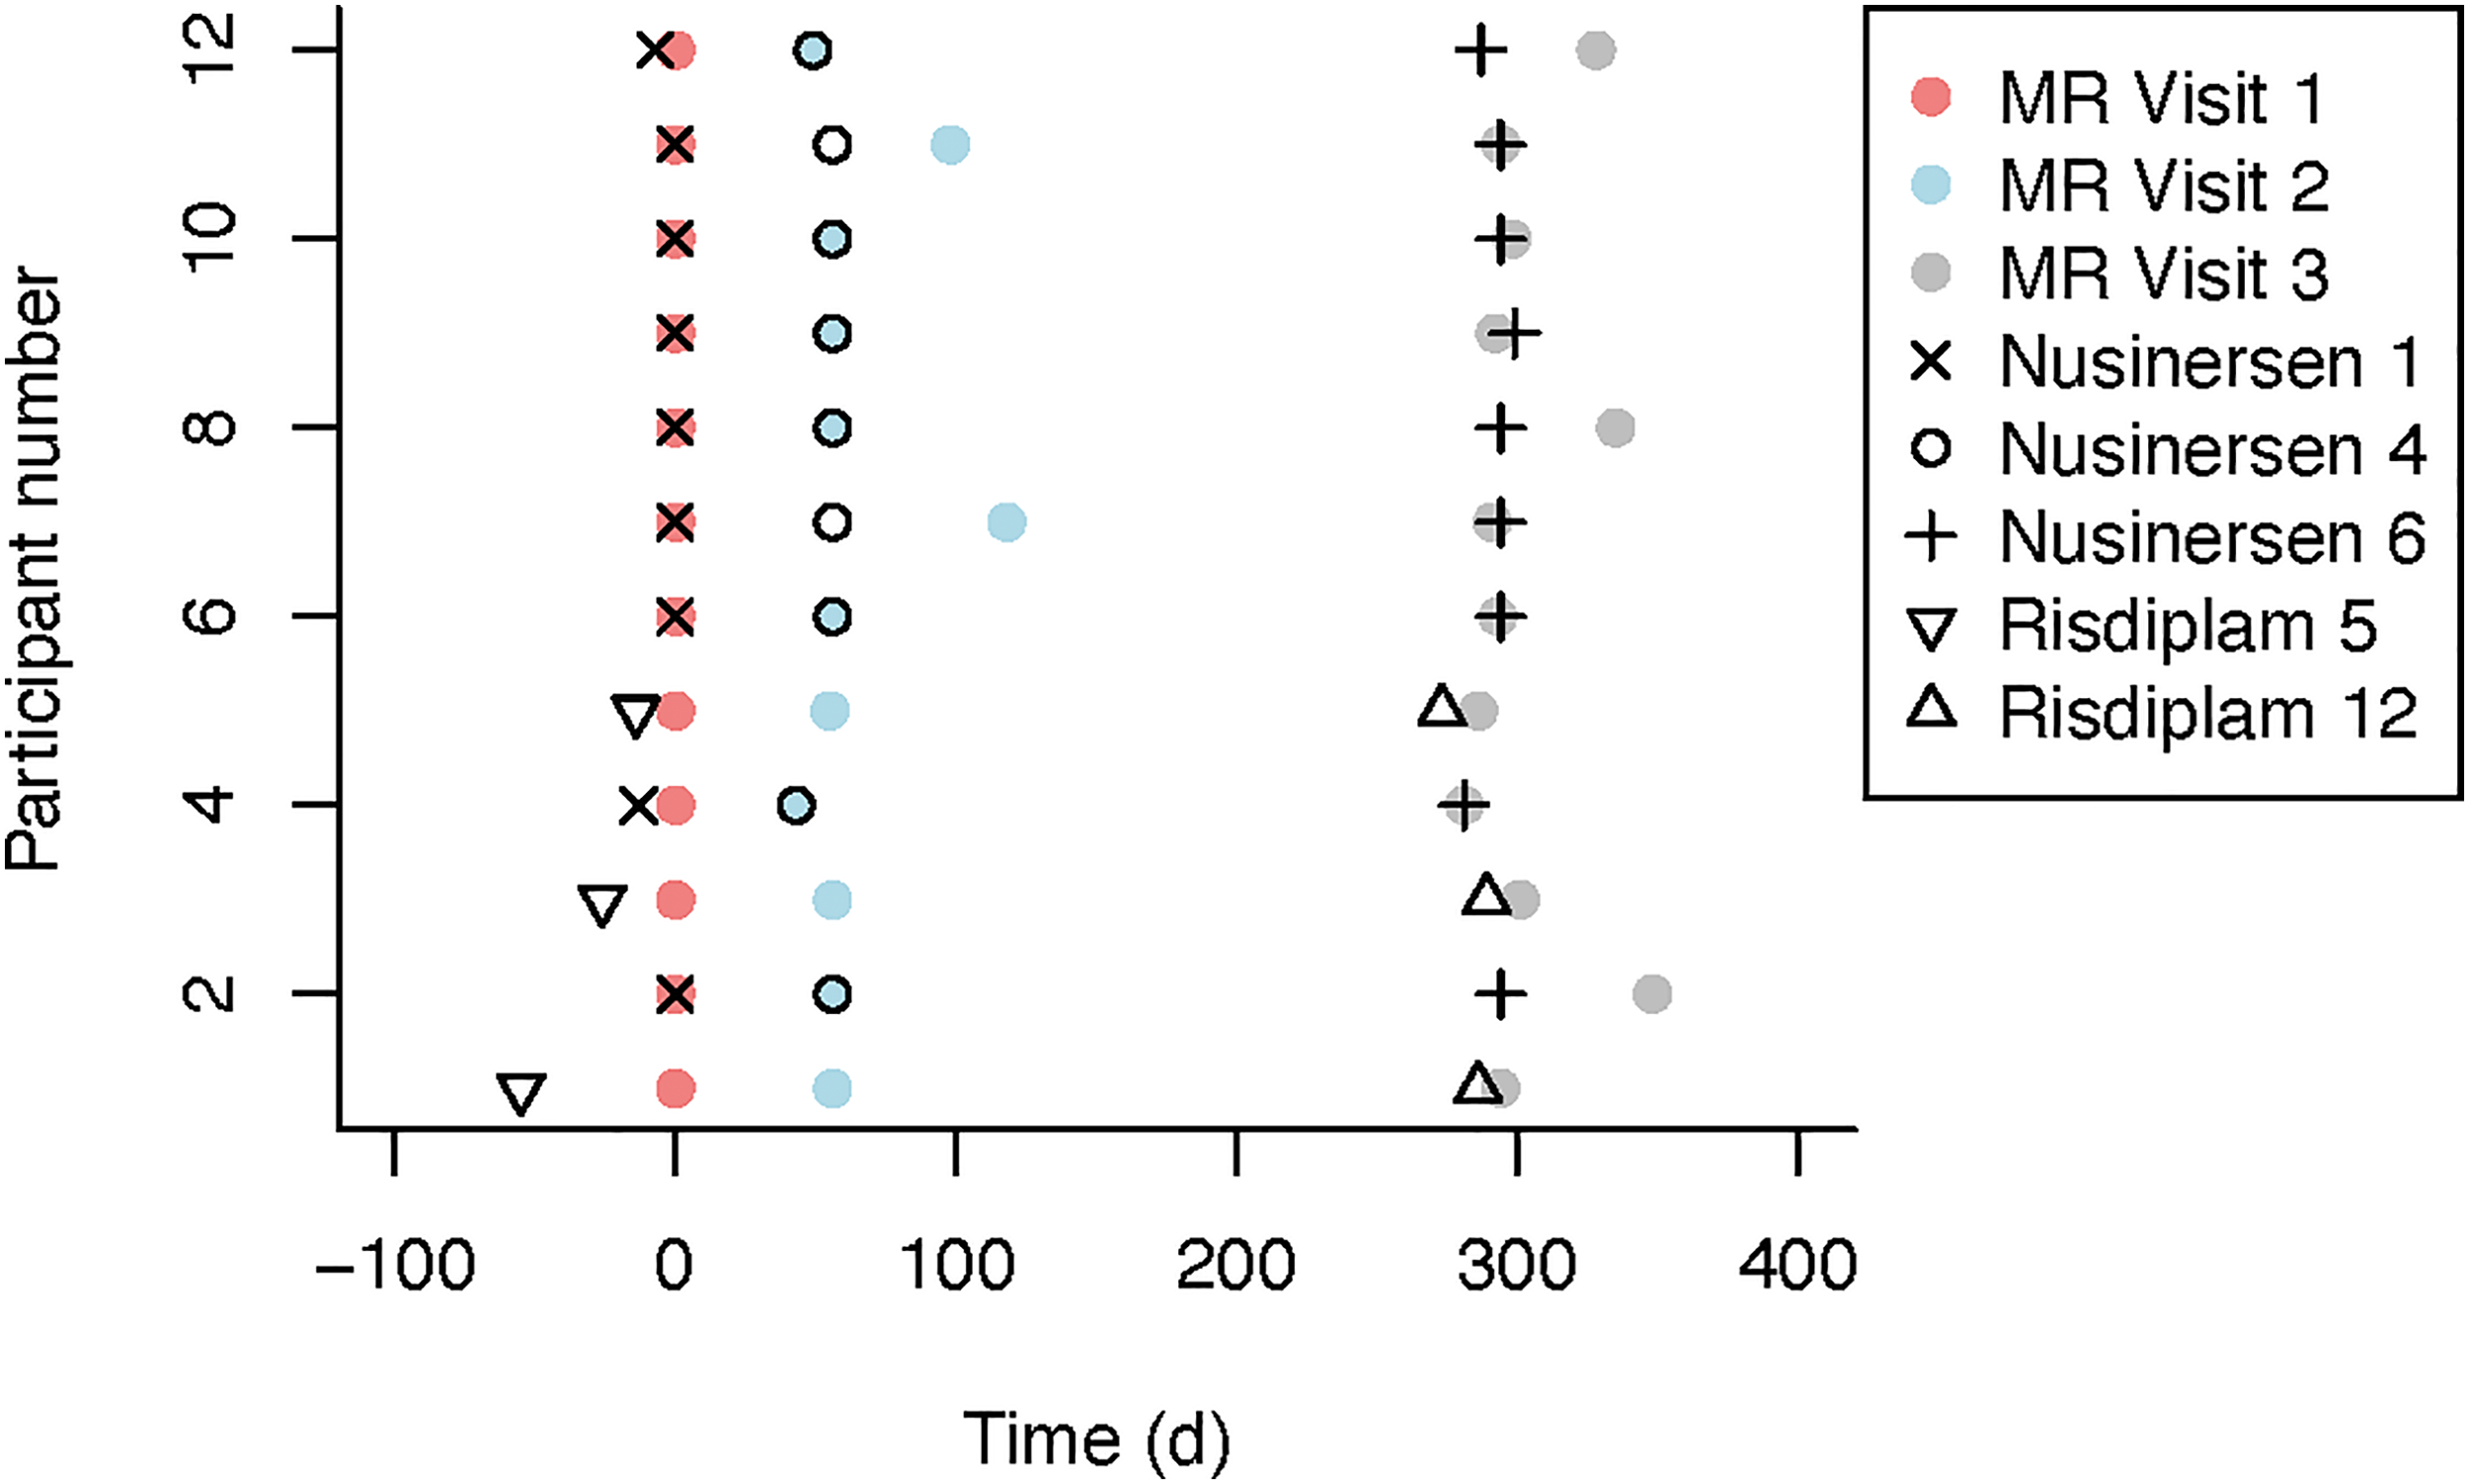
Overview of the timeline of MR visits 1 to 3, combined with the regular hospital visits of Nusinersen or Risdiplam treatment for all participants.
Response to DMT
At MR visit 1, median BB MVC and TB MVC were 39 N (IQR 24–255) and 13 N (IQR 7–31), respectively (Table 2). Using the ≥20% MVC criterion, comparison of absolute TB MVC at baseline and 10 months after DMT identified four responders and six non-responders. For BB, no patient reached the response threshold. Figure 3 shows the absolute and relative changes in MVC after approximately 10 months of DMT for the responders and non-responders to DMT. On a group level, absolute and relative TB MVC in responders was increased after approximately 10 months of DMT compared to non-responders (p = 0.0381 and p = 0.0095, respectively). No group comparisons were possible for BB (ten non-responders vs. zero responders).
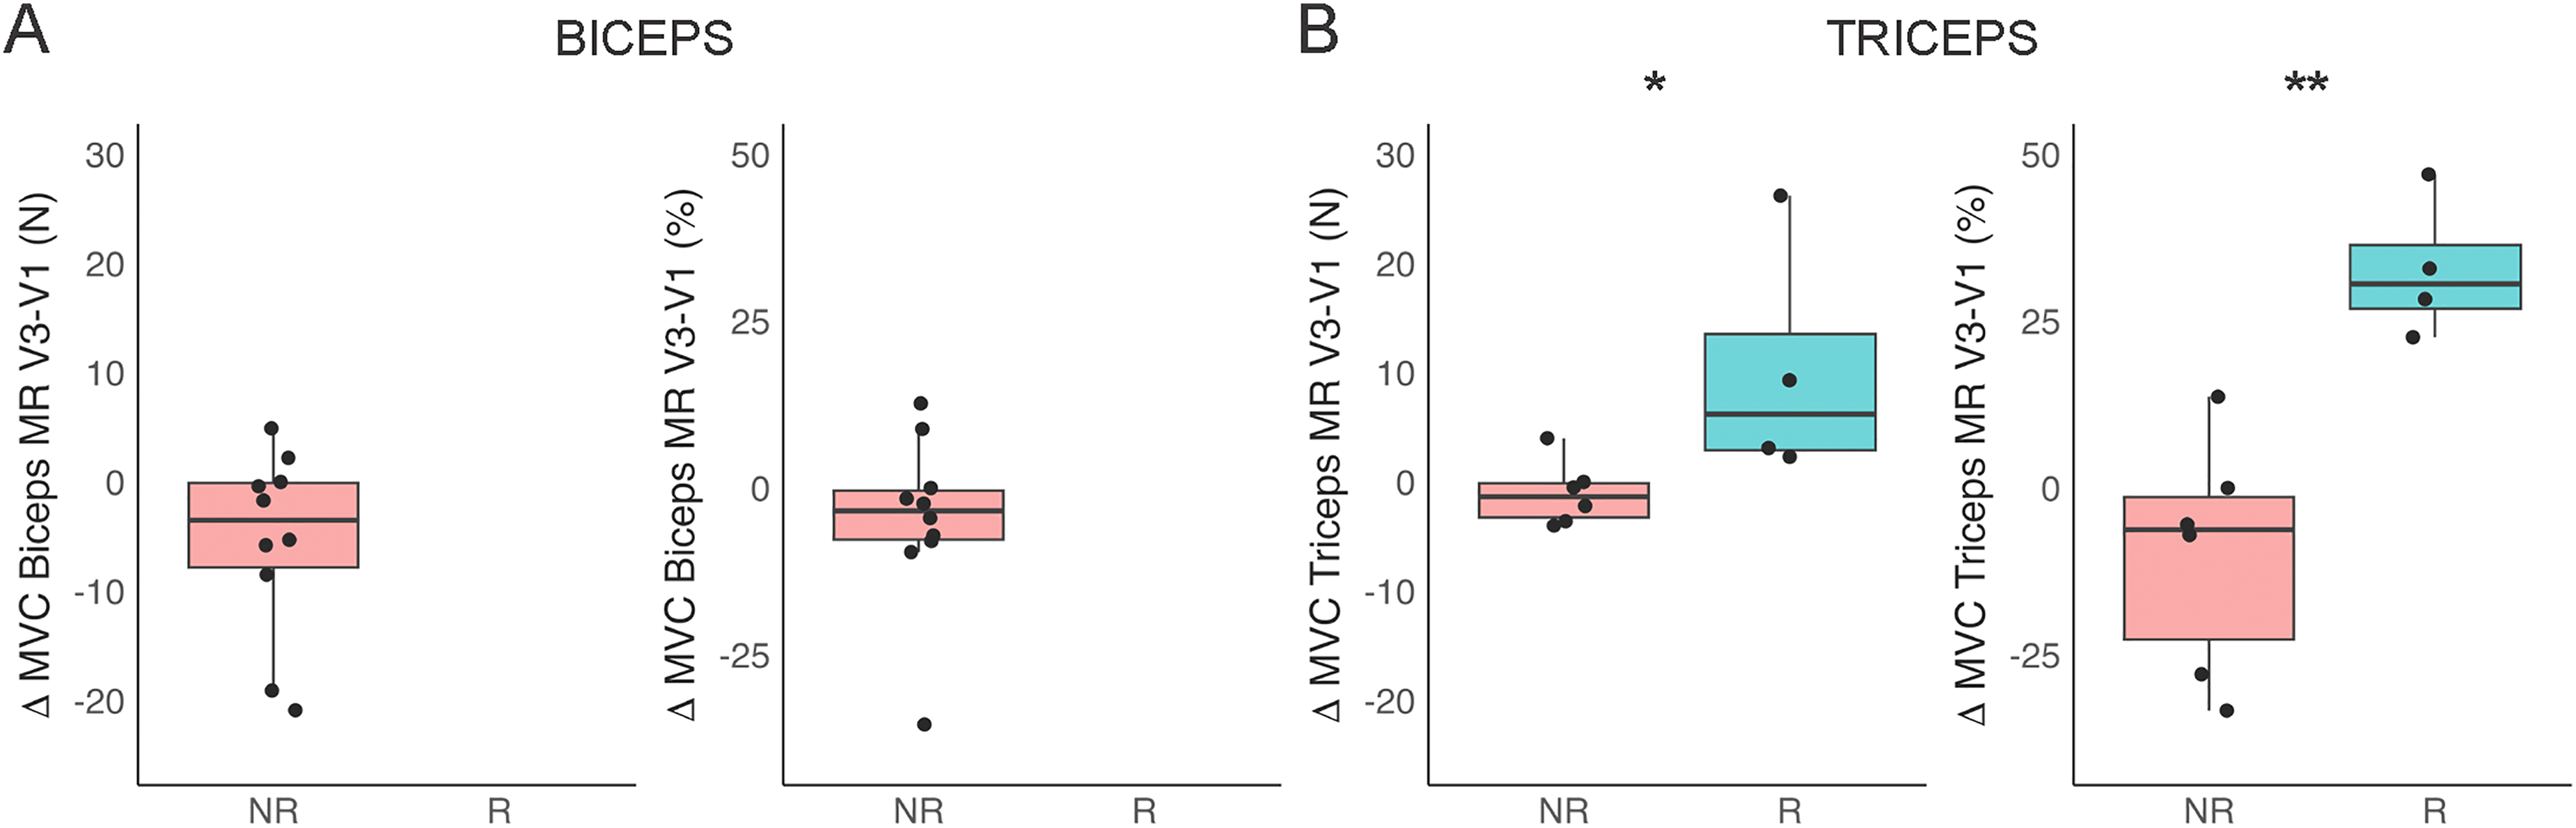
A) Absolute [N] and relative (%) change in maximal voluntary contraction (MVC) in the m. biceps brachii between magnetic resonance visit 1 (MR V1) and MR V3 for responders (R) and non-responders (NR).
Longitudinal data of muscle function and motor function measures.
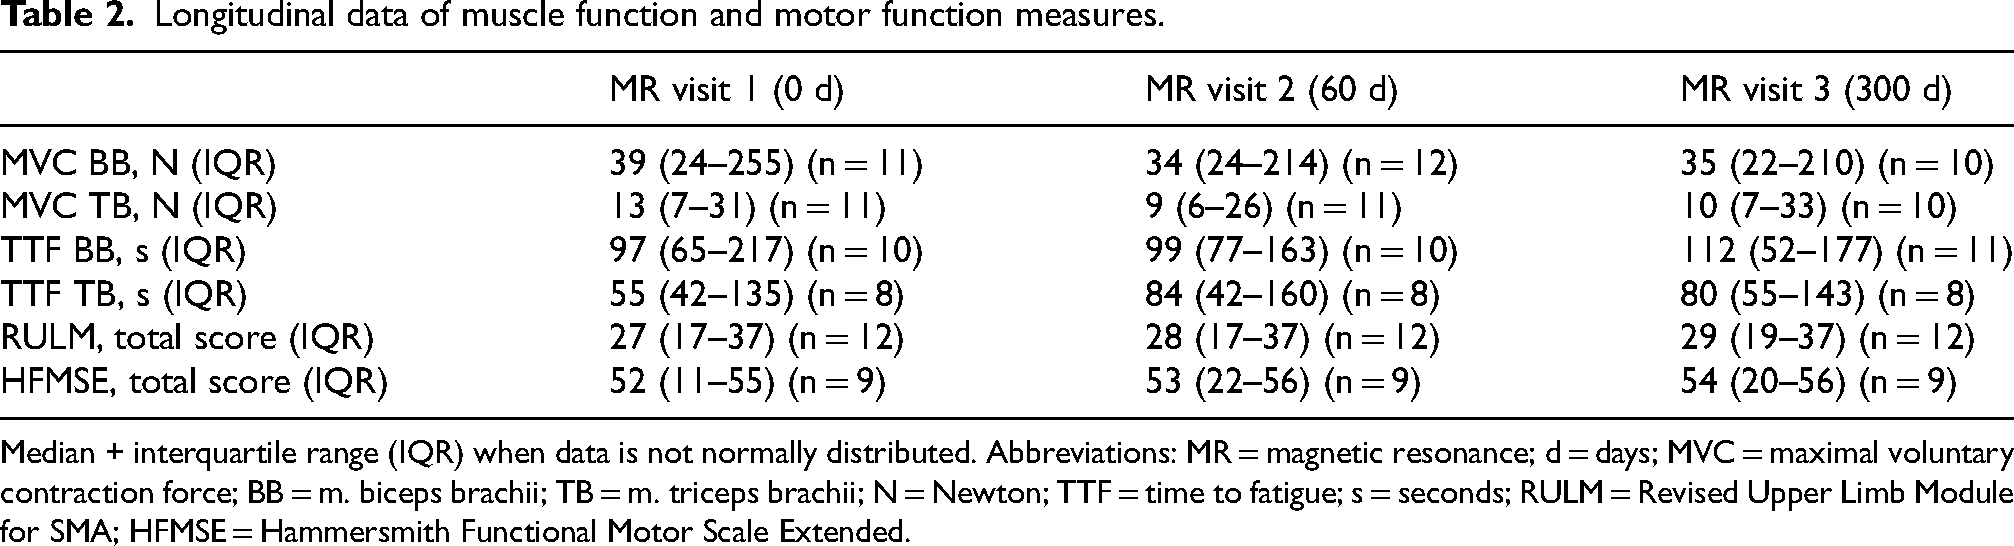
Median + interquartile range (IQR) when data is not normally distributed. Abbreviations: MR = magnetic resonance; d = days; MVC = maximal voluntary contraction force; BB = m. biceps brachii; TB = m. triceps brachii; N = Newton; TTF = time to fatigue; s = seconds; RULM = Revised Upper Limb Module for SMA; HFMSE = Hammersmith Functional Motor Scale Extended.
The participants showed a median HFMSE total score of 52 (IQR 11–55) and a median RULM total score of 27 (IQR 17–37) at the start of this study. Using the ≥2-point increase criterion on the RULM, we identified three responders and nine non-responders to DMT.
During the dynamic supine upper arm exercise test at MR visit, the median time to fatigue was 97 s (IQR 65–217) and 55 s (IQR 42–135). This measure did not show a significant change at MR visit 3 compared with MR visit 1 for both the BB and TB (Table 2).
In vivo 31P MRS observations
Figure 4A shows representative in vivo 31P MR spectra of the BB of a patient in the studied cohort recorded at rest, during exercise, and subsequent recovery. The corresponding quantitative time courses of concentration dynamics for PCr, Pi, and intramuscular pH are shown in Figure 4B. A total of 54 31P MRS datasets were recorded from the BB and TB. Of these, 48 (89%) met the signal-to-noise ratio (SNR) of ≥3, resulting in ten and five complete longitudinal datasets for the BB and TB, respectively. The median PCr depletion of MR visits 1 and 3 is 77.3% (IQR 60.3–92.7) and 46.9% (IQR 27.6–71.7) for the BB and TB, respectively. The median pH end exercise of MR visits 1 and 3 are 6.9 (IQR 6.5–7.0) and 6.8 (IQR 6.5–6.9) for the BB and TB, respectively. The median PCr 95RT end-exercise of MR visits 1 and 3 are 180.6 s (IQR 71.3–359.6) and 171.6 s (IQR 83.5–289.9) for the BB and TB, respectively.

Dynamic in vivo 31P MR spectra of the proximal arm musculature of patients with SMA during rest, exercise, and recovery.
Correlations between functional and metabolic biomarkers of muscle quality
MVC positively correlated with the motor function tests RULM and HFMSE for the BB (r = 0.838, p = 3.9e−6 and r = 0.780, p = 5.1e−5, respectively) and the TB (r = 0.622, p = 0.0058 and r = 0.901, p = 3.4e−7, respectively). Correlations between MVC and 31P MRS outcome measures of MR visit 1–3 are shown in Figure 5A-C. For BB, MVC correlated positively with 31P MRS outcomes PCr depletion (r = 0.840, p = 3.6e−6) and PCr 95RT (r = 0.635, p = 0.0026), and negatively with muscle pH end-exercise (r = −0.754, p = 0.00012). For the TB, MVC correlated positively with PCr depletion (r = 0.739, p = 0.00046) and PCr 95RT (r = 0.516, p = 0.028), and negatively with muscle pH end-exercise (r = −0.520, p = 0.027). No significant longitudinal correlations between MVC and 31P MRS measures across MR visit 1 and MR visit 3 were observed (Figure 5D-F). Therefore, the subjects who improve more in MVC do not show greater metabolic changes over time.
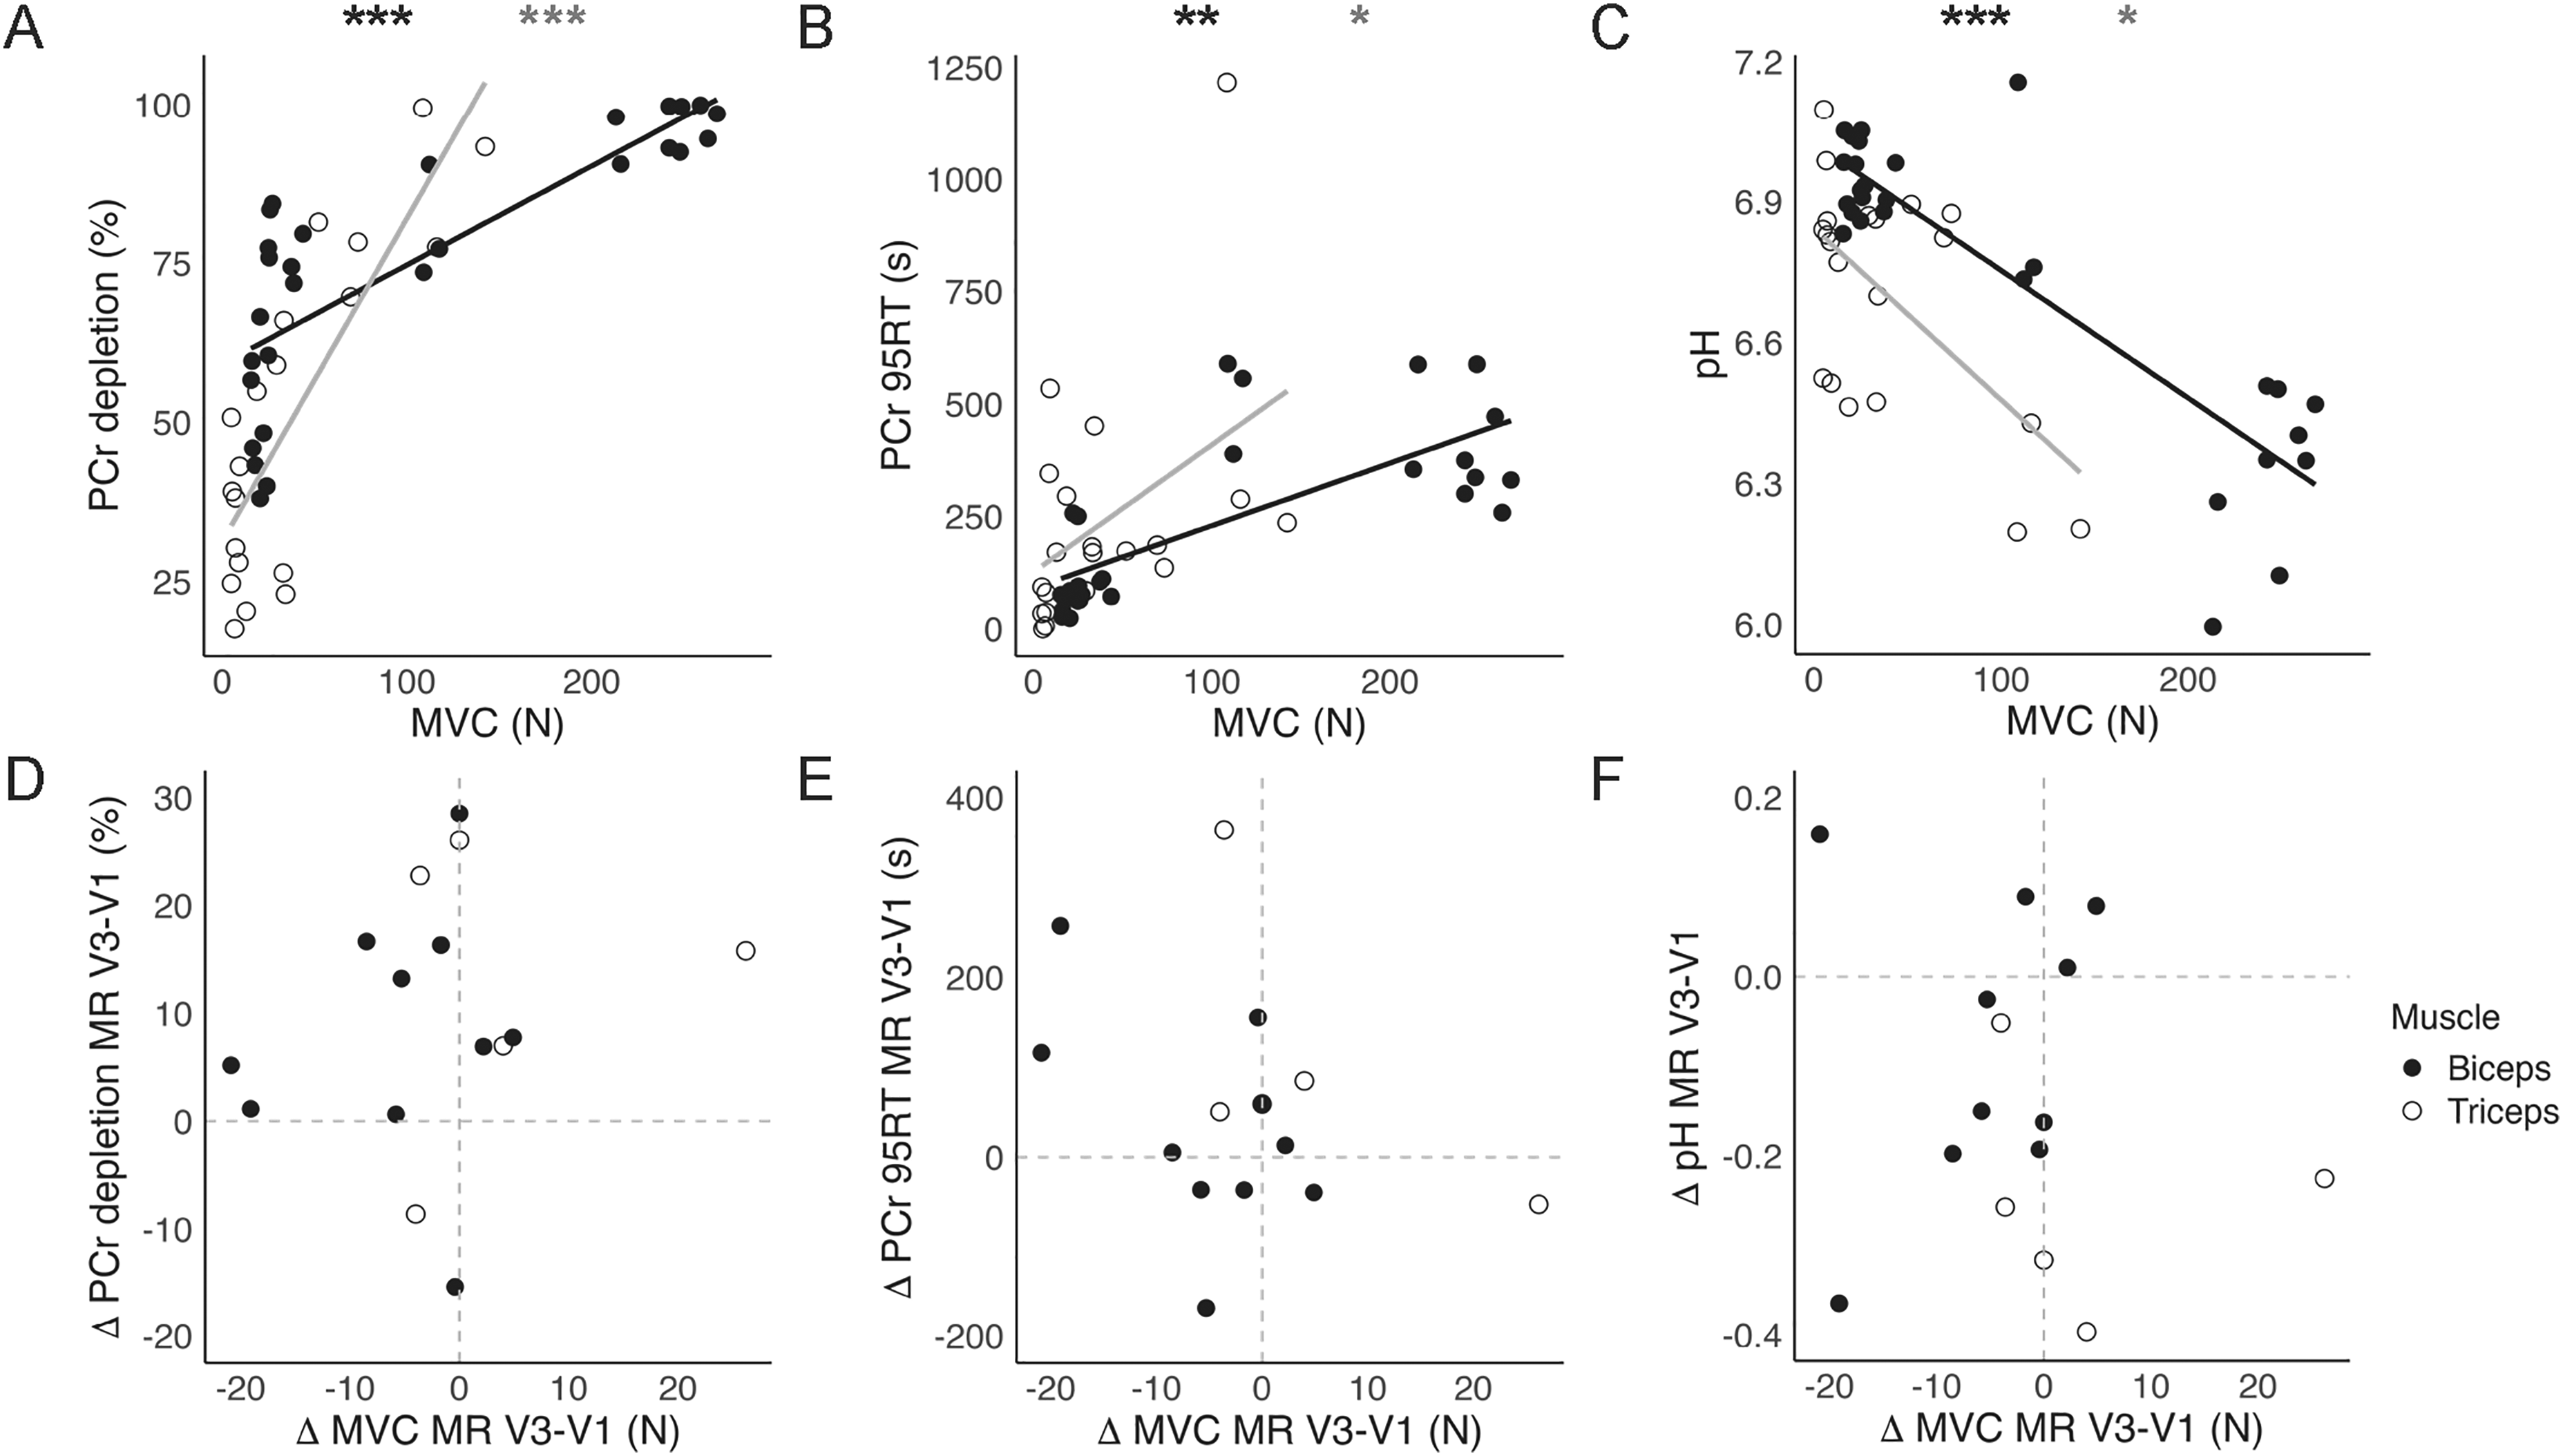
Linear correlation plots of the functional measure maximal voluntary contraction (MVC), measured with hand-held dynamometry, and magnetic resonance spectroscopy (31P MRS) outcomes of MR visits 1-3 data. The data of the m. biceps brachii (BB) are visualized in black and a closed circle, and the data of the m. triceps brachii (TB) with grey and an open circle. A) Correlation plot between MVC and phosphocreatine (PCr) depletion for the BB (r = 0.840, p = 3.6e−6) and TB (r = 0.739, p = 0.00046). B) Correlation plot between MVC and PCr 95% recovery time (PCr 95RT) for the BB (r = 0.635, p = 0.0026) and TB (r = 0.516, p = 0.028). C) Correlation plot between MVC and muscle pH end-exercise for the BB (r = −0.754, p = 0.00012) and TB (r = −0.520, p = 0.027). D) Longitudinal correlation plot between delta MVC and delta PCr across MR visit 1 and MR visit 3 for the BB (r = 0.212, p = 0.560) and TB (r = 0.200, p = 0.783). E) Longitudinal correlation plot between delta MVC and delta PCr 95RT across MR visit 1 and MR visit 3 for the BB (r = −0.333, p = 0.349) and TB (r = −0.300, p = 0.683). F) Longitudinal correlation plot between delta MVC and delta muscle pH across MR visit 1 and MR visit 3 for the BB (r = 0.188, p = 0.608) and TB (r = −0.400, p = 0.517). *p < 0.05, **p < 0.01, ***p < 0.001.
Identifiability of responders versus non-responders to DMT by metabolic biomarkers
We tested whether metabolic biomarkers of muscle quality assessed by 31P MRS may identify responders and non-responders to DMT.
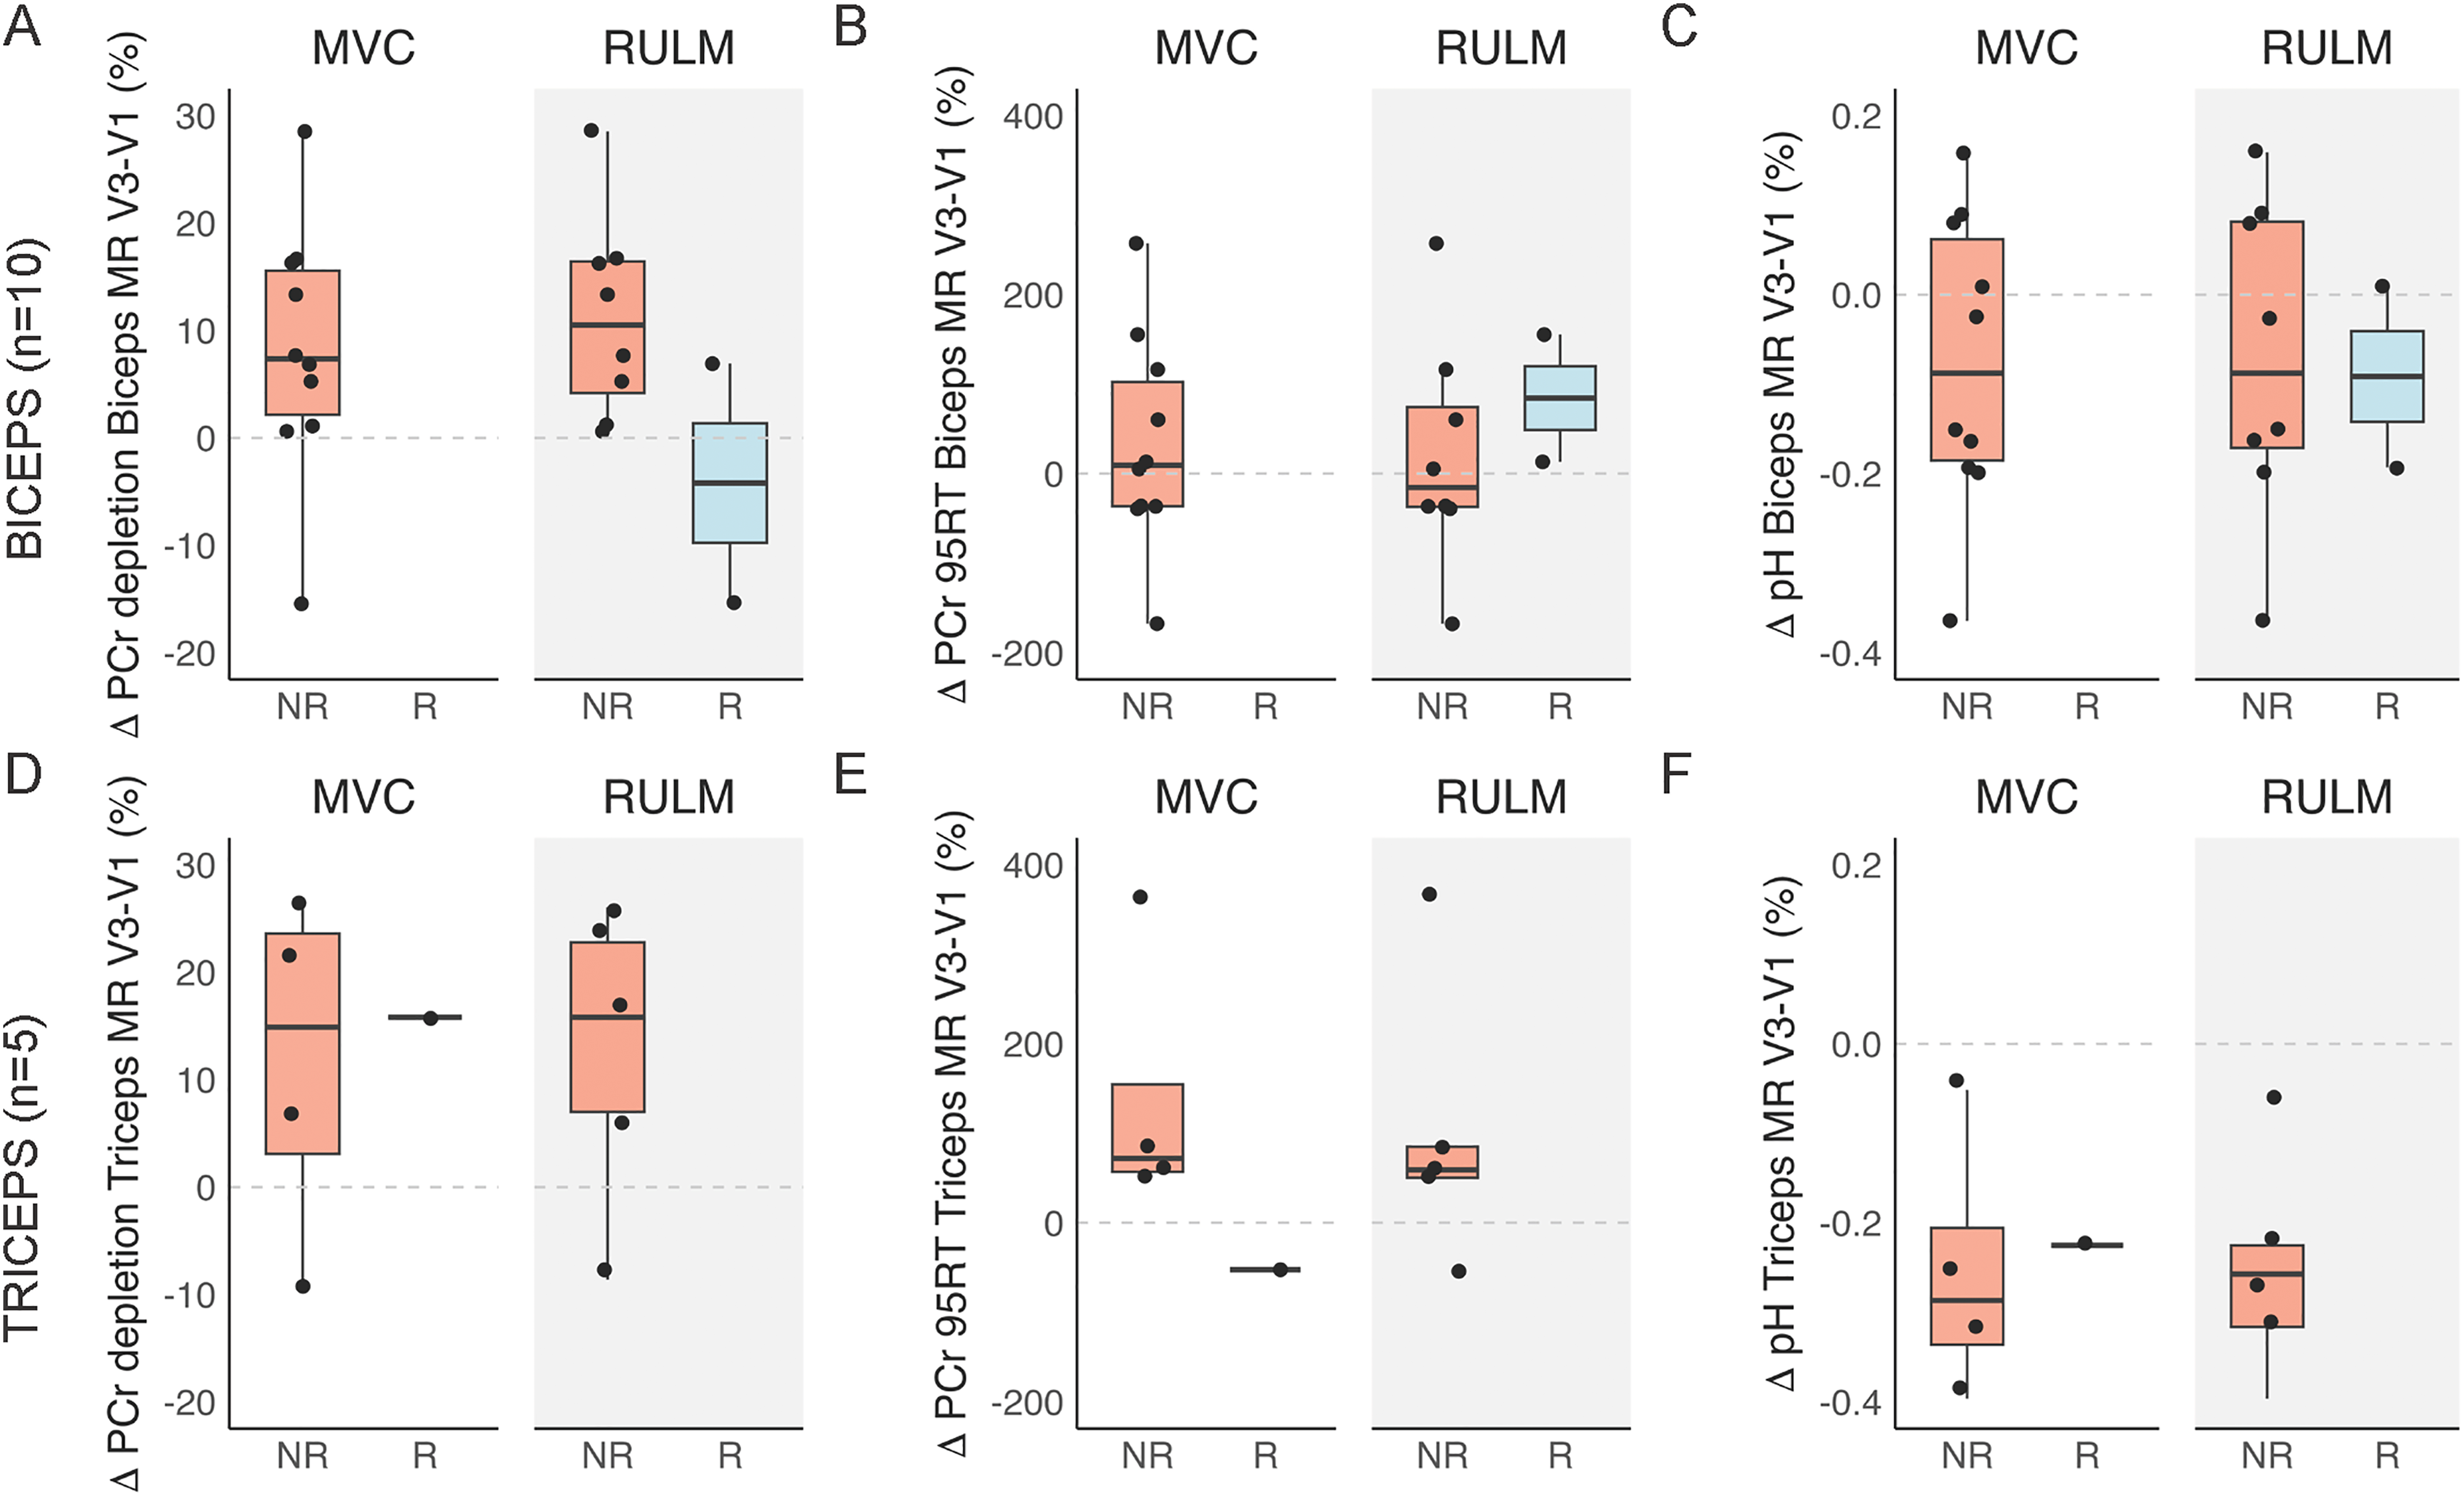
Comparison of the change in 31P MRS outcomes between MR visits 1 and 3 for the m. biceps brachii (BB) and m. triceps brachii (TB) for the responders (R) and non-responders (NR) to disease-modifying treatment (DMT). The R and NR distribution is based on a minimal gain of 20% in MVC for the BB or TB (left white panel) and a minimal gain of 2 points on the RULM total score (equal for BB and TB, right grey panel). The dashed grey line indicates no change between MR visit 1 and MR visit 3. A) Difference in phosphocreatine (PCr) depletion during exercise between MR visits 1 and 3 between R and NR to DMT for BB and TB muscles. B) Difference in PCr 95% recovery time (95RT) following exercise between MR visits 1 and 3 between responders and non-responders to DMT for BB and TB muscles.
Discussion
Three disease-modifying treatments for SMA introduced in the past decade have transformed the prognosis of children with this severe condition. Treatment effects vary, in particular in patients with longer disease duration. Therefore, there is an increasing need for sensitive predictive biomarkers of muscle function to identify individuals more likely to experience the effects of DMT. We previously demonstrated that non-invasive dynamic in vivo 31P MRS interrogation of working upper-arm muscles can inform on muscle quality regarding motor unit profile and mitochondrial oxidative capacity in patients with SMA. 22 In this longitudinal prospective study, we investigated whether 31P MRS metabolic biomarkers correlate with muscle function and, if so, whether these metabolic parameters can identify responders versus non-responders to DMT. Below, we discuss our findings and how they may impact the design and follow-up of DMT in patients with SMA.
The findings of responders versus non-responders to DMT, based on muscle strength
In this study, a responder to DMT was defined as a patient exhibiting an increase of ≥20% of MVC after 10 months of DMT. 31 MVC measured with hand-held dynamometry is known to be a highly reliable measure in patients with SMA.38,39 We observed a 40% and 0% responder rate to DMT for the TB and the BB, respectively. This discrepancy in responder rate may relate to the pattern of affected and spared muscles in SMA, e.g., the BB is more preserved in comparison to the TB.22,40 The observation of selective muscle sparing in SMA remains poorly understood.41–43 The higher responder rate for the TB may indicate greater DMT efficacy in more affected muscles. In a previous study, the improvement of muscle strength measured with the Medical Research Council (MRC), was not different for the TB and BB after 14 months of treatment with Nusinersen in adult patients with SMA (n = 15). 40 Therefore, further research is needed to conclude the muscle-specific efficacy of DMT in SMA.
Other studies in SMA have used the clinically meaningful improvement of ≥2 RULM or ≥3 HFMSE points on the total score as a responder criterion.44,45 Using this criterion, 3/12 (25%) and 4/9 (44%) of our patients qualified as responders to treatment by the RULM and HFMSE scores, respectively (eFigure 1
We did not study the influence of age or treatment regimen on the treatment effects as of the limited cohort size. No clear associations have previously been found between disease duration and the treatment effects of Nusinersen in adolescents and adults with SMA. 49 Moreover, a limitation of this study is that we did not monitor the physical therapy of the individuals during the study, as this may affect muscle or motor function over a longer period. 50 In future studies, it is recommended to take this into account.
The potential of metabolic biomarkers assayed by 31P MRS to identify responders versus non-responders
We observed a strong correlation between 31P MRS outcomes and functional measures of the upper-arm muscles of patients with SMA (Figure 5A-C and eFigure 2). This supports our hypothesis that in responders, based on ≥20% MVC improvement at 10 months, changes in 31P MRS outcomes should be detectable. However, in this limited cohort, no significant correlations between within-subject changes in MVC and corresponding changes in 31P MRS measures were observed (Figure 5D-F). Additionally, we compared the outcome using the more clinically established responder criteria of a 2-point increase on the RULM score. Here, we selected RULM rather than HFMSE, as RULM has a better correlation with upper-arm functioning than HFMSE. Specifically, we reasoned that the improvement in MVC or RULM score in responders would reflect enhanced recruitment of FT myofibers, which produce more force and power than ST myofibers. 50 Given the differences in ATP cost per twitch, mitochondrial density, and capillary contact density among these myofiber phenotypes, this altered recruitment pattern was expected to influence muscle energetics during exercise. Responders were hypothesized to deplete more PCr, acidify more, and/or recover metabolically slower during the execution of the same physical task at visit 3 compared to visit 1. 18 This was anticipated despite the fixed submaximal workload, as the increased MVC would allow responders to sustain the task for a longer duration before reaching exhaustion, thereby increasing the total energetic demand and enhancing FT fiber involvement. Unfortunately, we were unable to test this hypothesis because of an insufficient number of complete 31P MRS datasets (Figure 6). The enrollment of patients coincided with the COVID-19 pandemic, which severely limited the number of patients who eventually enrolled. Additionally, there was a substantial, almost bimodal variability in muscle weakness among the patients who did enroll, also visible in Figure 5. Consequently, on the one hand, the strong patients were limited to a maximum of 5000 g of weight during the MR exercise protocol, which may be below their 80% peak workload. On the other hand, some patients were limited in their strength to perform the MR exercise protocol (Table 2). Moreover, pronounced muscle atrophy in weaker patients likely reduced 31P MRS SNR, increasing variability in the PCr quantification.
Potential of in vivo 31P MRS as a generic non-invasive method to guide DMT trials
In vivo 31P MRS has the potential to guide DMT trials, as we observed strong correlations between MVC and the three metabolic biomarkers. There are two reasons why we could not objectify our hypothesis that 31P MRS has merit in this matter. Firstly, the narrow-bore MR scanner we used (forced by circumstance) was not suited for these patients with physical disabilities. If available, we would recommend using a wider bore (70 or 80 cm) MR scanner rather than the 60 cm bore MR scanner used in this study to better accommodate patients with SMA with arm contractures. Secondly, the in-magnet exercise protocol was, in retrospect, too demanding; only six patients completed the protocol for both muscles, leaving insufficient power for statistical testing. Future studies should consider lower contraction frequencies or mechanical loads below 80% MVC with a single-arm ergometer. This is based on our observation that in some patients, this combination of contraction frequency and load caused a progressive shift from a dynamic to a more isometric nature of the contraction as muscle fatigue set in. The latter was evidenced by a general upfield shift of the Pi resonance rather than Pi ‘peak-splitting’ dynamics previously observed in working upper arm muscles as the exercise progressed. 22 The former indicates the onset of generic muscle acidification as a result of compromised blood flow, typically associated with isometric contractions at high frequencies and loads. 18 However, this is not in line with the low post-exercise muscle pain scores reported by the patients (0.8/10 BB, 0/10 TB). With acidification, higher muscle pain scores are expected.
Despite these limitations, we observed a high test-retest reliability for resistance and time to fatigue of the MR exercise test using our MR-compatible ergometer, to provide a quantitative assessment of ATP metabolism in both affected (TB) and relatively spared (BB) muscles of the upper arm (eTable 1). Compared to ergometers in earlier studies,22,52 this novel ergometer enabled the selective mechanical loading of individual BB and TB muscles, allowing targeted investigation of affected versus spared muscles in neuromuscular diseases.
Conclusion
This study longitudinally assessed disease-modifying treatment in patients with SMA using 31P MRS. Our MR platform for single arm-muscle exercise offers a non-invasive tool to monitor genetic treatment response, both in ambulatory as well as non-ambulatory patients with SMA. MVC correlated significantly with 31P MRS metabolic measures of PCr depletion, pH end-exercise, and 95% PCr recovery time post-exercise, in both the m. biceps brachii and m. triceps brachii. Further studies involving larger patient populations will be necessary to establish the diagnostic value of 31P MRS in evaluating DMT efficacy in SMA and other neuromuscular diseases.
Footnotes
Abbreviations
Acknowledgements
We thank all participants in this study for their willingness and commitment.
ORCID iDs
Ethical considerations
The study was conducted according to the principles of the Declaration of Helsinki, the code of conduct, and in accordance with the Medical Research Involving Human Subjects Act (WMO). The Medical Research Ethics Committee Utrecht (METC Utrecht) approved this study based on the requirements of the WMO (NL69612.041.19).
Consent to participate
Written informed consent was obtained from the participants before data collection.
Funding
This study was funded by Health∼ Holland and Stichting Spieren voor Spieren. The funding parties were not involved in the design of the study, the collection, analysis, and interpretation of the data, nor in writing the manuscript.
Declaration of conflicting interests
The authors declared no potential conflicts of interest with respect to the research, authorship, and/or publication of this article.
Data availability
The data that support the findings of this study are available from the corresponding author (B.B.) on formal request.