
Abstract
Introduction:
Myotonic dystrophy type 1 (DM1) patients show both structural and functional brain alterations, including abnormal resting-state (RS) functional connectivity. Although some studies have investigated RS functional connectivity in DM1, methodological differences make it challenging to draw consistent conclusions.
Objectives:
This study aims to analyze 1) RS functional connectivity in DM1 patients compared to healthy controls (HC), 2) graph theory metrics, 3) longitudinal connectivity variations, and 4) the relationship between connectivity and clinical, cognitive, and structural brain data.
Methodology:
Twenty-one DM1 patients and 21 matched HCs underwent 3 T MRI scans, including RS fMRI. Of these, 15 DM1 patients and 13 HCs participated in the follow-up after 3 years. Additionally, DM1 patients underwent baseline clinical, molecular and cognitive assessments. Functional connectivity analysis (ROI-to-ROI) and graph theory measures were employed. Longitudinal changes in connectivity were examined, and total hyperconnectivity and hypoconnectivity values were calculated to explore correlations with clinical, brain, and cognitive correlates.
Results:
DM1 patients showed widespread hyperconnectivity compared to HCs. Although no statistically significant differences were found in graph theory measures, patients tended to show decreased efficiency, strength, and clustering (with moderate effect sizes). Patients remained hyperconnected over time, with a progression similar to HCs. Hyperconnectivity was associated with more severe disease, greater muscular impairment, and molecular defects, as well as lower cognitive performance. Conversely, hypoconnectivity was associated with less severe disease.
Discussion:
DM1 patients are characterized by brain hyperconnectivity and a less efficient brain network organization. Hyperconnectivity is discussed as a compensatory mechanism and is suggested as a disease severity marker.
Introduction
Myotonic dystrophy type 1 (DM1), also known as Steinert's Disease, is a hereditary neuromuscular disease transmitted in an autosomal dominant manner. Its diagnosis is confirmed by a molecular defect characterized by the instability of the cytosine thymine guanine (CTG) triplet (>50 CTG repetitions), which is associated with disease severity.1–3
DM1 affects various body systems, including the central nervous system (CNS), leading to symptoms such as fatigue, apathy, hypersomnolence, a variety of cognitive deficits, and brain alterations.4,5 A recent systematic review on brain involvement in DM1 reported structural and functional alterations, 6 including widespread white matter (WM) and gray matter (GM) involvement, progressive WM disconnectivity,7,8 and abnormal resting-state functional connectivity.
Resting-state functional MRI (fMRI) studies enable the investigation of overall brain function and connectivity beyond structural changes. The principle of fMRI is based on blood oxygen level-dependent (BOLD) signal fluctuations, operating under the premise that activated neuronal populations require more energy, leading to increased blood flow and oxygen supply to the brain. 9
Functional connectivity refers to the synchronous fluctuations in activity between certain brain regions, even in the absence of direct structural connections, 10 indicating a form of coordination or communication between these areas. Functional connectivity, derived from similar fluctuations in the BOLD signal between regions, and structural connectivity, established through axonal connections across white matter, provide different interaction patterns and require distinct MRI sequences and processing methods. 11
One widely used strategy for functional connectivity analyses is seed-based correlation analysis. This method involves using the BOLD activity of a specific brain region as a seed and calculating the correlation between each voxel or region in the brain with this seed, generating a connectivity pattern from the seed to the rest of the brain. By using all brain regions as seeds, it is possible to create a functional connectivity matrix illustrating the activities of various regions that are correlated with each other. 12
To analyze these connectivity matrices, graph theory analyses have also gained attention. This methodology provides mathematical quantifications of the topological patterns in the graph, revealing several aspects of the complexity inherent in the interactions between brain regions, also known as brain networks. In graph theory, brain networks are represented as graphs consisting of nodes (brain regions) and edges (functional connections between these regions).13–15 By applying graph theory measures, such as global efficiency, strength, betweenness centrality, and clustering coefficient, it is possible to characterize the structure and function of these brain networks. 16
A few studies have investigated functional connectivity in DM1 using resting-state fMRI.17–21 However, the various analyses employed by these studies include power spectral density analysis, clustering analysis, amplitude of low-frequency independent component analysis, and network-based analysis, making it difficult to compare results and draw consistent conclusions.
While some studies reported decreased connectivity (hypoconnectivity) in certain brain networks in DM1 patients,17,21 others found overall increased connectivity (hyperconnectivity) in functional networks 18 or specific brain networks or nodes. 20 Only three studies have employed graph theory measures in DM1,21–23 and of these, two used structural MRI and resting-state electroencephalography (EEG), while only one employed resting-state fMRI.
The present study uses longitudinal data to address functional connectivity in DM1 and shed some light on the heterogeneity observed in previous studies in this population. By correlating findings from one point in time with those from later periods, we provide a dynamic characterization of changes in functional connectivity. To our knowledge, no longitudinal studies have examined resting-state functional connectivity variations in DM1. Additionally, despite the well-established association between brain alterations and cognitive deficits, there is a lack of research exploring the relationship between functional connectivity and cognitive deficits in DM1.
This study aimed to analyze, in DM1 patients, 1) the functional connectivity pattern in resting-state fMRI, 2) graph theory measures, 3) longitudinal changes and progression of connectivity patterns, and 4) the relationship between connectivity patterns and clinical (muscular, molecular), cognitive, and structural brain data.
Methodology
Participants
The study included 21 DM1 patients and 21 healthy controls (HC) matched according to sex and age. Of this initial sample, 15 DM1 patients and 13 HC participated in the follow-up, with a mean duration of 3.00 years (SD = 0.21). Patients were recruited from the outpatient clinics at the Neurology Department of the Donostia Hospital (San Sebastian), and healthy volunteers were recruited to form the healthy control (HC) group. Figure 1 presents a flow chart detailing the baseline and follow-up assessment samples.
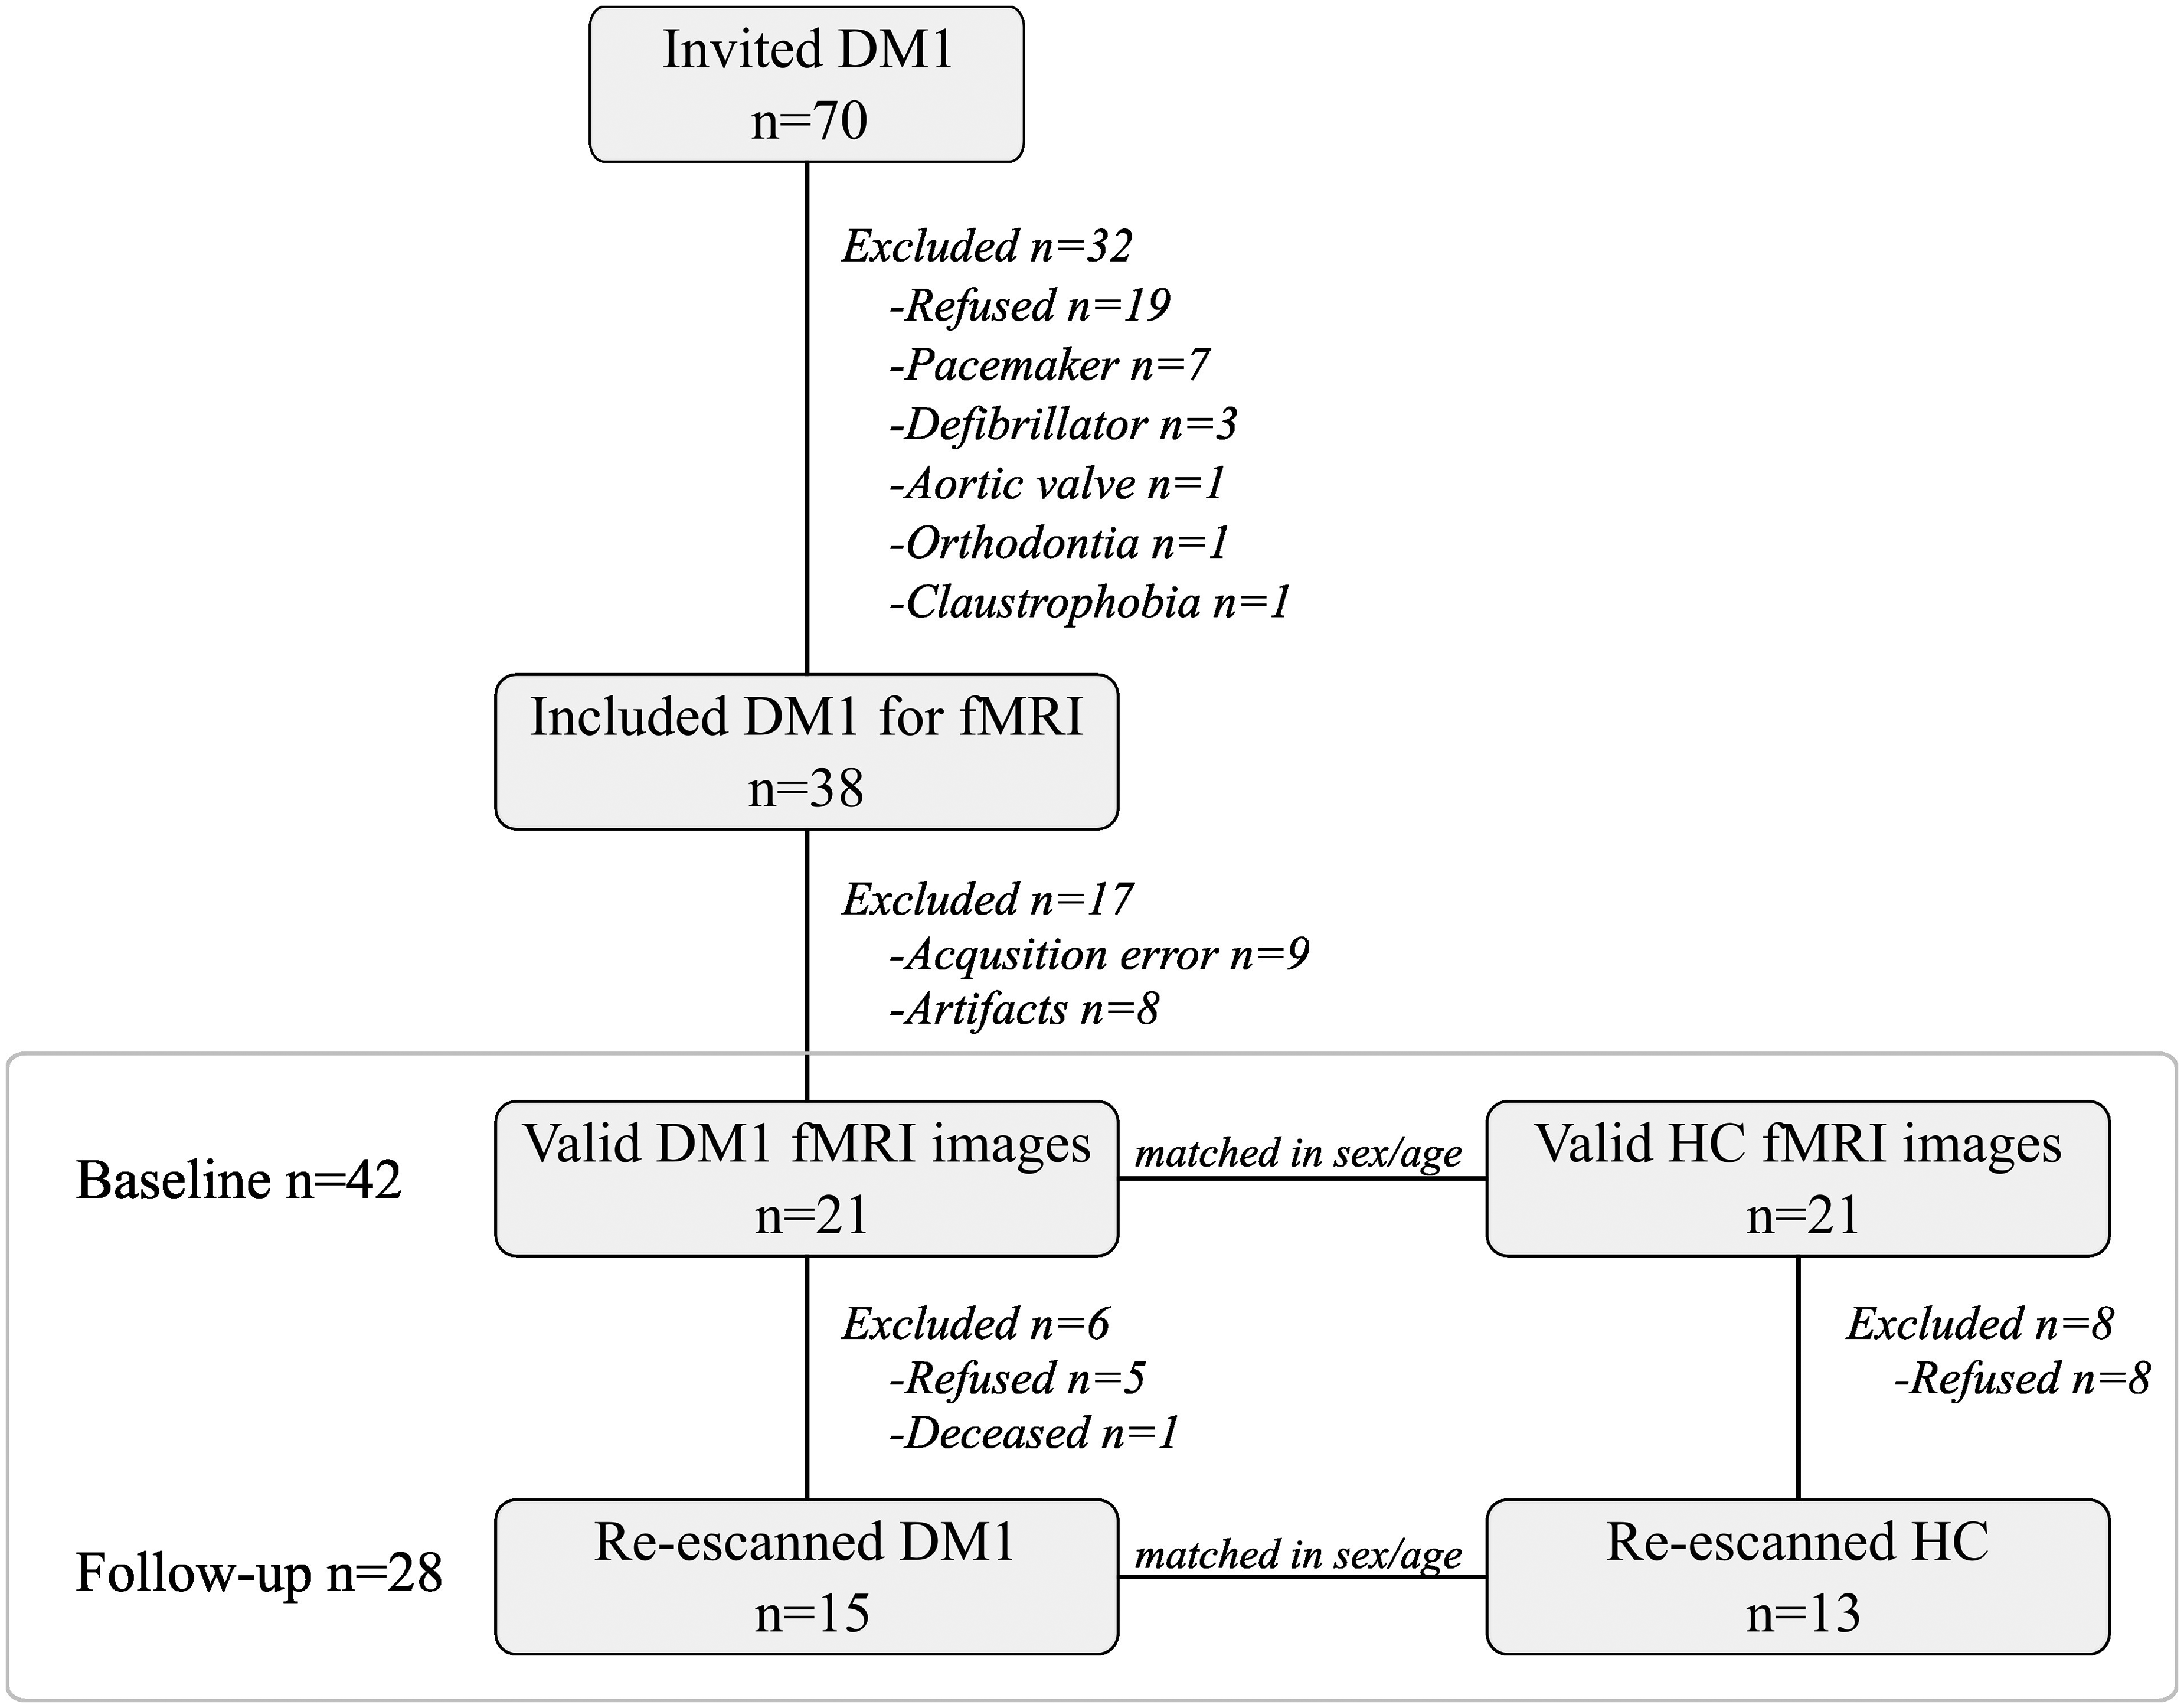
Flow chart showing the recruitment process from baseline to follow-up. Note. DM1 = Myotonic Dystrophy Type 1; HC = healthy controls; fMRI = functional magnetic resonance imaging.
All DM1 patients had a molecular confirmation of their clinical diagnosis. Patients with congenital and childhood phenotypes, considered qualitatively distinct phenotypes, 24 were excluded. Additional exclusion criteria for both DM1 and HC groups were: a) being under 18, b) having a comorbid psychiatric disorder (according to DSM-5 criteria), c) having a history of acquired brain damage or alcohol/drug abuse, and d) the presence of bodily paramagnetic devices that could compromise MRI safety and quality (e.g., pacemakers).
All participants underwent MRI scanning sessions, including resting-state fMRI. DM1 patients also received a neurological examination and a neuropsychological assessment close to the MRI acquisition date (the mean time between assessment and MRI was M = 0.58 years; SD = 0.36 at baseline, and M = 0.01; SD = 0.02 at follow-up).
All participants were informed of the objectives and details of the study, and they provided written informed consent. The study was approved by the Ethics Committee for Clinical Investigation of the Health Department of Gipuzkoa (DMRM-2017-01).
Assessment
Clinical assessment
DM1 patients’ muscular impairment was measured using the Muscular Impairment Rating Scale (MIRS) 25 by the neurologist of the group both at baseline and follow-up. The clinical form of DM1 was determined based on the age of onset of disease-related symptoms, and the inheritance pattern was obtained from the patients’ medical records.
Genetic CTG determination
A peripheral blood sample was collected at baseline to estimate CTG expansion size. CTG expansion size was determined through a genetic assessment of the DMPK gene isolated from circulating leucocyte DNA. PCR was used for DMPK alleles up to approximately 100 CTG repeats, and Southern blot analysis was conducted for larger expansions. This genetic assessment was performed only for patients with no recent data available (within the last 5 years).
Cognitive assessment
Patients underwent a comprehensive neuropsychological assessment at baseline and follow-up, which included various measures to evaluate five cognitive domains (attention/processing speed, memory, visuoconstruction, executive functions, and language) and the intelligence quotient (IQ). Detailed information on the complete neuropsychological battery can be found in the Supplementary data (Supplementary Table 1). All raw scores were converted into standardized T values according to the Spanish population-based norms for each test.
Neuroimaging assessment: acquisition and preprocessing
MRI was conducted on a 3 Tesla scanner (TrioTim, Siemens) at two time points. During the scans, participants were asked to remain still and awake. All scans were acquired using the same MRI scanner, and no hardware or software upgrades were made during the study period. A high-resolution 3D sequence of magnetization-prepared rapid acquisition with gradient echo (
For structural imaging, white matter (WM) and grey matter (GM) volumes, as well as total brain volumes, were estimated using Statistical Parametric Mapping (SPM) and the FMRIB Software Library (FSL). To assess white matter changes and the global cortical atrophy scale (GCA), the group's neuroradiologist visually rated the images, both at baseline and follow-up, using the Wahlund scale 26 and following the guidelines of the Image Analysis Center (IAC).
Regarding functional brain imaging, Matlab and the Brain Connectivity Toolbox (CONN) were used to preprocess and analyze the fMRI data. The default preprocessing pipeline in CONN 27 included functional realignment and unwarp, slice-timing correction, outlier identification, direct segmentation and normalization (standard MNI space), and functional smoothing with an isotropic Gaussian kernel (sigma of 8 mm). The same preprocessing procedure was applied at both baseline and follow-up.
Statistical analyses
Descriptive analyses
The SPSS (IBM SPSS Statistics 28) statistical package was used for the statistical analyses. Descriptive analyses were carried out to compare DM1 patients and HCs. Contingency analysis (Chi-square) was used for categorical data, while parametric (t-test) or non-parametric (Mann–Whitney U) tests were employed for quantitative data, as appropriate. Effect sizes were reported and interpreted as follows: Cohen's d: ≤ 0.49; small, 0.50–0.79 moderate; ≥ 0.80 large.
Functional connectivity analyses
The same methods were used to analyze MRI data from both baseline and follow-up. Both acquisitions were analyzed cross-sectionally (DM1 vs HC) and then longitudinally to assess potential changes in participants’ functional connectivity over time. All analyses were conducted using CONN 20b 28 and Matlab.
ROI-to-ROI analyses (cross-sectional analysis)
ROI-to-ROI analyses were conducted in CONN to compare connectivity patterns between DM1 patients and HCs. These analyses characterize connectivity between all ROI pairs within a pre-defined set of regions.
The selected regions were pre-defined by CONN and comprised 32 nodes across eight Resting State Networks: Default Mode Network (DMN), Sensorimotor, Visual, Salience, Dorsal Attention, Fronto-parietal, Language, and Cerebellar networks.
A ROI-to-ROI connectivity matrix was constructed, representing the level of functional connectivity between each pair of ROIs. The connectivity matrices for DM1 and HC were compared using the standard setting for cluster-based interferences included in CONN.
Graph theory analysis (cross-sectional analysis)
Graph theory measures, such as global efficiency, strength, betweenness centrality, and clustering coefficient, were obtained using CONN.
Global efficiency is a measure of integration, representing the average inverse shortest path length in the network, and is inversely related to the characteristic path length. 29 Strength is the sum of the weights of links connected to the node. Betweenness centrality is the fraction of all shortest network paths containing a given node. Nodes with high values of betweenness centrality participate in a large number of shortest paths. Finally, the clustering coefficient measures segregation, representing the fraction of triangles around a node. It indicates the fraction of a node's neighbors that are also neighbors of each other. 30
To examine differences between DM1 and HC in graph measures, t-tests were conducted in SPSS, and Cohen's d was calculated to assess effect sizes. Effect sizes were interpreted as small (d ≤ 0.49), moderate (d = 0.50–0.79), and large (d ≥ 0.80).
Hyperconnectivity/hypoconnectivity values (longitudinal analysis)
Hyperconnectivity and hypoconnectivity values were calculated using connectivity strength, representing the sum of a node's connectivity values. These values were derived from Pearson correlations, calculated separately for hyperconnected and hypoconnected links. All significantly hyperconnected and hypoconnected links were grouped separately at baseline and follow-up, resulting in distinct connectivity strength values for each type of link.
A repeated-measures ANOVA was conducted using SPSS to analyze longitudinal differences in these values between DM1 patients and HCs. This analysis was conducted for both intragroup and intergroup longitudinal comparisons.
Connectivity correlates: correlation analysis of total hyper/hypoconnectivity with clinical, brain, and cognitive variables
To explore the correlations between total hyperconnectivity and hypoconnectivity values and clinical, brain, and cognitive outcomes, Pearson's r was conducted for parametric data and Spearman's rs for non-parametric data using SPSS. Effect sizes were interpreted as small (r ≤ 0.29), moderate (r = 0.3–0.49), and large (r ≥ 0.5) for Pearson's r, and as small (rs ≤ 0.19), moderate (rs = 0.20–0.29), and large (rs ≥ 0.3) for Spearman's rs.
Results
Descriptive analyses
The sample consisted of 42 participants, including 21 DM1 patients (14 female, 66.7%) and 21 HCs matched according to sex and age. Among the DM1 patients, 11 were classified as adult-onset (52.4%), six late-onset (28.6%), and four juvenile-onset (19%). Paternal inheritance accounted for 71.4% of the DM1 sample, while maternal inheritance represented 14.3%. Inheritance pattern data for the remaining 14.3% was not available. Regarding the cognitive profile of DM1 patients, their mean estimated IQ was within the normal range, along with their performance in all cognitive domains. For further information, see Supplementary Table 2.
Table 1 shows the main demographic and clinical characteristics of the sample, as well as the volumes of GM and WM tissue and brain volume. Regarding structural brain MRI, DM1 patients showed significantly reduced brain volume and GM and WM tissue compared to HC (with moderate to large effect sizes).
Socio-demographic, clinical, and molecular characteristics according to group.
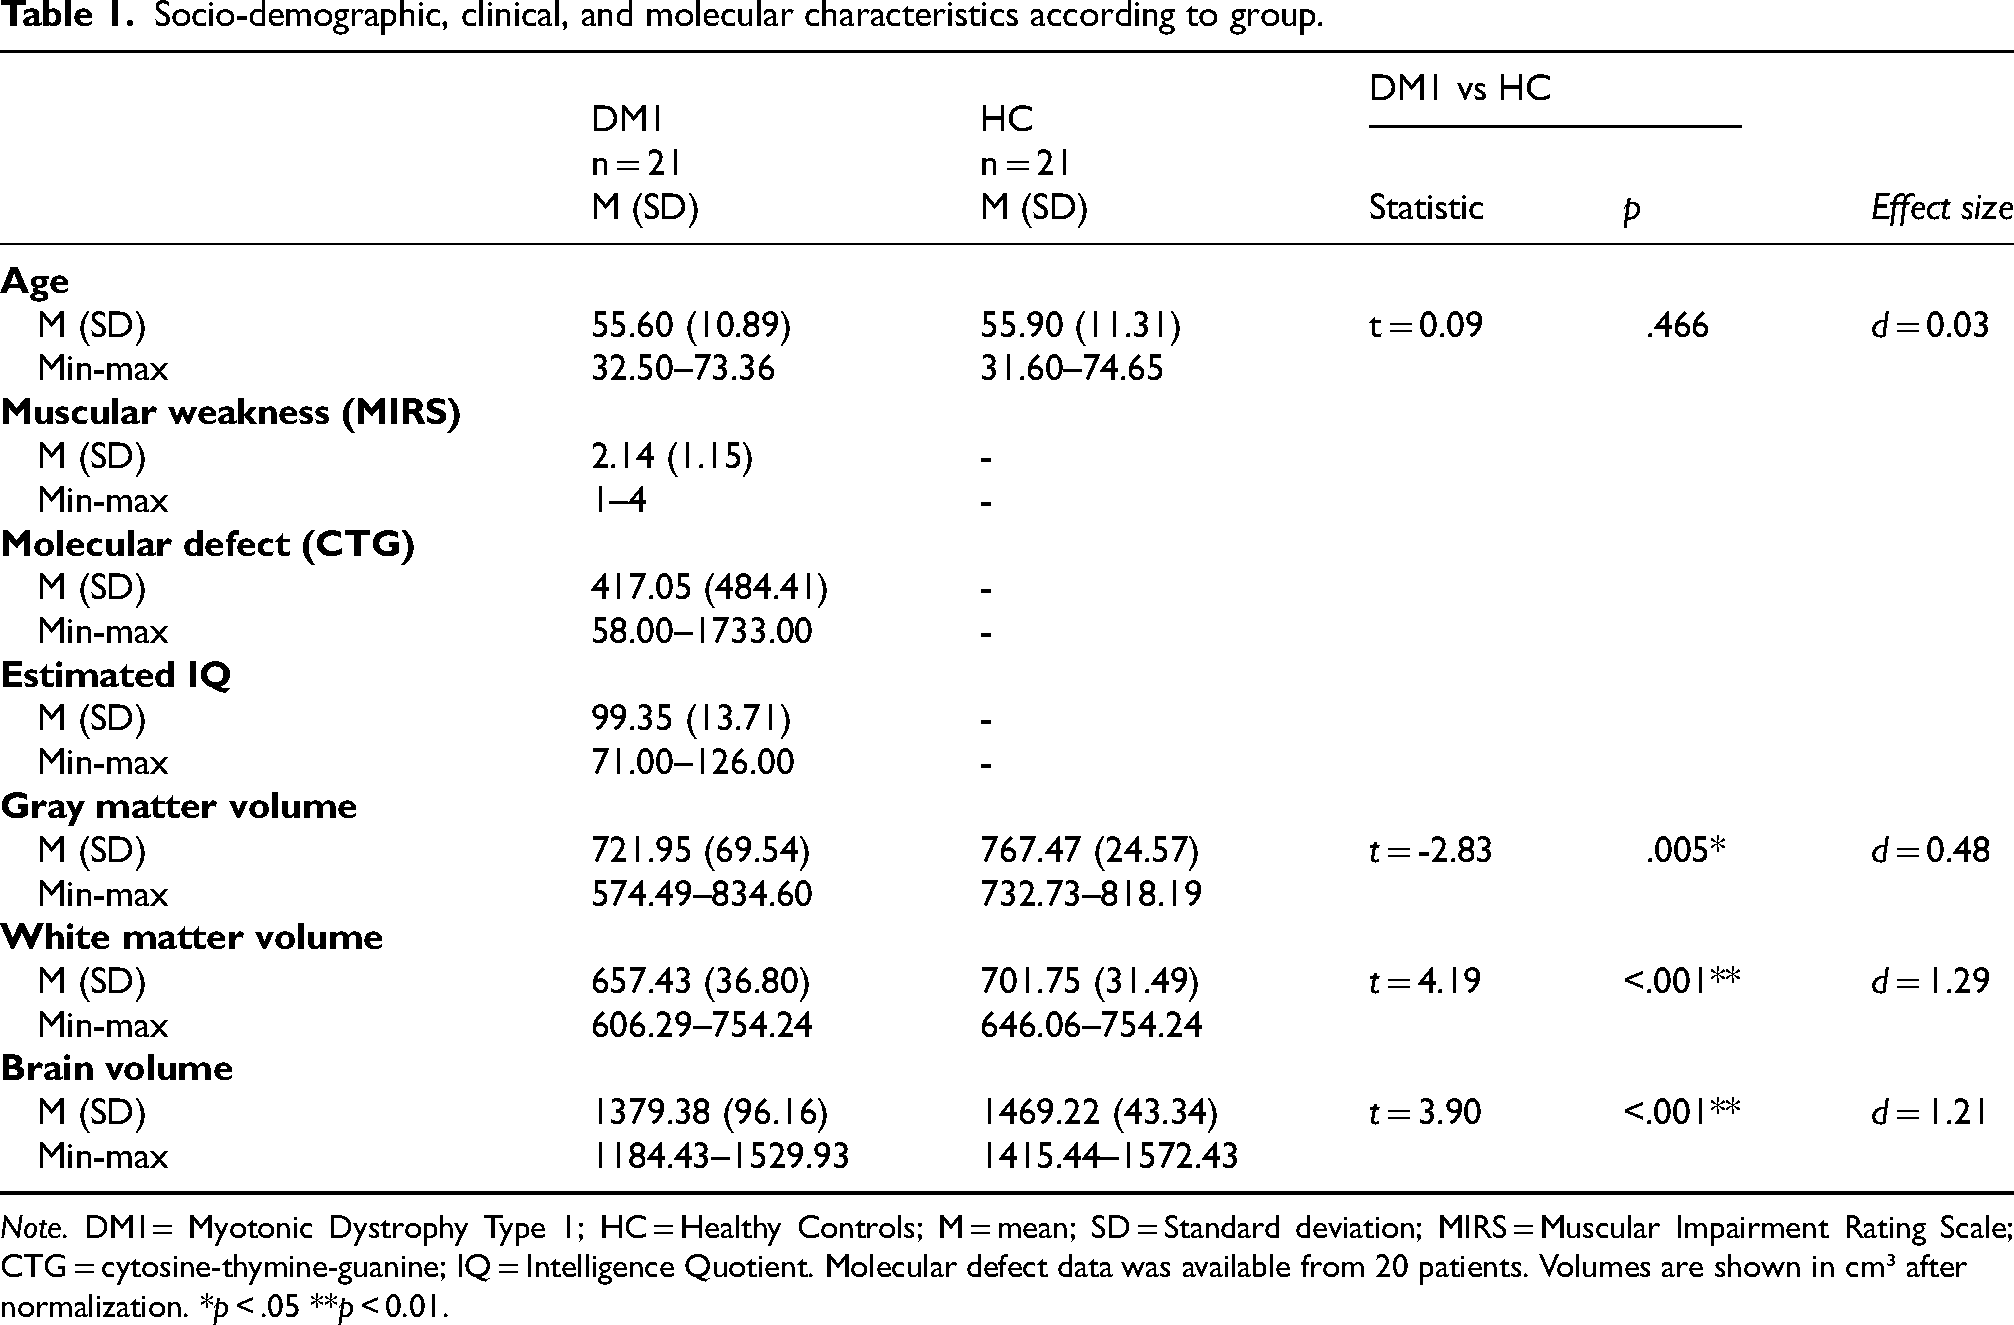
Note. DM1= Myotonic Dystrophy Type 1; HC = Healthy Controls; M = mean; SD = Standard deviation; MIRS = Muscular Impairment Rating Scale; CTG = cytosine-thymine-guanine; IQ = Intelligence Quotient. Molecular defect data was available from 20 patients. Volumes are shown in cm³ after normalization. *p < .05 **p < 0.01.
Functional connectivity analyses
ROI-to-ROI analysis (cross-sectional analysis)
ROI-to-ROI analysis was conducted to compare connectivity patterns between DM1 and HC. DM1 patients showed a significantly different resting-state connectivity profile compared to HC. Figure 2 illustrates these functional connectivity differences using the contrast DM1 > HC. In this figure, warm colors indicate a positive contrast, showing increased connectivity (hyperconnectivity) in DM1 patients compared to HCs, while cold colors represent a negative contrast, indicating decreased connectivity (hypoconnectivity) compared to HCs. As shown, DM1 patients showed widespread hyperconnectivity compared to HCs. Among all the studied connections (32 × 32), DM1 patients showed hyperconnectivity in 18 connections and hypoconnectivity in five connections.
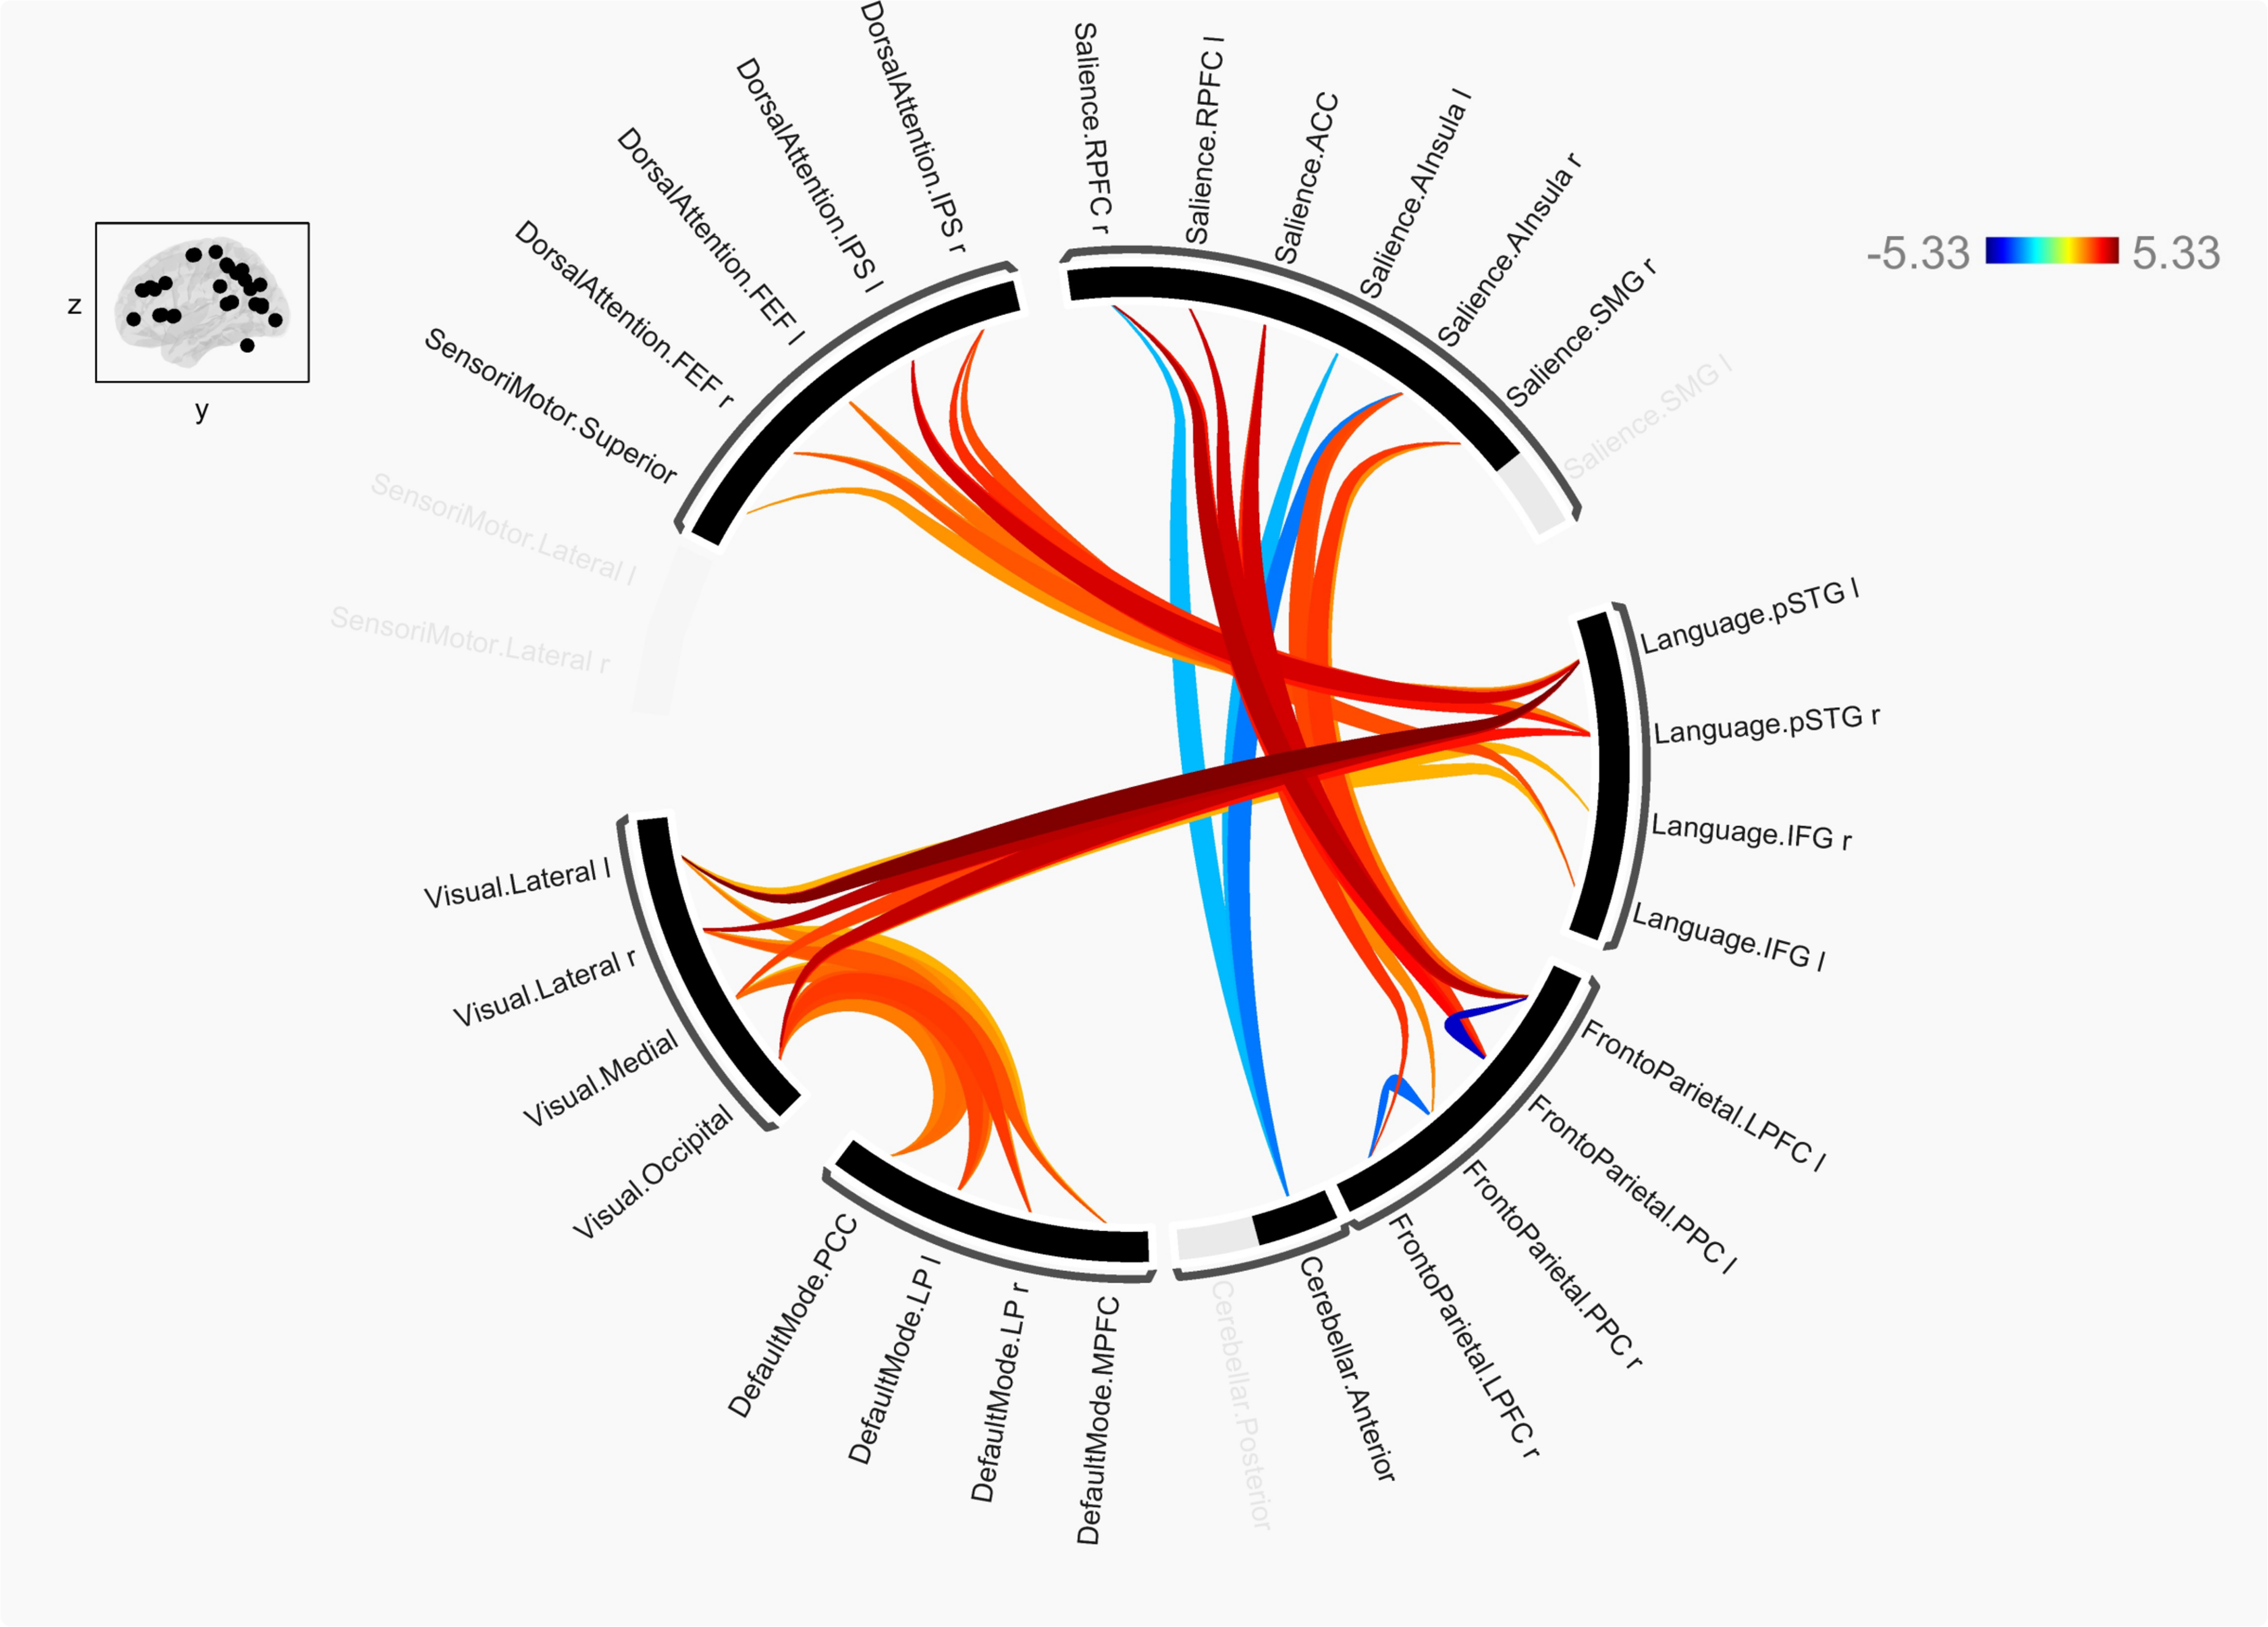
Differences in ROI-ROI connectivity analyses between DM1 patients and HC. Note. HC = healthy controls; l = left; r = right; FEF = frontal eye fields; IPS = intraparietal sulcus; RPFC = rostral prefrontal cortex; ACC = anterior cingular cortex; AInsula = anterior insula; SMG = supramarginal gyrus; pSTG = posterior superior temporal gyrus; IFG = inferior frontal gyrus; LPFC = lateral prefrontal cortex; PPC = posterior parietal cortex; MPFC = medial prefrontal cortex; LP = lateral parietal; PCC = posterior parietal cortex. The figure illustrates the DM1 > HC contrast. In the upper-right section (t-stat), warm colors (red, orange) indicate a positive contrast, showing hyperconnectivity in DM1 patients compared to HCs, while cold colors (blue) represent a negative contrast, indicating hypoconnectivity compared to HCs.
Specifically, increased connectivity was reported in DM1 patients between the following connections: the dorsal attention network with the language network, the language network with the visual network, the visual network with the default mode network, and the salience network with the fronto-parietal network. These increased connections were bilateral in all cases. Conversely, decreased connectivity was observed between the salience network (rostral prefrontal cortex right, anterior insula bilateral) and cerebellar anterior and within the fronto-parietal network ipsilaterally (hypoconnectivity between the lateral prefrontal cortex and the posterior parietal cortex).
Graph theory analysis (cross-sectional analysis)
Regarding graph theory measures, although no statistically significant differences were found between DM1 patients and HC, patients showed decreased efficiency, strength, and clustering, with moderate effect sizes (see Table 2).
Comparisons of graph theory measures between DM1 and healthy controls.
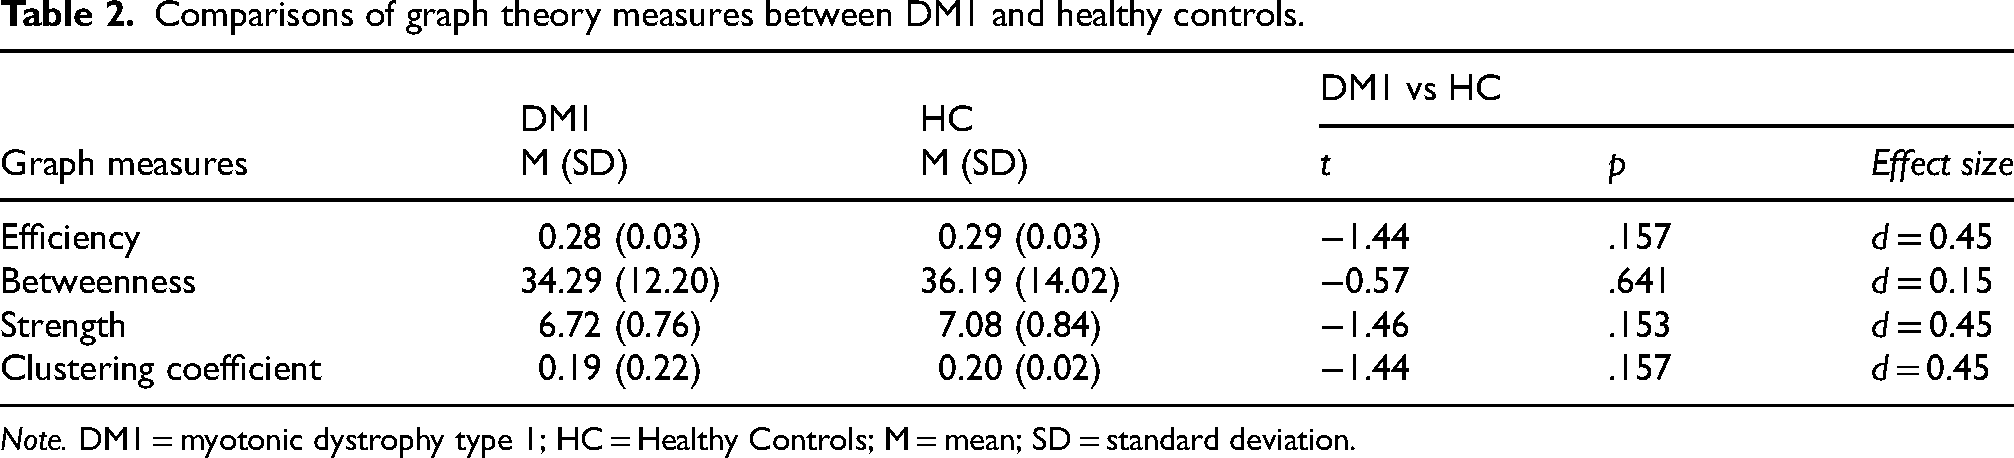
Note. DM1 = myotonic dystrophy type 1; HC = Healthy Controls; M = mean; SD = standard deviation.
In addition, DM1 patients showed significantly poorer local efficiency (moderate to large effect size), primarily in the salience network. Table 3 presents comparisons of local efficiency between DM1 and HC participants, specifically for those ROIs where significant differences and/or moderate-large effect sizes were found.
Differences in local efficiency between DM1 and healthy controls.
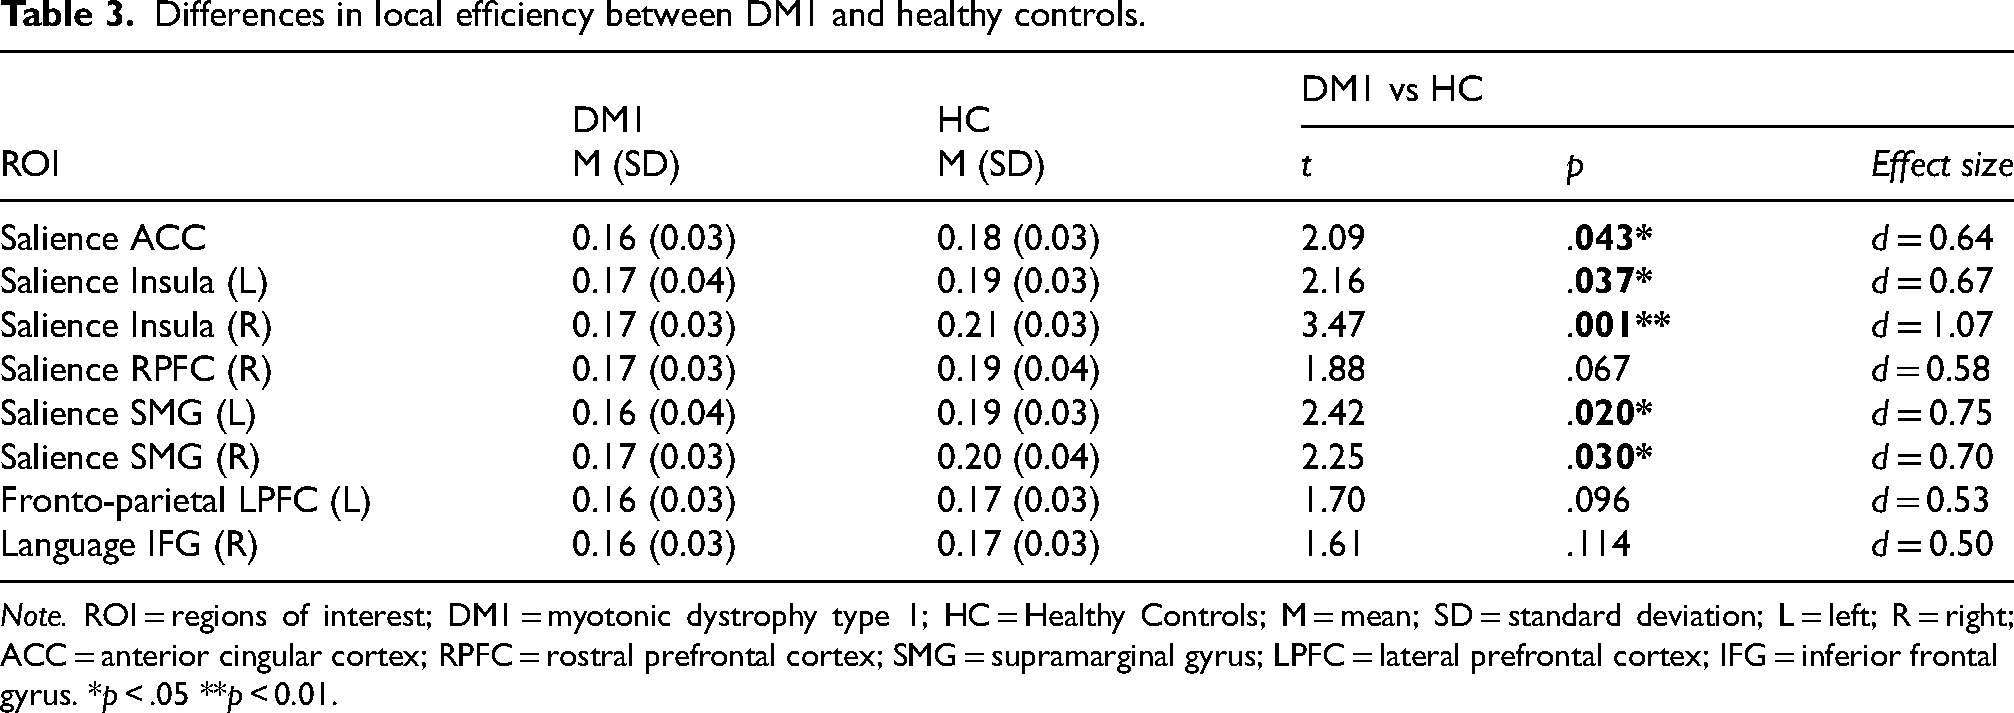
Note. ROI = regions of interest; DM1 = myotonic dystrophy type 1; HC = Healthy Controls; M = mean; SD = standard deviation; L = left; R = right; ACC = anterior cingular cortex; RPFC = rostral prefrontal cortex; SMG = supramarginal gyrus; LPFC = lateral prefrontal cortex; IFG = inferior frontal gyrus. *p < .05 **p < 0.01.
Hyperconnectivity/hypoconnectivity values (longitudinal analysis)
The following figure (Figure 3) illustrates longitudinal comparisons (both intragroup and intergroup) concerning total hyperconnectivity and hypoconnectivity values in DM1 and HC.
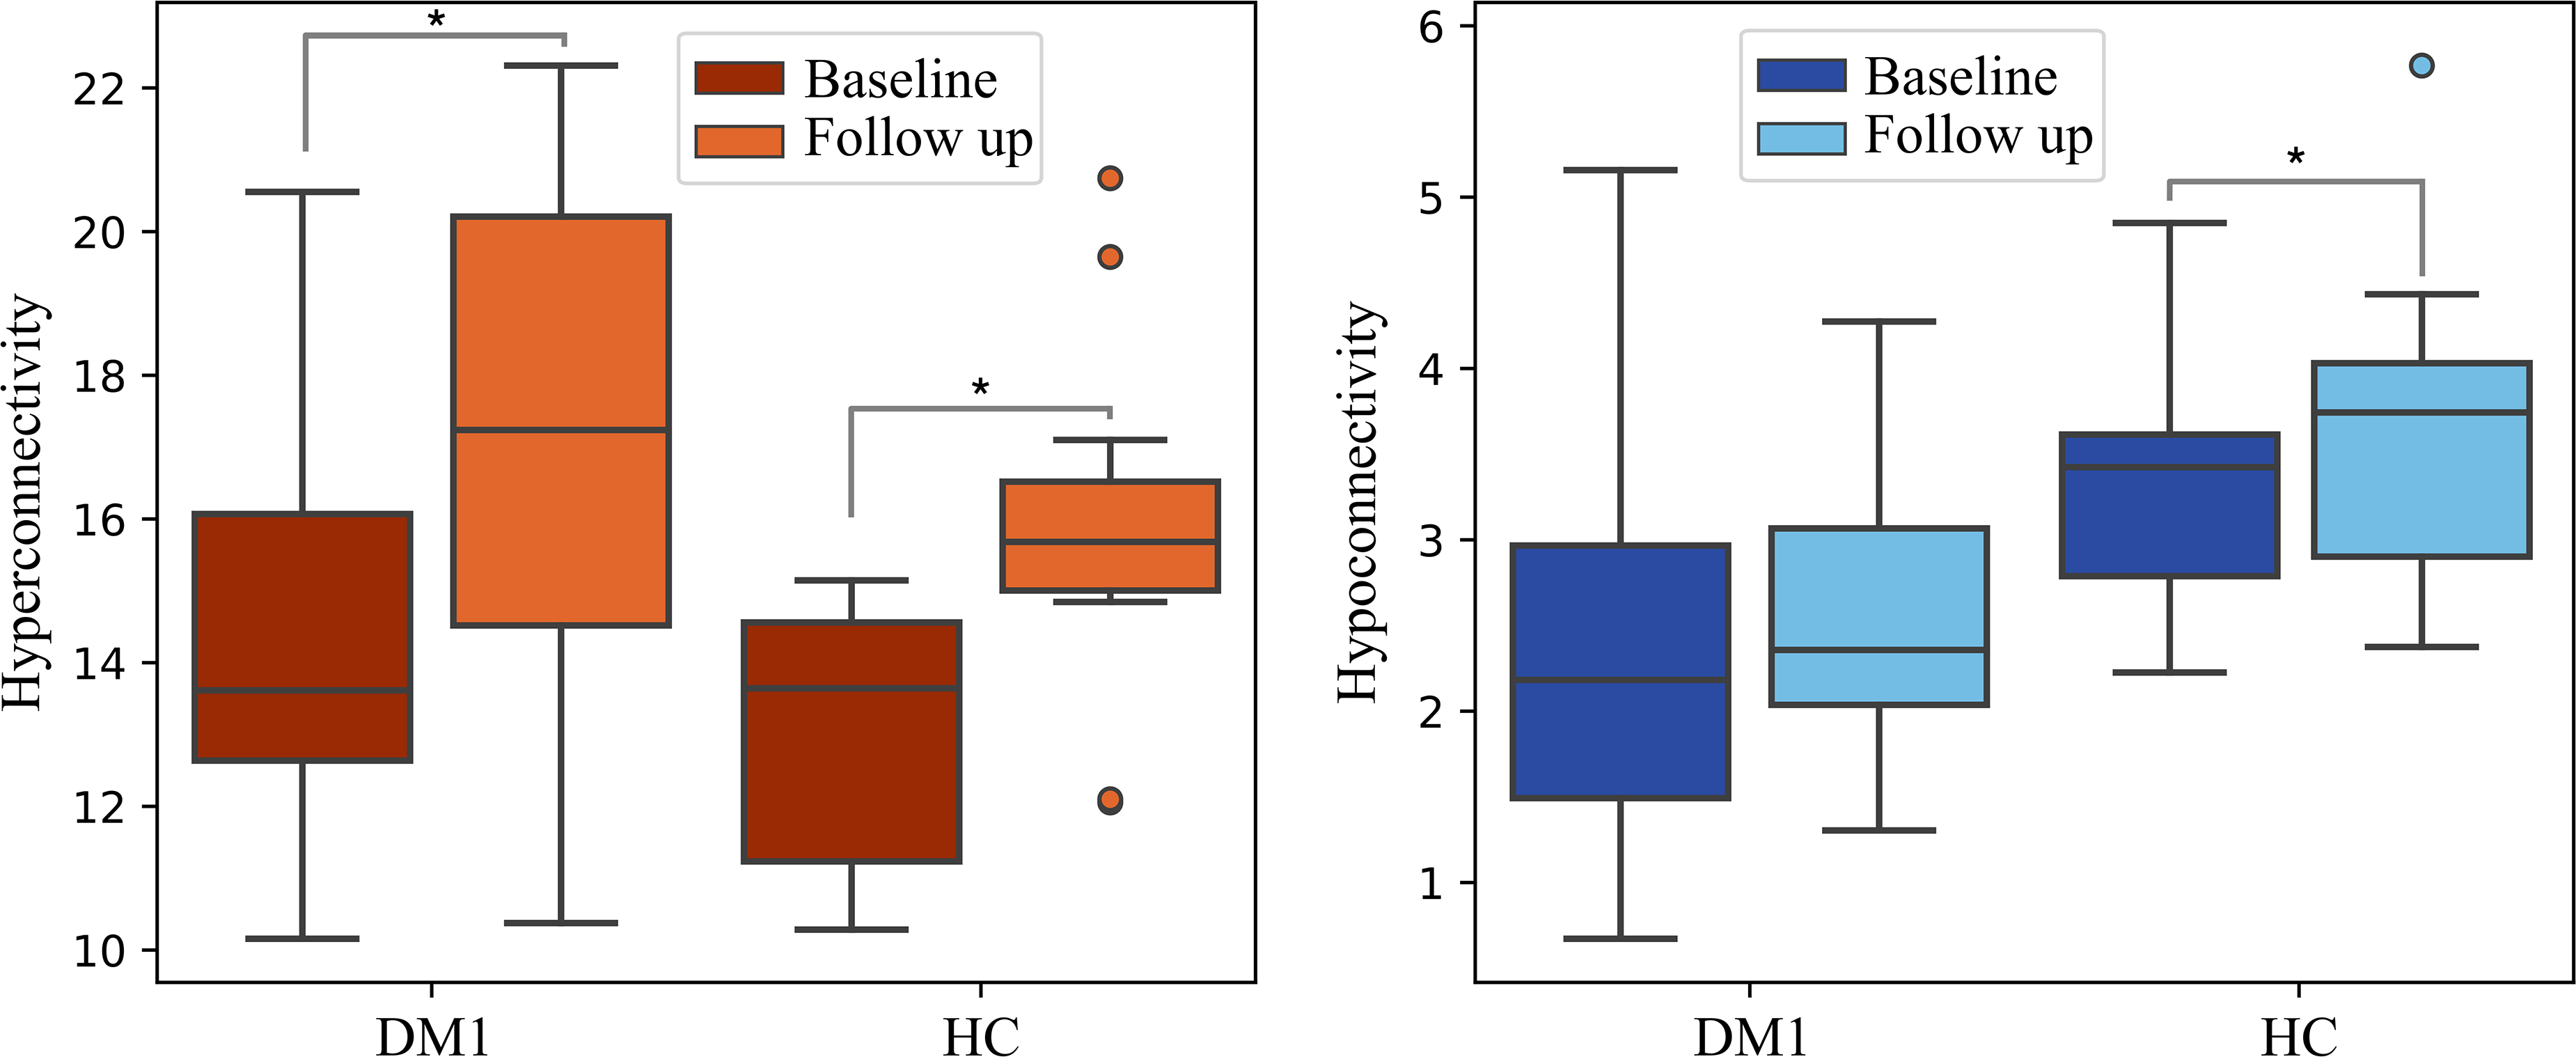
Box-plot displaying hyper/hypoconnectivity longitudinal values for DM1 patients and HCs. Note. DM1= Myotonic Dystrophy Type 1; HC = Healthy Controls. Connectivity strength represents the sum of the node's connectivity values (Y-axis), calculated using Pearson correlations, resulting in dimensionless values. *p < .05.
Regarding longitudinal changes, both DM1 patients and HCs showed a significant increase in total hyperconnectivity (intragroup longitudinal analysis; t = -3.46, p = 0.002, d = 0.89; t = -4.44; p < 0.001, d = 1.23, respectively). Both groups presented a similar progression in the hyperconnectivity values, as indicated by intergroup longitudinal analyses (ANOVA repeated measures), which revealed a similar increase in hyperconnectivity over ∼ 3 years (F (1,26) = 0.166; p = 0.687).
Concerning total hypoconnectivity values, while DM1 patients did not show significant changes between baseline and follow-up (t = -1.15, p = 0.268, d = 0.81), HCs demonstrated a significant increase (t = -2.67, p = .010, d = 0.74). However, longitudinal intergroup analyses did not reveal significant longitudinal differences between DM1 and HC (F (1,26) = 0.325; p = 0.573), suggesting a comparable progression between the two groups.
Connectivity correlates: correlation analysis between total hyper/hypoconnectivity and clinical, brain, and cognitive variables
Results of the correlation analysis between total hyperconnectivity and total hypoconnectivity with clinical, structural brain, and cognitive variables in DM1 are displayed in Figure 4. These analyses revealed that hyperconnectivity was associated with greater disease severity, although this relationship did not reach statistical significance (p > 0.05). However, the effect sizes were moderate to large (r > 0.3). Specifically, total hyperconnectivity was positively correlated with muscular impairment (MIRS) and molecular defect (CTG) and negatively with cognitive outcomes such as estimated IQ, visuoconstruction, and executive functioning domains. Conversely, hypoconnectivity was correlated with less severe disease. Total hypoconnectivity showed a positive correlation with years of education, estimated IQ, and performance in the visuoconstruction domain, while it was negatively correlated with muscular impairment and molecular defect (CTG).
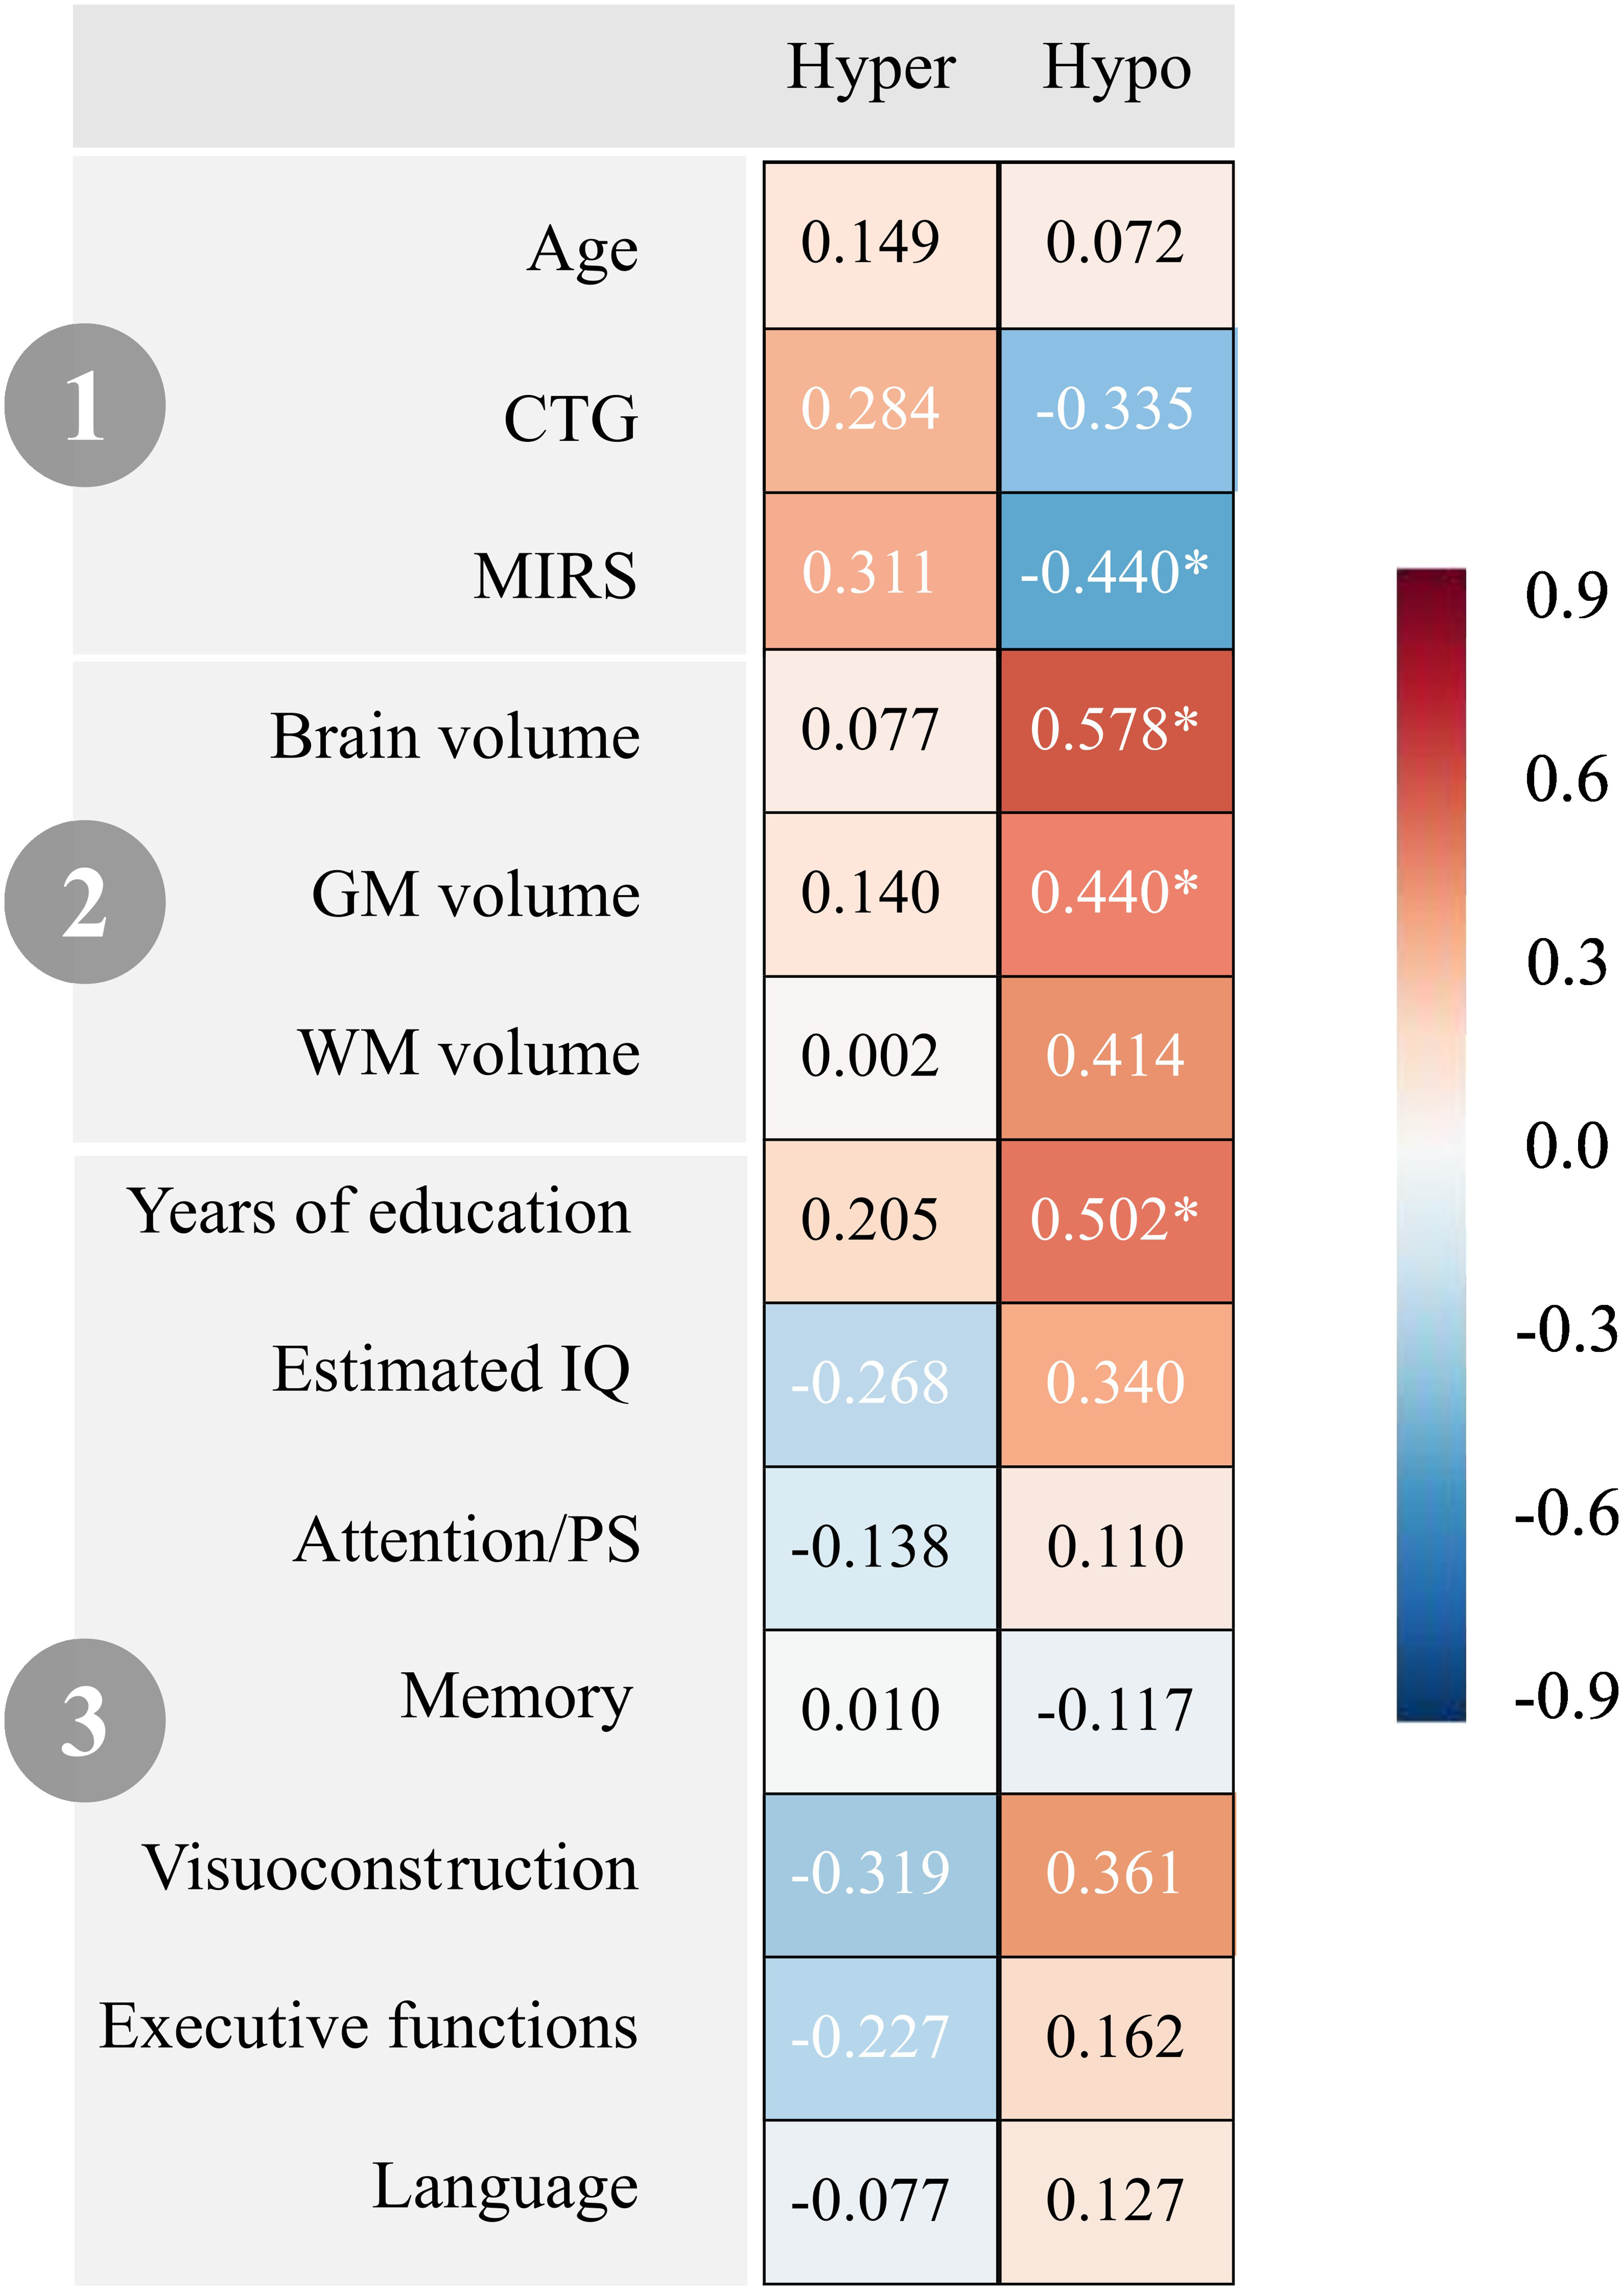
Correlations between total hyperconnectivity and hypoconnectivity and clinical, brain, and cognitive variables in DM1. Note. 1) Clinical variables; 2) Brain variables; 3) Cognitive variables. Hyper = total hyperconnectivity; Hypo = total hypoconnectivity; CTG = Cytosine Thymine Guanine expansion size; MIRS = Muscular Impairment Rating Scale; GM = Gray Matter; WM = White Matter; IQ = Intelligence Quotient; PS = Processing Speed. All values are reported as Pearson's r, except for CTG, which is presented as Spearman's rs. *p < 0.05.
Correlation analyses were replicated with patients who had an evaluation at two time points (n = 15), both at baseline and follow-up. The results were similar to those presented in Figure 4, which included all patients participating at baseline (n = 21).
Discussion
This is the first longitudinal study addressing brain functional connectivity in myotonic dystrophy type 1. In this study, DM1 patients presented altered resting-state functional connectivity in addition to structural brain alterations. The connectivity pattern was characterized by widespread increased functional connectivity, or hyperconnectivity, compared to HCs, with far fewer connections showing hypoconnectivity. Hyperconnectivity was present across various between-network connections (inter-network). In contrast, hypoconnectivity was observed only between the salience and cerebellar networks (inter-network) and within the fronto-parietal network (intra-network).
These findings align with those reported by Li and colleagues, who also observed overall hyperconnectivity in DM1 WM networks. 18 Notably, the DM1 patients in our study, with a mean age of 55.60 years, displayed a connectivity pattern comparable to that of healthy elderly adults, as reported in other studies, which also showed between-network hyperconnectivity and within-network hypoconnectivity.31–34 Hyperconnectivity has been similarly reported in various neurological disorders, such as Alzheimer's disease (AD), Parkinson's disease (PD), multiple sclerosis, and amyotrophic lateral sclerosis, particularly in the early or prodromal stages.35–42
Over a 3-year follow-up period, our study found that DM1 patients remained hyperconnected, with both DM1 patients and HCs exhibiting a similar increase in total hyperconnectivity over time. In DM1, hyperconnectivity might initially serve as a compensatory response, especially given the structural brain alterations observed, including those in WM tracts,7,8 which can influence functional connectivity. 43 In other neurological disorders and aging populations, hyperconnectivity often shifts towards hypoconnectivity as the disease progresses,35,44,45 likely due to the decreasing ability to sustain this compensatory neural strategy over time. 46 This shift is thought to occur because, while hyperconnectivity may initially act as a compensatory mechanism,31–34,46,47 prolonged hyperconnectivity can impact network cost-efficiency, ultimately increasing neurodegeneration risk and leading to hypoconnectivity. 44 However, the relatively short follow-up period in this study may have been insufficient to observe this shift toward hypoconnectivity, given the slow progression of DM1.
Furthermore, our study employed novel graph theory measures, revealing that although DM1 patients’ brains exhibited hyperconnectivity, their network efficiency, strength, and clustering coefficient were slightly decreased compared to age-matched HCs. While these differences were not statistically significant, they showed moderate effect sizes, suggesting that the organization and efficiency of neural networks may be somewhat compromised in DM1 patients. Specifically, decreased local efficiency was observed in the salience network, which is critical for switching between the two main control networks — the default mode network and the central executive network. 48 Compromise in the salience network might lead to deficits in social, affective, and cognitive control,49,50 contributing to symptoms such as apathy, a common feature in DM1. 51
In the present study, hyperconnectivity in DM1 was associated with greater disease severity, including a more pronounced molecular defect and muscular impairment, and poorer cognitive performance in IQ, visuoconstruction, and executive functioning. Although these associations were not significant, they showed moderate to large effect sizes. Conversely, hypoconnectivity emerged as a protective factor, linked to milder disease status characterized by fewer molecular defects and less muscular impairment, better cognitive performance in IQ and visuoconstruction, more years of education, and better brain structural outcomes (brain volume, GM, and WM volumes).
These findings might contribute to the ongoing debate on whether DM1 reflects a neurodevelopmental or neurodegenerative disorder,52–56 suggesting it may involve both processes. One could hypothesize that early in the disease, altered brain connectivity — particularly hypoconnectivity in milder cases — might reflect atypical neurodevelopmental patterns, creating a distinct baseline network configuration that differs from typical brain maturation. The hyperconnectivity observed, especially in DM1 patients with greater disease severity, may initially act as a compensatory mechanism but may not be sustainable, potentially shifting toward hypoconnectivity over time, as seen in neurodegenerative disorders35,44–46 (though this shift was not captured within the study's limited timeframe). This suggests that DM1 might involve a slowly progressing neurodegenerative process emerging from an atypical neurodevelopmental trajectory.
Our study had certain limitations, with sample size constituting the major constraint. Sample sizes are an inherent challenge when studying rare diseases such as DM1. Nonetheless, the sample size of this study was one of the largest employed to date in functional connectivity in DM1, second only to that used in the study by Serra and colleagues.20,21 Additionally, the DM1 group was matched with a healthy control (HC) group based on sex and age. It should also be noted that this is the first longitudinal investigation examining functional connectomics in DM1. As is typical in longitudinal studies, the rate of experimental attrition, combined with the higher mortality rate in the DM1 population,57,58 led to a reduced group size at follow-up. Therefore, our results should be interpreted with caution. Another limitation is the relatively short follow-up period, especially given that DM1 is a slowly progressive disorder. Future research with extended follow-up could help determine whether DM1 patients eventually experience a shift towards hypoconnectivity and associated neurodegeneration. This approach would enhance our current understanding and provide insights into how connectivity evolves throughout the course of the disease, from its early stages to advanced stages, when structural and functional connections are progressively compromised. A final limitation was the lack of data on interesting outcomes such as CNS symptomatology, including apathy, hypersomnolence, or fatigue. Including these outcomes could allow for a more thorough exploration of the correlates of functional connectivity in DM1.
In conclusion, our study enhances the understanding of connectivity dynamics in DM1. Despite the overall increased connectivity observed in DM1, certain graph metrics indicate a less efficient organization of brain networks. Functional connectivity alterations in DM1 patients were linked to clinical status, with hyperconnectivity suggested as a marker of disease severity and hypoconnectivity associated with better disease status.
Supplemental Material
sj-docx-1-jnd-10.1177_22143602241307197 - Supplemental material for Hyperconnectivity in resting-state fMRI as a marker of disease severity in Myotonic Dystrophy Type 1
Supplemental material, sj-docx-1-jnd-10.1177_22143602241307197 for Hyperconnectivity in resting-state fMRI as a marker of disease severity in Myotonic Dystrophy Type 1 by Joana Garmendia, Garazi Labayru, Antonio Jiménez-Marín, Jorge Villanúa, Jesús Cortés, Adolfo López de Munain and Andone Sistiaga in Journal of Neuromuscular Diseases
Footnotes
Funding
The author(s) disclosed receipt of the following financial support for the research, authorship, and/or publication of this article: This study has been funded by Instituto de Salud Carlos III (ISCII) through the project PI17/01231 and PI22/01118, and co-funded by the European Union; Basque Government [2022111031; IT1732/22]; and University of the Basque Country [PIF 20/238 to JG].
Declaration of conflicting interests
The authors declared no potential conflicts of interest with respect to the research, authorship, and/or publication of this article.
Data availability
The data supporting the findings of this study are available on request from the corresponding author. The data are not publicly available due to privacy or ethical restrictions.
Supplemental material
Supplemental material for this article is available online.
References
Supplementary Material
Please find the following supplemental material available below.
For Open Access articles published under a Creative Commons License, all supplemental material carries the same license as the article it is associated with.
For non-Open Access articles published, all supplemental material carries a non-exclusive license, and permission requests for re-use of supplemental material or any part of supplemental material shall be sent directly to the copyright owner as specified in the copyright notice associated with the article.