
Abstract
Disease detection at the molecular level is driving the emerging revolution of early diagnosis and treatment. A challenge facing the field is that protein biomarkers for early diagnosis can be present in very low abundance. The lower limit of detection with conventional immunoassay technology is the upper femtomolar range (10−13 M). Digital immunoassay technology has improved detection sensitivity three logs, to the attomolar range (10−16 M). This capability has the potential to open new advances in diagnostics and therapeutics, but such technologies have been relegated to manual procedures that are not well suited for efficient routine use. We describe a new laboratory instrument that provides full automation of single-molecule array (Simoa) technology for digital immunoassays. The instrument is capable of single-molecule sensitivity and multiplexing with short turnaround times and a throughput of 66 samples/h. Singleplex and multiplexed digital immunoassays were developed for 16 proteins of interest in cardiovascular, cancer, infectious disease, neurology, and inflammation research. The average sensitivity improvement of the Simoa immunoassays versus conventional ELISA was >1200-fold, with coefficients of variation of <10%. The potential of digital immunoassays to advance human diagnostics was illustrated in two clinical areas: traumatic brain injury and early detection of infectious disease.
Introduction
Detection of nascent disease processes through quantification of abnormal levels of biomarkers holds the key to diagnostic and therapeutic intervention before the appearance of secondary clinical signs and symptoms. Protein and nucleic acid biomarker discovery and validation has become a major driver in biopharmaceutical research, targeted clinical study design, and the pursuit of early disease diagnostics.1–4 Because protein biomarkers provide a greater amount of downstream information content than nucleic acid, they may hold the greatest promise for use as clinical decision tools. 5 It is estimated that the human proteome is derived from more than 20,000 genes, and that there are more than 4000 secreted proteins in circulation.6,7 Less than one-tenth (375) of these secreted proteins are reliably measurable by protein assay technologies. 6 Of these measurable proteins, almost one-half (171) has resulted in Food and Drug Administration (FDA)–approved diagnostic tests, 8 pointing to the high value of protein biomarkers to human health.
The likelihood that only a small fraction of secreted proteins is measurable highlights the challenge facing the protein measurement field: medically relevant biomarkers can be present in very low abundance. Immunoassays remain the mainstay for sensitive and specific measurement of protein biomarkers. However, conventional immunoassay technologies have lacked the sensitivity to interrogate the potential of unmeasurable biomarkers that are certain to lie below the surface of current detectability. Mainstream conventional immunoassays—including enzyme-linked immunosorbent assay (ELISA), chemiluminescence, and electrochemiluminescence—have a lower floor of sensitivity of approximately 10–13 M (~0.1 pM). Numerous nonmainstream approaches at driving down sensitivity have been described,9–13 including Raman-enhanced signal detection11,12 and inductively coupled plasma mass spectrometry, 13 but data from these approaches suggest limited success relative to mainstream technologies. Unconventional approaches reporting subfemtomolar detection have significant trade-offs, such as lengthy procedures or the inability to provide quantitative answers.14,15 Two more widely tested advances in analog assay signal amplification are immuno-PCR 16 and the biobarcode assay.17,18 Immuno-PCR increases sensitivity by labeling the detection antibody with a DNA molecule, which is then amplified and quantified using PCR. Biobarcode assays utilize anti-analyte nanoparticles “barcoded” with DNA, which, upon binding to analyte captured onto gold microparticles, is dehybridized from the nanoparticles for quantification. Realizable gains in sensitivity of these two methods have been on the order of 10- to 100-fold relative to conventional immunoassay,19,20 but the methods have not been integrated into fully automated systems needed for mainstream adoption and have not been used for multiplexing. For maximum impact on accelerating drug discovery, validating novel biomarkers, and bringing molecular-level diagnostics into the clinical mainstream, a robust, multiplexed ultrasensitive protein detection technology with high efficiency, high data quality, and cost-effectiveness is needed.
More recently, two digital approaches to protein measurement have been described that drive sensitivity to the single-molecule level. One method relies on formation of immunosandwich complexes on a solid phase that are then chemically dissociated and passed through a laser for counting one molecule at a time. 21 The second method, developed by us, relies on single-molecule arrays and the simultaneous counting of singulated capture microbeads. 22 Both methods are capable of lowering the floor of detection capability another 10-fold or more versus enhanced analog amplification methods, but the later technology is also readily compatible with high-throughput automated instrumentation for ELISA reagent processing. By using large arrays of microwells, hundreds to tens of thousands of data points can be obtained and interrogated simultaneously, enabling rapid data acquisition and robust statistics. Additionally, the rapid data acquisition possible from arrays can be applied to multiple subpopulations of beads pre-encoded with different fluorescent properties, enabling high-throughput multiplexing at a single-molecule level.
Automation of immunoassays has been around for decades, and instrumentation providing conventional immunoassay sensitivity is available for every laboratory need. In this paper, we describe our efforts to combine well-proven automation robotics and ELISA reagents with single-molecule arrays to open a new era of protein measurement sensitivity with an economical, full-featured automated digital immunoassay analyzer capable of single-molecule sensitivity and multiplexing. The instrument integrates well-established paramagnetic microbead-based reagent robotics with a novel Simoa imaging module that digitizes the immunoassays with an inexpensive array consumable and optical system. The system was designed to serve the needs of both life science research and clinical laboratories at a cost similar to that of conventional immunoassay platforms. For research purposes, the system can accommodate user-developed custom reagents and assay protocols, as well as a menu of prevalidated assay kits. For the clinical laboratory, the system is designed for random/continuous access operation with stat capability (scheduling of priority sample processing in the shortest time possible) and is suitable for regulatory approval. We believe the Simoa imaging module and integrated analyzer system represents a significant advance in automated immunoassay sensitivity and capability. In this paper, we describe the development and architecture of the system, and present data demonstrating the performance of digital singleplex and multiplex immunoassays with immediate relevance to molecular-level diagnostics in cardiovascular disease, cancer, infectious disease, neurological disorders, and inflammation.
Materials and Methods
General Description of Instrument
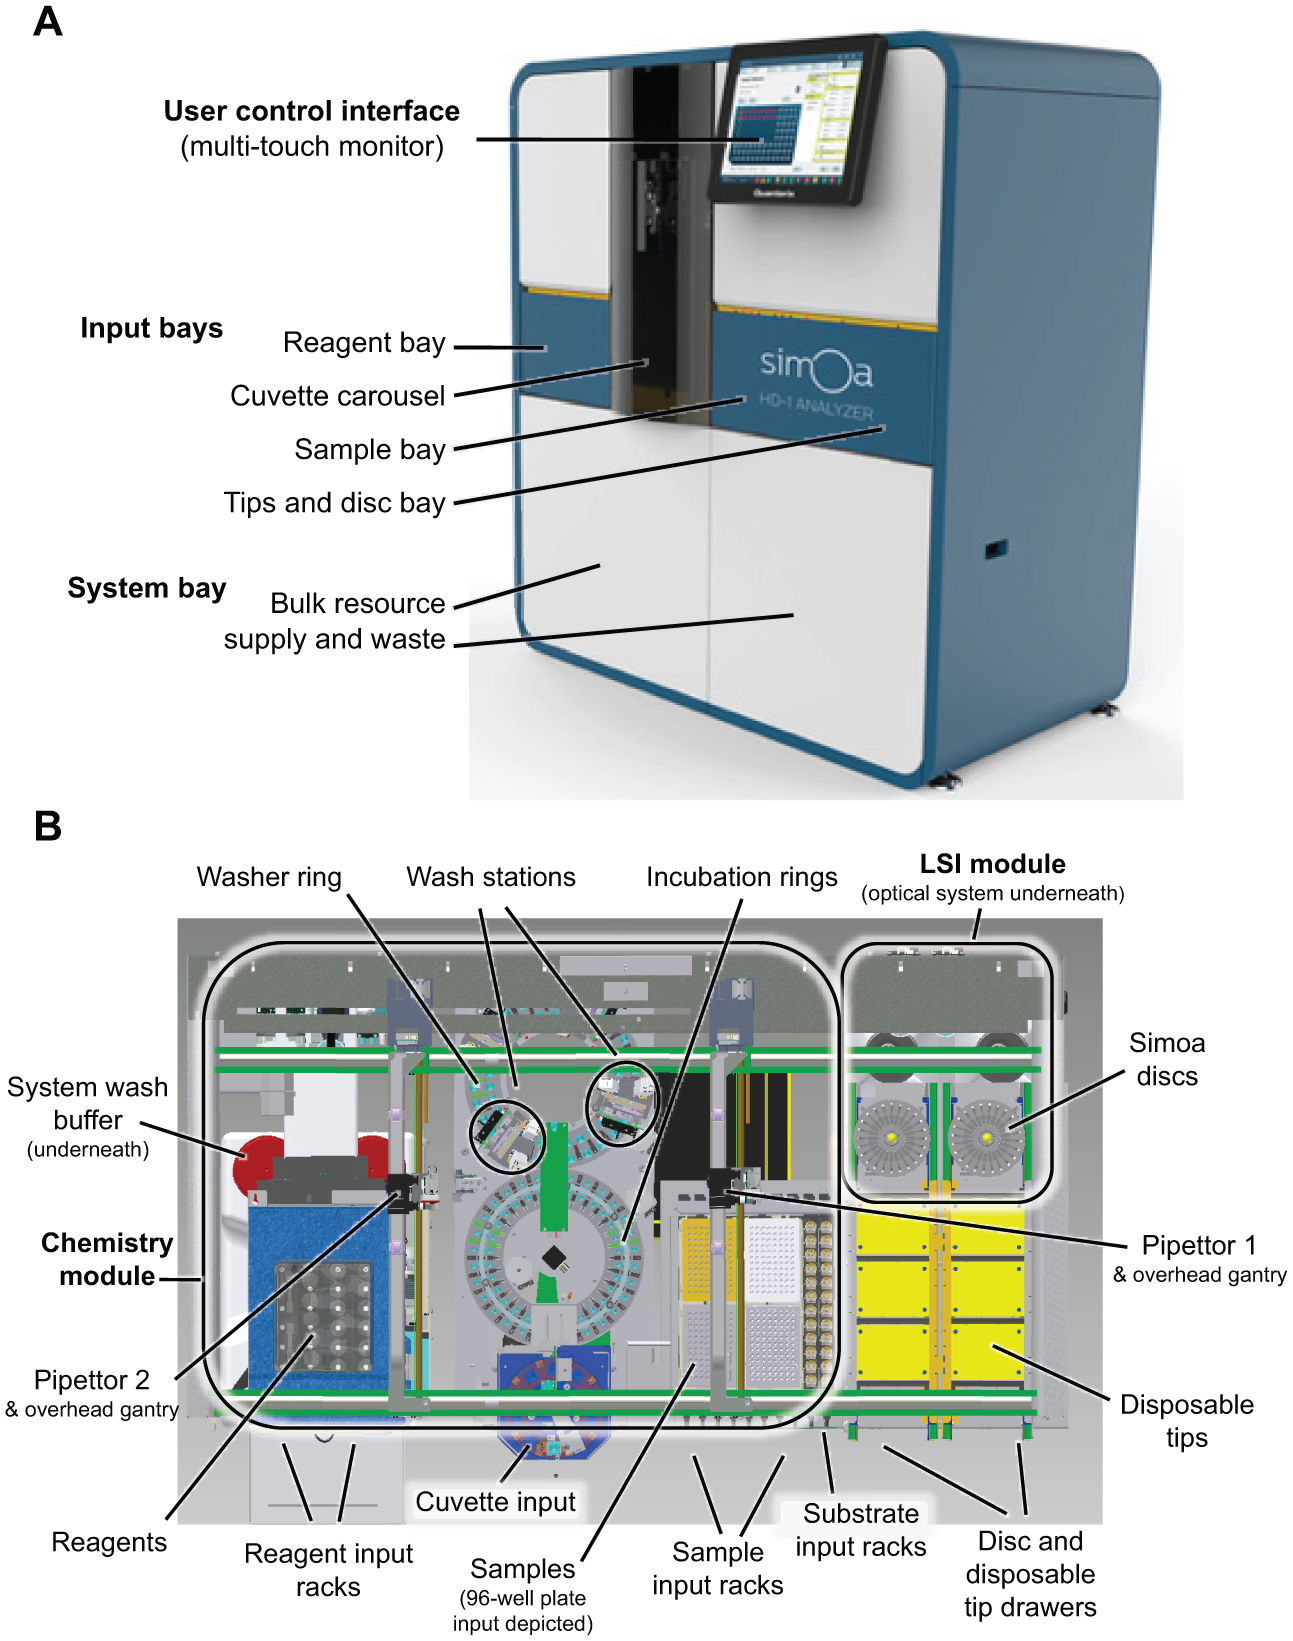
The Simoa HD-1 Analyzer is a floor-standing instrument with dimensions of 55.7 in. width × 31 in. depth × 63.5 in. height (141 × 79 × 161 cm) designed to operate within an ambient temperature range of 18–32 °C and a relative humidity range of 30–80%. The system consists of five main functional areas ( Figs. 1 and 2 ): (1) input bays for addition of disposables (tips, cuvettes, array discs), reagent kits, and samples; (2) a system bay for bulk resources and waste; (3) the user control interface (integrated flat-screen monitor and computer); (4) a chemistry module that contains rotating incubation and wash rings; and (5) the Simoa load–seal–image (LSI) module. General pipetting operations are provided by an overhead gantry with two x-y-z pipettors ( Fig. 1B ): a disposable-tip pipetter (pipettor 1, sample handling and transfer of bead–substrate mixture to the array disc) and a fixed-tip pipettor (pipettor 2, reagent pipetting functions).
Simoa HD-1 Analyzer. (
LSI module and Simoa disc. (
The operator interfaces routinely with the input and system bays and the flat-screen monitor. The input bays are accessed from the front of the instrument and are designed with redundancy to permit loading of new resources while the instrument is running with previously loaded resources. The reagent bay contains four lanes for insertion of reagent kit resources via four independent reagent racks (6 positions = 24 reagent bottles; 3 positions on each rack shaken to keep beads in suspension). The sample bay contains two lanes for loading enzyme substrate and eight lanes for sample tube racks (12 positions each = 96 samples). Alternatively, up to four 96-well ELISA plates may be used for sample input (= 384 samples). The sample bay also contains two drawers for loading disposable tips (3 boxes of 96 per drawer) and array disks (16 disks per stack on each of 2 spindles). The system bay provides on-board storage of bulk system liquid resources and waste handling. The system bay is accessed through two doors at the bottom of the instrument’s cabinet and contains system fluids (wash buffers and deionized water), sealing oil, a solid-waste container, and two liquid system waste containers. The cuvette carousel is accessed through a door on the front of the instrument and receives 10 stacks of 50 cuvettes (prestacked during packaging). The on-board instrument computer (HP ProDesk 490 G1 Microtower, Intel Core i7-4770) is accessed via a movable 17 in. flat screen with multitouch capability integrated onto the front of the cabinet. The monitor provides the user with access to all instrument functionality, including run setup, custom protocol development, data analysis, reports, and system status. Data can be exported as a comma-separated value (CSV) file, moved between different instruments, and automatically generated batch files are consumable by laboratory information management systems.
The chemistry module is a sequential cuvette processing robot for paramagnetic bead-based ELISA reagents. For maximum repeatability, every cuvette for a given assay is subjected to identical conditions of timing and temperature. Basic chemistry operations (pipetting, cuvette movement, washing) for each sample occur within a processing cadence of 45 s. The processing cadence is the unit of time during which repetitive instrument operations for sequential sample processing are scheduled. The rotating incubation ring contains a shaker mechanism to agitate the cuvette for mixing after reagent additions and bead suspension during incubation. The rotating washer ring includes four washer stations, at which beads are collected with a magnet and subjected to a minimum of three washes with system wash buffer. Cuvettes are transferred between the washer and incubation rings, depending on the assay pipetting protocol requirements and operations scheduling. Beads are redispersed between washes by directing wash buffer dispenses against the pellet while not on a magnet. The washer station design was optimized for bead collection efficiency, bead mono-redispersion, wash efficiency (background reduction), and minimization of carryover.
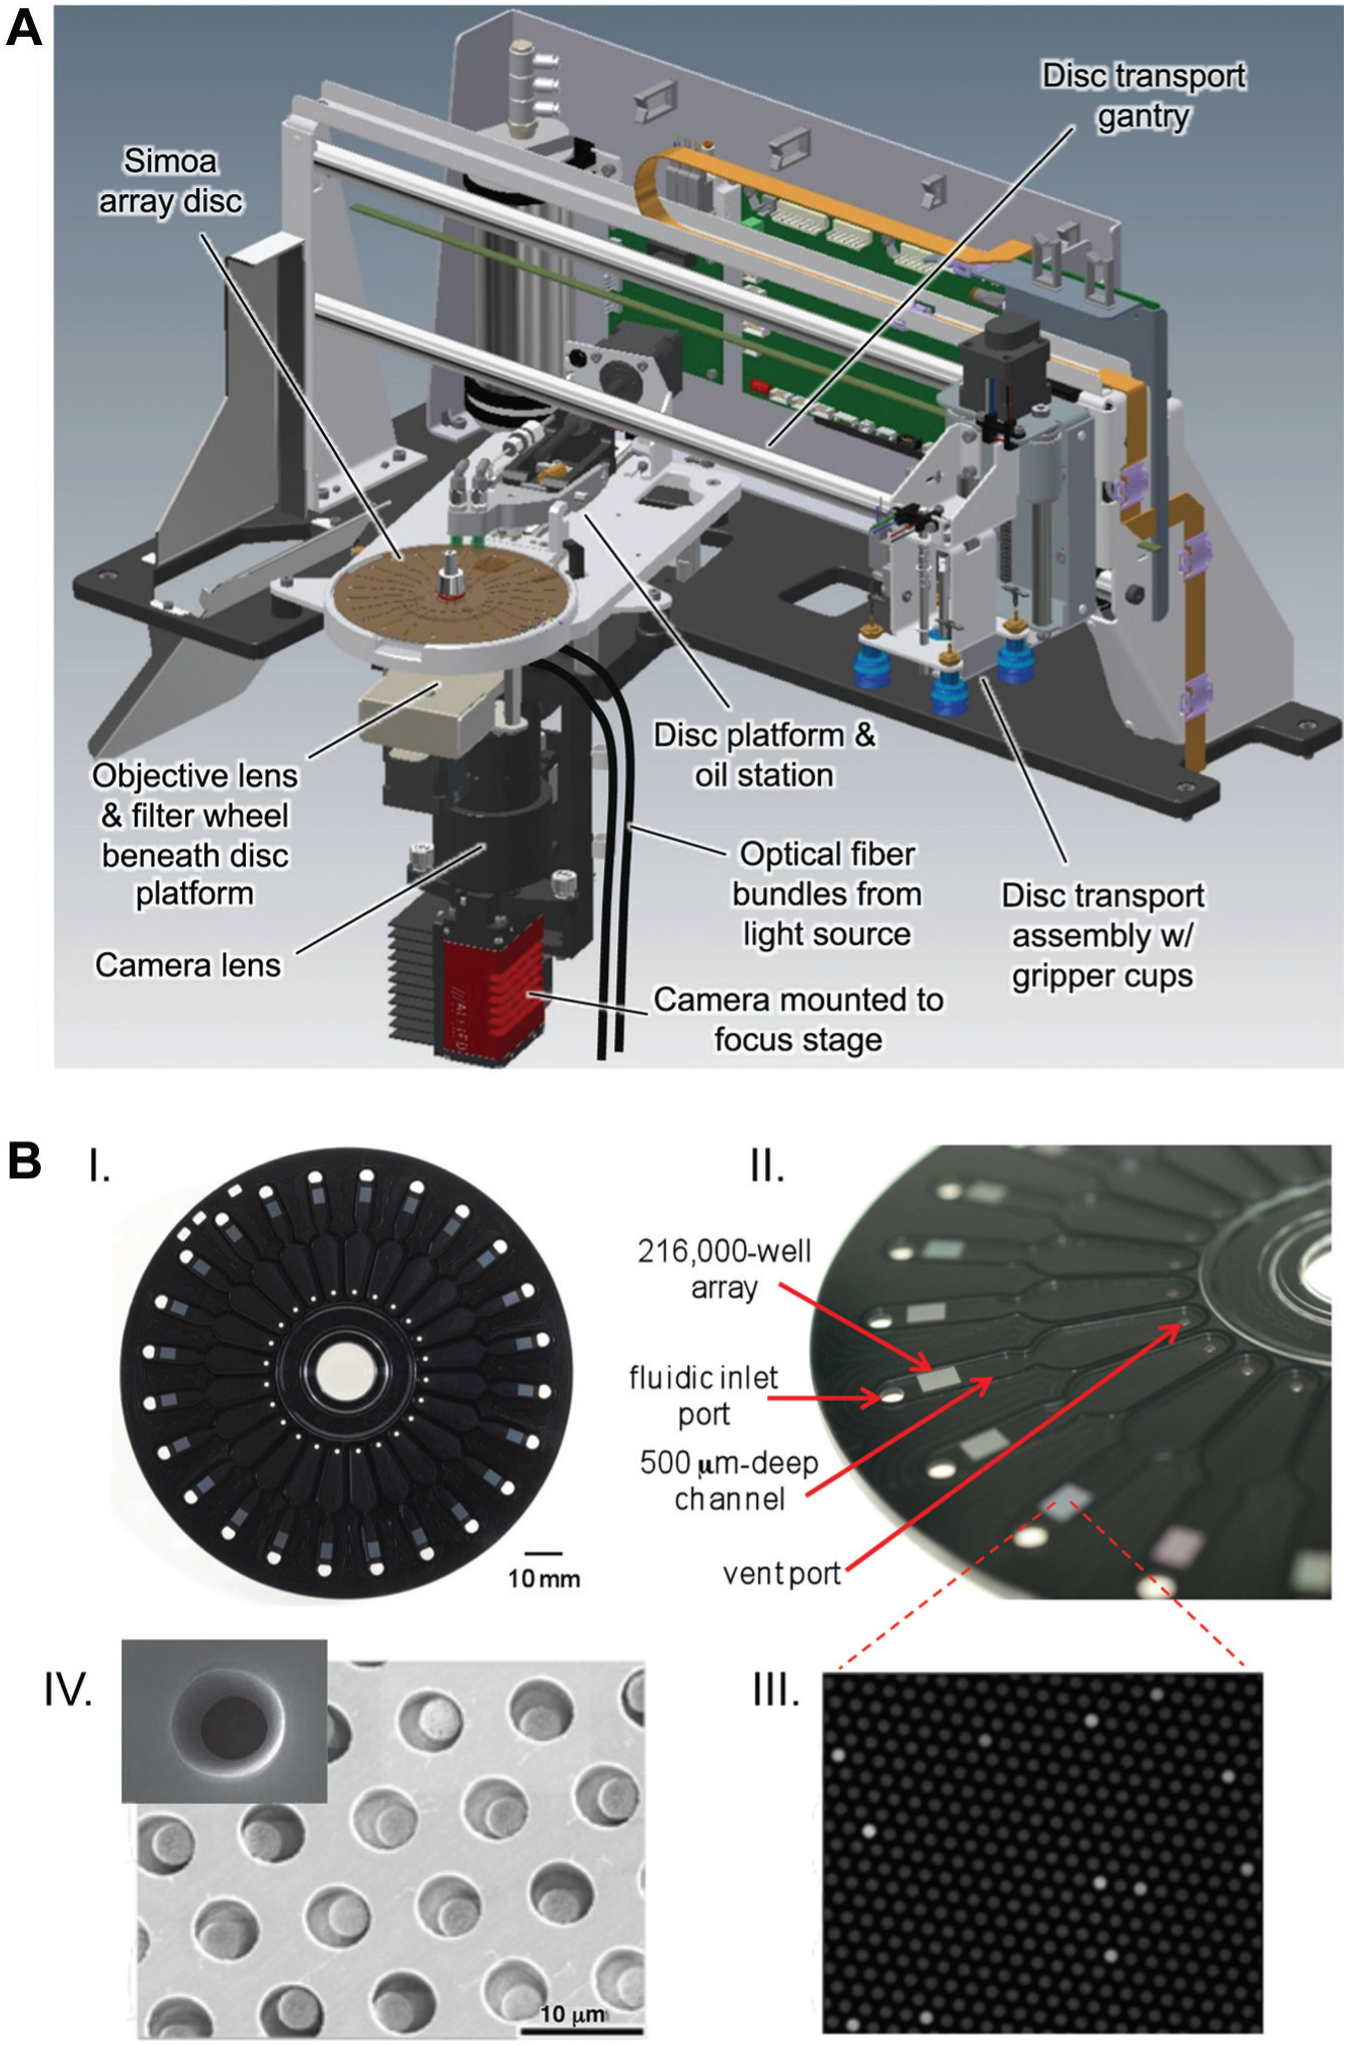
Details of the LSI module are shown in Figure 2A and described in more detail elsewhere. 23 Simoa discs (described in the next section) are conveyed to the LSI position by the disc transport system and are clamped to secure the array for imaging. A vacuum suction applied to the vent port of each array channel draws in bead slurry and oil during loading and sealing operations, respectively (described in more detail below). Array imaging takes place from beneath the disc. When processing is complete for 24 arrays (24 samples), the disc is conveyed to solid waste and replaced with a new disc. Disc removal and replacement operations are conducted in step with the 45 s instrument processing cadence. During LSI operations, one 45 s processing cadence is used for each sample to allow time for bead settling, while disc changes require five processing cadences (3.75 min).
Instrument throughput is determined by the processing cadence (completion of sequential sample processing steps every 45 s) and the time required for nonsample processing “overhead” (e.g., disc changes). Overall instrument throughput is 66 samples/h at steady-state usage. With multiplexing, multiple assays are performed simultaneously from a single sample and throughput of results becomes a multiple of 66; for example, 660 protein results per hour for a 10-plex assay. Time-to-first-result depends on the incubation time and number of washes performed during the assay. The Simoa HD-1 Analyzer utilizes the high kinetic and thermodynamic efficiency of suspended microbead capture of analyte, 24 and incubation times for capture are generally 15–30 min. Total times-to-first-result are generally about an hour, and 20 min assays have been demonstrated.
The integrated system incorporates both common and technology-specific subsystems that are controlled by a real-time software scheduling processor. Continuous testing capabilities are provided by separating the part of the system that requires operator interaction from the area that processes tests. The two areas are controlled by the same software scheduling processor, but operate independently of one another. This design makes it possible to add or remove samples, reagents, or disposables at any time without interrupting test processing. System capacities of reagent bottles, bulk liquids, and disposable components have been balanced with throughput to provide an operator walkaway time (time interval requiring no operator intervention) of approximately 4.5 h.
Operating Procedure
The Simoa HD-1 Analyzer is a completely automated system (samples in to concentrations out) that was designed to minimize operator intervention. Test orders and run load lists are entered directly through the graphical user interface via the touchscreen monitor. Samples, assay reagents, and disposables are loaded into their respective bays. Samples can be loaded either as tubes (up to 96) or in microtiter plates (up to four 96-well plates). The system accommodates 5, 7, and 10 mL primary tubes or 1 mL pediatric sample cups. When sample tubes are added to a sample rack and inserted into a lane in the sample bay, an integrated barcode reader reads sample ID barcodes as the rack is inserted.
Each sample requires three dedicated disposables (two disposable tips, one reaction cuvette) and one array on the 24-array disposable Simoa disc. Pipette tips are automatically acquired and disposed of by the sample pipettor, and reaction cuvettes are automatically retrieved for each sample from the cuvette stacks in the cuvette bay. When tests are completed, reaction cuvettes are automatically removed to the solid-waste container in the system bay. When processing is complete for each sample, results are calculated from array image files by software algorithms that include quality control (QC) checks for data quality. Results are automatically calculated and can be displayed in real time upon completion of each sample’s processing. Values are flagged if they are not within certain preset parameters (e.g., out of calibration range). The assay sequence is aborted if certain control variables are out of range.
System Features
Disposables
Simoa Disc
The Simoa disc has been described previously. 25 In brief, it is a DVD-sized disc composed of 24 arrays of femtoliter-sized microwells, arranged radially to enable fabrication using Blu-ray manufacturing processes and parallel processing of liquid handling within the instrument. Figure 2B shows the design of the integrated arrays and associated fluidic channels. Each array consists of 216,000 40 fL–sized wells, arranged in a hexagonal close-packed pattern in a rectangular 3 × 4 mm patch on the planar surface. Individual wells have nominal dimensions of 4.25 µm diameter, 3.25 µm depth, and 8 µm center-to-center spacing. The fluidic channel is 0.5 mm deep, and the total volume of the channel and fluidic inlet port is 74 µL to accommodate solutions of beads and sealing oil. The channel contains a constriction to reduce backflows of liquid. Singulation of microbeads is a critical requirement of Simoa technology, and the geometry of the microwells is sufficient to accommodate only single microbeads (2.7 µm diameter; hereafter referred to as beads). The Simoa discs are manufactured from cyclic olefin polymer (COP) due to its amenability to high-throughput injection molding, low cost, and favorable chemical, biological, and optical properties. Cyclic olefin polymer is hydrophobic, and for this reason, loading of beads into the arrays requires a vacuum to draw the solution into the fluid channel and across the array. The vacuum is applied via the vent port in the fluid channel by the instrument during the bead loading step. Another consequence of the hydrophobicity of COP is that the microwell geometry was designed with a slight draft angle of ~7–10° rather than perfectly squared-off walls to facilitate entry of aqueous bead–substrate solution into the microwells. The draft angle also facilitates removal of discs during the molding process.
Cuvettes and pipettor tips
The system uses a V-shaped, four-sided plastic reaction cuvette for assay processing steps from initial analyte capture to final concentration of beads for transfer to the Simoa disc. The V shape facilitates maximum precision of low-volume fluid handling and pellet resuspension by the system pipettor by minimizing cuvette dead volume. Pipettor tips (Axygen, Corning Life Sciences, Lowell, MA) are manufactured using a polished mold to minimize liquid retention in the tip and ensure accurate sample volumes. During sample processing, one tip is used for sample transfer, and a second tip is used for bead resuspension and transfer from the cuvette to the Simoa disc.
Temperature Control System
The incubator section of the chemistry module (washer/incubator rings) is temperature controlled by heating foils covering a high-mass aluminum baseplate for maintenance of temperature homogeneity. There are two 210 W heating foils, one below the washer ring and one below the incubator ring. One temperature control sensor is located on the baseplate near the cuvette loader side of the incubator for controlling the incubator temperature. The heating foils have sufficient power to heat the incubator section to target temperature within 30 min and to keep a filled incubator on target temperature within ±1 °C. Homogeneity of temperature measured in a liquid-filled cuvette in the incubator is designed to be within ±0.5 °C.
Optical System
The fluorescence-based optical system is comprised of an illumination module (non-epi-based) and a microscope imaging arm. The illumination module light source is a broad white light plasma source that delivers the excitation wavebands via a fiber bundle and dark-field fluorescence delivery method. The imaging optics consists of a custom wide-field-of-view five-element objective lens that has a field of view designed to capture the complete array. The imaging arm has five emission filters in collimated space and a camera lens that focuses the array image onto an 8 MP charge-coupled device (CCD) camera (Prosilica GT3300, Allied Vision, Exton, PA). The optical system has been described previously in more detail. 23
Software Scheduling
The scheduler generates and optimizes the workload for each system component. The scheduling process can be divided into two steps: creation of a resource workload for all test activities before the initiation of pipetting and optimization of that workload to minimize resource idle time and total test processing time. The order in which samples are pipetted is determined by their order in the sample tube racks or microtiter plates, depending on the chosen mode of sample input. Stat samples are given priority so that they can be completed in the shortest amount of time possible. The test constituents will not be pipetted until the scheduler ensures that all resources required for each test activity will be available at the times specified in the test’s assay definition. When scheduling can be achieved, the test constituents are pipetted and transferred into the incubation ring.
Software Features
The software controlling the system includes inventory tracking of system consumables (disposables, bulk liquids, reagents, and waste), user-editable assay parameters and dilutions, automatic data reduction, customizable report formats, and network connectivity via a dedicated Ethernet card. The users can create custom assay protocols for their own “home brew” reagents. Home brew protocol options include the number of assay steps, aspiration–dispense volumes, temperature, and incubation times. Data reduction features include calibration curve fitting optimization with custom level-by-level weighting, calibration curve refitting, curve fitting residuals for feedback on fitting accuracy, and conversion of average enzymes per bead (AEB) values to concentrations.
Assay Protocol Flexibility
The mechanical components of the instrument were developed in conjunction with the software scheduler to provide a system capable of processing tests in a variety of different protocol configurations. Assay protocols can be executed with one-, two-, or three-step formats. Delays in reagent dispense can be incorporated into one- or two-step protocols. This feature can also be used for pretreatment protocols whereby samples can be incubated with pretreatment reagent prior to the addition of capture bead reagent. The instrument is also designed for flexibility on sample dilutions, including the use of multiple cuvettes for large dilutions and separation of pretreatment steps.
Assay Calibration
Assay calibration for quantitative assays is accomplished by user-performed calibration; factory-generated master calibration curves with one to three calibrator adjusters are also supported by the software architecture. User-performed calibration can be performed with every run or by storing a calibration curve for multiple runs. Calibration curve fitting options for home-brewed assays include point-to-point, linear regression; cubic fit; and four- or five-parameter logistic curve fit. Prevalidated assay kits have preoptimized calibration fitting. Qualitative assays utilize a single-point calibration for calculating a cutoff or index value to which all samples are referenced.
Principles of Operation
The ultrahigh sensitivity enabled by Simoa digital immunoassays has been discussed previously. 22 In brief, the enzyme–substrate reaction in analog immunoassays is conducted in relatively large reaction volumes (50–100 μL) that dilute product molecules during the signal generation step. Diffusion and dilution of signal molecules limits sensitivity to the picomolar range. In contrast, Simoa restricts this diffusion of the fluorescent product molecules from the enzyme–substrate reaction by confining individual labeled immunocomplexes and substrate to femtoliter-sized wells. When a single enzyme label catalyzes substrate conversion to a fluorescent product, the resulting fluorophores are confined to the well, creating a measurable fluorescence signal in a short period of time. With a camera field of view encompassing hundreds of thousands of microwells, thousands of single-molecule signals in the array can be counted simultaneously. The counting of active and inactive wells constitutes a digital signal corresponding to the presence or absence of single enzyme molecules. This extreme sensitivity permits use of low quantities of labeling reagent, which lowers nonspecific interactions and dramatically increases signal–background ratios.
Simoa digital immunoassays consist of two main parts: capture and enzyme labeling of target analytes on capture beads (standard bead-based ELISA processing) and isolation of individual beads in single-molecule arrays for quantification of analyte (ELISA digitization). Singleplex and multiplexed assays are conducted with the same instrument pipetting operations, but multiplexed assays utilize dye-encoded beads for identification of assay-specific beads. Sample processing by the instrument initially involves the capture and labeling of analytes with enzyme (conjugate of streptavidin ß-galactosidase [SßG]). In a three-step protocol, capture beads are first added by the instrument into a reaction cuvette by the fixed-tip pipettor. Sample is then added to the cuvette with a disposable-tip pipettor, and the cuvette is agitated to mix the sample and beads. After capture of analytes, the beads are washed and the fixed-tip pipettor dispenses biotinylated secondary detection antibody (detector) to the cuvette to form a captured analyte sandwich. Beads are resuspended by directing the reagent dispense to the bead pellet. Following a second wash, SßG is added by the fixed-tip pipettor to complete the labeled immunocomplex. In a two-step assay protocol, detector is allowed to incubate with sample and capture beads prior to washing, while in a one-step assay protocol, all components (beads, detector antibody, and enzyme) are incubated together prior to washing. Following brief incubation with SßG, the beads are again washed in preparation for transfer to the Simoa disc. Transfer of beads to the Simoa disc initiates a series of instrument operations comprising the second part of the assay: single-molecule counting and digital data processing. These operations are described below for singleplex and multiplexed assays.
Use of a disposable-tip pipettor eliminates carryover risk during the initial sample handling. Carryover from fixed-tip pipettors is minimized with aggressive pipettor washing of both external and internal surfaces. In carryover studies, no significant carryover was observed, with adjacent samples exhibiting 7 logs of concentration difference (not shown).
Array Loading
Assay digitization starts with the disposable-tip pipettor concentrating the washed beads by resuspending them in 25 µL of enzyme substrate (resorufin ß-D-galactopyranoside [RGP]). To ensure complete dispersion of the beads, the pipettor performs an aspiration–dispense sequence. Fifteen microliters of the mixture of RGP and beads is then transferred to the LSI module via the inlet port of a Simoa disc in preparation for imaging and analyte quantification ( Fig. 2B ). This step represents the integration handoff between the chemistry module and the LSI module. To accomplish the transfer for every cuvette, the disc indexes in time with the instrument processing cadence to present an unused array for transfer by the disposable-tip pipettor. The bead suspension is pulled through the entry channel and across the array by negative pressure applied via a vent port on the opposite side of the array ( Fig. 2B ). The bead solution sweeps across the array, and beads settle rapidly into array wells under the influence of gravity (they contain 14% iron by weight). Starting with 500,000 beads in 15 µL of substrate solution, quantitative analyses of array images have shown that approximately half the wells become occupied after several minutes of bead settling. 25 For the Simoa HD-1 Analyzer, the settling time was reduced to 90 s spread between three instrument processing cadences. As the beads are settling into the array, the instrument indexes the disc for other operations (sealing and imaging) on arrays that have already been loaded. Typically, 25,000–50,000 beads are interrogated. Because the unit of measure in Simoa (AEB) is a ratio, differences in absolute bead loading do not affect data quality or precision across a broad range, provided there are sufficient numbers of beads to remain above the Poisson noise floor. 22 Data quality is affected when Poisson noise dominates the error in the measurement. This occurs when the number of positive wells associated with background drops to below about 50 beads, at which time Poisson contributes significantly to the coefficient of variance (CV) of the measurement. Assuming a background of 1% positive wells, a minimum bead fill target would be 5000.
Array Sealing
Development of a rapid, nonmechanical means of sealing the arrays has been described. 25 In brief, fluorocarbon oil is utilized to displace the aqueous bead solution from the array surface and entrap an aqueous phase within the wells. The aqueous solutions within the wells are not displaced from the wells due to the array topography and surface tension within each well. To deliver the oil to the arrays, the instrument indexes the disc to the oil delivery station, and 50 µL of oil is dispensed into the inlet port of the disc while vacuum is applied to the vent port ( Fig. 2B ). In addition to sealing the wells of the array, the oil displaces the aqueous solution on the surface of the array, removing excess beads from the surface. Previous data have shown that this simple process results in sealed wells stable beyond the two-cadence processing time allotted for sealing and imaging. 25
Array Imaging
Array imaging involves interrogating every well in the array for the presence of a bead and determining whether the bead has enzyme activity. To accomplish this, image analysis software was developed that first creates a “mask” of the array to define well positioning and boundaries for interrogation. 26 The well mask is then applied to the fluorescence images of the array to determine the presence of beads and enzymes within the wells. For the fluorescence images of the array, histograms of fluorescence intensity are generated for the bead population or bead subpopulations when multiplexing. Peaks in the histograms are identified automatically and used to determine the populations of empty wells (low fluorescence) and populations of beads exhibiting fluorescence.
All wells in the array are imaged in single exposures at 1.15 µ resolution at multiple excitation/emission wavelengths. To execute the imaging, the instrument indexes a loaded and sealed array to the location of the optical system, and a series of measurements are taken. First, a dark-field image of the array is acquired through overlapping 622/615 nm excitation/emission filters. This image is used to build the well mask for subsequent measurements. Second, an image at 574/615 nm is acquired; this is the initial image of the resorufin signal (frame 1). Third, a second resorufin image at 574/615 nm is acquired 30 s after the initial image (frame 2). Finally, an image at 490/530 nm is acquired to identify wells with beads utilizing inherent fluorescence properties of the beads (from polymer autofluorescence). Growing fluorescence between the two separate resorufin measurements (frame 2 − frame 1) is required for a well to be classified as a positive signal. The software disregards nongrowing fluorescence, as, for example, from fluorescing debris such as a dust particle. During image processing, at low concentrations of captured analyte the fraction of on beads (f(on)) are counted in the array mask and converted to a digital AEB using a Poisson distribution equation as described. 27 The digital range of the technology extends to an f(on) of ≤ 0.7, below which Poisson statistics predict the majority of beads will be labeled with a single enzyme. At higher concentrations of captured analyte, where essentially every bead is associated with at least one enzyme, the array fluorescence is processed to calculate an analog AEB, as described. 27 The digital range is limited to the Poisson distribution of single-molecule probability across the array capacity; with the Simoa disc array size, approximately 2.5 logs of usable digital immunoassay range are available. Combining digital AEB with analog AEB extends the usable assay dynamic range to more than 4 logs. The concentration of analyte is then interpolated from a standard curve of AEB versus concentration.
During classification of beaded wells and determination of enzyme activity, the fluorescence and location of wells are corrected for the following: optical cross talk (aberrations) and scattering, background nonuniformity, axial color aberrations in the optical imaging arm, and bleed of fluorescence of dyes outside their dominant wavelengths. Images are saved as an image-processing lab file for image analysis processing. Total data acquisition time for each array is <45 s, during which time almost 650,000 individual measurements are made, from which counts of beaded wells (typically 25,000–40,000) comprise the measurements used for analysis of each singleplex sample.
Multiplexing
Multiplexing Simoa digital immunoassays has been described. 26 At the instrument level, multiplexing involves the same process described above for singleplex assays. The ability to multiplex with Simoa technology rests with the ability to identify which beads loaded onto the array correspond to each assay. This capability is achieved through a combination of bead encoding with dyes of different fluorescence properties and intensities, and discerning different bead subpopulations through the appropriate band pass filters and intensity measurements. The single-molecule signal (resorufin) remains the same for both singleplex and multiplex assays. The multiplex imaging sequence entails the steps described above for a singleplex assay (see “Array Imaging”), but additional analysis steps are included at different excitation/emission wavelengths to identify assay-specific bead subpopulations labeled with different fluorescent properties. From a technology standpoint, since the single-molecule resorufin signals are counted and assigned to each assay in the same way as with singleplex assays, multiplexed assays retain the same single-molecule sensitivity to label as their singleplex counterparts. However, from a chemistry standpoint, realizable sensitivity is also dependent on interactions between the reagents combined in the plex.
While the principle of assay-specific bead addressing and image acquisition is straightforward, image processing entails more sophistication to optimize data quality and minimize optical cross talk. Optical cross talk occurs when signal from one well optically scatters into its neighboring wells. Optical scatter of fluorescence from resorufin produced by many enzyme labels on a bead into a neighboring well containing a bead with few or no enzyme labels could result in a falsely elevated AEB value or incorrect classification of the bead as active. This affects only multiplex assays because positive wells from singleplex assays have similar levels of signal, and at high signal (f(on) > 0.7), AEB is calculated from total fluorescence intensity. To reduce the impact of optical scatter, image processing includes a computational method for its active correction, as described. 26
The number of multiplexed assays possible with Simoa is limited by the size of the array, the camera field of view, and the ability of the optical system to reliably discern unique fluorescent signals on the array. From an array size standpoint, an upper limit of the number of wells that can be imaged using a low-cost CCD camera is approximately 200,000. To maintain dynamic ranges of multiplexed assays, approximately 20,000 wells should be available for each assay. From a signal discernment standpoint, the bandwidth of the optical system limits the number of available dyes to about four, and the number of discernable intensity levels of each dye to two or three. Thus, the Simoa HD-1 Analyzer is capable of multiplexing assays for up to 10 different proteins. From a practical standpoint, the single-molecule sensitivity of multiplexed digital immunoassays will likely be more limited by biological cross-reactivity between combinations of antibodies in the same reaction mixture, a challenge common to all immunoassay multiplex technologies. The analytical performance of a digital cytokine 3-plex is described in “Results” below.
Experimental Methods
Array Loading
Bead loading efficiency was characterized by individual well counting across a variety of assays and sample types, and tabulated as percent bead fill. Independence of percent bead fill variation with calculated analyte dose precision was verified with repeated measurements of a single level of analyte and comparison of percent bead fill CVs with replicate-dose CVs.
Array Sealing and Imaging
Sealing and image fitness was routinely monitored in a number of ways, including functional system performance with assay QC runs (precision monitoring); maintenance of image quality thresholds such as focus scoring, bead classification efficacy, within-channel fluorescence integrity, and absence of excessive cross-channel bleeding; and acceptable levels of optical scattering. Preparation of fluorescent beads for optical and assay determinations has been described previously. 26
Temperature Performance
Temperature control performance was tested by placing temperature loggers at various positions within the instrument and testing temperature washer/incubator set points at 25 and 37 °C. Temperature was monitored across multiple instrument runs of 2–3 h each, with different periods of instrument inactivity between the runs (from 1 to 15 h). Temperature was also monitored with thermocouples mounted in liquid-filled cuvettes, with leads routed to a data logger in a way that permitted movement of the cuvette.
Assay Performance
The performance of the Simoa HD-1 Analyzer with 16 singleplex assays and a multiplex of three of the singleplex assays was characterized. Singleplex assays and the multiplex panel were developed according to the principles previously described26,27 using commercially available antibodies and calibrator antigens. Analysis of images for singleplex assays utilized the three optical channels described in “Array Imaging” above for well positioning, bead counting, and single-molecule signal counting, while analysis of the 3-plex utilized the 622/615 nm channel (well mask), the 574/615 nm channel (resorufin channel), and three additional channels to identify assay-specific beads coded with different fluorescent dyes: 490/530 nm for interleukin 6 (IL-6) beads, 680/720 nm for tumor necrosis factor alpha (TNFα) beads, and 740/800 nm for IL-10 beads. All assays utilized three reagents: paramagnetic capture beads, biotinylated detector, and SβG conjugate. Capture beads and biotinylated detector were prepared by standard coupling chemistry as described previously. 28 Capture beads were generally adjusted to 5 × 10⁶/mL, detector concentrations generally ranged from 0.3 to 0.5 µg/mL, and SβG generally ranged from 130 to 150 pM. Depending on the assay, two-step or three-step pipetting protocols were employed, utilizing 100 µL of each reagent for each sample. All assays (except p24) minimized interferences and matrix effects by performing an automatic 1:2 or 1:4 predilution of samples with assay-specific sample diluent to lessen the serum content of the capture mixture; p24 assays were run on undiluted plasma. Assay-specific sample diluents were generally formulated with phosphate buffer, a protein stabilizer, surfactants, and heterophilic blocking agents. Precision was determined with guidance from Clinical Laboratory Standards Institute (CLSI) Protocol EP5-A. 29 Minimally, calibrators and test samples were assayed in replicates of three, 2 separate times per day, for 5 days. A fully nested analysis of variance was performed to determine within-run, between-run, and between-day CVs. Limits of detection (LoDs) were determined for each calibration curve at 2.5 standard deviations (SDs) above background (commonly used in life science research). LoDs determined from every run were averaged for an overall mean (minimum of 10 runs). Limits of quantification (LoQs) were estimated from replicate-dose CVs from diluted serum or plasma samples (n = 3) obtained over multiple days. The estimated LoQ was the concentration corresponding to a 20% CVdose from nonlinear regression fitting. For one assay (prostate-specific antigen [PSA]), these methods for estimating LoDs and LoQs were compared to a standardized protocol in general use for in vitro diagnostic assays: CLSI Protocol EP17-A. 30 This procedure utilizes a panel of ultralow prepared samples and between-run imprecision for estimating LoDs and LoQs. For these estimates, 10 ultralow PSA samples, ranging from approximately 0.02 to 0.25 pg/mL, were prepared in female serum and tested repeatedly over 5 days × 2 runs/day to obtain total imprecision estimates for each sample level. LoDs and LoQs were calculated as prescribed. 30 As a measure of Simoa automation outcome, a comparison was made between sensitivity characteristics of three assays developed using the manual first generation of Simoa technology, 22 with the sensitivity characteristics of the same assays converted to shortened automated formats on the Simoa HD-1 Analyzer. The three previously reported manual assays were total tau, 31 p24 antigen, 32 and PSA. 33 As an illustration of potential novel clinical utility possible with Simoa sensitivity, two of these automated assays were used to test samples normally undetectable with conventional immunoassay. In the first illustration, 30 plasma samples from the COBRIT traumatic brain injury (TBI) trial 34 were assayed for tau using the automated total tau assay. In the second illustration, 24 serum samples from blood donors with early HIV infection were assayed for p24 antigen, and the detection sensitivity was compared to an amplified nucleic acid test (NAT) method.
Results
Array Loading
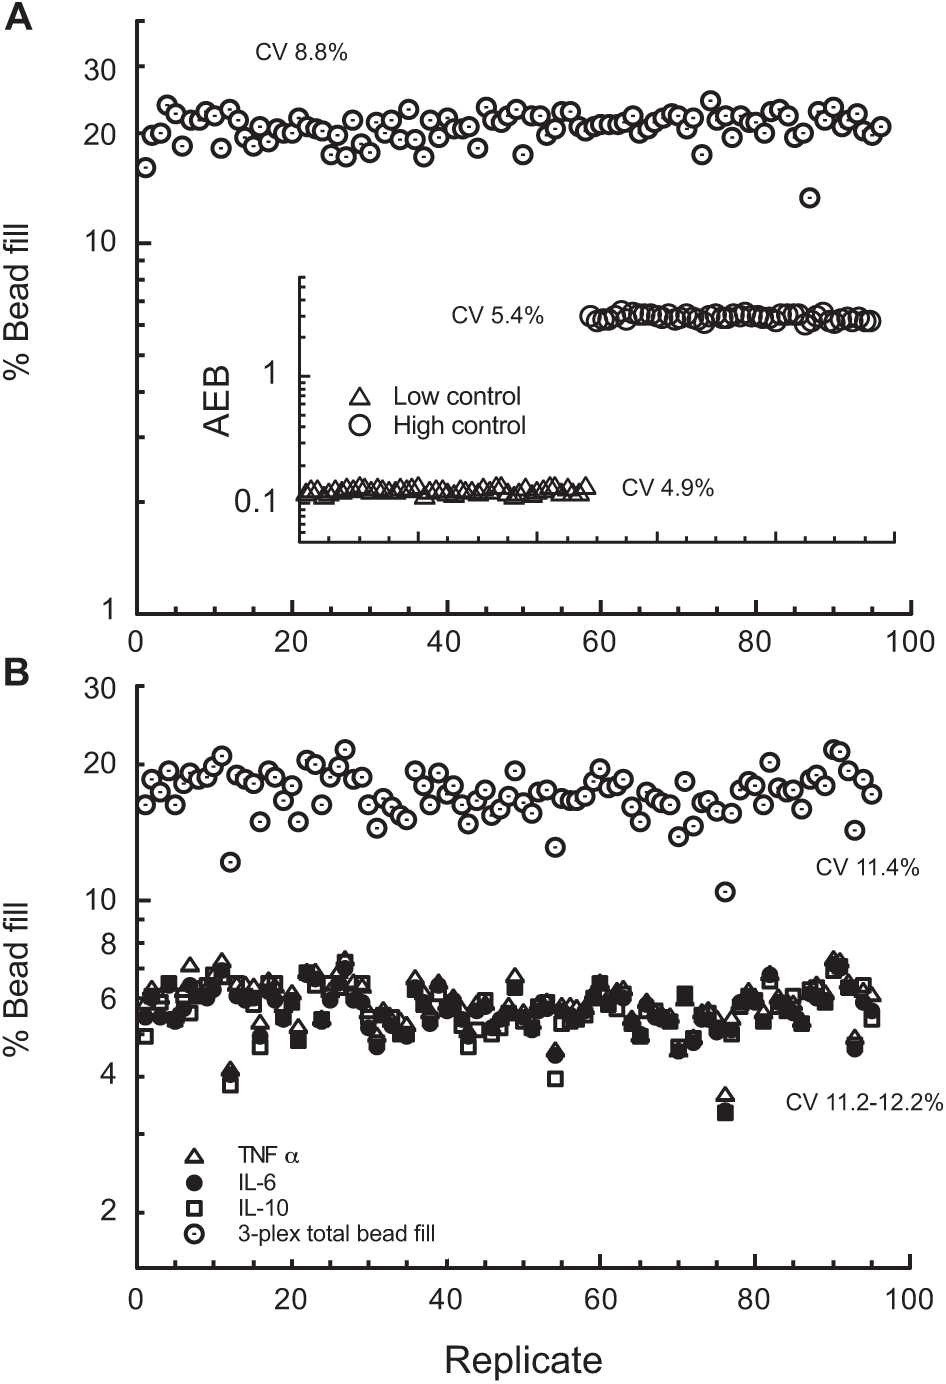
Representative array loading efficiency data are shown in Figure 3 . Loading efficiency generally ranged from 15% to 20% for singleplex assays ( Fig. 3A ) and 4–6% for multiplex assays ( Fig. 3B ), corresponding to approximately 25,000–40,000 and 10,000 beads, respectively, per replicate. Coefficients of variance for bead loading were typically 10–20%. As illustrated in the Figure 3B inset, bead loading precision does not translate into AEB (or dose) precision provided there are sufficient beads for reliable counting statistics. The differences in bead loading efficiencies are due to numbers of beads used for singleplex versus multiplex assays. Singleplex assays utilize 400,000–500,000 beads, while multiplex assays utilize 100,000–200,000 beads/assay. Choice of bead number depends on several factors, including providing sufficient bead numbers for proper pellet formation and dispersion during bead wash steps. Too few beads tended to result in higher CVs associated with bead loss and inconsistent bead labeling.
Representative bead loading into Simoa array. (
Array Sealing and Imaging
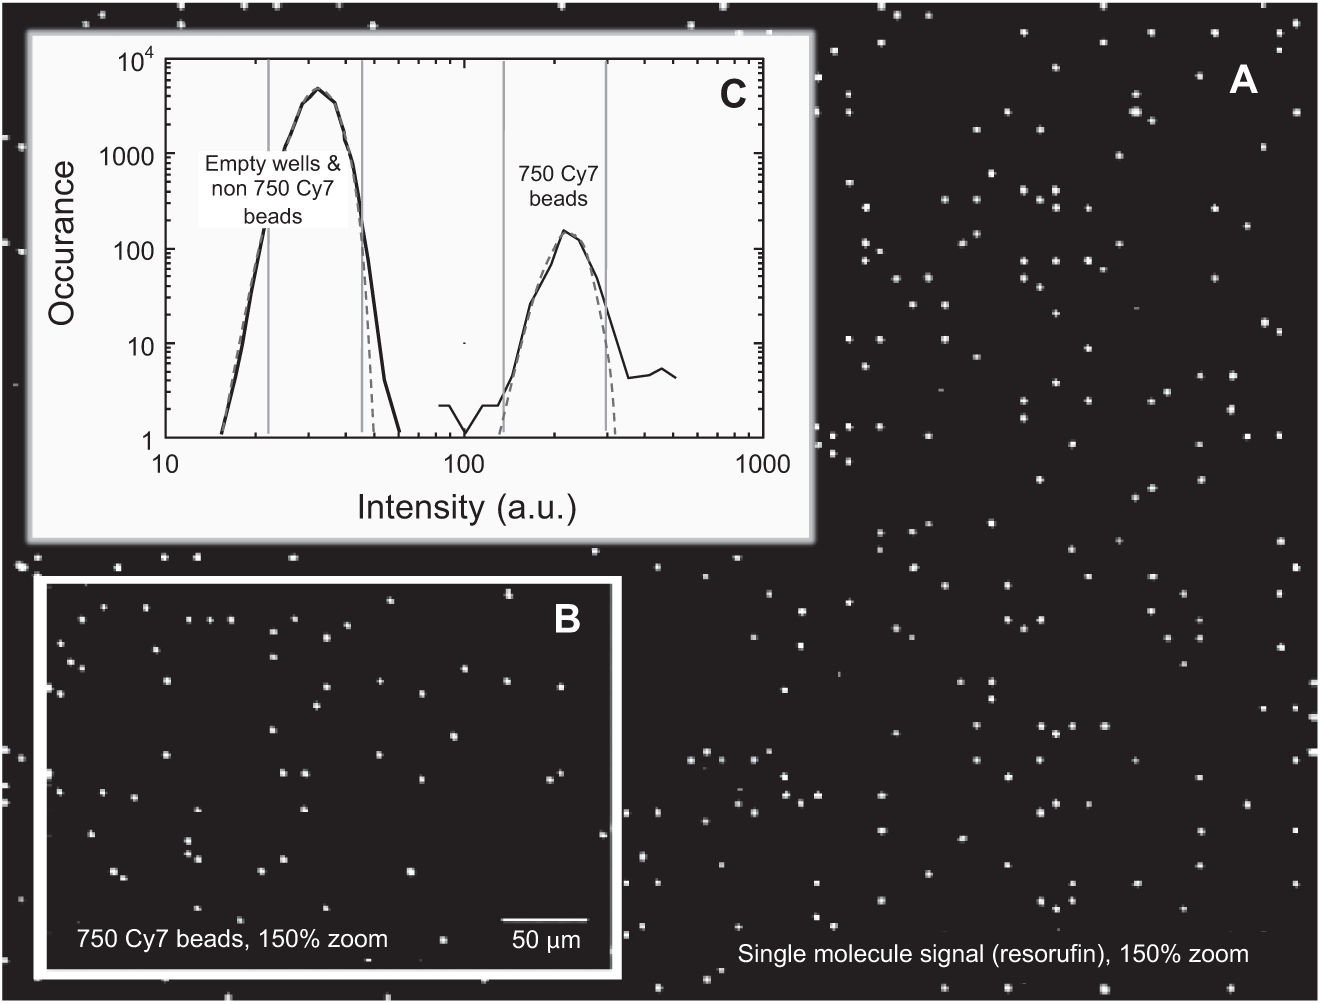
Representative images reflecting a sealed array are exhibited in Figure 4 . Discrete points of light in the resorufin channel (574/615 nm) shown in Figure 4A reflect fluorescent signals from single enzyme label molecules confined within each active array well. Total time for development of these single-molecule signals was 30 s. Figure 4B exhibits the fluorescence signal from encoded beads at an emission wavelength of 800 nm. This signal was used to determine the location of beads associated with the IL-10 assay in the multiplex panel. Other emissions channels were used to locate beads associated with the other two assays in the 3-plex (not shown). Figure 4C depicts a histogram of fluorescence intensity acquired at excitation/emission 740/800 nm identifying the subpopulation of encoded beads corresponding to the IL-10 assay in the 3-plex. Intensity histograms were used to identify multiplex bead subpopulations and confirm the integrity of channels between subpopulations. As shown previously, fluorescence from bead coding dyes used for the 3-plex did not significantly change the signals in the resorufin channel, allowing for the detection of single enzyme molecules for each of the plexed assays. 26
Representative imaging and bead identification from an array of loaded and sealed beads from a 3-plex immunoassay. (
Temperature Control Performance
Representative internal instrument temperature data are depicted in
Assay Performance
The assay performance capabilities of the Simoa HD-1 Analyzer are displayed in Table 1 across a range of immunoassays covering inflammation, neurology, oncology, metabolism, cardiovascular health, and infectious diseases. In general, these fully automated assays exhibit ≥4 logs of measurement range, single-digit CVs, and sensitivities in the femtogram per milliliter range. Required sample volumes are modest (generally 25 µL), and total assay times are approximately 1 h. With femtogram per milliliter sensitivity, the Simoa HD-1 Analyzer is approximately 3 logs more sensitive than conventional fluorescence, chemiluminescence, and electrochemiluminescence immunoassay instrumentation. Noteworthy is that sensitivity and precision performance of the assays in the 3-plex was comparable with that of their singleplex counterparts. While multiplex performance in any technology will be subject to the compatibility of the reagents in the plex (e.g., biological cross-reactivity), these data indicate that with antibodies that play nicely together, the technology provides the same level of single-molecule sensitivity and precision performance as singleplex assays.
Summary of Simoa HD-1 Immunoassay Characteristics.
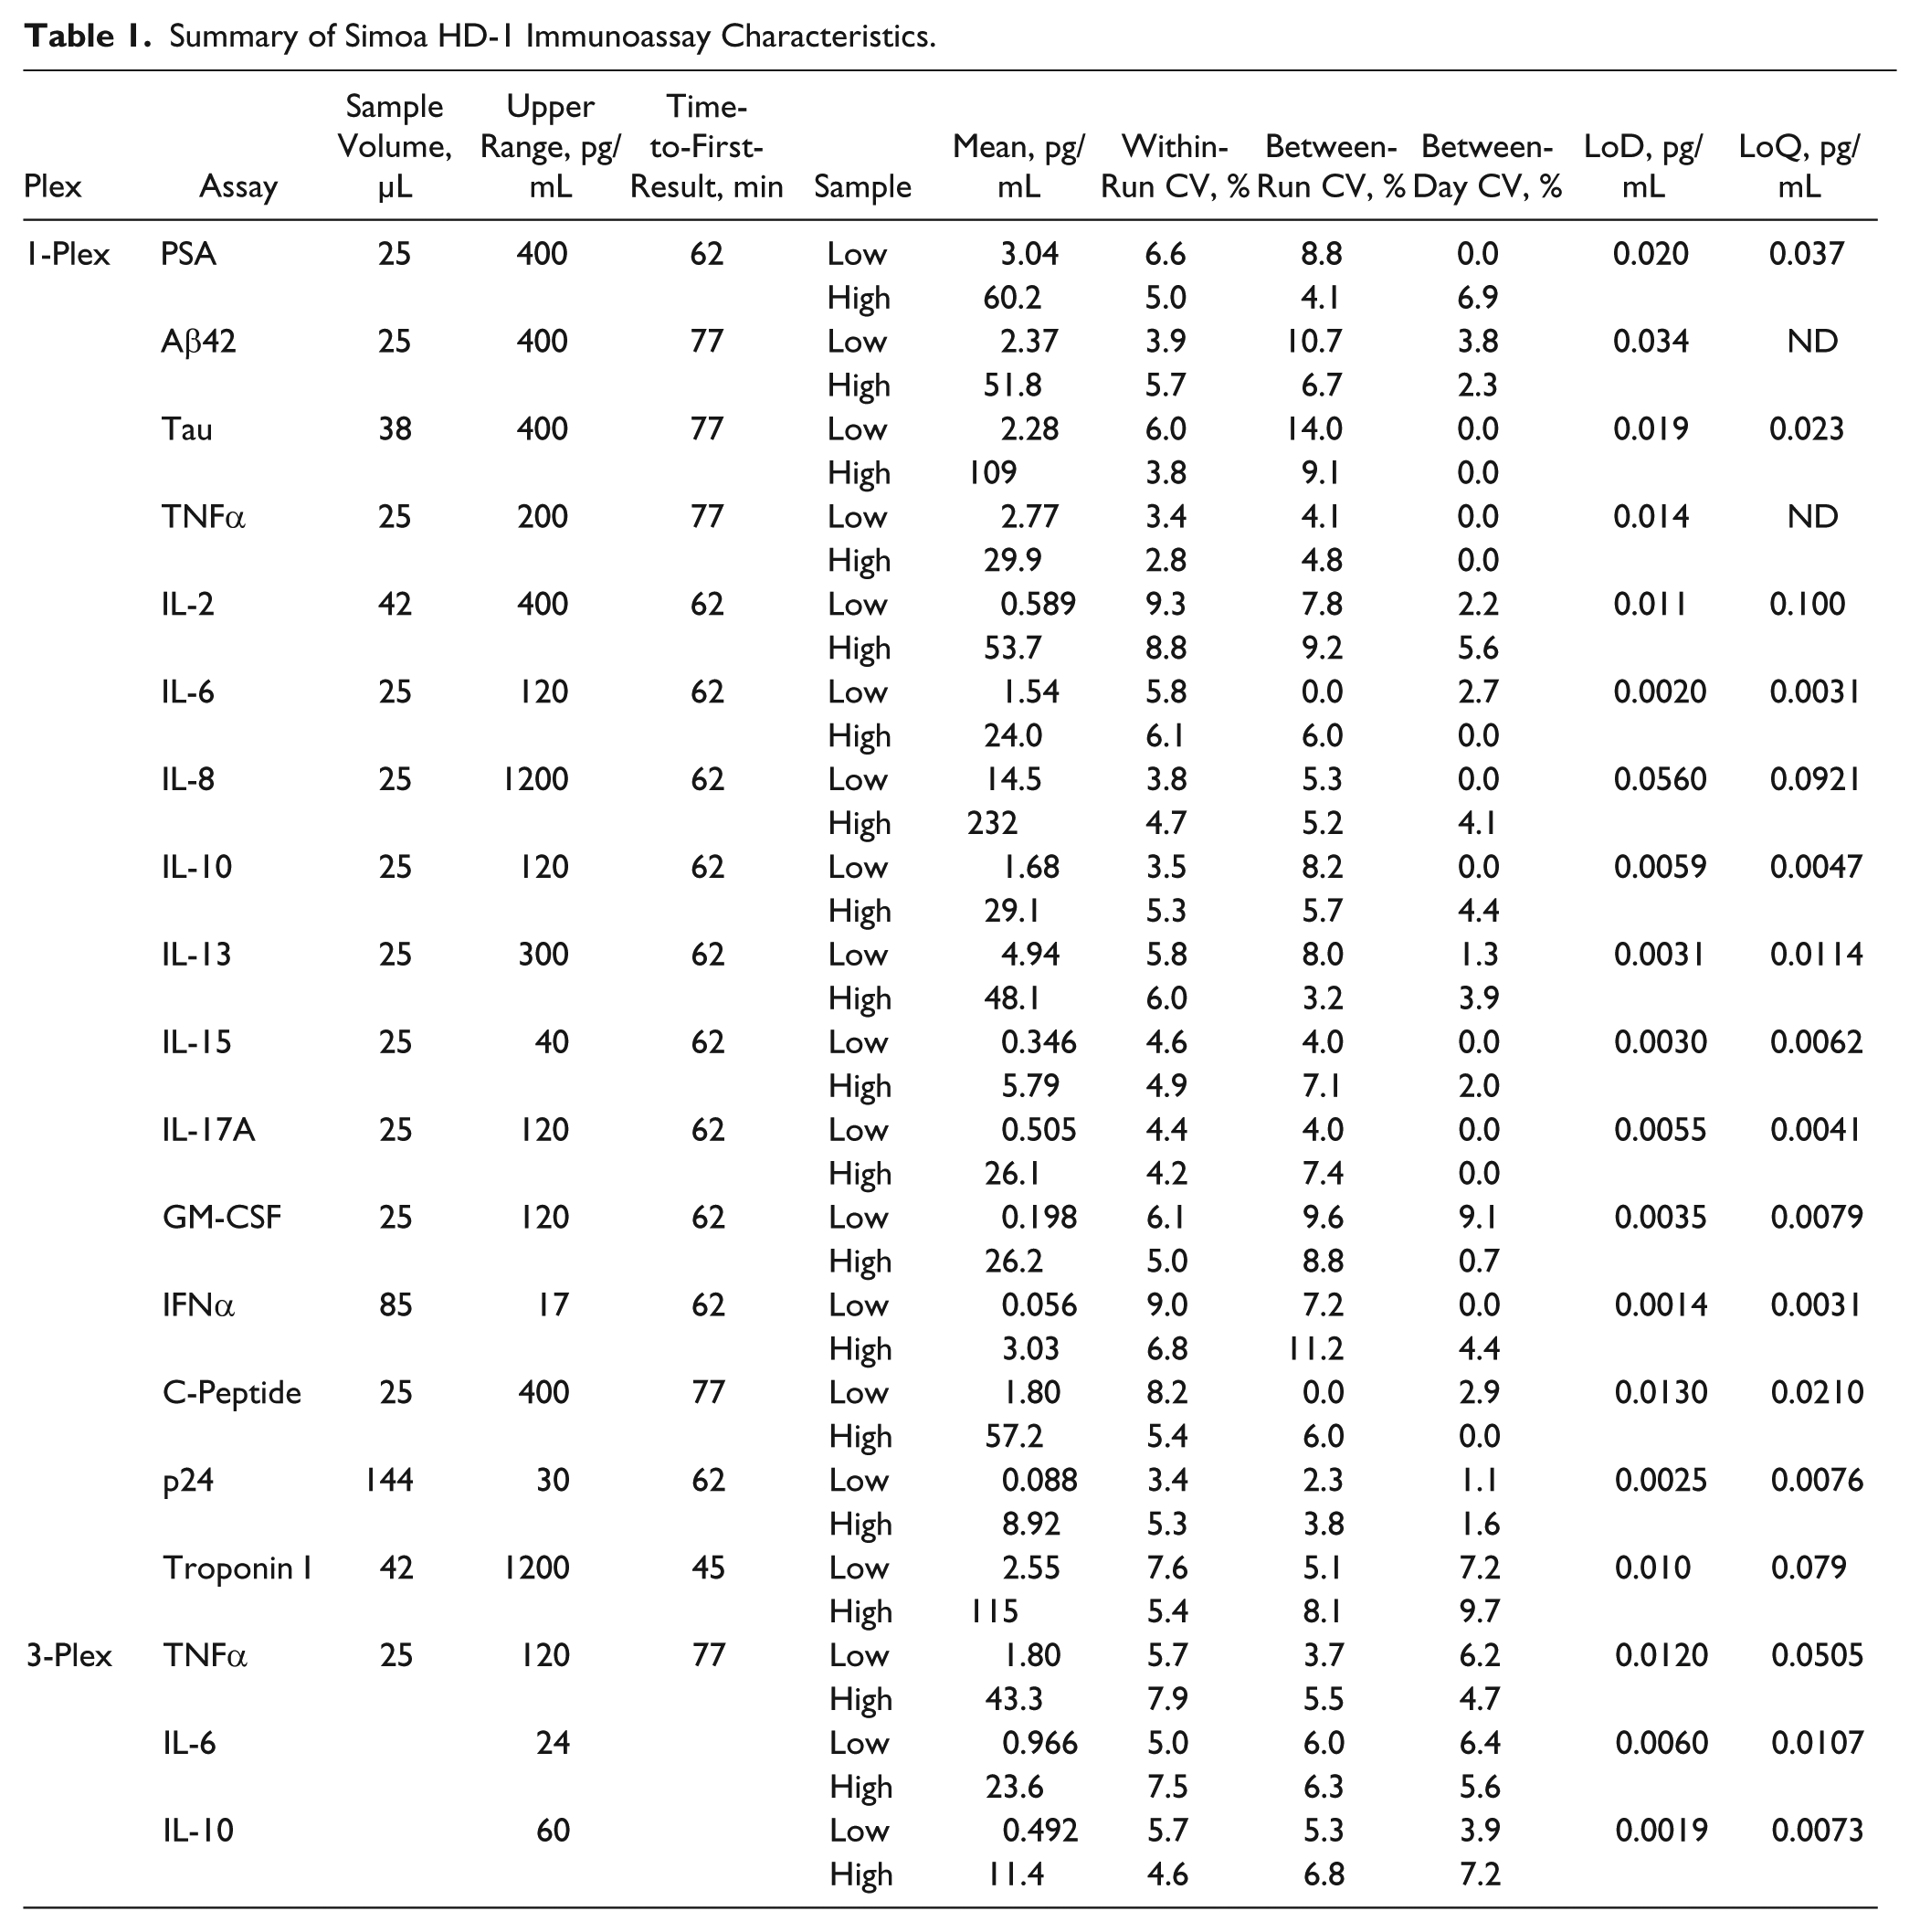
Granulocyte macrophage-colony stimulating factor; IFNα, interferon alpha; ND, not determined.
Analytical data from the 3-plex of TNFα, IL-6, and IL-10 are exhibited in Figures 5 and 6 . The LoQ for the IL-10 assay was estimated as 0.0073 pg/mL ( Fig. 5A ). Dose–response curves for all three assays in the multiplex are exhibited in Figure 5B , C . The digital and analog ranges were seamlessly stitched together with AEB calculated from counting of single molecules (f(on) 0.7 and lower) and AEB calculated from fluorescence measurements calibrated with Isingle (f(on) > 0.7). Isingle is the average fluorescence intensity produced by a single enzyme molecule and is used to calculate the average number of enzymes per bead on beads that have multiple enzymes per bead. Determination of Isingle and its use has been described previously. 27 The assay ranges depicted in Figure 5C are inaccessible to conventional immunoassay technologies. Backgrounds are generally in the range of AEB = 0.005–0.01, nearing the lower floor of Poisson noise. 22
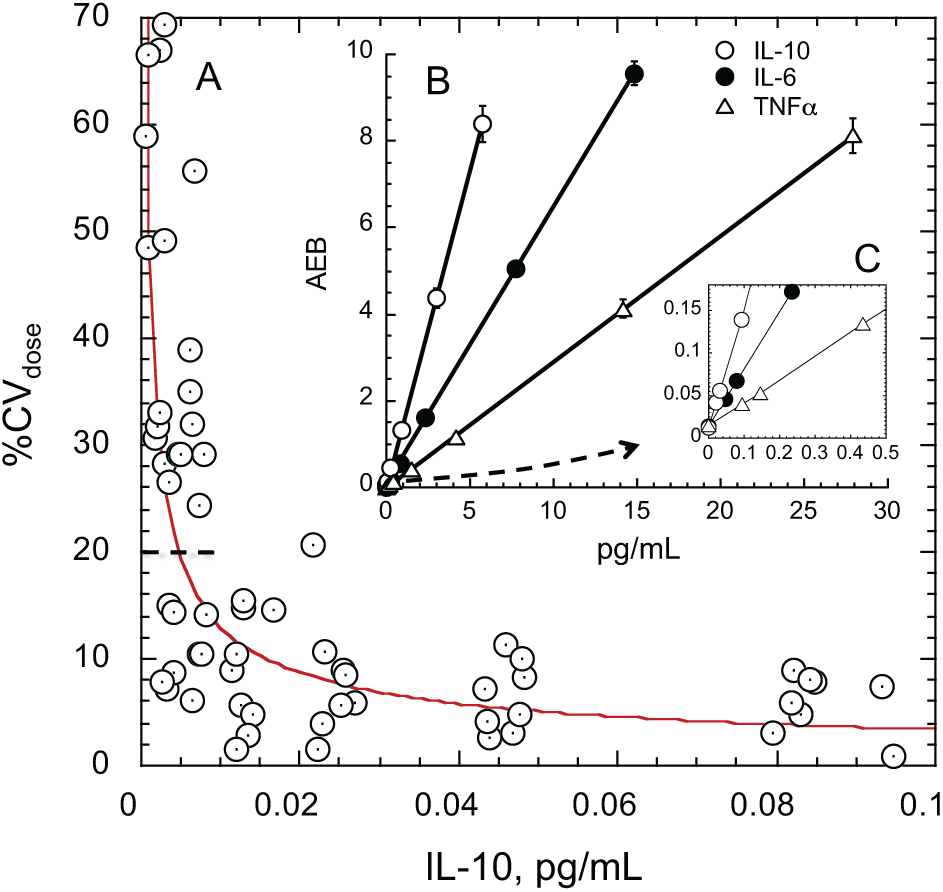
LoQ estimate for multiplexed IL-10 assay and representative dose–response curves for all three assays in the plex. (
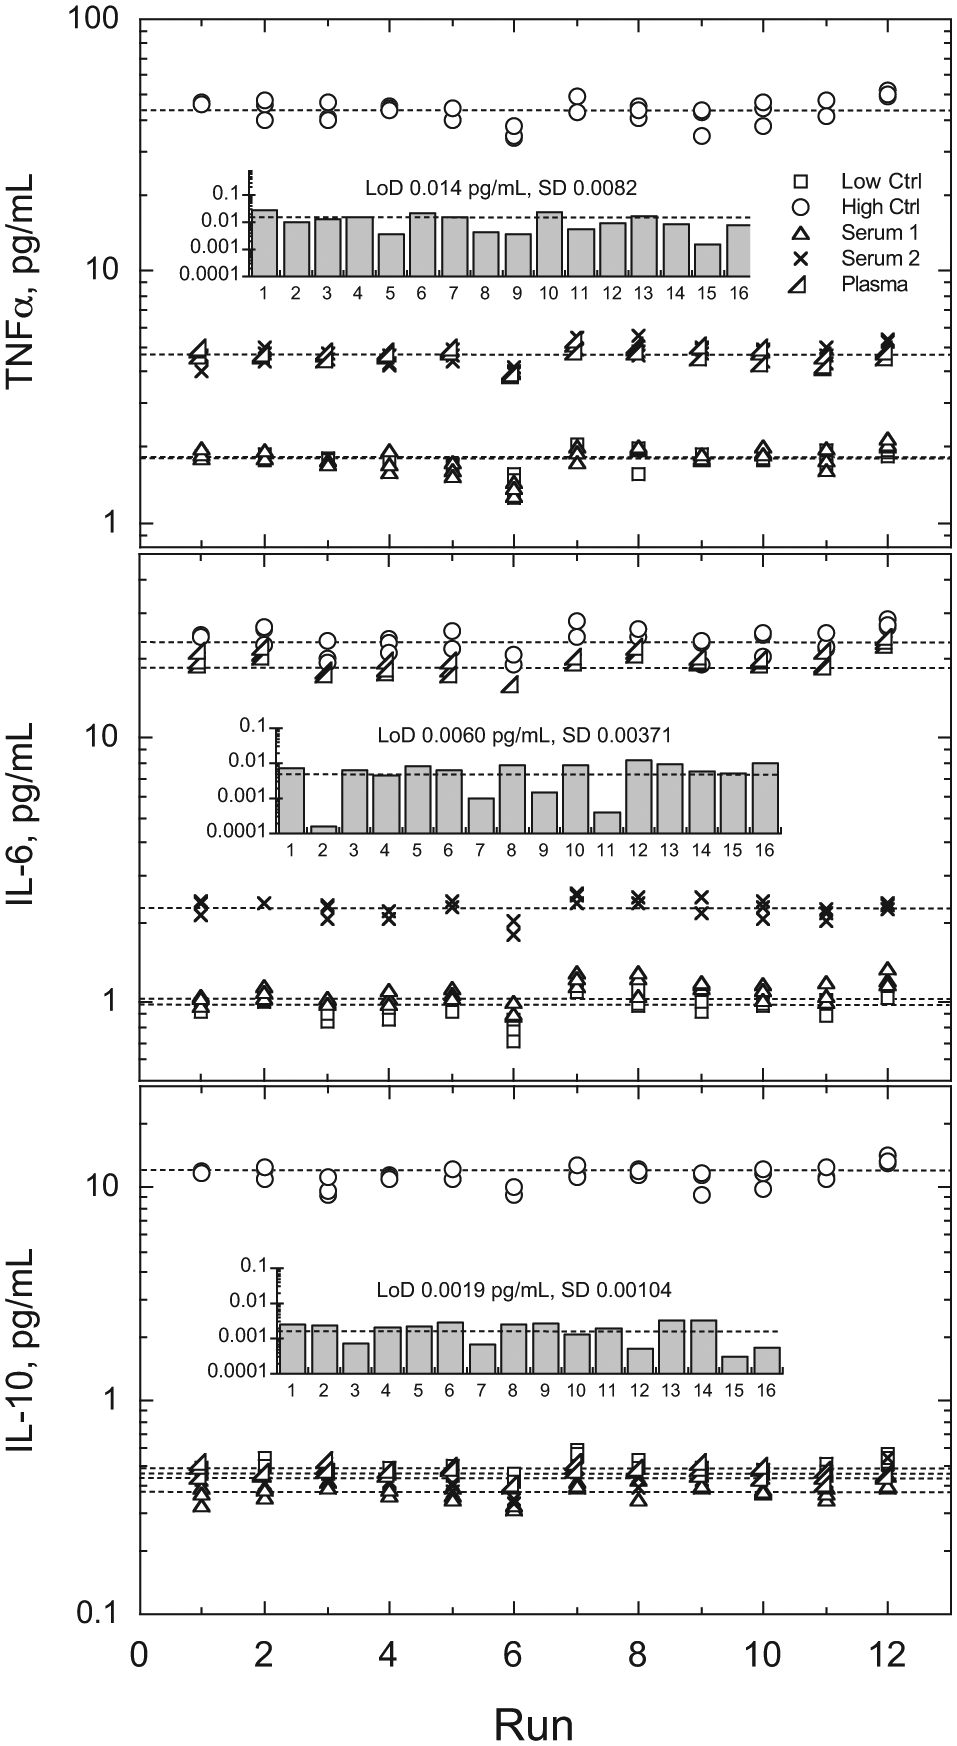
Precision and sensitivity for the three assays in the 3-plex. Five samples consisting of two serum samples, one plasma sample, and two QC controls were assayed in replicates of three at 2 times per day for 6 days using a single stored calibration curve and a single lot of reagents. Analysis of variance (fully nested ANOVA) results for QC controls are summarized in Table 1 . Across all assays and samples, within-run (n = 36), between-run (n = 12), and between-day (n = 6) CVs were generally around 5%, ranging from 0.0% to 8.0%. Dashed lines depict means for each sample. LoDs (inset bar graphs) were estimated at 2.5 SD from background signal across 16 runs from each assay (4 additional runs not precision related included).
System repeatability and LoD data from the 3-plex are shown in Figure 6 . For this study, a single calibration curve was generated and stored for each assay using a single set of multiconstituent calibrators. This calibration curve provided the calibration for all subsequent precision runs. Limits of detection were also evaluated during each run from individual calibration curves performed within the run (but not used for precision calibration). The data exhibited calibration curve storage stability for more than a week and did not exhibit any outliers or trends. Limits of detection and CVs were comparable to those estimated for the singleplex counterparts of each of the three assays ( Table 1 ).
A comparison of the dramatic reduction in workflow enabled by the Simoa HD-1 Analyzer is depicted in
Figure 7 depicts two illustrations of diagnostic potential enabled with single-molecule sensitivity in an automated laboratory analyzer. Figure 7A depicts pilot study data from Simoa digital immunoassay measurements of tau in ethylenediaminetetraacetic acid (EDTA) plasma reflecting head injury severity. Tau is a brain-specific protein that crosses the blood–brain barrier at levels too low for reliable measurement with conventional immunoassay methods. These data suggest potential utility in brain injury severity assessment with a simple blood test.
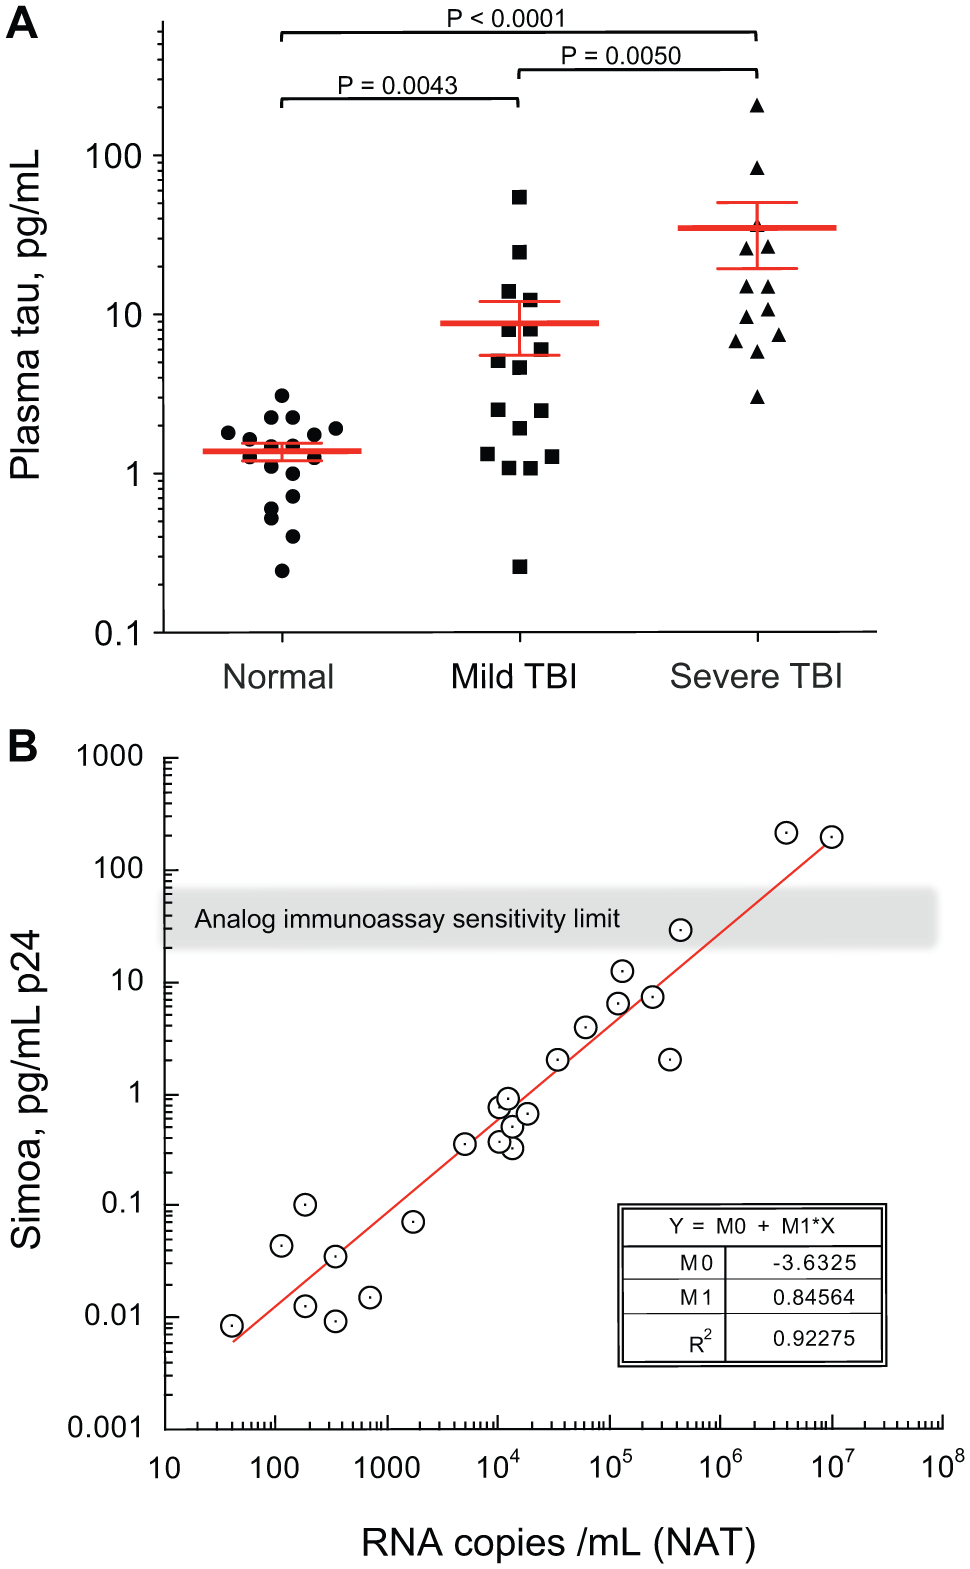
Two illustrations of the diagnostic potential enabled by digital immunoassay sensitivity. (
Figure 7B depicts correlation data between an amplified nucleic acid test and the Simoa p24 digital immunoassay with serum samples from donors in the earliest stages of HIV infection, prior to their immune response to the virus. In this study, most of the samples were nonreactive by conventional p24 immunoassay, but all samples were detected as positive in both the NAT and Simoa p24 immunoassay. The estimated LoD of the Simoa p24 assay (2.5 fg/mL) is equivalent to approximately 60 RNA copies/mL. 35 These data suggest Simoa has the potential to provide NAT-level sensitivity for HIV screening with a simple, low-cost digital immunoassay.
Discussion
Fully automated heterogeneous immunoassay analyzers for the clinical laboratory have been around since the late 1980s, with few significant advances in general system capability. 36 The most significant advances have been in evolution in workflow (e.g., continuous operation), cost reduction, and more recently, multiplexing. 37 Enhancements in performance and sensitivity have included refinement of robotics, 38 assay signal generation and detection, 39 and improvements to reagents (e.g., affinity maturation of antibodies 40 ). However, since the earliest batch and random access immunoassay analyzers,41,42 the lower limit of detection capability with conventional analog immunoassay technology has not advanced much below approximately 10–12 to 10–13M.
The Simoa HD-1 Analyzer described here represents a fundamental advance in automated immunoassay capability. We have shown that the single-molecule sensitivity and multiplexing capability of Simoa technology can be combined with high-throughput ELISA reagent automation for an instrument system capable of opening new realms of basic research, drug development, and molecular-level diagnostics. The instrument utilizes low-cost ELISA reagents, consumables, optics, and state-of-the-art robotics to maximize efficiency, data quality and cost-effectiveness. The system is designed with open flexibility to span the needs of both research and clinical laboratories with a single platform. This flexibility enables research advances powered by single-molecule sensitivity to be translated into potential companion and in vitro diagnostics applications using the same instrument. For these reasons, we believe that the Simoa HD-1 Analyzer not only breaks through a sensitivity barrier, but also breaks through an immunoassay system capability barrier that has existed for more than a quarter of a century.
Footnotes
Acknowledgements
We thank Ramon Diaz-Arrastia, Uniformed Services University (Bethesda, MD), for providing COBRIT samples for tau analysis. We thank Dr. Michael P. Busch, Blood Systems Research Institute, for providing HIV samples for p24 analysis. We thank Michael Kagan (M. Kagan & Associates) for many useful contributions and input into the instrument development program. We thank Melissa Gardel, Andrew Rivnak, and Derek DuPont (Quanterix) for their many contributions to the instrument development and support. We thank Jackie Hamwey and Dipika Gemani (Quanterix) for their direct contributions of assay data in support of this work. We thank William Gigante, Leslie Walling, and Gary Watson (Stratec, Newberry Park, CA) for their many contributions to the optical system development. We thank Erich Stiess, Rainer Wahl, Jan Wacker, and Thorsten Hanhoff (Stratec, Birkenfeld, Germany) for their many contributions to the instrumentation development, software development, and program management. The authors also appreciate the manuscript proofreading and formatting contributions from Sharon Chin (Quanterix).
Declaration of Conflicting Interests
The authors declared the following potential conflicts of interest with respect to the research, authorship, and/or publication of this article: The following contributors are employees of Quanterix Corporation: David H. Wilson, David M. Rissin, Cheuk W. Kan, David R. Fournier, Tomasz Piech, Todd G. Campbell, Raymond E. Meyer, Matthew W. Fishburn, Carlos Cabrera, Purvish P. Patel, Erica Frew, Yao Chen, Lei Chang, Evan P. Ferrell, David C Duffy. The following contributors are employees of Stratec Biomedical: Volker von Einem, William McGuigan, Marcus Reinhardt, Heiko Sayer, Claus Vielsack.
Funding
The authors disclosed receipt of the following financial support for the research, authorship, and/or publication of this article: This work was supported in part by Award R43CA133987 from the National Cancer Institute.
References
Supplementary Material
Please find the following supplemental material available below.
For Open Access articles published under a Creative Commons License, all supplemental material carries the same license as the article it is associated with.
For non-Open Access articles published, all supplemental material carries a non-exclusive license, and permission requests for re-use of supplemental material or any part of supplemental material shall be sent directly to the copyright owner as specified in the copyright notice associated with the article.