
Abstract
Foodborne illnesses are a public health concern in the United States and worldwide. Recent outbreaks of Escherichia coli O157:H7 have brought to light the need for improved ways to detect foodborne pathogens and minimize serious outbreaks. Unfortunately, current methods for the detection of foodborne pathogens are time intensive and complex. In this study, we designed a spot immunoassay that uses a UCON-potassium phosphate salt aqueous two-phase system (ATPS) for the preconcentration of O157:H7. This platform was tested with samples of O157:H7 spiked in phosphate-buffered saline and milk. The ATPS was found to improve the detection limit of the spot test, yielding detection at 106 cfu/mL within 30 min. This is the first known application of ATPSs to spot immunoassays. Moreover, detection was successfully achieved without upstream processing or dilution of the sample prior to testing, thereby further simplifying the detection process. This technology’s ease of use, sensitivity, and short time to result highlight its potential to advance the spot test as a viable diagnostic tool for foodborne pathogens.
Introduction
Foodborne illnesses pose a significant health risk worldwide, affecting upwards of 600 million people every year. 1 Commonly found in vegetables and dairy products, foodborne bacterial diseases, including the Shiga toxin-producing enterohemorrhagic Escherichia coli strain O157:H7, caused more than 187,000 deaths in 2010 alone. 2 Although generally treatable, if not detected early, E. coli O157:H7 can cause hemolytic uremic syndrome, end-stage renal disease, hemorrhagic colitis, and, in extreme cases, death. 3 Foodborne E. coli can be especially dangerous for populations in resource-poor areas, which may have limited access to treatment or diagnostic equipment.
Recent outbreaks of O157:H7 have highlighted the need for improved detection methods to minimize serious outbreaks. Current gold standard techniques of E. coli detection include cell culture, 4 polymerase chain reaction,5,6 and DNA microarrays 7 ; however, each suffers from certain limitations. Cell culturing benefits from its simplicity and low cost, yet requires access to equipment and takes several days to yield results. DNA detection methods, including PCR, improve greatly on testing speed, but are complex processes that require extensive processing and are often more expensive. As such, a simple, sensitive, and efficient method of detection is needed.
One of the most robust point-of-care diagnostic devices is the paper-based lateral-flow immunoassay (LFA). Previously, our laboratory has demonstrated the use of aqueous two-phase systems (ATPSs) to concentrate biomarkers prior to flow through LFAs, thereby enhancing LFA sensitivity.8,9 We have used this combined ATPS and LFA platform to detect for a variety of different biomarkers relating to pathogenic diseases, including a model virus bacteriophage 10 and a malaria biomarker. 11 Several LFAs have been developed for the detection of E. coli, including a multistep, fluorescence-based LFA 12 and the Reveal E. coli 2.0 method. 13 However, the use of LFAs in detecting pathogens in food samples is limited by reduced sample flow through the LFA membrane as well as lower sensitivity compared with laboratory techniques. The LFA requires a sample with an overall low percentage of food content to minimize blocking of the pores in the LFA membrane. Often, the food samples are diluted 10-fold in a nutrient broth for an incubation period, and the subsequent suspension is then applied to an LFA for detection.14,15 Alternatively, food samples may be centrifuged such that the proteins and fat globules are removed, before the supernatant is analyzed.16,17 Moreover, LFAs for food samples can take up to 20 h to yield results. To overcome these challenges, alternative paper-based devices have been developed to improve on these shortcomings.
Specifically, a paper-based enzyme-linked immunosorbent assay (ELISA) with several wash and reagent steps has been developed to achieve detection limits comparable to traditional ELISA tests. 18 A dual, microfluidic dipstick has also been developed as an all-in-one, multistep, E. coli detection device. 19 Other alternative paper-based devices include the spot test, which has previously been used as a portable method to detect for luteinizing hormone in sheep. 20 Although the LFA requires flow of the sample through the membrane and test area, the spot test requires contact only with the sample fluid and thus can be used more consistently in the presence of complex media.
Here, we improve on the ease of use and time to detection of the traditional spot immunoassay with a novel method for detecting foodborne pathogens. Our device involves the use of a UCON and potassium phosphate polymer-salt ATPS to concentrate a desired biomarker to a single phase. To our knowledge, this is the first time the spot immunoassay has been combined with ATPS to improve its sensitivity. As such, improved sensitivity of traditional spot tests can be achieved without engineering lower detection limits of the spot-test membrane itself. As a proof of concept, we performed detection of E. coli O157:H7 to demonstrate significant improvement over standard spot immunoassays, which we envision can be readily modified to detect for a variety of foodborne diseases.
Materials and Methods
Preparation of Bacterial Cell Cultures
E. coli O157:H7 strains (ATCC 700728) were cultured according to manufacturer protocol (ATCC, Manassas, VA) and plated onto Difco Nutrient Agar (Becton, Dickson and Company, Sparks, MD) plates. Cells were incubated at 37 °C aerobically overnight. The plate was then sealed with Parafilm and stored at 4 °C until use. To prepare bacterial suspensions for use in spot tests, single colonies were picked from the agar plate and cultured in 5 mL of Difco Nutrient Broth (Becton, Dickson and Company). The cell suspension was then incubated in a shaker incubator at 37 °C and 240 rpm for 16 h. Quantification of bacterial concentrations within the suspension was obtained using OD 600 measurements and plating of bacteria following serial dilutions. Briefly, a standard curve to quantify the OD 600 measurements was produced by taking measurements of bacterial samples while concurrently plating them and counting the colonies after incubation. Using six different samples, a standard curve was produced for determining spot-test sample bacterial concentrations.
Preparation of Dextran-Coated Gold Nanoprobes
The dextran-coated gold nanoparticles (DGNs) were made using the Min and coworkers method 21 with modifications. To form anti–E. coli O157:H7 functionalized dextran-coated gold nanoprobes (DGNPs), the pH of the DGNs was adjusted with NaOH, and 8 µg of polyclonal BacTrace Goat anti–E. coli O157:H7 molecular-grade antibodies (KPL, Gaithersburg, MD) were added for every 1 mL of DGNs. Dative bonds between the gold nanoparticles and antibodies formed during a 30 min incubation period on an Excella E24 Incubator Shaker (New Brunswick Scientific Co., Inc., Edison, NJ). To remove excess dextran and antibodies, the DGNPs were centrifuged and resuspended in 0.1 M sodium borate buffer at pH 9.0. The DGNPs were measured via dynamic light scattering to be ~50 nm diameter in size.
Preparation and Visualization of UCON-Salt ATPS
Stock solutions of UCON Lubricant 50-HB-5100 (The Dow Chemical Co., Midland, MI) and potassium phosphate salt (5:1 dibasic to monobasic ratio; Sigma-Aldrich, St. Louis, MO) were prepared in Dulbecco’s phosphate-buffered saline (PBS; Life Technologies, Grand Island, NY). To obtain the desired equilibrium volume ratio (volume of the top phase divided by the volume of the bottom phase), the initial % w/w concentrations of UCON and potassium phosphate salt were adjusted and optimized. The components were added to a total volume of 400 µL and vortexed until homogeneous. Equilibrium phase separation was achieved after centrifugation in pulses for 30 s, yielding a 1:1 volume ratio. A similar process was repeated to determine an equilibrium volume ratio for UCON-salt ATPS containing 2% milk (Alta Dena, City of Industry, CA). Specifically, the system was optimized such that phase separation could be attained with the added volume of milk. Thus, a 1:1 volume ratio was similarly attained.
To visualize the phase separation behavior of our system, 50 µL of DGNPs and 2 µL of 10% Brilliant Blue Dye FCF (The Kroger Co., Cincinnati, OH) were added to the mixed ATPS solution and vortexed thoroughly. The blue dye and purple-colored DGNPs highlighted the UCON-rich phase and the salt-rich phase, respectively. After equilibrium phase separation was achieved, images before and after phase separation were captured with a Canon EOS 1000D camera (Canon U.S.A., Inc., Lake Success, NY) within a controlled lighting environment.
Cell Partitioning in ATPS
The partitioning of E. coli O157:H7 cells was performed in ATPS with PBS and milk samples. UCON-50 polymer, potassium phosphate salt, ~107 cells, and 115 µL of either PBS or milk sample were combined in microcentrifuge tubes. Triplicates of these suspensions with PBS and milk were made, respectively. The suspensions were briefly centrifuged in pulses for 30 to 45 s to facilitate phase separation. Once the suspensions were completely phase separated, samples were carefully extracted from the top and bottom phases of each ATPS and transferred into separate microcentrifuge tubes. This was carefully done with a micropipette, so as to not disturb the interface of the ATPS. The samples were then diluted with PBS as necessary for cell counting with a hemocytometer. In the ATPSs with PBS samples, the UCON-rich top phase was diluted two-fold, while the salt-rich bottom phase was diluted by 100-fold. In the ATPSs containing milk, the UCON-rich top phase was diluted 100-fold, while the salt-rich bottom phase was diluted by 1000-fold. The diluted phases were individually loaded onto a hemocytometer, and the cells were counted. The total concentration of cells in each phase was determined by multiplying the average number of cells counted in each square grid on the hemocytometer, a unit conversion constant 104, and the appropriate dilution factor. A partition coefficient was calculated for each triplicate ATPS by dividing the cell concentration in the top phase by the cell concentration in the bottom phase.
Preparation of Spot Immunoassay Strips
The paper-based spot immunoassay, or spot test, was assembled with Amersham Protran Premium 0.2 um nitrocellulose (GE Healthcare Life Sciences, Pittsburgh, PA). The nitrocellulose was cut to strips with dimensions of 0.5 cm by 2.5 cm. One microliter of 2 mg/mL of the BacTrace goat anti-E. coli O157:H7 antibodies and 25% w/v sucrose (Bio-Rad Laboratories, Inc., Hercules, CA) in filtered Ultrapure sterile water (Rockland Immunochemicals Inc., Gilbertsville, PA) were spotted onto the nitrocellulose strip at one end. Immediately, the paper strips were placed in a vacuum chamber with desiccant for 24 h. The strips were then blocked in a solution of 0.1% Tween 20 (Sigma-Aldrich) in filtered Ultrapure water for 2 h and lyophilized for another 2 h. Following blocking, the strips were placed into a vacuum chamber with desiccant until use.
Detection of E. coli O157:H7 with Spot Test Only
The spot test uses a sandwich assay format. In this immunoassay, when E. coli O157:H7 is present, it is sandwiched between the BacTrace goat anti-E. coli O157:H7 antibodies on the DGNPs and those immobilized onto the nitrocellulose strips as a spot. As such, the positive test results in the appearance of a colored spot, whereas the negative test does not.
Spot tests were performed in PBS to establish a baseline detection limit of E. coli O157:H7 with spot tests alone. Briefly, overnight bacteria culture was pelleted via centrifugation for 3 min at 12,000 rpm and resuspended in an equivalent volume of PBS. The resuspended bacteria, a 1:10 dilution of the bacteria in PBS, and a negative control consisting of only PBS were tested individually. Of each sample, 115 μL was added to 50 µL DGNPs and 235 µL PBS, for a final volume of 400 µL. The mixtures were briefly vortexed to ensure homogeneity throughout the volume. Spot tests were inserted into each suspension with the spotted area submerged. Membranes were removed, wiped dry, and imaged within a controlled lighting environment with a Canon EOS 1000D camera at time points of 5, 10, and 30 min.
Spot tests were also performed in 2% milk. The milk tests were prepared in the same manner as the PBS tests, with the exception that the bacterial pellet was instead resuspended in an equivalent volume of 2% milk. Similarly, the bacteria resuspended in milk, a 1:10 dilution of the suspension in milk, and a negative control consisting of only milk were tested individually. Again, 115 µL of each sample was added to 50 µL DGNPs and 235 µL PBS for a final volume of 400 µL. The mixtures were vortexed to ensure homogeneity throughout the volume. Spot tests were inserted into suspensions and imaged at the same time points and manner as the PBS tests. The intensities of the positive tests and negative tests were visually compared to determine if there was enhanced binding in the presence of bacteria.
Detection of E. coli O157:H7 with a Combined ATPS and Spot Test
Spot tests were also performed in 1:1 UCON-salt ATPSs. The procedure for the combined ATPS and spot test is illustrated in Figure 1 . Briefly, UCON-salt tests were prepared as follows. Bacteria suspensions in PBS and 2% milk and their dilutions were made as previously described. Of the bacterial sample, 115 µL from each sample type were added to a suspension containing 235 µL of mixed UCON-salt ATPS and 50 µL DGNPs. The suspension was vortexed thoroughly until turbid and then centrifuged in pulses for 30 to 45 s until the two phases had completely separated and a clear interface had formed. The top UCON-rich phase was carefully removed with a micropipette and discarded. Spot tests were then inserted directly into the bottom phase, such that the spotted area was submerged completely. As in the spot test–only conditions, the spot tests were removed after incubation for 5, 10, and 30 min, wiped dry, and imaged.
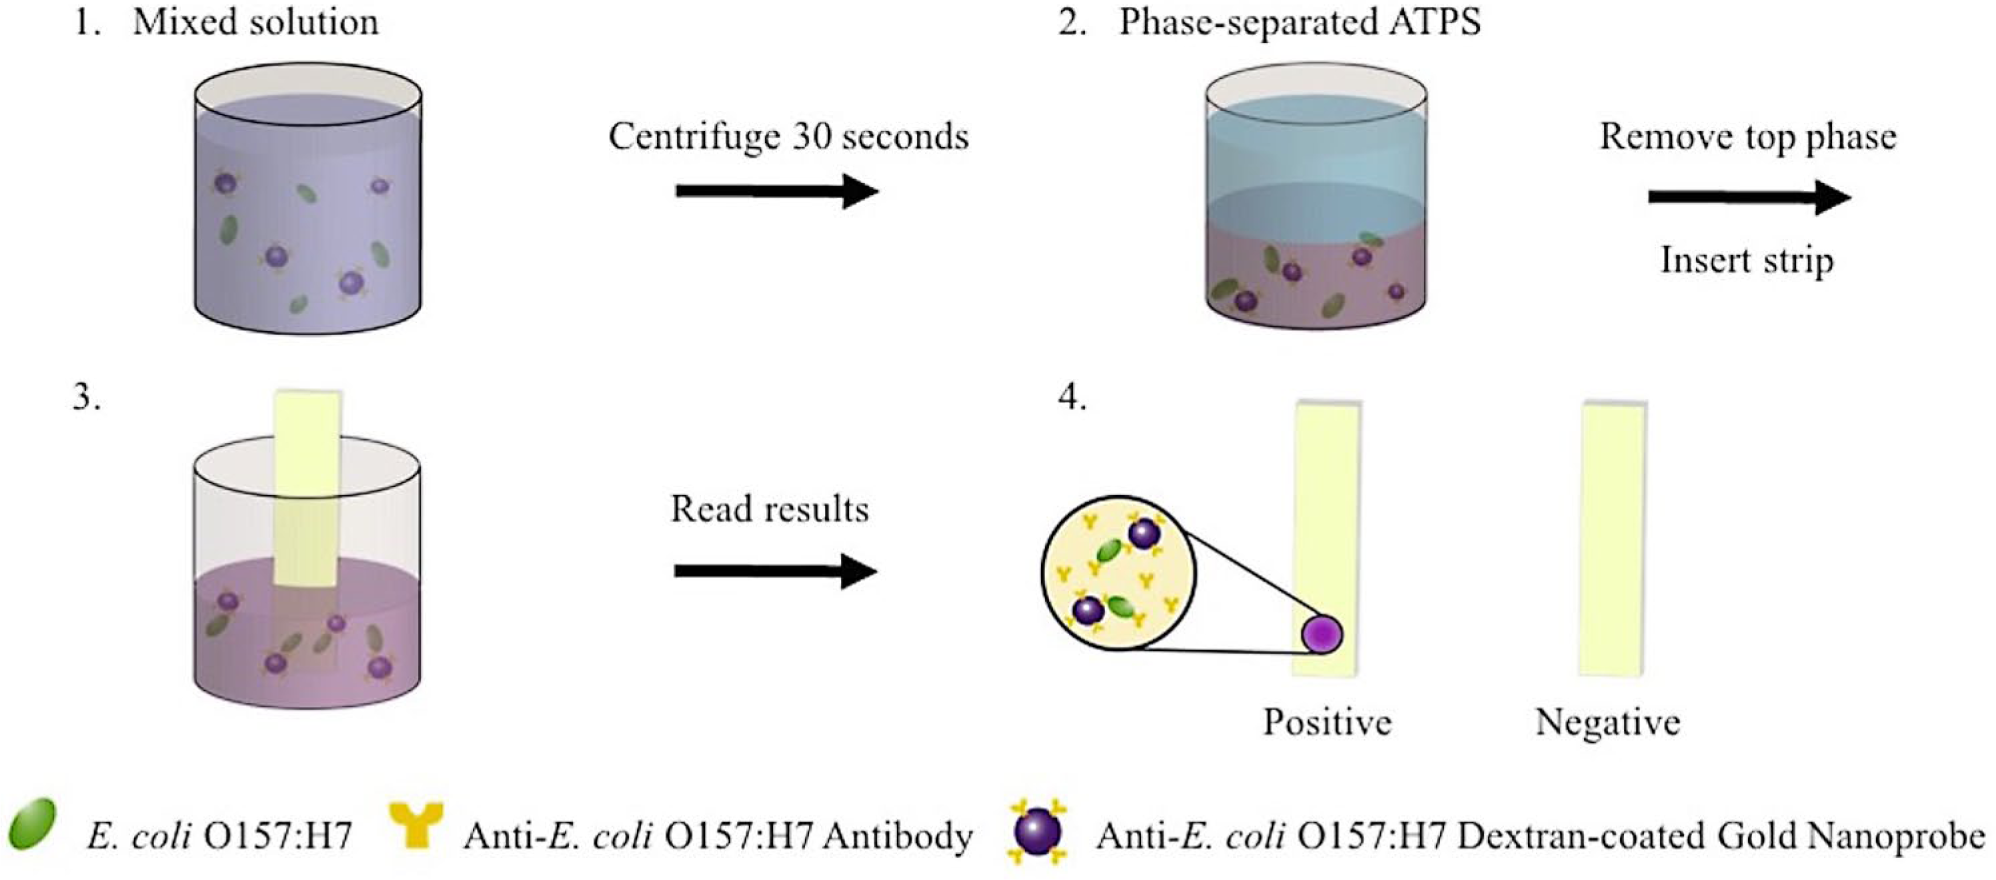
Schematic of the combined UCON-salt aqueous two-phase system and spot test platform.
Results and Discussion
UCON-Salt ATPS Phase Separation with and without the Presence of Milk
To facilitate improvement in the detection of O157:H7, a UCON-potassium phosphate salt ATPS was chosen. The UCON-salt ATPS forms a relatively more hydrophobic UCON-rich top phase and a denser, more hydrophilic salt-rich bottom phase. Phase separation was achieved after centrifuging for 30 to 45 s in pulses. Partitioning of biomolecules in the ATPS phases is predominantly dependent on relative hydrophilicity, as well as size. Therefore, when the purple DGNPs were added to the mixed ATPS, they partitioned preferentially to the salt-rich bottom phase due to experiencing fewer excluded-volume interactions with the less abundant UCON polymers in the salt-rich phase. This resulted in the appearance of a purple-colored bottom phase. Meanwhile, Brilliant Blue FCF dye was also added to the mixed ATPS and partitioned extremely to the UCON-rich top phase because of its small size and hydrophobicity. This allowed for the visualization of a blue top phase. Images of a 1:1 volume ratio ATPS were taken before and after phase separation ( Fig. 2 ).
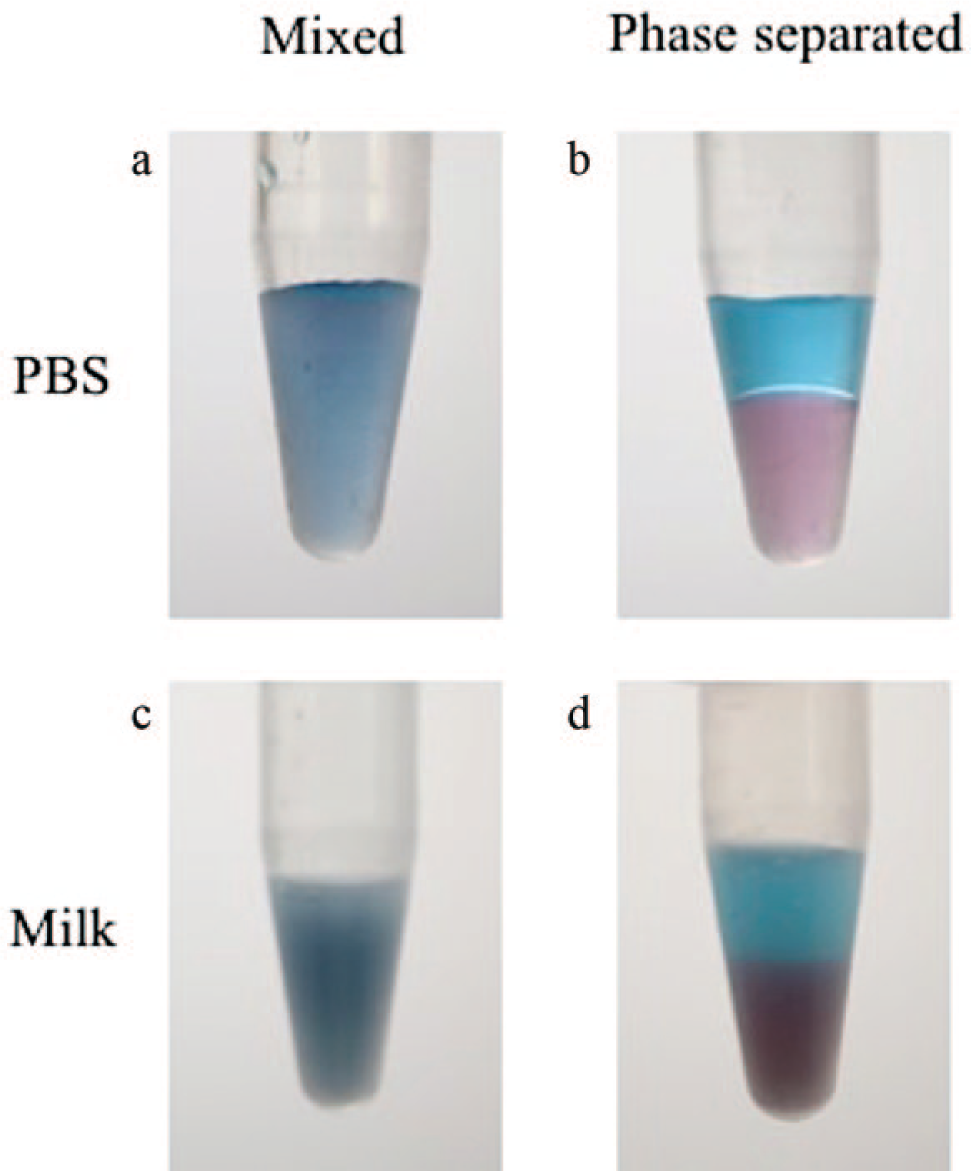
UCON-salt aqueous two-phase systems containing phosphate-buffered saline (
To ensure that UCON-salt ATPS formation was feasible with the addition of a milk sample, a 1:1 ATPS was replicated in the presence of 115 µL of milk. Brilliant Blue dye and DGNPs were once again added to the mixed solution for visualization of the ATPS. As in the ATPS without milk condition, phase separation was observed after centrifuging for 30 to 45 s in pulses. The partitioning behavior of the dye and DGNPs mirrored that of the ATPS without milk condition, resulting in a blue top phase and a purple bottom phase. Because of the presence of milk proteins, the suspensions with milk (mixed and after phase separation) have a darker, turbid appearance compared with the suspensions without milk ( Fig. 2 ). It was also noted that, like the DGNPs, the milk proteins partitioned preferentially to the salt-rich bottom phase, as indicated by the bottom phase’s greater turbidity.
E. coli O157:H7 Cell Partitioning in ATPS
With the intention to use the UCON-salt ATPS to improve the detection of E. coli O157:H7, it was first necessary to confirm that E. coli cells could be concentrated in the ATPS. Bacterial cell partitioning in the UCON-salt ATPS was performed with samples of O157:H7 spiked in PBS and spiked in milk. Because of the relatively large size of the E. coli cell (1 µm diameter), it was hypothesized that the bacterial cells would partition extremely to the bottom phase. This is expected because of the bacterial cells’ experiencing fewer excluded-volume interactions with the less abundant UCON polymers in the bottom phase. Partitioning of the bacteria spiked in PBS resulted in an average cell concentration that was approximately 170 times greater in the bottom phase than in the top phase. This yielded an average partition coefficient (cell concentration in the top phase divided by cell concentration in bottom phase) of (6.0 +/- 0.5) × 10–3, indicating that the cells partition extremely to the bottom phase.
E. coli samples spiked in milk demonstrated similar partitioning behavior in the UCON-salt ATPS. The average cell concentration in the bottom phase was approximately 11 times greater than that in the top phase. The average partition coefficient was therefore (9.1 +/- 1.0) × 10–2, again indicating that the cells partition preferentially to the bottom phase. However, it was noted that the partition coefficient for the milk samples was approximately six times larger than that of the PBS samples ( Fig. 3 ). A possible explanation for this difference may be that the cells in the milk sample experienced greater excluded-volume interactions from the milk proteins that also partitioned preferentially to the bottom phase, which led to less extreme partitioning of the bacteria to the bottom phase when compared with the experiments performed with PBS.
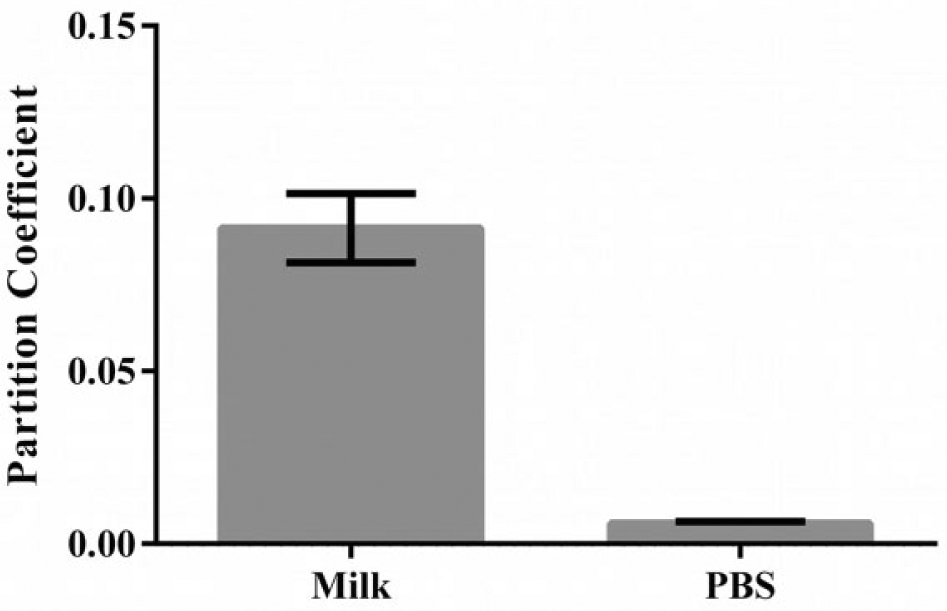
Experimentally measured partition coefficients for E. coli O157:H7 in UCON-salt aqueous two-phase systems. E. coli O157:H7 was spiked into both phosphate-buffered saline and milk samples. Error bars represent standard deviations from triplicate measurements.
Improving Spot-Test Detection of E. coli O157:H7 in PBS
Subsequently, we sought to combine the concentrating ability of the ATPS with a spot test into one platform for the rapid detection of O157:H7. The spot tests were first performed with PBS samples spiked with E. coli O157:H7. To demonstrate the utility of the ATPS in aiding detection, spot tests were performed both with and without sample preconcentration via UCON-salt ATPS and compared.
For both experiments with and without ATPS, a spot test was performed with a bacteria sample containing 3 × 10⁷ cfu/mL, another one containing 3 × 10⁶ cfu/mL, and a negative test without bacteria. For the tests performed with ATPS, it was anticipated that the ATPS would concentrate the bacteria into the salt-rich bottom phase, as observed in the partitioning studies. The results of the spot tests can be seen in Figure 4 . After 5 min, a spot appeared in the test with a sample containing 3 × 10⁷ cfu/mL bacteria in ATPS. By 10 min, a spot was also clearly visible in the 3 × 10⁶ cfu/mL bacteria sample in ATPS. Meanwhile, in the tests without ATPS, neither bacteria concentration yielded clear spot development even after 30 min. No spots developed in the negative tests with and without ATPS, as expected. The use of ATPS as a preconcentration step improved the sensitivity of the spot test for bacteria samples in PBS.
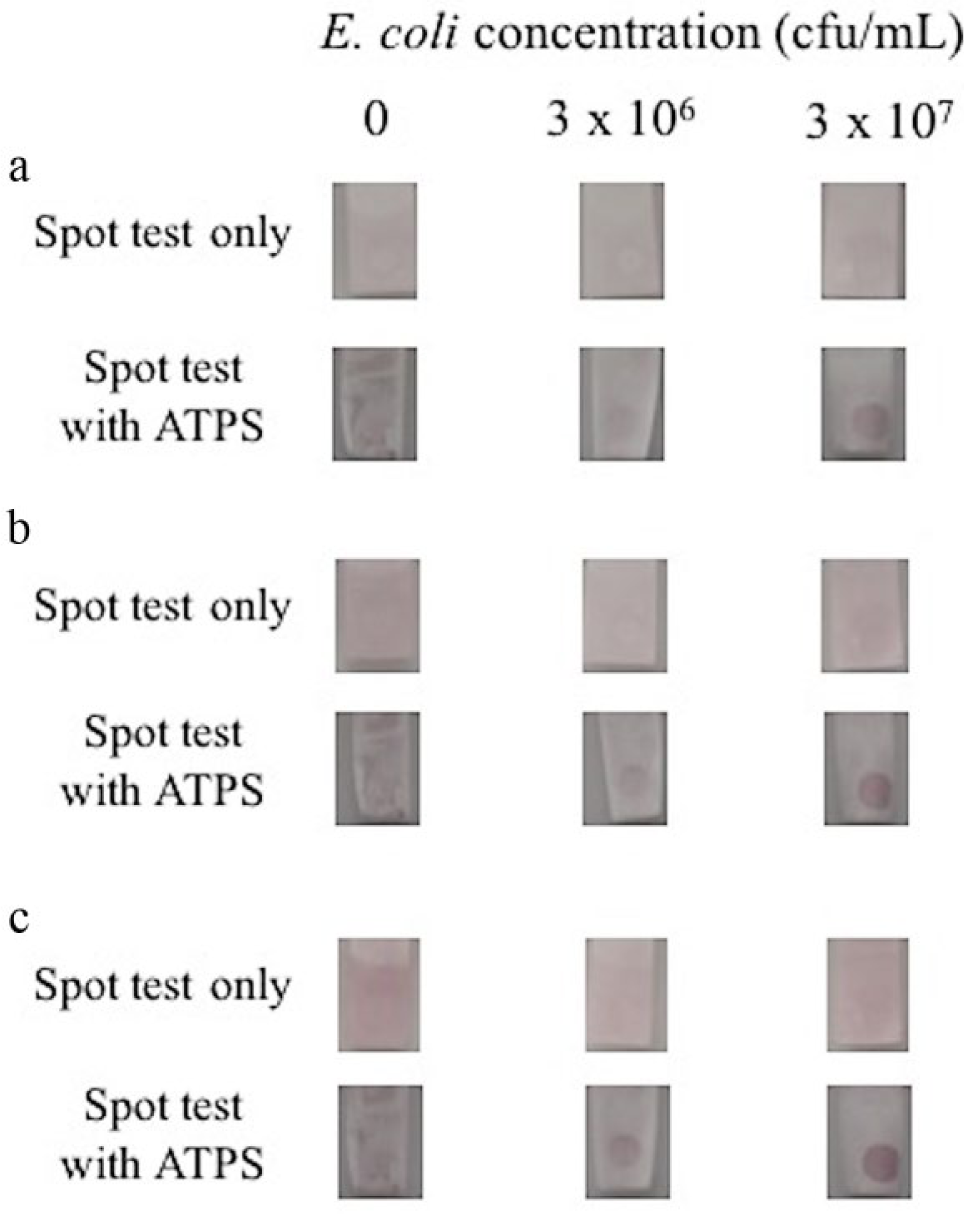
Detection of E. coli O157:H7 in phosphate-buffered saline using the spot test only (top row) versus using the combined aqueous two-phase system and spot test (bottom row) after (
Improving Spot-Test Detection of E. coli O157:H7 in Milk
Having demonstrated the ability of an ATPS to improve the spot-test detection of O157:H7 in PBS, we were interested in applying this platform for the detection of foodborne pathogens in a relevant, complex media. To replicate one such medium, 2% milk was spiked with E. coli O157:H7. Tests with the milk sample were set up in the same manner as those performed with PBS. As with the PBS system, it was anticipated that the bacteria would partition preferentially into the salt-rich bottom phase of the ATPS and be concentrated. The results are shown in Figure 5 . Unlike what was observed for detection in the PBS systems, spots were first visible in the milk sample containing 3 × 10⁷ cfu/mL and 3 × 10⁶ cfu/mL only after 10 min and not 5 min. After 30 min, the spot intensities became more pronounced. Meanwhile, both spiked milk samples without ATPS yielded no spots, indicating the inability of the spot test to detect E. coli O157:H7 without the aid of ATPS. Negative tests both with and without ATPS did not have spot development, as expected.
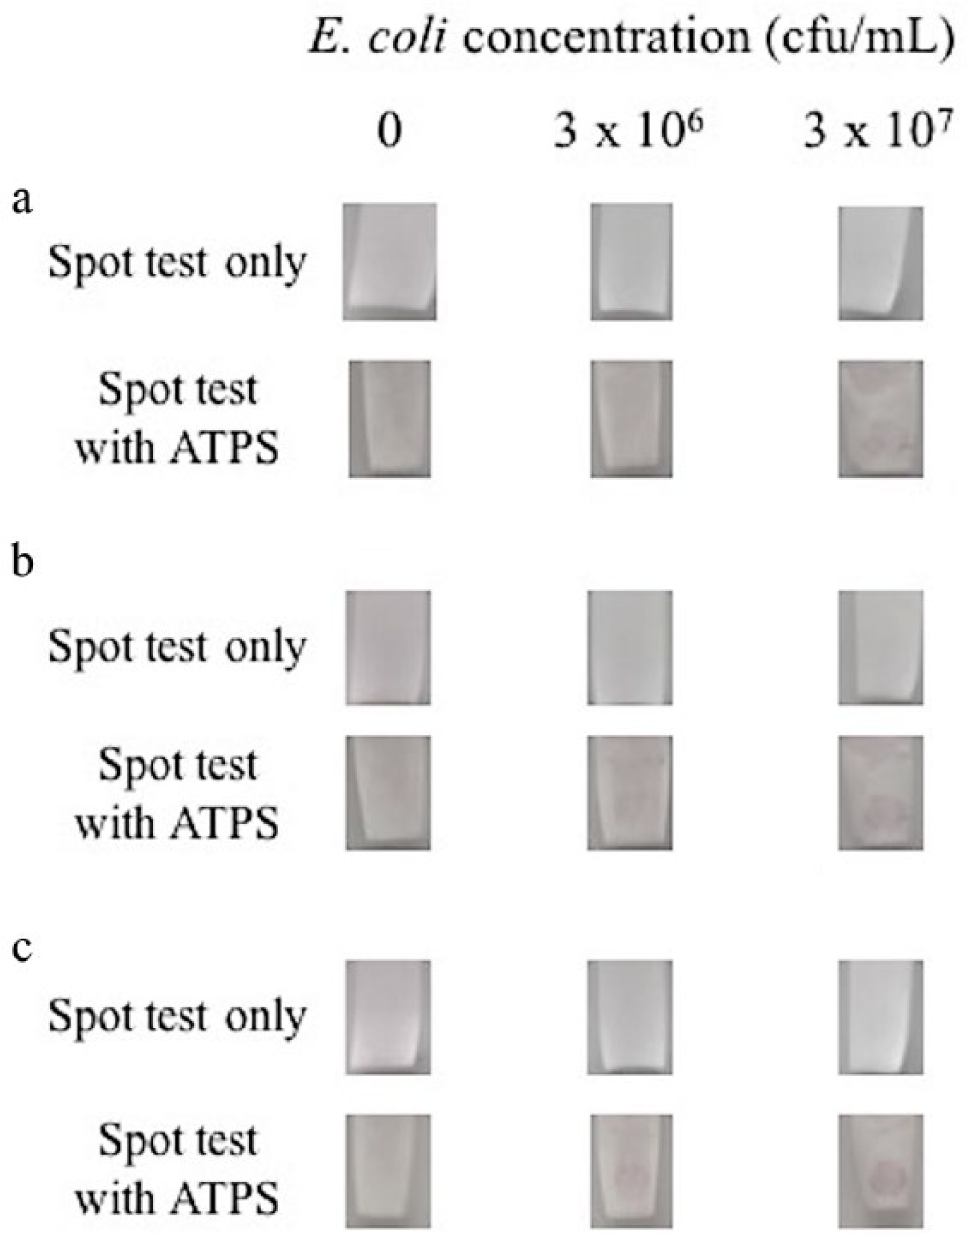
Detection of E. coli O157:H7 in milk using the spot test only (top row) versus using the combined aqueous two-phase system and spot test (bottom row) after (
From the spot tests performed in both PBS and milk, the use of ATPS was observed to improve spot intensity and time to detection. However, spot development occurred more quickly in PBS (after 5 min) than in milk (after 10–30 min). One contributing factor for the disparity may be the difference in bacteria partitioning in PBS versus in milk. As observed in the partitioning study, bacterial cells were found to partition less extremely when milk was present, most likely because of the presence of milk proteins in the bottom phase. Therefore, although the ATPS would still overall concentrate the bacteria in milk to the bottom phase, it would be concentrated less than the equivalent 1:1 ATPS system in PBS. In addition, the presence of milk could also reduce binding between the antibodies on the paper strip and the bacteria, thereby weakening spot development. This is not surprising, as milk is often used as a blocking agent to prevent nonspecific binding in immunoassays.
By using a combined ATPS and spot-test platform, not only is the time to detection shortened, but the detection limit for the spot test was also lowered. After 30 min of incubation, detection of bacteria in both PBS and milk was achieved with ATPS, whereas they remained undetected without ATPS. Thus, the ATPS enabled the spot test to detect bacteria at concentrations lower than otherwise possible without the ATPS.
Conclusions
In the current study, we have designed and tested a platform for rapid detection of E. coli O157:H7. By combining an ATPS with a spot immunoassay, we have shown that an ATPS helps to improve the detection limit of the spot immunoassay. The ATPS effectively concentrates the E. coli O157:H7 cells in a contaminated sample, allowing detection to be achieved within 30 min. This reduction in time to detection is significant compared with existing methods that may require several hours to days to generate results.
This platform is the first known attempt in successfully combining an ATPS with the paper-based spot immunoassay. The combined system demonstrated the ability to detect bacteria when the spot test alone could not, thus greatly improving its sensitivity. We also envision that this robust system has the potential to be applied to other foodborne pathogens and samples. The technology described in this study demonstrates the potential of the spot test as a simple and rapid detection method and helps to advance the spot test as an alternative to LFA in the diagnostic field.
Footnotes
Declaration of Conflicting Interests
The authors declared the following potential conflicts of interest with respect to the research, authorship, and/or publication of this article: D.T.K. is a founder of the company Phase Diagnostics, which intends on commercializing this core technology. He has financial interests in Phase Diagnostics, which has entered into a letter of intent with the UC Regents to license the intellectual property.
Funding
The authors disclosed receipt of the following financial support for the research, authorship, and/or publication of this article: This work was supported by the U.S. Department of Agriculture grant USDA-NIFA-AFRI-004915 to Z.A. and D.T.K.