
Abstract
Glomerular mesangial cell (MC) hypertrophy is regarded as one of the earliest pathological characteristics of diabetic nephropathy (DN), which plays a critical role in the pathogenesis of glomerulosclerosis. This study investigated the role of microRNAs (miRNAs) in MC hypertrophy due to exposure to high glucose. With a microarray, we screened the differential profiles of miRNAs in the renal cortex of DN mice, as verified by reverse transcription PCR with subsequent analysis of bioinformatics. We found miR-196a was downregulated remarkably in DN mice and increased the hypertrophy-related gene of p27kip1 in high-enrichment gene ontologies. Furthermore, transfection of the miR-196a mimic greatly inhibited the expression of p27kip1 with recovery of MC hypertrophic morphology. With flow cytometry, we also found that overexpression of miR-196a significantly reduced the percentage of G1 phase arrest in the cell cycle. Cotransfection of the miR-196a mimic with a wild type of 3′ UTR of the p27kip1 vector reduced the activity of the luciferase reporter significantly in contrast to the miR-196a mimic with a mutant of the counterpart in HEK293 cell lines, suggesting that miR-196a directly targets p27kip1. Finally, knockdown of p27kip1 with specific small interfering RNA in MCs substantially reversed MC hypertrophy induced by transfection of the miR-196a inhibitor. This study revealed that miR-196a acts as an important molecular regulator in high glucose-induced MC hypertrophy by targeting p27kip1.
Introduction
Glomerular hypertrophy has been defined as an increase in glomerular size, which is mainly induced by glomerular mesangial cell (MC) hypertrophy and subsequent overexpression and accumulation of extracellular matrix (ECM) proteins. 1 Diabetic nephropathy (DN), which is characterized by sustained albuminuria clinically and excessive deposition of ECM proteins in glomeruli pathologically, is a leading cause of renal failure worldwide. There are three types of constitutive cells—endothelial cells, podocytes, and mesangial cells (MCs)—among which MCs are regarded as the main source of ECM proteins. MC hypertrophy, a key event occurring at a very early stage of DN, acquires the ability to synthesize ECM proteins responsible for glomerulosclerosis. In vivo studies in both type I and II animal models of DN indicated that glomerular mesangial expansion was induced by ECM accumulation secondary to hyperglycemia-induced MC hypertrophy. 1 A report by Steffes et al. 2 suggested that mesangial expansion plays a central role in the loss of renal function in DN patients clinically. As we know, cell growth is regulated by a variety of proteins, including cyclin-dependent kinase (CDK) and CDK inhibitor in the cell cycle. In the presence of high glucose, MCs arrested in the G1 phase show a hypertrophic phenotype. p27kip1, a CDK inhibitor, is regarded as a critical regulator of MC hypertrophy. However, an MC hypertrophy-related mechanism still remains elusive due to its complexity.3–7
MicroRNAs (miRNAs) have been identified as negative regulatory elements of their target genes at the posttranscriptional level, which are expressed in a variety of cells or tissues. 8 miRNAs show a highly conservative property across mammalian species. Recently, data in the literature strongly proved that the aberration and/or the absence of miRNAs play a role in the pathophysiological process of human diseases, such as tumors, diabetic myocardial disease, and so on. Investigations of conditional Dicer knockout mice indicated that miRNAs serve as important molecular regulators for the maintenance of normal structure and function in the kidney.9–11 Emerging evidence has shown that the differential expression of miRNAs is involved in the onset and progression of DN, among which miR-377, miR-21, miR-192, and miR-29 play an important role in DN by promoting expression of collagen and fibronectin in diabetic glomeruli.12–18
Given the roles of miRNAs in DN, in this study, we detected miRNA expression levels of renal tissue in DN mouse models. We anticipate finding the clue for miRNAs to regulate MC hypertrophy during DN and uncovering the underlying mechanism.
Materials and Methods
Streptozotocin-Induced Diabetic Animal Models in DBA/2 Mice
DBA/2 mice (male, 8 weeks of age, n = 20) were purchased from Shanghai SLAC Laboratory Animal Co. Ltd. (Shanghai, P. R. China; license no. SCXK Hu 2007-0005). Throughout the whole period of the experiment, mice were given free access to water and standard rodent chow. Type I diabetes was induced in mice (n = 10) with intraperitoneal injections of streptozotocin (STZ; Sigma, St. Louis, MO). According to the protocol established by Gurley et al., 17 STZ was dissolved in 0.05 M sodium citrate buffer (pH 4.5) immediately before injection, and mice were administered two rounds of injections of 50 mg/kg−1/d STZ for 5 consecutive days first at age 10 weeks and then at age 15 weeks. This pattern of administration of STZ could induce stable hyperglycemia and longitudinal survival. Random plasma glucose >16.7 mM was regarded as indicating the establishment of a diabetic condition. The same amount of sodium citrate buffer was injected in control animals. At the end of experiment (12 weeks after the onset of the diabetic condition), mice were placed in metabolic cages with free access to water and chow individually for 24 h for collection of urine samples to determine urine protein according to the manufacturer’s instructions (Mouse Albumin ELISA Quantitation Set; Bethyl Laboratories, Montgomery, TX). Then the mice were sacrificed; the left kidneys were decapsulated, and the the total RNA of renal cortex was subjected to perform the miRNA microarray. The right kidneys were fixed in formalin for periodic acid–Schiff (PAS) staining. This procedure was approved by the animal control committee of Shanghai Jiao Tong University Affiliated Sixth People’s Hospital.
Analysis of miRNA Microarray and Gene Ontology
The miRNA microarray assay was performed as described previously. 18 Briefly, total RNA was extracted from the renal cortex by using Trizol reagent (Invitrogen, Carlsbad, CA) followed by measurement of RNA quality and quantity. Then, 5 µg total RNA was subjected to size-fraction in a YM-100 Microcon centrifugal filter (Millipore, Billerica, MA) to obtain small RNAs (<300 nt). The 3′ poly (A) tail of small RNAs was labeled with Cy3 and Cy5 fluorescent dye with subsequent hybridization on a µParaflo (LC Sciences, Hangzhou, China) microfluidic chip. After the hybridization, the fluorescent images were collected using a laser scanner (GenePix 4000B; Molecular Devices, Sunnyvale, CA) and digitized using Array-Pro image analysis software (Media Cybernetics, Rockville, MD). Gene ontology (GO) analysis was performed to reveal the miRNA-gene regulatory network based on the molecular biological function. GOs with a p value <0.001 and a false discovery rate (FDR) <0.05 were selected to calculate the enrichment degree. A cell growth–related network of miRNA–messenger RNA (mRNA) was established based on the miRNA degree.
RT-PCR of miRNAs
Differentially expressed miRNAs of miR-196a, miR-194, miR-703, miR-762, miR-34a, and miR-320 were randomly verified by stem-loop reverse transcription (RT) and subsequent PCR with U6 as an internal control. The primer sequences for stem-loop RT-PCR are included in Table 1 .
Primers Used in Real-Time PCR.
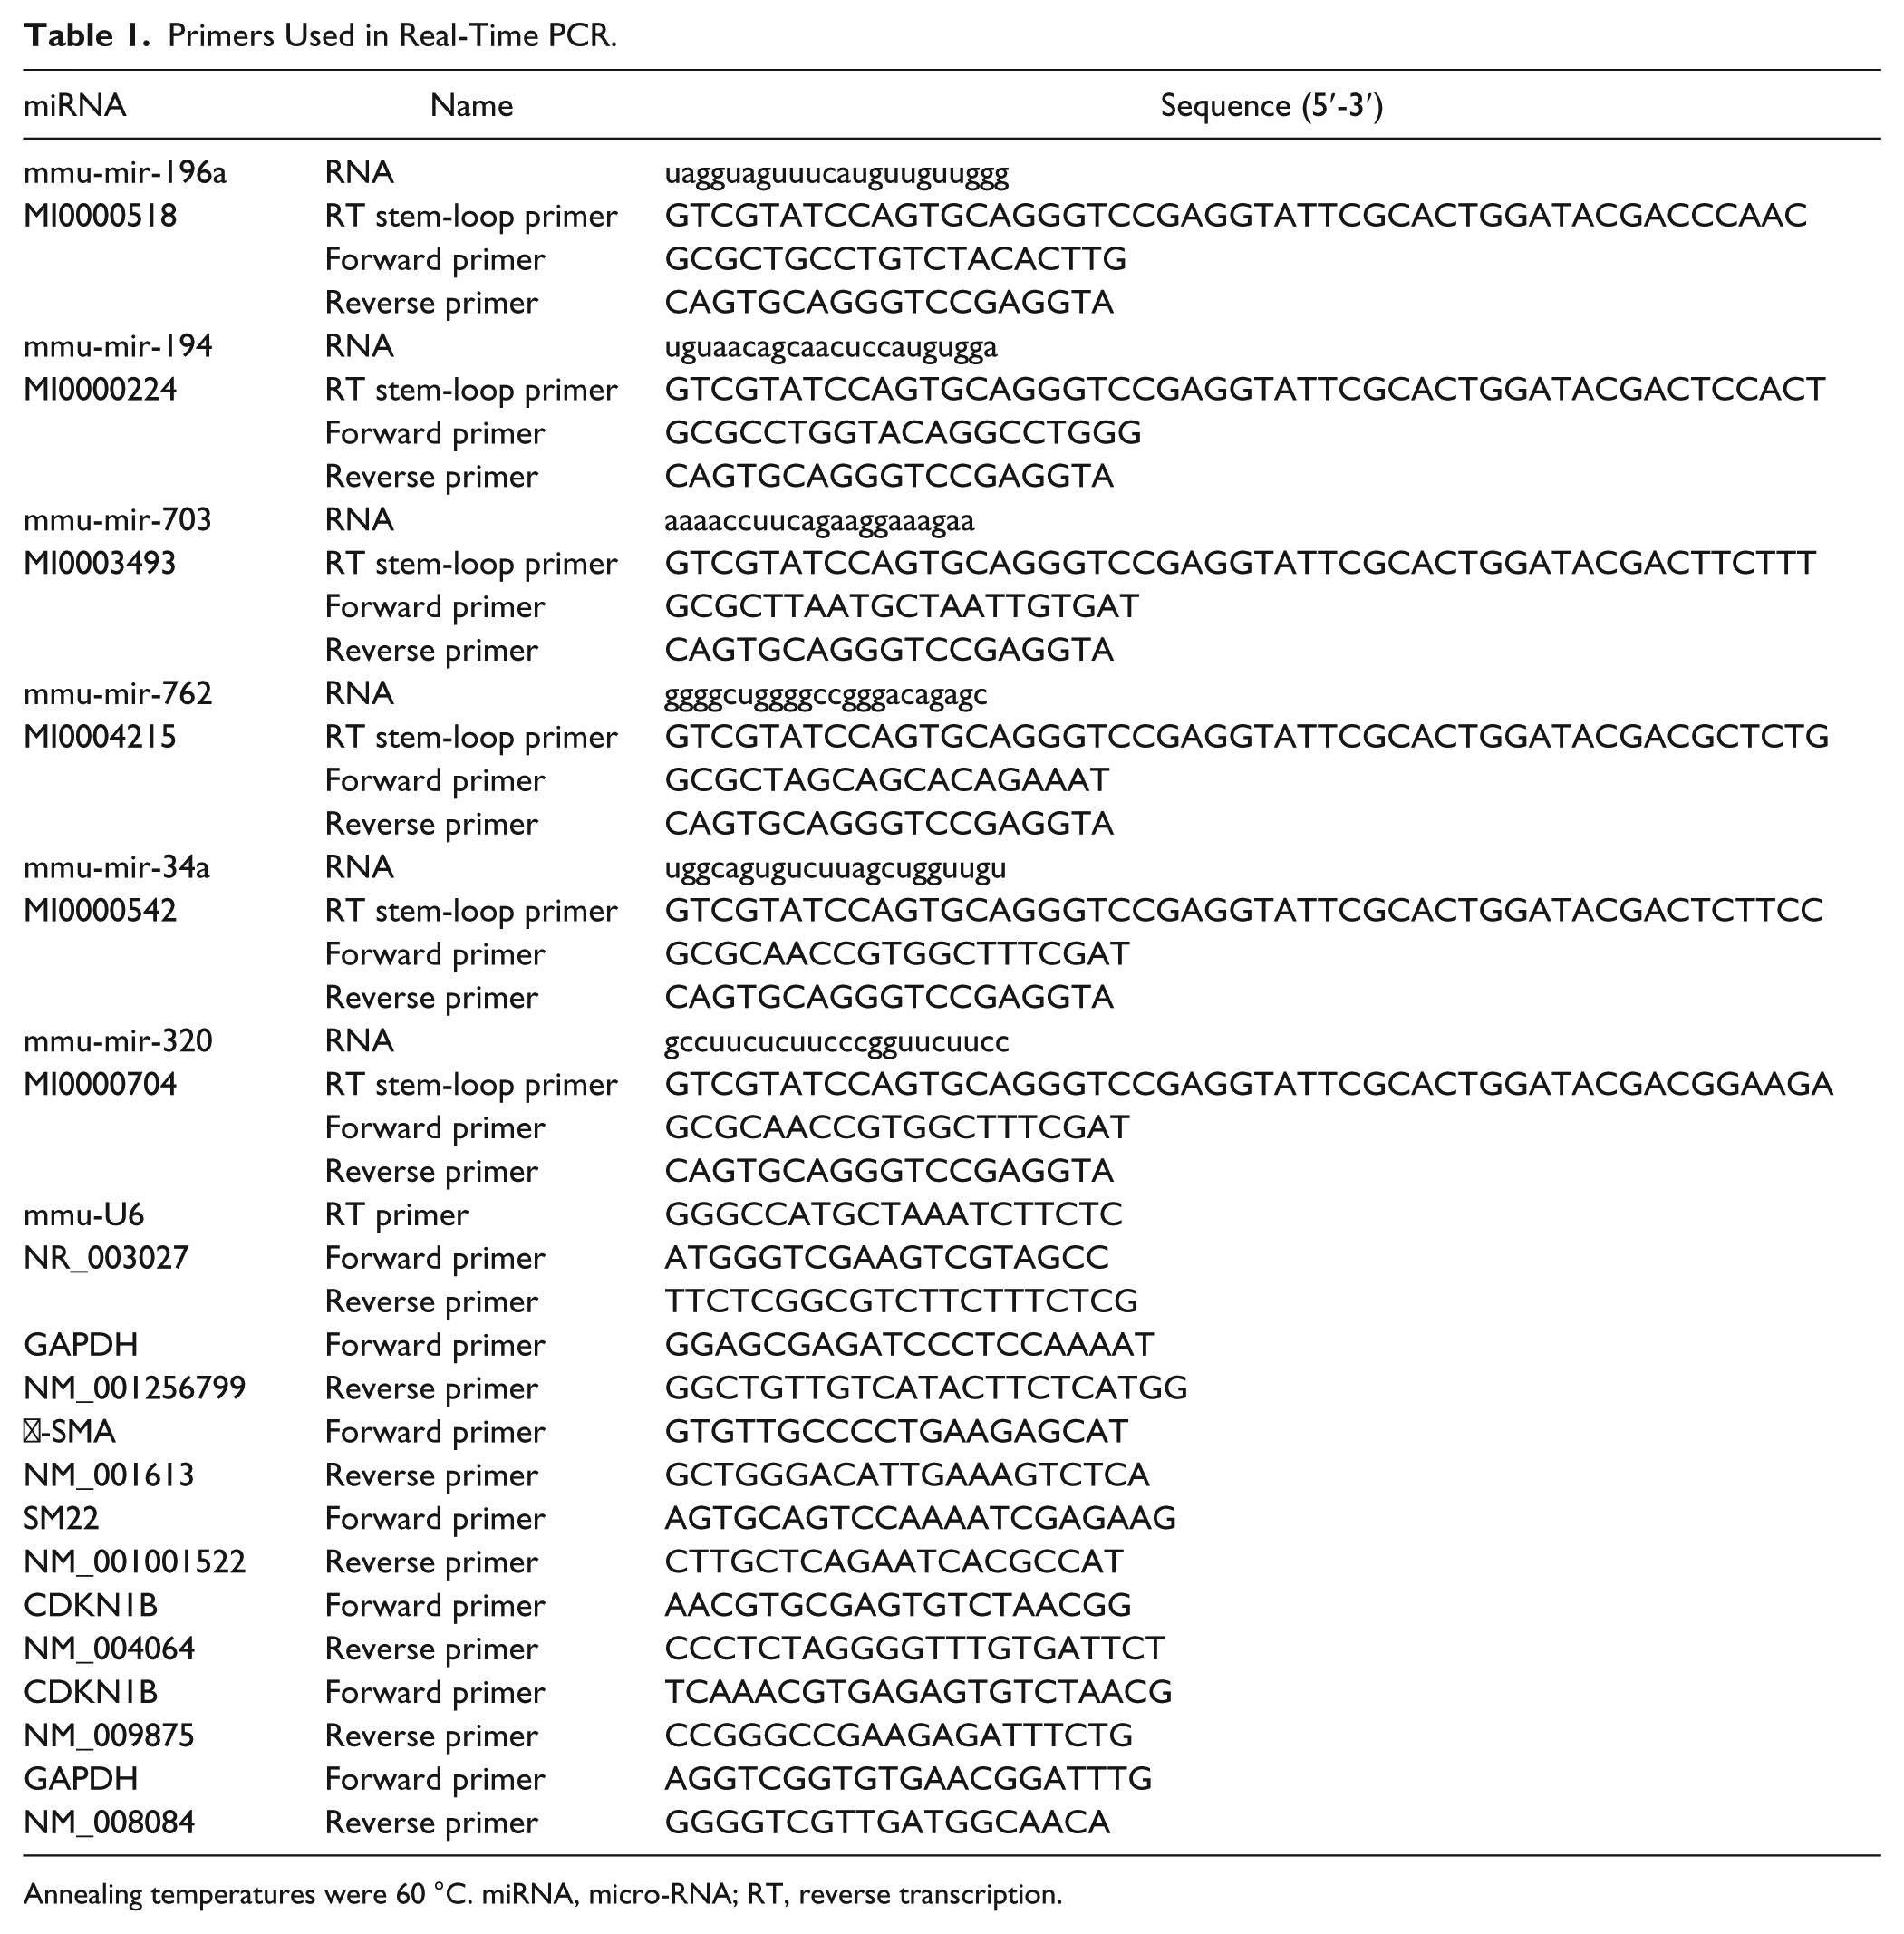
Annealing temperatures were 60 °C. miRNA, micro-RNA; RT, reverse transcription.
Cell Culture and Transfection
Primary human MCs were purchased from Sciencell (Carlsbad, CA) and cultured in Dulbecco’s modified Eagle’s medium (DMEM) supplemented with 20% fetal bovine serum (FBS). MCs were subjected to different treatment, including normal glucose (5 mmol/L) plus mannitol (20 mmol/L) as a control, high glucose (25 mmol/L), and transfection with one of the following: miR-196a scramble, miR-196a mimics, miR-196a inhibitor, and specific small interfering RNA (siRNA) for p27kip1 by using Lipofectamine 2000 (Invitrogen). MCs were harvested to observe morphology, analyze the percentage of different phases in the cell cycle, and detect mRNA and protein levels of p27kip1, α-SMA, and SM22 48 h after transfection. HEK293 cell lines were cultured in DMEM with 10% FBS for luciferase activity assay.
MC Hypertrophy Assay
MC morphology was observed under a phase-contrast microscope (Olympus BX-41; Olympus, Tokyo, Japan) 48 h after transfection with the miR-196a mimic (RiboBio, Guangzhou, China). Flow cytometry was also performed to analyze the percentage of MCs in different phases of the cell cycle. We also detected hypertrophic marker genes of α-SMA and SM22 in different-treated MCs. 19
Detection of p27kip1 by Real-Time PCR
Total RNA was extracted in cultured MCs by using Trizol reagent (Invitrogen), and 2 µg total RNA was subjected to reverse transcriptional reaction by the reverse transcription kit (Qiagen, Valencia, CA). Real-time PCR was performed with SYBR Premix (Takara, Dalian, China) in a LightCycler (Roche Diagnostics, Indianapolis, IN). Primer sequences of p27kip1 are shown in Table 1 .
Western Blot Analysis
MCs were harvested, as mentioned above, in cell culture and transfection, and then lysis buffer was added. After 25 min of centrifuge at 4 °C, the supernatants were subjected to a spectrophotometer (Pgeneral, Beijing, China) to measure protein concentration according to the manufacturer’s standard protocol (Pierce, Waltham, MA). Then, 45 µg total protein per sample was loaded onto a 12% polyacrylamide gel with the same amount of GAPDH as the internal control. The blot was incubated with a mouse monoclonal anti-p27kip1 antibody (1:1000; BD Transduction Laboratories, Franklin Lakes, NJ), rabbit anti-SM22, and α-SMA (1:200; Santa Cruz Biotechnology, Santa Cruz, CA) overnight at 4 °C after gel running, transferring, and blocking experiments. The horseradish peroxidase (HRP)–conjugated secondary antibody was added accordingly, followed by incubation with ECL (Pierce), and visualized by exposure to the X-ray. GAPDH was detected with a rabbit polyclonal anti-GAPDH antibody (1:200; Santa Cruz Biotechnology) and HRP-conjugated goat anti–rabbit antibody (1:1000; Santa Cruz Biotechnology). Exposed films were scanned with a Fluor-S multi-imager (Bio-Rad, Hercules, CA), and intensity was quantified with software (Bio-Rad). Each experiment was repeated three times, and all had identical results.
Luciferase Reporter Assay
The 3′ UTR of human p27kip1 with a putative target site for the seed sequence of miR-196a was amplified by PCR and cloned into the PGL-4 vector (Promega, Madison, WI) adjacent to the stop codon of luciferase (pGL4–p27kip1−3′ UTR, wild type). A mutant of p27kip1 3′ UTR was generated by the QuikChange II Site-Directed Mutagenesis Kit (Stratagene, Santa Clara, CA) with mutation of CTACC GATGG from a complementary site of the seed sequence of miR-196a. For the reporter assay, the miR-196a mimic was cotransfected with a wild type and a mutant reporter vector, respectively, into HEK293 cell lines. Cells were harvested to measure firefly and Renilla luciferase activities by the dual-luciferase assay kit (Promega) after 48 h of cotransfection.
Statistical Analysis
All data were expressed as mean ± SD. The Student t test was applied for the comparison between two groups. A p value <0.05 was regarded as statistically significant.
Results
Differential Expression of miRNAs in Kidney from STZ-Induced Diabetic DBA/2 Mice
To explore the roles of miRNAs in glomerular hypertrophy during DN, we established an STZ-induced type I DN animal model in DBA/2 mice. As noted in Figure 1A , B , STZ caused a remarkable increase in blood glucose (7.02 ± 1.4 vs. 19.19 ± 2.3 mmol/L, p < 0.01; Fig. 1A ), and 12 weeks after the onset of diabetes, the amount of proteinuria was significant in STZ-induced DBA/2 mice (3.86 ± 1.54 µg/mL vs. 54.42 ± 15.2 mmol/L, p < 0.01; Fig. 1B ). PAS staining showed glomerular expansion significantly in DN mice ( Fig. 1C ). The results of the miRNA microarray in the renal cortex showed that nine miRNAs downregulated and seven miRNAs upregulated in a volcano map ( Fig. 1D ). For accuracy, we performed random confirmation by RT-PCT with identical results from the microarray analysis ( Fig. 1E ).
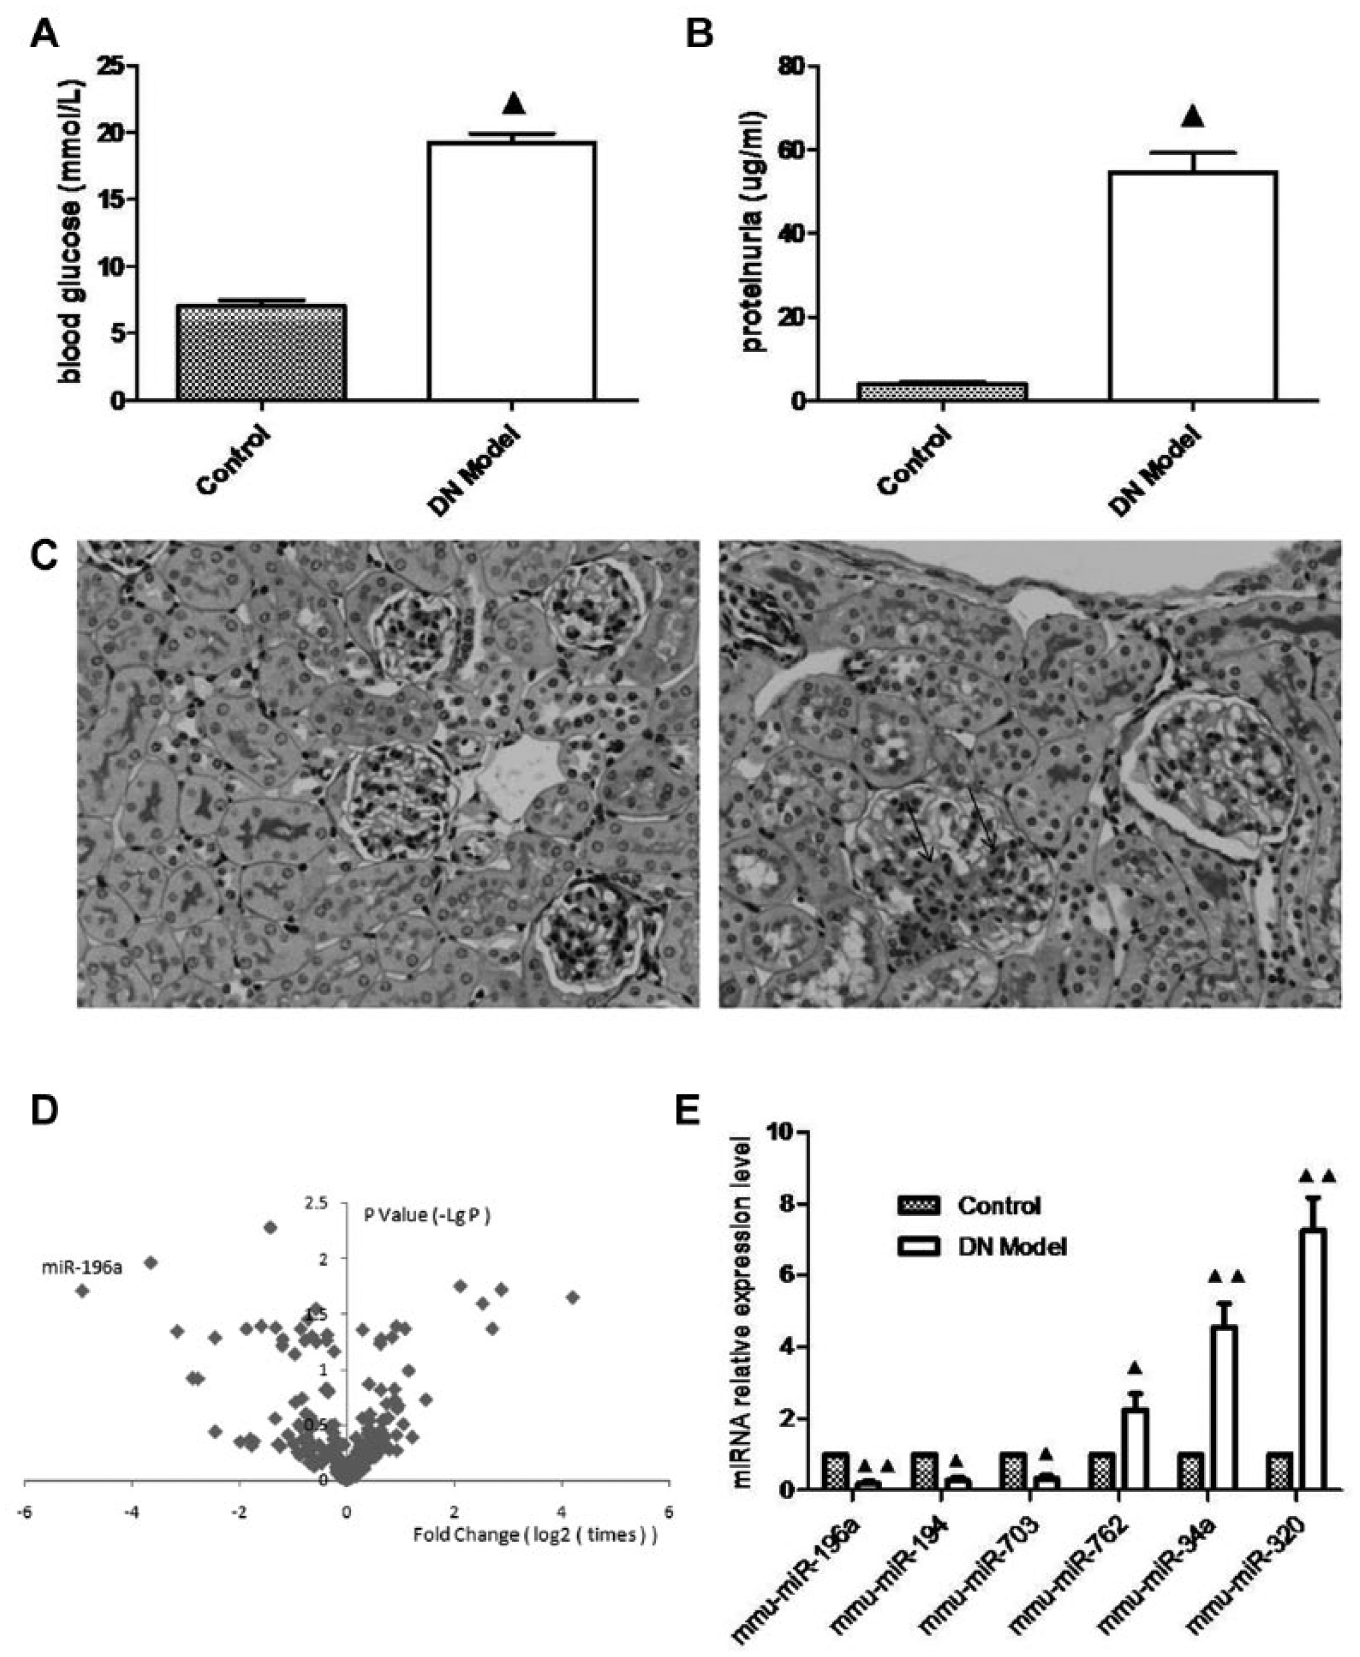
Alteration of microRNA (miRNA) expression in mice with diabetic nephropathy (DN). (
GO Analysis of Differential miRNAs
To identify the miRNA-mRNA regulatory network, we subjected significantly differential miRNAs to GO analysis ( Fig. 2A , B ). The results showed that the hypertrophic-related gene of Cdkn1b, coding p27kip1, was included in high-enriched GO. Therefore, miR-196a might be a potential molecular regulator of p27kip1, which is involved in the regulation of MC hypertrophy ( Fig. 2C ). We verified the expression level of p27kip1 in the renal cortex by quantitative RT-PCR. The result showed that the mRNA level of p27kip1 significantly increased in STZ-induced DBA/2 mice ( Fig. 2C ).
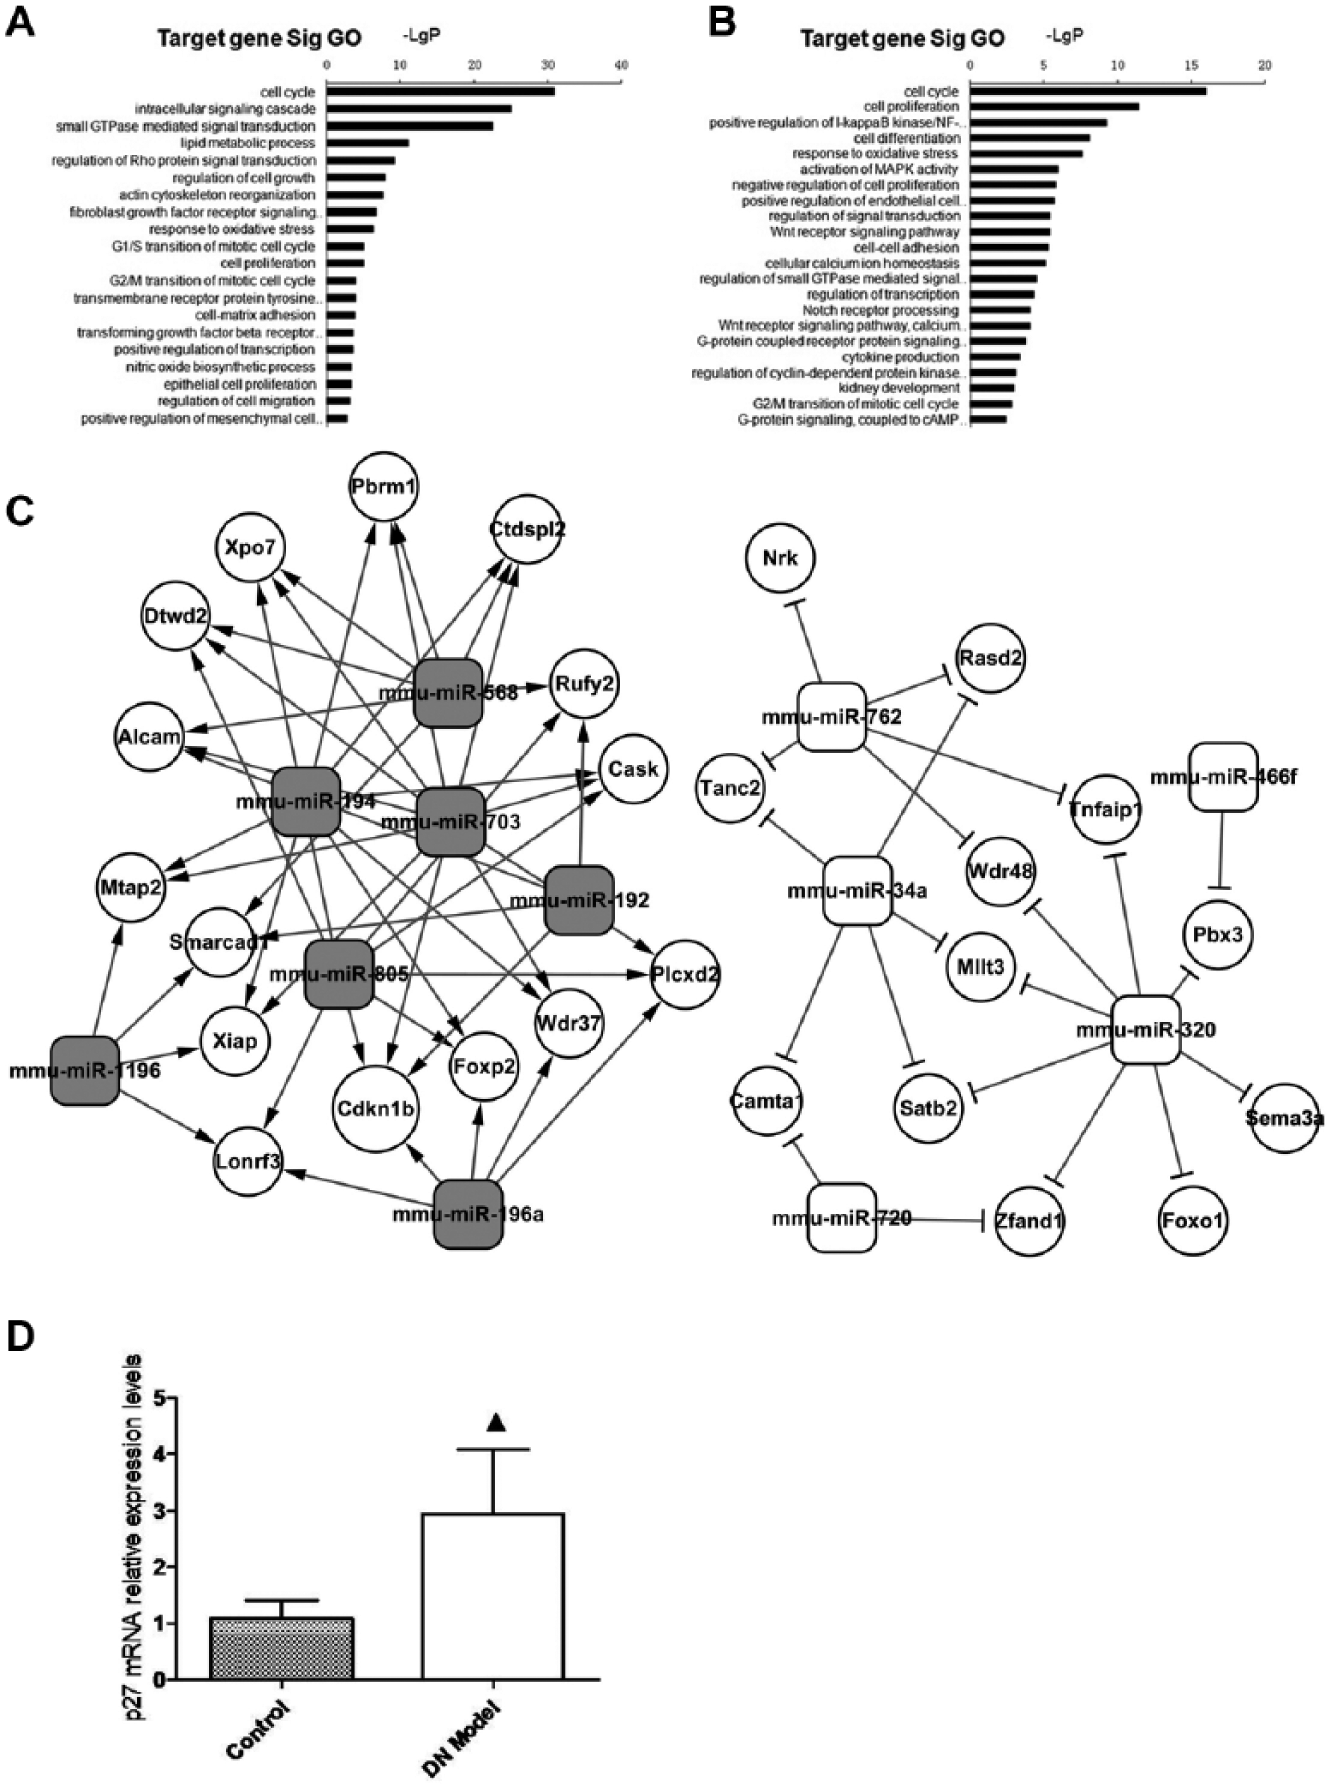
Bioinformatics data of differential microRNAs (miRNAs) in mice with diabetic nephropathy (DN). (
MiR-196a Regulates High Glucose-Induced MC Hypertrophy
To test the role of miR-196a in the process of MC hypertrophy, we transfected half-confluent human MCs with miR-196a mimic after 24 h of serum starvation. We observed MC hypertrophy under Olympus BX-41 microscope after exposure to high glucose for 48h. Overexpression of miR-196a partially reversed the transformation of the hypertrophic phenotype ( Fig. 3A ). To determine whether miR-196a functionally regulated MC hypertrophy, we performed flow cytometry to measure the percentage of MCs at different phases of the cell cycle. The result showed that percentage of the G1 phase of the cell cycle in the MCs increased significantly in the presence of high glucose. The G1 phase arrest suggested that the MCs failed to smoothly go through the M phase of the cell cycle with sustained protein synthesis, leading to MC hypertrophy. Overexpression of miR-196a decreased G1 phase cell cycle arrest in the presence of high glucose, while MC transformation of the hypertrophic phenotype recovered partly ( Fig. 3B ). Furthermore, we performed the expression of CDK inhibitor p27kip1 and hypertrophic marker genes of α-SMA and SM22. The results showed that miR-196a effectively inhibited high glucose-induced p27kip1, α-SMA, and SM22 ( Fig. 3C , D ).
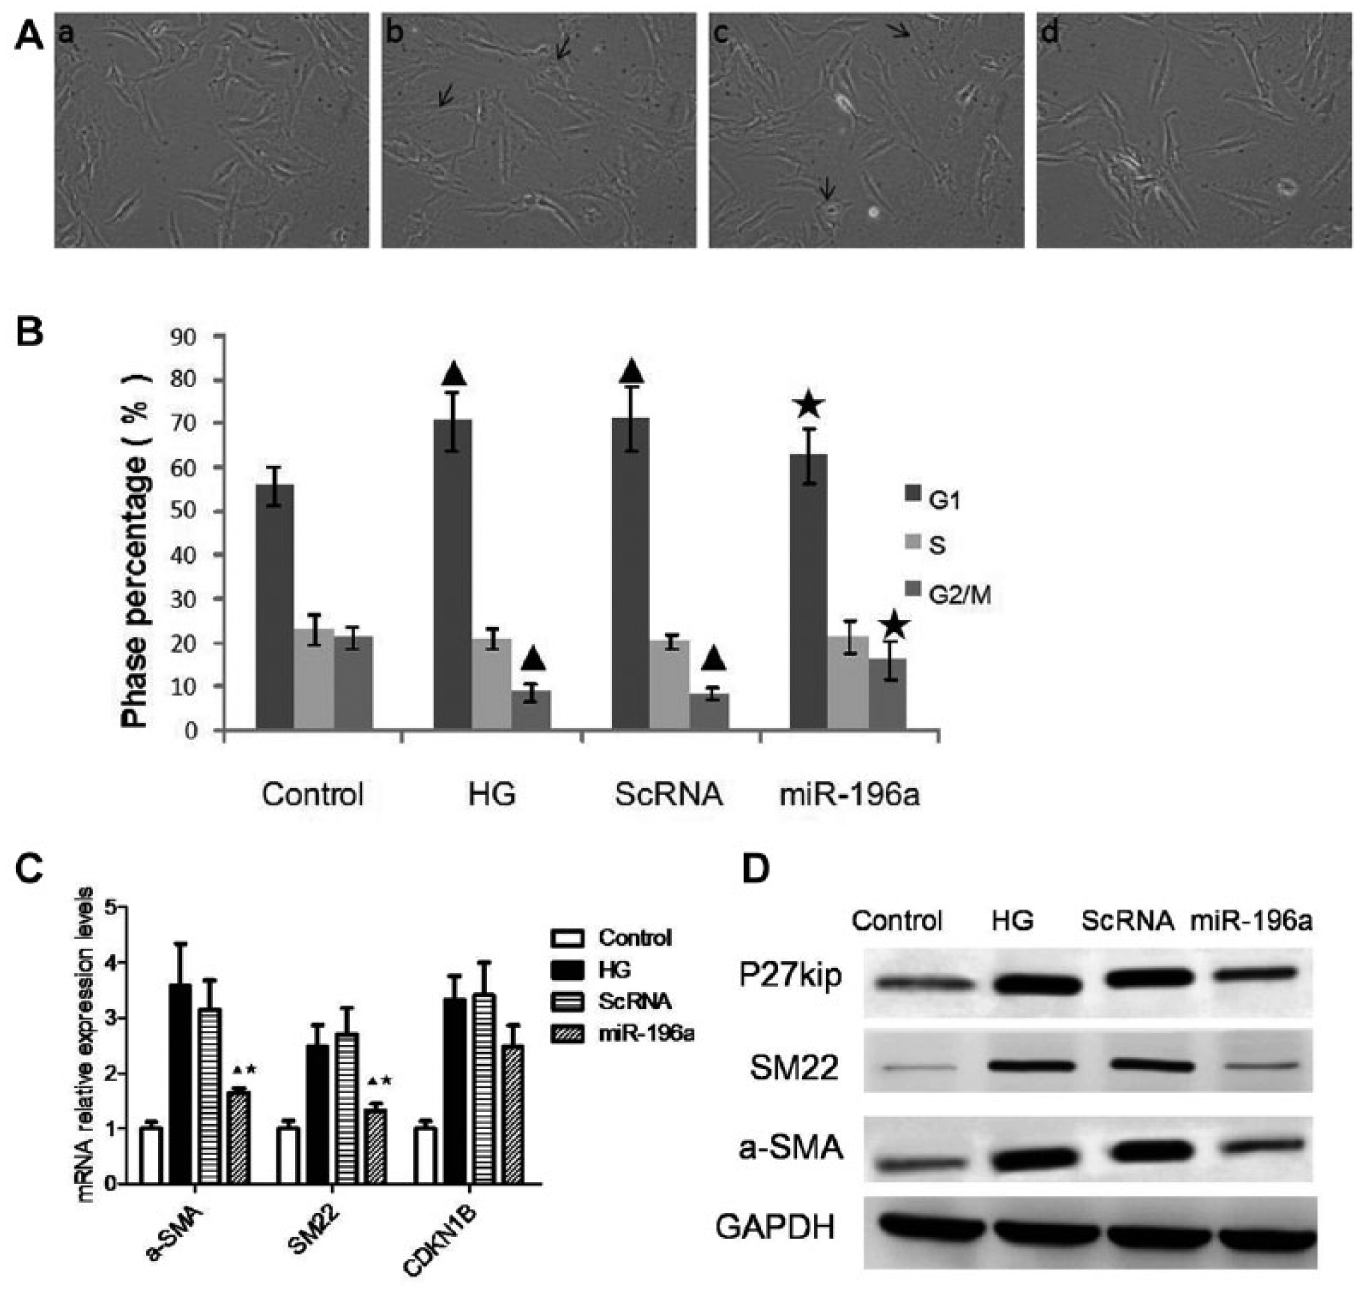
miR-196a involved in the regulation of mesangial cell (MC) hypertrophy. (
MiR-196a Regulates MCs Hypertrophy by Targeting p27kip1 Directly
As we know, miRNAs in general take effect by regulating their target genes at the posttranscriptional level. To further explore the target gene of miR-196a, we performed GO analysis to find that high-enriched GOs contain the gene of Cdkn1b, coding p27kip1, an inhibitor of CDK. To determine whether miR-196a targets p27kip1 directly, we constructed a luciferase reporter vector containing either a wild type of p27kip1−3′ UTR or a mutant of p27kip1−3′ UTR, followed by cotransfection with miR-196a mimic into HEK293 cell lines. We found that miR-196a mimic with the wild type of 3′UTR of p27kip1 inhibited significantly the activity of the luciferase reporter, but miR-196a mimic with a mutant of 3′UTR of p27kip1 did not, indicating that miR-196a targets p27kip1 directly ( Fig. 4A ). To determine whether miR-196a regulates MC hypertrophy by targeting p27kip1 directly, we transfected specific siRNA for p27kip1 to block the protein level of p27kip1 in MCs. By analysis of the percentage of different phases of the cell cycle, we found that blockade of p27kip1 inhibited alteration of the cell cycle due to loss of miR-196a ( Fig. 4B ). Meanwhile, hypertrophy marker genes of α-SMA and SM22 declined accordingly ( Fig. 4C , D ).
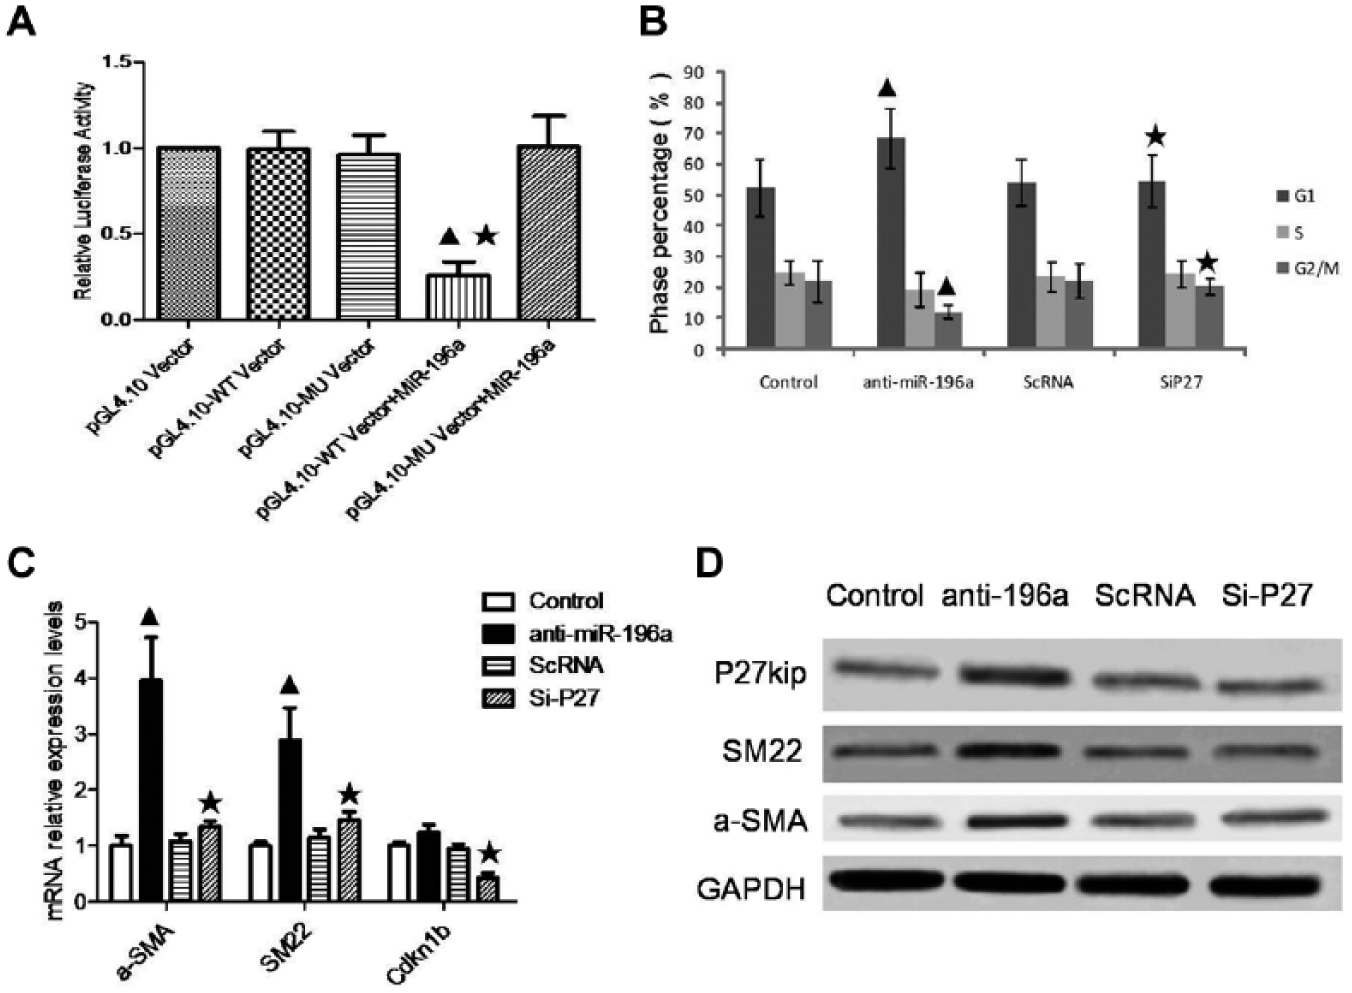
miR-196a directly targeted p27kip1 to regulate mesangial cell (MC) hypertrophy. (
Discussion
Glomerular hypertrophy occurs at an early stage of DN, which consists mainly of MC hypertrophy and secondary ECM deposition in the mesangial area. MC hypertrophy is regarded as a key event responsible for mesangial expansion, which causes glomerulosclerosis eventually. 2 Cell growth is regulated by the cell cycle–related proteins, with activation of CDK required for progression through the whole cell cycle. A series of reports indicated that p27kip1, an inhibitor of CDK, contributed to MC hypertrophy in the presence of high glucose as a result of G1 phase arrest of the cell cycle.7,20
miRNAs have been defined as single-strand, small noncoding RNAs of 21 to 25 nt, which have been recognized as potent regulators of gene expression at the posttranscriptional level by binding to the complementary site of 3′ UTR of their target genes. Emerging evidence has shown that miRNAs act as a key modulator of a variety of biological processes. 8
In this study, our data revealed that 16 miRNAs were significantly different in DN mice compared with nondiabetic control mice. Several studies have demonstrated miRNAs involved in cardiac myocyte and smooth muscle cell hypertrophy. More interestingly, miR-216, 217, 21, 34, and 451 have been recognized as important regulators of MC hypertrophy.21,22 In this study, the results of bioinformatics of differential miRNAs showed that cell growth–related genes were located in the high-enrichment GOs. The network of critical miRNAs and their target genes was established according to the degree of miRNAs. We found that miR-196a downregulated remarkably in DN mice and potentially targeted p27kip1. Previous studies showed that miR-196a correlated with osteosarcomas and colorectal, breast, and pancreatic tumors. Zhang et al. 23 reported more recently that miR-196a served as a biomarker in patients with focal and segmental glomerulosclerosis, suggesting that miR-196a might be a potent target in human kidney disorders.
Our study was designed to determine whether miR-196a is involved in high glucose-induced MC hypertrophy, an early hallmark responsible for glomerulosclerosis during DN. Previous studies showed that high glucose induced a biphasic growth response of MCs. There was a transient proliferation, followed by a sustained inhibition after 48 h of incubation. Thereby we incubated MCs for 48h in the presence of high glucose as described previously. 24 The results showed that overexpression of miR-196a alleviated MC hypertrophy and reduced the percentage of G1 phase arrest in the cell cycle. Meanwhile, we found that the percentage of M phase MCs increased accordingly. These results indicated that miR-196a functionally regulated MC hypertrophy. In addition, in HEK293 cells, we found that a wild type of the p27kip1 vector, rather than a mutant of the p27kip1 vector, reduced luciferase reporter activity after cotransfection with miR-196a, suggesting that miR-196a directly targets p27kip1. Previous studies3–6 reported that p27kip1 was required for the process of MC hypertrophy. Here we showed that the knockdown of p27kip1 reversed MC hypertrophy induced by the blockade of miR-196a, suggesting that miR-196 functionally regulated MC hypertrophy by targeting p27kip1 directly.
As described previously, MC hypertrophy was regarded as a key event in early stage DN. 1 Hypertrophic phenotype transformation acquired characteristics of myofibroblasts to synthesize the protein of ECM, further accumulate in the glomerular mesangial area, and gradually cause mesangial expansion responsible for glomerulosclerosis. 2 In this study, PAS staining showed that mesangial expansion was significant in STZ-induced DN mice with albuminuria in contrast to that of nondiabetic control mice, which strongly suggests that miR-196a and its target gene p27kip1 play an important role in the pathogenesis of DN by regulating transformation of the hypertrophic phenotype of MCs.
Given the fact that DN is becoming a primary cause of end-stage renal disease with limited effective treatment, it is necessary to explore the mechanism of the onset and progression of DN.24–27 As a hallmark event, MC hypertrophy caused concerns at a very early stage of DN. Limiting its early growth might have impact on the later progression of DN. This study revealed that miR-196a functionally regulated MC hypertrophy in vitro. For the next step, we will construct a miR-196a lentivirus vector, deliver it into DN mice, and observe the effects of miR-196a on urinary albuminuria excretion and mesangial expansion in vivo to provide new clues for a potentially therapeutic approach.
Footnotes
Acknowledgements
We are grateful to all members in the Department of Nephrology, Shanghai Jiao Tong University Affiliated Sixth People’s Hospital, for their efforts and assistance.
Declaration of Conflicting Interests
The authors declared no potential conflicts of interest with respect to the research, authorship, and/or publication of this article.
Funding
The authors disclosed receipt of the following financial support for the research, authorship, and/or publication of this article: This study was supported by grants 81270814, 81270824, and 81270208 from the National Natural Science Foundation of China and grant 11410708500 from the Science and Technology Commission of the Shanghai Non-governmental International Cooperation Project.