
Abstract
Bronchoalveolar lavage (BAL) partially recovers both the instilled saline and the alveolar fluid, so-called epithelial lining fluid (ELF), but a correction for the dilution due to the BAL technique itself is needed to know the amount of recovered ELF. In this regard, urea nitrogen may be useful and has been proposed to calculate ELF. The aim of the present study was to develop and validate a new method to measure urea nitrogen in BAL fluid (BALF). We used 19 BALF samples obtained from neonates and infants with different respiratory conditions. The urea nitrogen assay was carried out on Cobas c311 analyzer (Roche Diagnostics). A validation study shows that the method is perfectly linear (R2 = 0.999), sensitive (limit of detection = 0.055 mg/dL; limit of quantification = 0.16 mg/dL), repeatable (low = 0.15 ± 0.02, 13.3%; high = 1.80 ± 0.02, 1.1%), reproducible (low = 0.14 ± 0.02, 14.2 %; high = 1.76 ± 0.04, 2.2 %) with accuracy ranging between 93–96%. Our results support the robustness of validated procedure since the described method appears simple, precise, rapid, and suitable for routine analysis. Thus, it may be used to correct concentration of various noncellular BAL components and calculate their ELF amounts in neonates and infants.
Introduction
Bronchoalveolar lavage (BAL) is a cornerstone procedure in pediatric and neonatal critical care and is the only allowing the collection of data on lung biology. BAL has been used for both diagnostic and research purposes.
BAL consists on the instillation of a certain volume of saline and the subsequent aspiration from a specific lung area. Aspiration will partially recover the instilled saline and the alveolar fluid, the so-called epithelial lining fluid (ELF). From a biological point of view, ELF is the only important specimen to be studied, but a correction is needed to actually know the amount of ELF recovered with the BAL procedure.
In neonatal critical care, due to the small patient size and the difficulty of using bronchoscopes, BAL is usually performed following specific techniques such as nonbronchoscopic BAL and using small volumes: the resulting samples usually consist of about 1–2 mL. 1
Urea nitrogen assay has been proposed to correct BAL dilution and calculate ELF using serum-to-BAL fluid (BALF) urea ratio at the moment of the lavage. This technique theoretically presents some advantages. 1 In fact, urea is thought to be present in equal concentrations in serum and ELF. This is due to the fact that the urea is a small molecule easily diffusing through the epithelium, and it is less affected by the capillary leak present in many pulmonary disorders.2,3
When it comes to ELF calculation in neonates, a suitable technique should be intrinsically reliable and based only on microvolumes to spare BAL volumes for diagnostic or research assays. Although urea assay has been previously used in research using neonatal BAL, it must still be formally validated. In fact, because of the intrinsic dilution due to the BAL procedure itself, urea is usually present in very low concentrations in BAL samples. Yet in 2000, the European Respiratory Society Task Force considered it urgent to perform research about ELF calculation in neonatal BAL samples using the urea technique. 1
We and other authors have published some papers using urea nitrogen measurement in BALF and using the serum-to-BALF urea ratio to correct the BAL dilution in neonates and infants.4–8 A measurement of urea concentrations in BALF and serum was performed in duplicate by means of a colorimetric assay (urea nitrogen suitable on Olympus AU2700). 4 Although Capoluongo et al. previously reported this method as a modified protocol on Olympus instrumentation, 4 no details were provided about the setup of a standardized method to assay urea in BALF. Because some new platforms for clinical biochemistry assays are present on the market, we tried to develop and validate a spectrophotometric method to detect urea nitrogen in BALF, possibly useful also on other automated instruments. In the present paper, we report details for sample collection, reagents handling, standard preparation, and chemistry performances.
Materials and Methods
Patients and BAL
BAL samples obtained in neonates with different respiratory conditions were used for the tests. BAL was performed in 15 neonates (mean gestational age: 34.6 ± 3.7; mean birth weight: 2400 ± 904 g; male/female ratio: 6/7). Five neonates were affected by hyaline membrane disease (iRDS), five had infection-related respiratory failure (IRRF), and five had no lung disease (NLD) and were intubated for reasons other than any lung disease.9,10 BALF was also obtained from four infants (mean age: 3 ± 0.8 months; mean weight: 5.1 ± 1 kg; two males) with acute respiratory distress syndrome. 5
In these patients, nonbronchoscopic BAL was performed according to the advice of the European Respiratory Society Task Force, 1 using a standardized technique as previously described.5,10 In detail, lavage was performed by instillation of two sequential aliquots of 1 mL/kg (up to a maximum of 5 mL) 0.9% NaCl warmed at 37 °C, into the endotracheal tube, followed by three respiratory cycles. A straight, snub-nosed, end-hole suction catheter was gently advanced into the endotracheal tube, while continuing ventilation through a Y-connector (mucus trap, Vygon, Écouen, France). When resistance was met, suctioning with 50 mmHg of negative pressure was applied. The procedure was repeated with the infant’s head turned 90 ° to the left and then to the right in order to virtually ensure sampling from the right and the left lung, respectively. Recovered volume was 50 ± 5% of the instilled volume; this sample was then diluted with 0.9% saline up to 2 mL, if the recovered volume was <2 mL. One aliquot (0.3 mL) was sent for microbiological routine test, while the remaining was immediately centrifuged (3000 rpm; 4 °C; 10’). Cell-free supernatant was frozen at −80 °C and thawed only once for the experiments within 6 mo. All samples were sterile and did not show visible and detectable (as evaluated by the hemolytic index test on Roche Cobas 8000 machine, Roche Diagnostics, Mannheim, Germany) blood contamination. BAL procedure lasted 155 ± 30 s. BAL is our routine procedure for microbiological surveillance, and it was performed according to the hospital protocol only when indicated for clinical reasons (microbiological tests or aspiration of respiratory secretion). In detail, BALF was obtained at a mean postnatal age of 6 ± 3 hours for babies with iRDS and 4 ± 1 days for IRRF and NLD babies. In all cases, BAL was performed within 3 hours from intubation and before surfactant administration. Institutional review board approved the protocol, and consent was obtained from parents.
Calibration Curve and Quality Controls (QC) for Urea Assay
The following considerations were taken into account regarding BALF urea assay: (1) the absence of a reference method and reagents dedicated to specific quantification of urea nitrogen in BALF, (2) criticisms regarding matrix of BALF, and (3) amount of starting sample, which is usually quite small.
Therefore, we decided to use a certified standard (calibrator for automated systems, Roche Diagnostics, Ref. 10759350 190) deriving from a traceable source used for the calibration of urea nitrogen assay in serum matrix. For this reason, the matrix effect was also studied.
Therefore, standard solutions (STDs) were prepared by serial dilutions of the above mentioned calibrator with physiological solution (0.9% NaCl). Concentration of STDs was chosen on the basis of the concentration range previously measured in BAL samples from both neonates and infants,6–8 that is, from STD 6 to STD 1: 2.00 mg/dL, 1.20 mg/dL, 0.60 mg/dL, 0.30 mg/dL, 0.15 mg/dL, and 0.00 mg/dL as blank. QC were prepared similarly to STDs to achieve a final concentration of 1.8 mg/dL for QC high and 0.15 mg/dL for QC low. Each STD and QC were analyzed in duplicate.
Principle of Analytical Method
The urea nitrogen assay was carried out on Cobas C311 analyzer (Roche Diagnostics), which uses the following reaction principle: urea is hydrolyzed by urease to form ammonium carbonate. In a second reaction, the 2-ketoglutarate reacts with ammonium in the presence of GLDH and the coenzyme NADH, producing L-glutamate. In this reaction, for each mole of urea hydrolyzed, 2 mol of NADH are oxidized to NAD+. The rate of decrease of the NADH concentration is directly proportional to the concentration of urea in the sample and is measured spectrophotometrically.
The type of reaction is kinetic, and the reaction trend is decreasing from zero to negative values. Absorbance values are measured at 340 nm (main) and 700 nm (secondary). The assay needs only microvolumes (4–6 µl). For samples with a concentration of urea nitrogen greater than 2.0 mg/dL, an automatic sample dilution is performed. More technical details are given in the manufacturer’s handbook.
Statistics
Statistical analyses were performed using Analyse-it 2.30 version, for Microsoft Excel (Leeds, U.K.). Results of within-day and the between-day imprecision are presented as mean ± standard deviation (SD) and relative SD (RSD %). One-way analysis of variance was used to compare the coefficient of variation (CV) calculated for different groups of BAL samples. Multiple curve estimation procedure, using SPSS 15.0 for Windows (SPSS Inc., Chicago, IL), was performed to compare regression curves and study the matrix effect. 11 p ≤ 0.05 was considered statistically significant.
Results
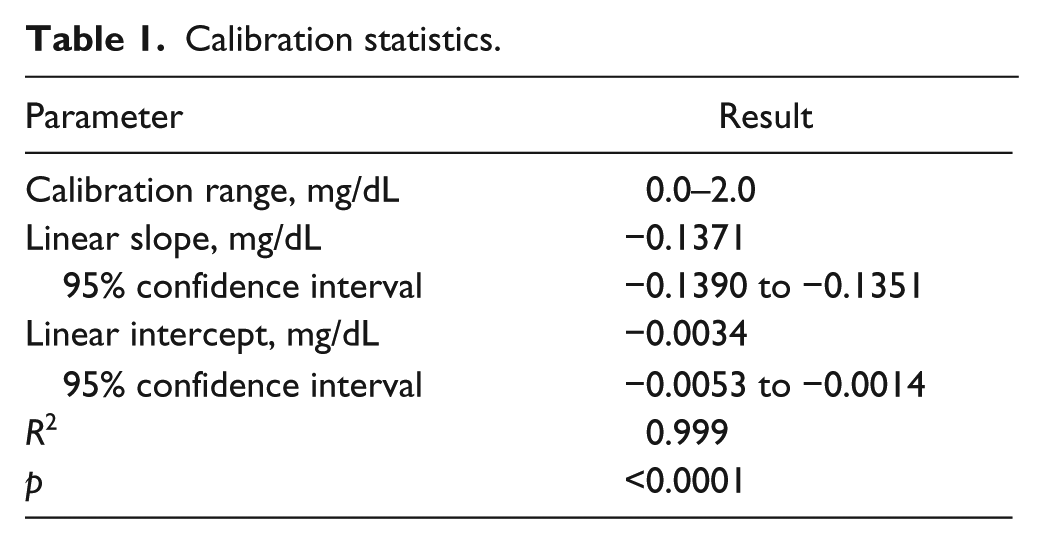
The linearity of the calibration curve was evaluated first. Linear regression analysis gave the following equation: y = −0.1371x − 0.0034 and a regression coefficient (R2) of 0.999, showing excellent linearity ( Table 1 ). Thus, the linear range of the assay was shown to be 0.0–2.0 mg/dL. The constructed calibration curve is shown in Figure 1 .
Calibration statistics.
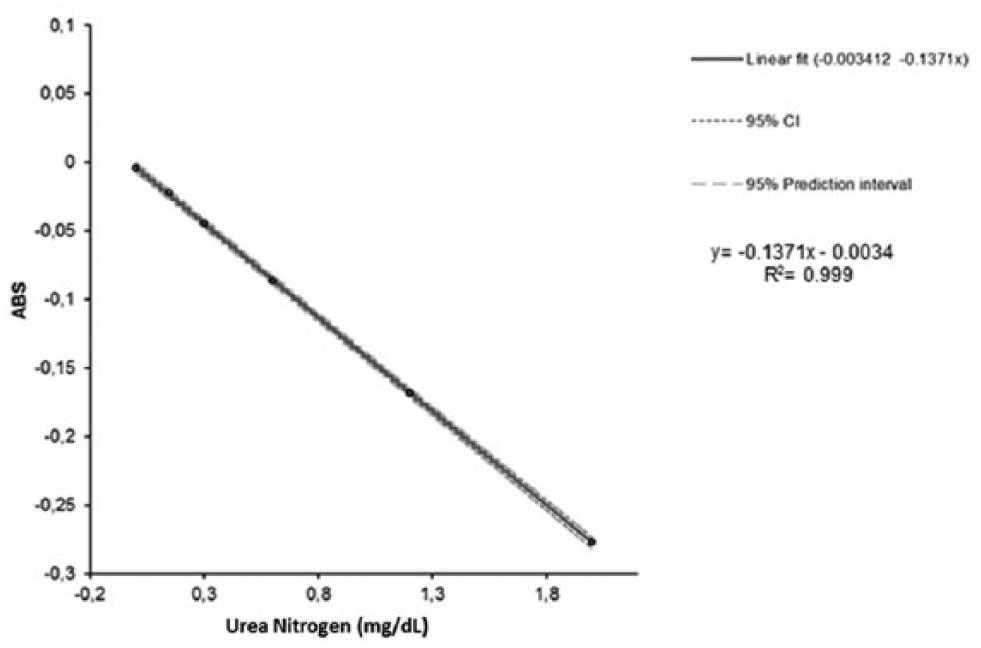
Calibration curve and linear regression analysis.
As defined in EP17-A protocol from the Clinical and Laboratory Standard Institute guideline, 12 Limit of blank (LoB) was estimated by measuring 60 replicates of a blank sample and calculating the mean result (0.01 mg/dL) and the SD (SD = 0.015), then applying the following formula: LoB = meanblank + 1.645 (SDblank), LoB was equal to 0.03 mg/dL.
The limit of detection (LoD) and the limit of quantification (LoQ) were determined using the formula: LoD = meanblank + 3 (SDblank); LoQ = meanblank + 10 (SDblank). The results obtained were LoD = 0.055 mg/dL and LoQ = 0.16 mg/dL.
The trueness of a method can be determined either by comparing with an established method or by using reference materials containing known concentration of the analyte (certified materials or spiked samples). Because there is no established method for the quantification of urea nitrogen in BALF, and no certified materials are available, spiking the BALF sample was the only alternative. Therefore, to check the accuracy of the proposed method, the standard addition technique was applied. Two different concentrations of the STD (0.15 mg/dL and 1.8 mg/dL) were added to four different concentrations of BALF samples and assayed. The recovery percentage of the added standard to the assay samples was calculated as: Recovery % = [(Cf – Ci)/ Ca]*100, where Cf is the final concentration of the analyte found, Ci is the initial concentration, and Ca is the added concentration. The average percentage recoveries obtained were 93% and 96% for low and high urea nitrogen concentration standards, respectively, indicating a good accuracy.12,13 From these results, we calculated the proportional error as the difference between 100% and the observed percentage recovery. Given that the observed proportional errors were 7% at low concentration and 4% at high concentration, analytical performance meets the CLIA criterion for acceptability, as the allowable error is 9%.14,15
The within-day repeatability and the between-day reproducibility of the method were evaluated by repeated analysis of QC samples at two concentration levels, to estimate the imprecision of the analytical method. The repeatability was evaluated by duplicate run of QC samples for 20 times in 1 d (QC low = 0.15 ± 0.02, 13.3%; QC high = 1.80 ± 0.02, 1.1%) over a time frame of 20 days to assess the reproducibility (QC low = 0.14 ± 0.02, 14.2%; QC high = 1.76 ± 0.04, 2.2%). Imprecision was expressed as the RSD percentage at each QC concentration ( Table 2 ). Repeatability was also examined by analysis of 15 BALF samples, at different concentrations, which were run in triplicate. CV values were always ≤10%. The overall CV for all tests performed was 3.4 ± 2.8%. In detail, the CV was 5.8 ± 2.9% and 1.8 ± 0.9% for BALF having mean urea level <0.5 and >1 mg/dL, respectively. Table 3 shows that CV was not significantly different across neonates and infants differing for age and respiratory condition (p = 0.913), nor between the groups of neonates differing only for respiratory conditions (p = 0.803).
Results of LoB, LoD, and LoQ; Recovery Test; and Within-Day and Between-Day Imprecision Are Shown.
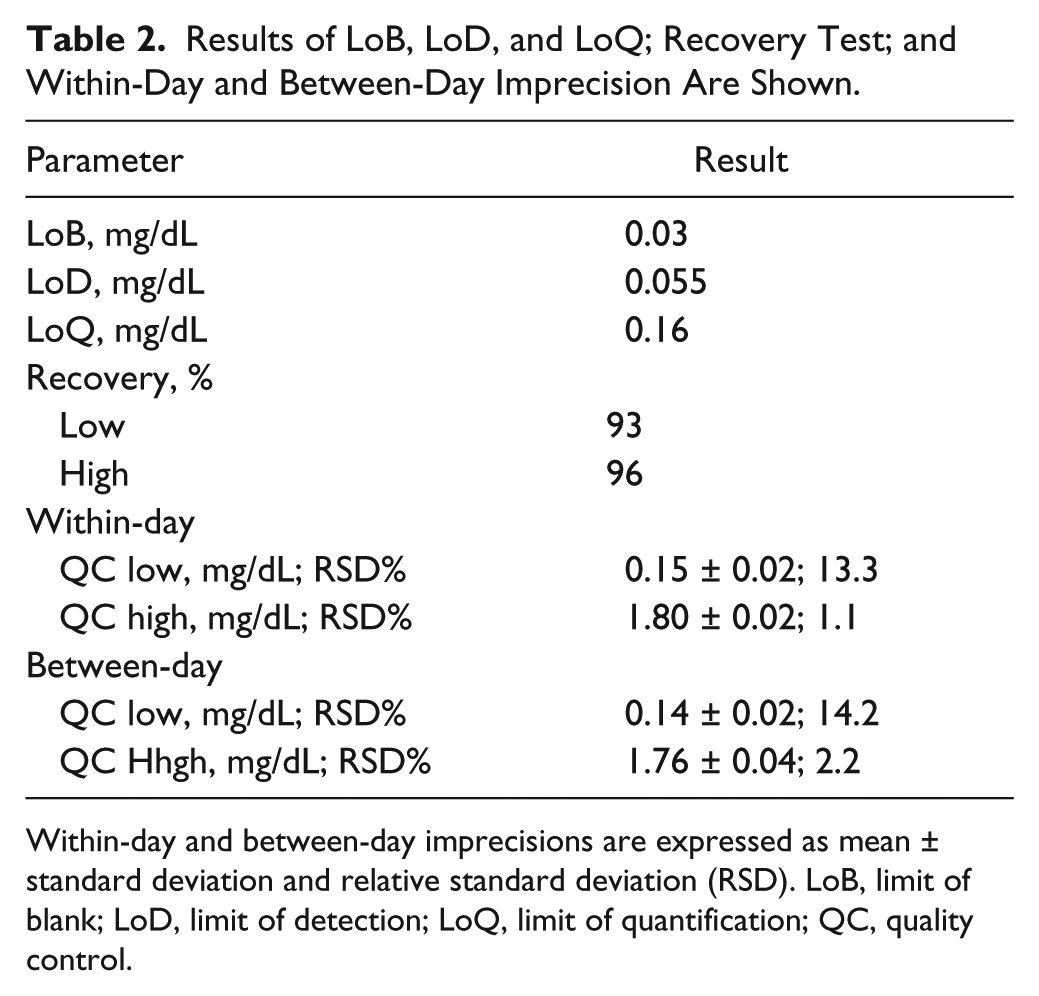
Within-day and between-day imprecisions are expressed as mean ± standard deviation and relative standard deviation (RSD). LoB, limit of blank; LoD, limit of detection; LoQ, limit of quantification; QC, quality control.
Repeatability Using Neonatal BAL Samples.
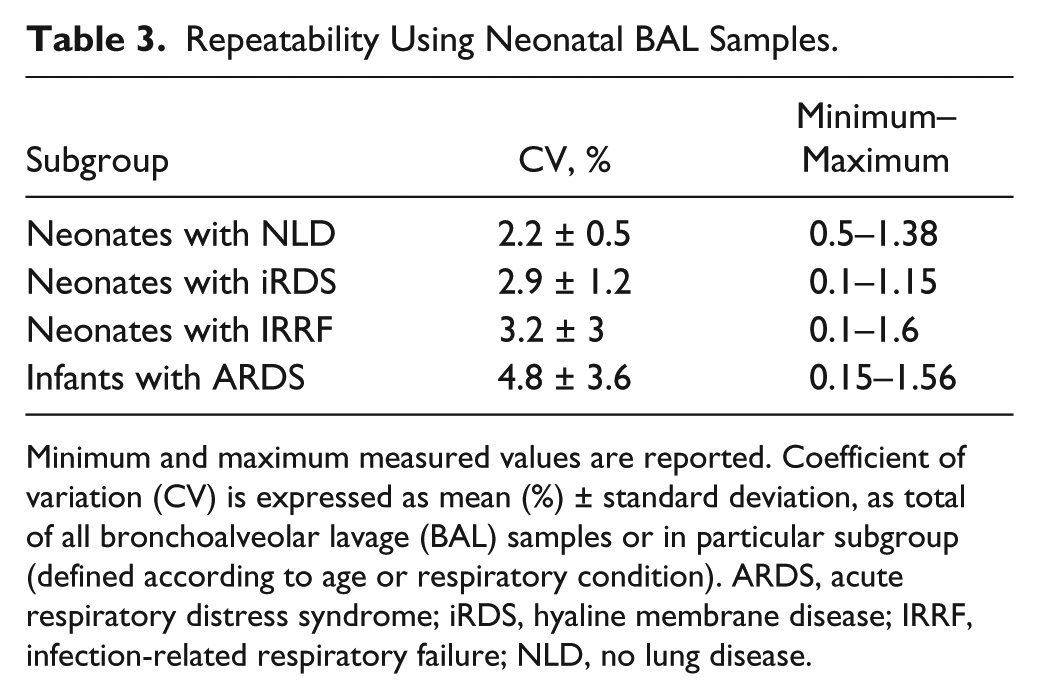
Minimum and maximum measured values are reported. Coefficient of variation (CV) is expressed as mean (%) ± standard deviation, as total of all bronchoalveolar lavage (BAL) samples or in particular subgroup (defined according to age or respiratory condition). ARDS, acute respiratory distress syndrome; iRDS, hyaline membrane disease; IRRF, infection-related respiratory failure; NLD, no lung disease.
In the absence of a reference method and materials specific for quantification of urea nitrogen in BALF, it is necessary to evaluate the effects of a possible matrix mismatch. This was made by adding urea to BALF samples. The range of additions encompassed the same final dilution defined for calibration curve validation. Because the calibration is linear, the slopes of the calibration function and the addition plot were compared for calculating significant differences. A lack of significance means that there is no detectable general matrix effect. In fact, the lines shown in Figure 2 are almost perfectly overlapping, demonstrating that the BALF matrix does not influence the urea nitrogen assay (p = 0.980).
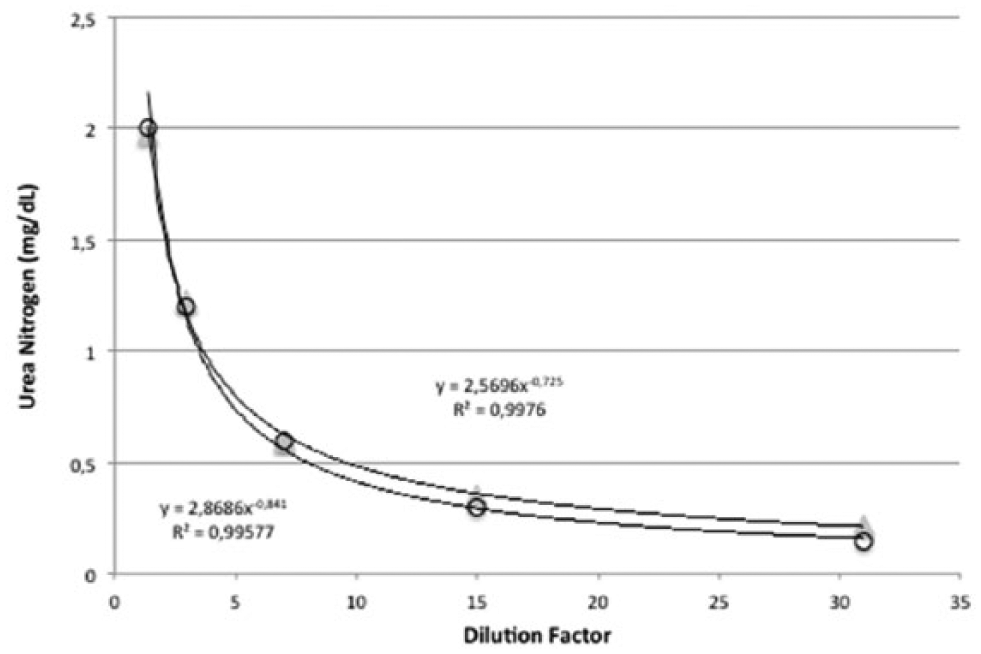
Matrix effect.
Carryover can affect the accuracy and precision of quantitation at all concentration levels, although low concentrated samples are mostly influenced by the percentage of concentration. For this reason, carryover was assessed during validation by assaying blank sample after a high urea nitrogen concentration sample (1.58 mg/dL) five times. This test demonstrated that the assay is not affected by sample carryover.
All experiments were performed with both 4 and 6 µl of samples obtaining same results (data not shown), and there was a close correlation between urea values measured using the two different volumes (r = 0.98; p < 0.001).
Discussion
To the best of our knowledge, no analytical method for analyzing urea nitrogen in BALF is formally described in the literature.
The correction of all types of quantitative assay in the BALF samples is really important because the BAL technique is operator dependent and patient dependent even if a standardized procedure is used. It is really impossible to have a dedicated physician available for 24 h to perform all BAL procedures. For this reason, some papers might have given conflicting results on the same research topic using BALF. As already reported,1,16 the contemporary measurement of BALF and serum urea concentrations may represent a suitable way to correct the measurement of different molecules in BALF for lavage dilution. Although several different molecules have been proposed for normalization (such as BALF creatinine and albumin), the ratio between BALF and serum urea concentrations seems to be the most useful tool for this purpose. 1
This study presents a new simple, sensitive, and accurate micromethod for the assay of urea nitrogen in BALF. The method does not require any sample pretreatment or preanalytical procedure. Our results describe the accuracy of this technique, as the herein described method appeared very linear, precise, quick, and suitable for routine analysis as required in pediatric and neonatal critical care and research. Moreover, the microvolumes required by the method represent an ideal characteristic, as samples from neonates and infants are usually small.
Our results in a mixed population of neonates and infants affected by different respiratory conditions demonstrated that the type of lung injury does not influence the assay. Higher urea concentrations had been measured in severe asthma when capillary permeability is altered 17 ; however, urea levels were in the same range for all neonates, and CV does not change between groups of neonates. Thus, we can conclude that the most common neonatal respiratory conditions do not affect urea passage into the alveolar space and that the assay shows the same reliability in neonates with iRDS, IRRF, or normal lungs. Our standardized BAL procedure demonstrated that the use of urea assay is also reliable in slightly bigger infants.
Some authors hypothesized that urea might diffuse across the epithelium during the BAL procedure because of the epithelial damage produced by bronchoscopes.2,18 Nonbronchoscopic BAL is more rapid and less invasive; thus, this effect is unlikely to occur. It is important to use a standardized procedure and to perform it within a well-defined time range (about 2 min in our series), especially when aliquots coming from left and right lungs are recovered together in the same tube. Consistently, Grigg et al. did not show any difference between repeated aliquots, suggesting that significant diffusion of urea does not occur. 19
A main problem in this field is the absence of a gold-standard method to be referenced for the urea assay in BALF samples. However, the principles of our analytical method are well known, and we performed all tests needed by QC for analytical measurements, demonstrating the internal reliability of the assay. Even if the method was originally designed for urea assay in serum, our findings demonstrated that there is no matrix effect and that the assay is equally reliable when used to assay BALF samples.
We acknowledge some peculiarities and limitations of our study.
First, we performed this study in a small population of neonates and infants, where the nonbronchoscopic BAL is feasible with the described technique and aspiration circuit. Much smaller neonates are presently being admitted to neonatal intensive care units. The nonbronchoscopic BAL technique also is practically feasible in these babies. However, given the smaller recovery volume, a specific study should be performed to study accuracy of our assay in these conditions as well.
Second, our BALF samples have a mean recovery volume of about 50%, which is not completely ideal. However, difficulty in recovering higher volumes is well known if a bronchoscope is not used. The nonbronchoscopic technique is a compromise that allows performing BAL, avoiding bronchoscope use when this is not suitable or is dangerous. Our recovery percentage is above the threshold recommended by the European Respiratory Society to define an acceptable BALF sample. 1
Third, urea correction for BAL dilution requires a blood sampling contemporary to BAL procedure. Although the urea assay technique is accurate and simple, performing an additional blood sampling might be problematic in critical care settings, and blood urea should be analyzed with the same accuracy. However, no method to correct BAL dilution is perfect, and the described assay makes available the urea measurement for automatic analyzers commonly in use for blood urea analysis in hospital laboratories. This will make it somewhat easier to use the urea technique in daily practice.
In conclusion, our method may be used to correct concentration of various noncellular BAL components and calculate ELF in neonates and small infants.
Footnotes
Declaration of Conflicting Interests
The authors declared no potential conflicts of interest with respect to the research, authorship, and/or publication of this article.
Funding
The authors received no financial support for the research, authorship, and/or publication of this article.