
Abstract
This report describes technologies to identify and quantify microRNAs (miRNAs) as potential cancer biomarkers, using breast cancer as an example. Most breast cancer patients are not diagnosed until the disease has advanced to later stages, which decreases overall survival rates. Specific miRNAs are up- or downregulated in breast cancer patients at various stages, can be detected in plasma and serum, and have shown promising preliminary clinical sensitivity and specificity for early cancer diagnosis or staging. Nucleic acid testing methods to determine relative concentrations of selected miRNAs include reverse transcription, followed by quantitative PCR (RT-qPCR), microarrays, and next-generation sequencing (NGS). Of these methods, NGS is the most powerful approach for miRNA biomarker discovery, whereas RT-qPCR shows the most promise for eventual clinical diagnostic applications.
Introduction
Cancer patients have significantly better health outcomes if the initial diagnosis occurs early during disease progression, before the primary tumor has grown and metastasized.1,2 Signs and symptoms, however, may not present themselves early on. MicroRNA (miRNA) profiling shows potential in enabling early cancer detection, for example in breast cancer, which represents approximately one in three cancer diagnoses in the United States and is a leading cause of cancer-related deaths worldwide. 1 Early breast cancer detection is essential to improve treatment outcomes and decrease mortality rates ( Table 1 ).1–3 The American College of Radiology developed an algorithm for breast cancer screening and diagnosis ( Fig. 1 ), 4 which relies on breast examination, various imaging methods, and eventual confirmation of abnormal imaging results via histological examination of a biopsy tissue sample. 3 However, mammograms and ultrasound imaging have limited sensitivity and specificity, which leads to many missed cases and also many unnecessary referrals for biopsy evaluation.3,4 Once malignancy is confirmed based on biopsy results, breast cancer treatment consists of breast-conserving or radical mastectomy, radiation therapy, or chemotherapy. 5 Less invasive treatment is possible if breast cancer is detected before the tumor has grown in size and spread beyond the breast.
Breast Cancer Staging and Survival Rates.
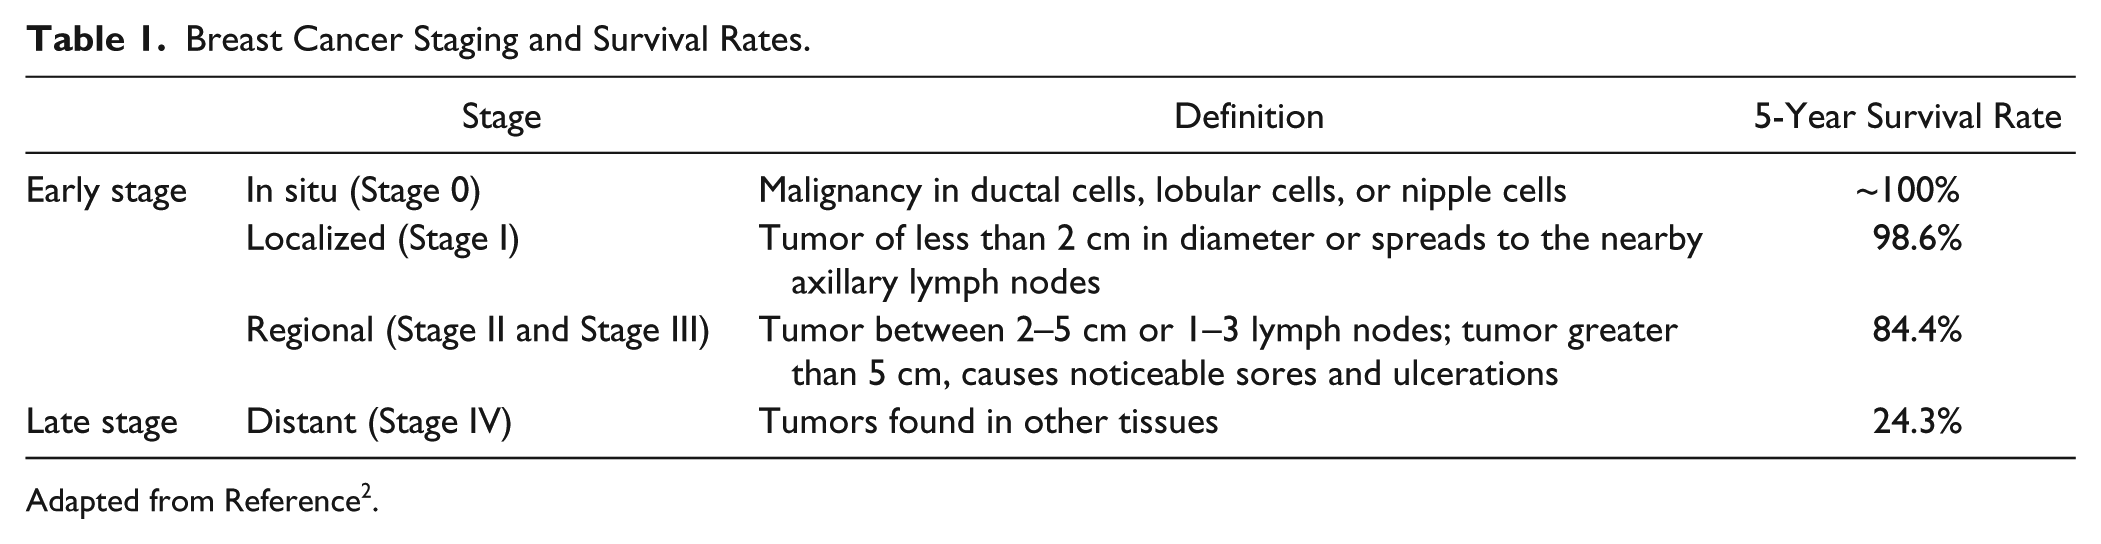
Adapted from Reference 2 .
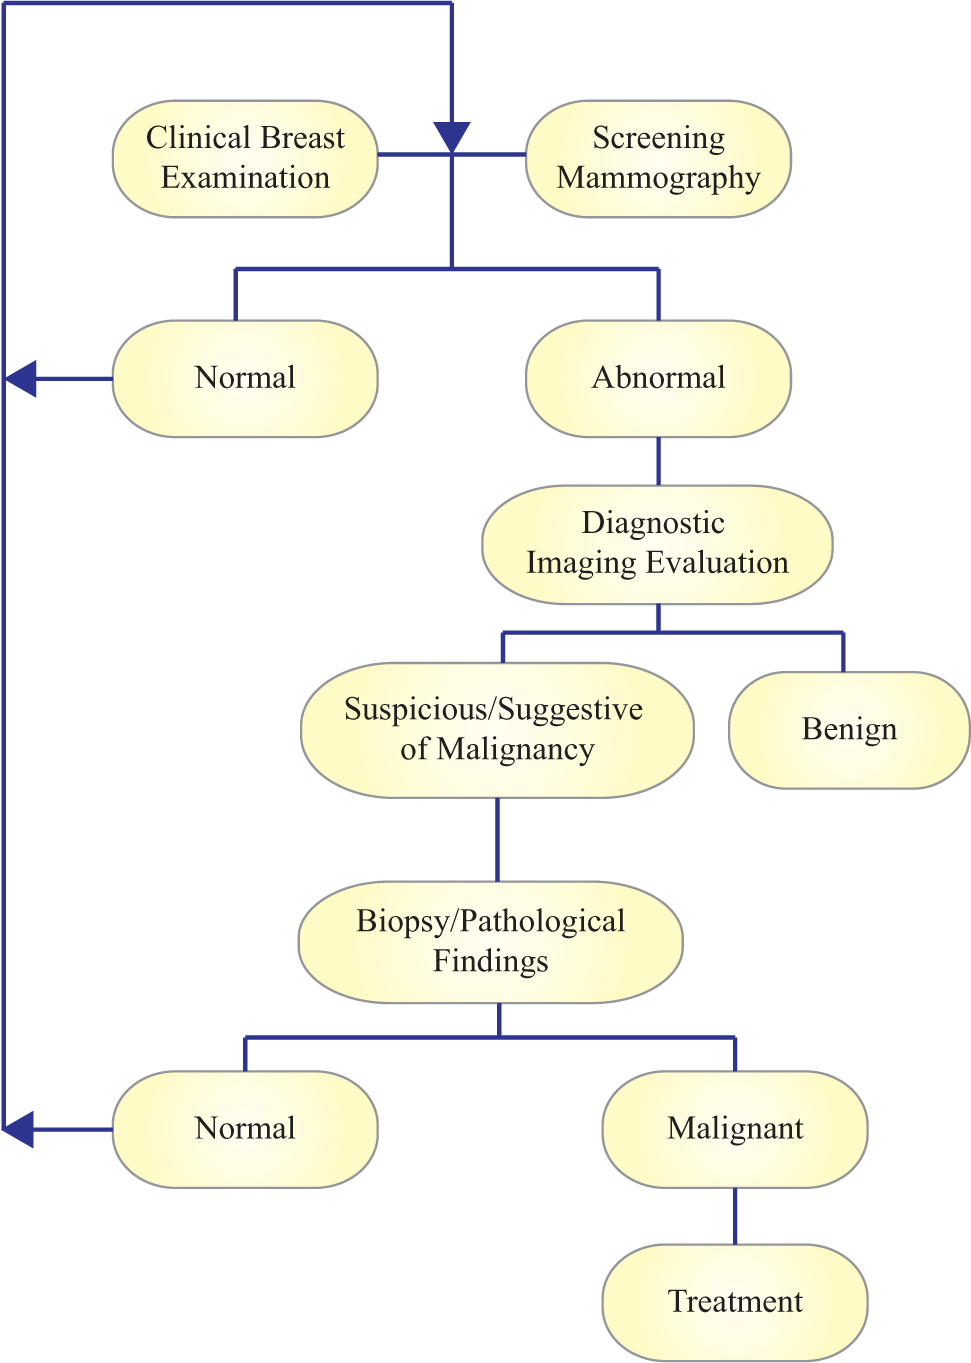
Clinical breast cancer evaluation. Adapted from Ref. 119 . Abnormalities detected during routine clinical breast examination and screening mammography are followed up with diagnostic imaging evaluation, which may entail a combination of mammography, ultrasound imaging, and/or magnetic resonance imaging. Patients with possible malignancies are referred for tissue biopsy or fine-needle aspiration, and pathological confirmation of breast cancer diagnosis.
On a macroscopic level, breast cancer develops according to five stages (0–IV). 5 In the initial Stage 0, small malignancies develop in the ductal, lobular, or nipple cells. During Stages I–III, the cancer grows in size and spreads to the lymphatic system. In Stage IV, the cancer has metastasized to distal sites. Microscopically, breast cancer progression is described by 3 distinct phases: initiation, progression, and metastasis. Breast cancer initiation can occur in many pathways within a somatic cell, typically as a result of genetic damage. Breast tumor initiation cells (BT-ICs) obtain self-renewing capabilities, then act as “cancer stem cells” as the foundation for tumor development.6,7 During cancer progression, BT-ICs begin producing other differentiated cancer cells, which begin to grow rapidly, and avoid apoptosis. Cancer metastasis occurs when cells dissociate from the primary tumor, enter the bloodstream, and spread to distal tissues and organs. Cancer metastasis is associated with the epithelial-mesenchymal transition (EMT), wherein epithelial cells de-differentiate into cells with stem cell–like properties. 8
miRNA Overview
Recent studies have shown that miRNAs, a class of small noncoding RNA molecules, regulate gene expression. 9 miRNAs are encoded in the introns of protein-coding genes of the host genome. A primary miRNA (pri-miRNA) is formed during transcription, 10 and then converted into precursor miRNA (pre-miRNA), which has a folded hairpin loop structure and is ~70 nucleotides in length. The pre-miRNA is transferred into the cytoplasm and then further processed into a mature single-stranded miRNA approximately 20–22 nucleotides in length. This single-stranded miRNA is then incorporated into the RNA-induced silencing complex (RISC), 10 which targets mRNAs that are completely or partially complementary to the miRNA.11,12 Complete complementarity leads to mRNA degradation, whereas partial complementarity causes suppression of protein translation. 13
Therefore, miRNAs play important roles in controlling cellular functions, including cell differentiation, proliferation, and apoptosis. 14 Certain tumor-associated miRNAs are expressed by fragile chromosomal and cancer-associated regions, which exhibit DNA amplification, deletions, or translocation during tumor development. 15 These variably regulated miRNAs are expressed at distinguishable concentrations in cancer patients compared to normal patients, during specific cancer phases, or throughout cancer development. 16 Therefore, miRNA expression can potentially be used for early cancer diagnosis, or for cancer staging and prognosis. 17
miRNAs can be detected outside of tumor cells in the bloodstream. 18 These circulating cell-free miRNAs appear to be incorporated in microvesicles called exosomes, or they are bound to proteins. This protects the miRNAs from being degraded by RNases that are present in blood, leading to a surprisingly long half-life of approximately 5 days in plasma. 19 Circulating miRNAs are a promising new class of cancer biomarkers that may facilitate early minimally invasive breast cancer diagnosis, because blood can be acquired much less invasively than biopsy tissue. miRNAs can also enable tumor staging and prognosis.18,20
Role of miRNAs in Breast Cancer
Different circulating miRNAs, such as miRNAs 21, 30a, 145, 155, 195, 200b, and 200c, have been investigated as biomarkers to diagnose or stage breast cancer patients ( Table 2 ). These miRNAs regulate pathways involved in the initiation, progression, and metastasis of breast cancer.
Selected miRNAs as Potential Breast Cancer Biomarkers.
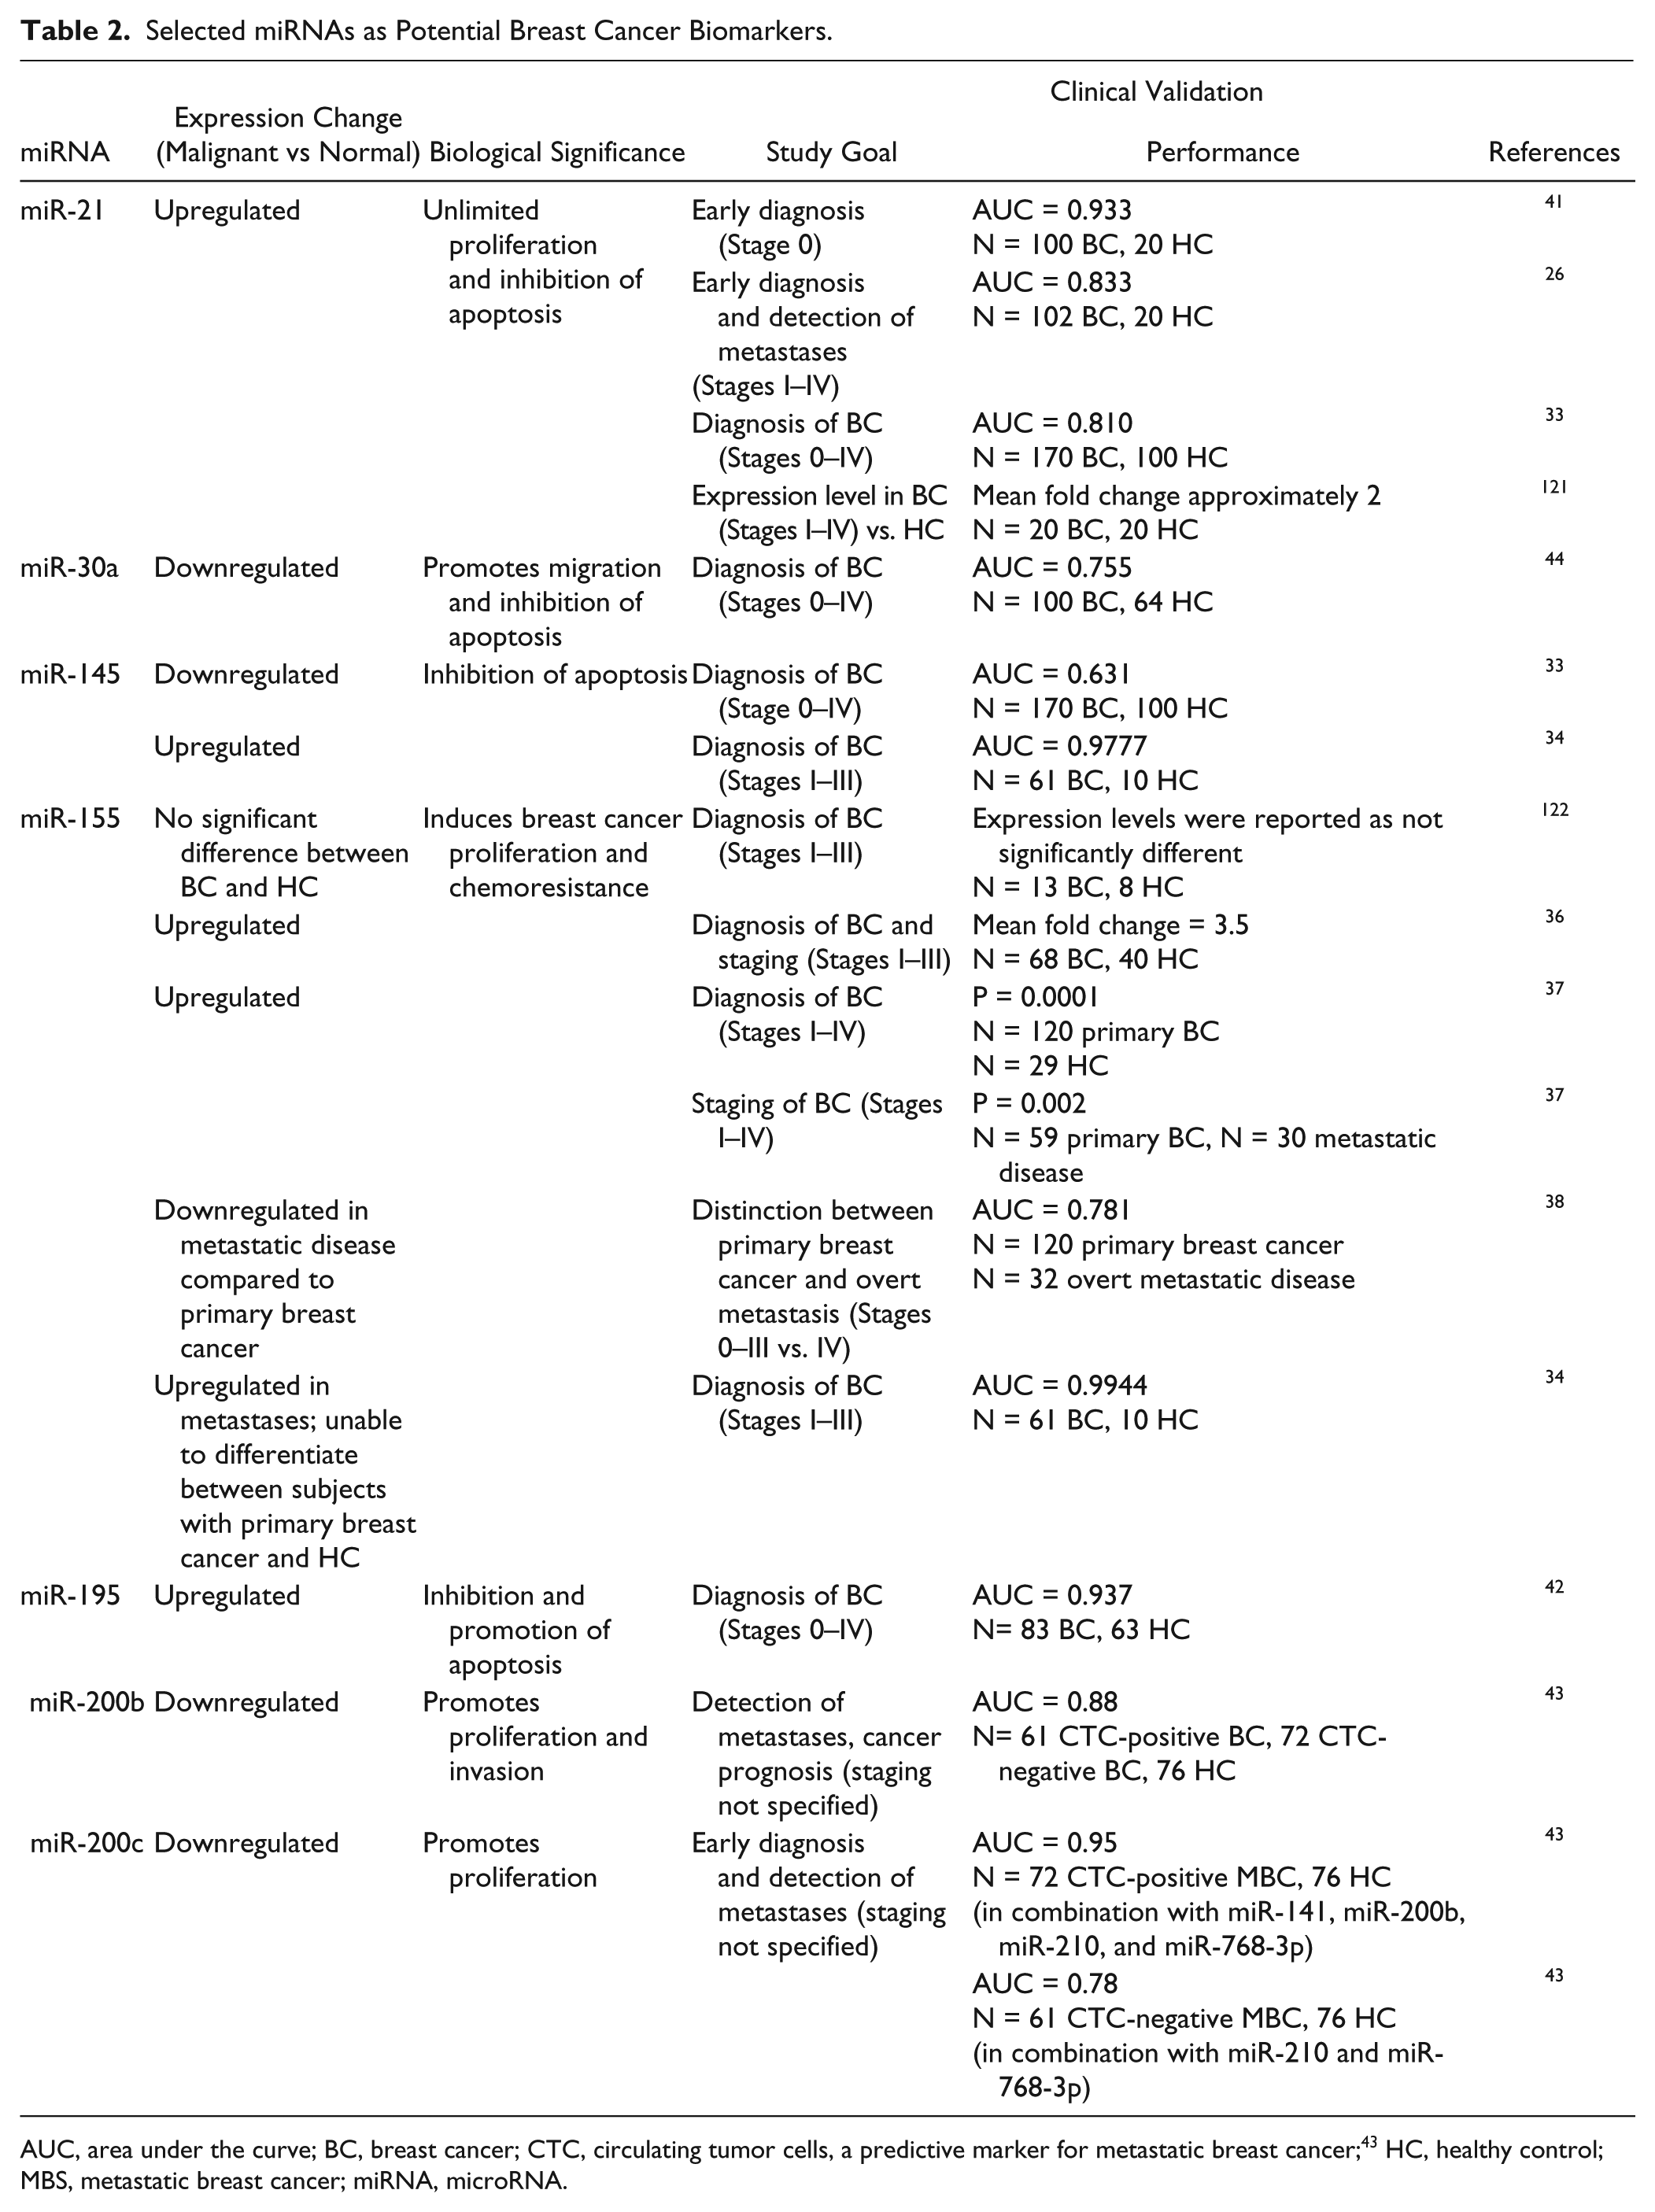
AUC, area under the curve; BC, breast cancer; CTC, circulating tumor cells, a predictive marker for metastatic breast cancer; 43 HC, healthy control; MBS, metastatic breast cancer; miRNA, microRNA.
miR-30, miR-200b, and miR-200c appear to be downregulated during breast cancer initiation and progression, meaning these miRNAs act as oncosuppressors. miR-30 inhibits expression of ubiquitin-conjugating enzyme 9 (Ubc9), thereby indirectly preventing pluripotency and cell renewal. 16 Furthermore, miR-30 represses integrin β3 (ITGβ3), which mediates apoptosis based on environmental cues.21,22 miR-200c strongly suppresses expression of Bmi-1, 23 a downstream product of the Hedgehog pathway (HH) that induces cell growth and replication in a stem cell–like fashion.23,24 miR-200b, and the miR-200 family in general, regulates the EMT, which is involved in initiation of cancer metastasis. 25
In contrast, miR-21 is one of the most significantly overexpressed miRNAs in breast carcinoma and plays a role in all phases of tumorigenesis. 16 miR-21 represses the oncosuppressor genes programmed cell death 4 (PDCD4), tropomyosin 1 (TPM1), and phosphatase and tensin homolog (PTEN),26,27 which induces EMT, 28 promotes breast cancer metastasis, 29 and leads to cell proliferation. miR-21 also regulates other genes, leading to increased breast cancer invasion 30 and promoting tumorigenesis. 16 However, miR-21 is not likely to be breast cancer specific, because it has been associated with a variety of cancer types.16,31
The differential expression levels of other miRNAs appear to be more variable and dependent on cancer stage, sometimes with conflicting results observed in cell culture, tissue samples, or blood. For example, miR-145 is downregulated in cancer cells in vitro, 32 but one clinical study reported decreased miR-145 levels in the plasma of breast cancer subjects, 33 whereas another study reported upregulation of miR-145 in the serum of primary breast cancer subjects. 34 As another example, upregulation of miR-155 in vitro has been shown to suppress FOXO3a and its downstream targets, which results in increased cancer cell survival and drug resistance. 35 Whereas several clinical studies have demonstrated upregulation of miR-155 in breast cancer patients,36,37 downregulation of miR-155 has been observed in metastatic breast cancer patients in at least one study. 38 Likewise, miR-195 appears to be upregulated in unclotted whole blood samples from breast cancer subjects, 39 but it is downregulated in breast cancer tissue and cell lines. 40 Some of these discrepancies may be due to changes in DNA methylation during disease progression,37,38 which may play a role in tumorigenesis by miRNA dysregulation. 40
In many clinical validation studies ( Table 2 ), the clinical utility of potential miRNA biomarkers is assessed based on the area under the curve (AUC) of the receiver-operator characteristic (ROC) curve ( Fig. 2 ), with an AUC = 1 for an ideal assay and an AUC = 0.5 for a random result. The attainable clinical sensitivity and specificity as a function of threshold levels can also be derived from the ROC curves.
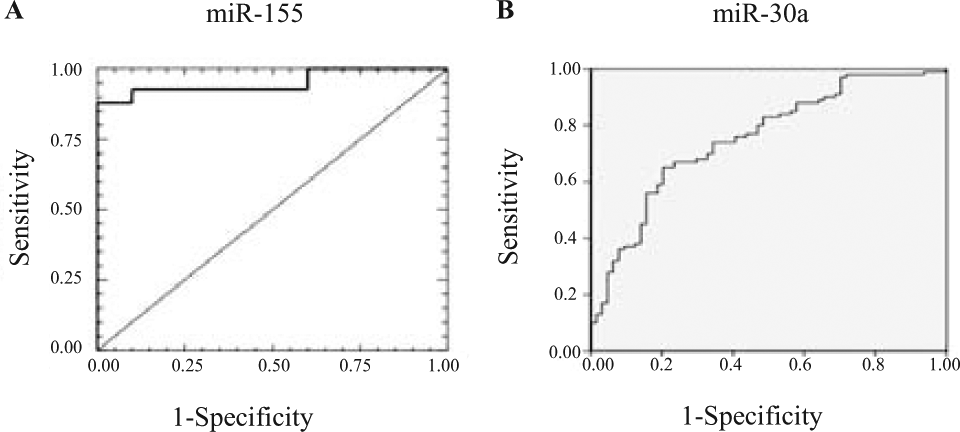
Receiver-operator characteristic (ROC) curve for miR-155 and miR-30a. (
Many miRNAs have been identified as potential breast cancer biomarkers,26,33,41–44 including the ones discussed herein. Currently, it appears that assessing the differential expression of a small panel of miRNAs will provide a better predictive value for early-stage diagnosis and prognosis compared to profiling single miRNAs. 45 Furthermore, the majority of clinical studies reported to date have included a relatively small number of cases and controls. Much larger, prospective studies need to be performed to unequivocally establish the clinical sensitivities and specificities of promising miRNAs as valid breast cancer biomarkers. Biomarker validation is further complicated by the often observed lack of consensus among various studies with respect to the relative expression-level changes for the same miRNA. These conflicting reports may be attributed to differences in study design, the number of subjects, and the inclusion of different subtypes of breast cancer, as well as disproportionate representation of certain breast cancer stages. In addition, such observed variability may be caused by inconsistencies in sample preparation, and differences in the technology platforms used to measure the relative expression-level changes. Therefore, it is important to also scrutinize the technical aspects of miRNA biomarker discovery and validation.
Technical Product Analysis
In the past decade, several technologies have emerged to quantify miRNA expression, including reverse transcription followed by quantitative real-time PCR (RT-qPCR), microarrays, and next-generation DNA sequencing (NGS). These technologies have been adapted to address inherent challenges related to miRNA quantification due to their short length and high GC content. RNA isolation from plasma, serum, or other biological specimens is the first step required for any of these three techniques.
RNA Isolation Techniques
The chosen total RNA extraction method can have a downstream effect on the results obtained from miRNA profiling. Commercial kits for miRNA extraction include the mirVana miRNA Isolation Kit (Ambion, Austin, TX),46–48 the PureLinkTM miRNA Isolation Kit (Ambion), 49 a Microcon YM-100, 49 and the miRNeasy Mini Kit (Qiagen, Venlo, the Netherlands). 50 Various other protocols for RNA extraction have been reviewed, but there is a general consensus that none of these methods appears to outperform the others. 51
MicroRNAs are enriched and isolated from other larger RNA species present in the sample by molecular weight fractionation. The miRNeasy kit (Qiagen) uses two glass-fiber filter spin columns; the first is to immobilize total RNA, and a second is for miRNA enrichment. RNase-free DNase may be added to remove any contaminating DNA. 33 For microarrays, miRNA enrichment can also be performed with ion-pair reverse-phase chromatography and conventional denaturing polyacrylamide gel electrophoresis (PAGE). 52
Quality Assessment
Given that the quality of the total RNA strongly affects the miRNA expression analysis, quality control is a critical step, especially before profiling miRNAs on microarray or sequencing platforms. Quality control of total RNA, as measured by a high RNA integrity number (RIN), can be performed via microfluidic capillary electrophoresis on an Agilent Techno-logies 2100 Bioanalyzer (Agilent, Santa Clara, CA). 53 The RNA integrity number serves as a proxy to assess the degree of RNA degradation (e.g., due to RNase digestion). RNA samples with RINs greater than 8 out of 10 are suitable for library construction. 54 Although fresh biopsy samples and cell lines typically yield high-quality miRNA, this is not the case with miRNA derived from plasma, 55 or from formalin-fixed paraffin-embedded tissue.56,57 To assess the quality of plasma-derived miRNA, exogenous synthetic miRNAs can be spiked into the sample prior to extraction and then measured in the purified RNA. 58 General guidelines to verify the quality of RNA extraction from plasma have yet to be established. 59
Reverse Transcription and Quantitative PCR (RT-qPCR)
Many commercial kits are available for RT-qPCR analysis of miRNAs, such as Life Technologies’ Taqman miRNA Assay (Life Technologies, Carlsbad, CA),60,61 Exiqon’s miRCURY LNA Universal RT microRNA PCR (Exiqon, Vedbaek, Denmark), 61 and Invitrogen’s NCode miRNA qRT-PCR System (Invitrogen, Waltham, MA). 48
MicroRNA expression analysis via RT-qPCR can be accomplished by the poly(A) tail and the stem-loop RT primer methods (
Figs. 3
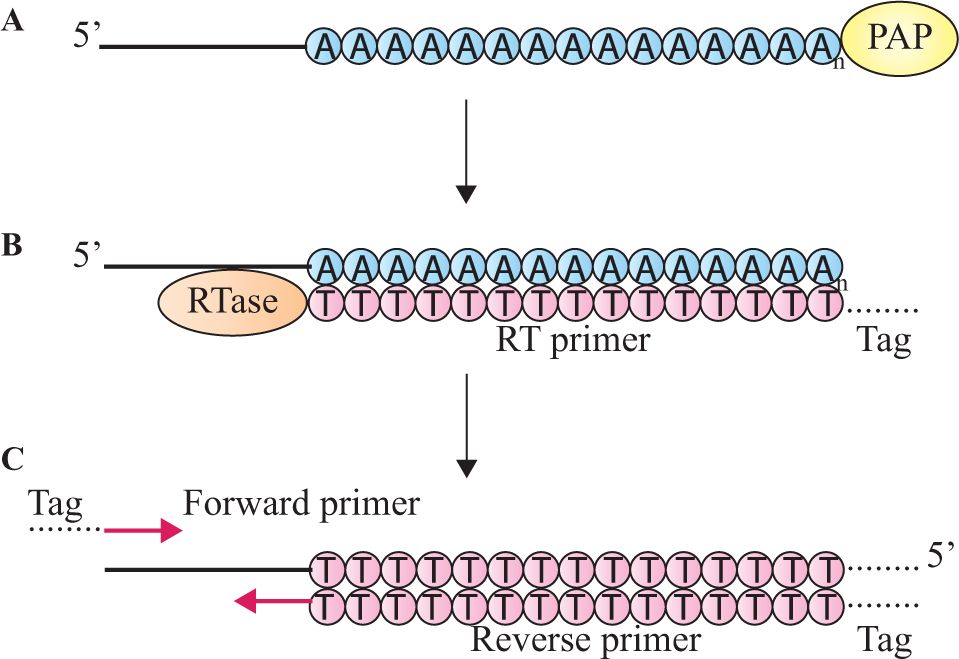
Schematic of the poly(A) tail quantitative PCR (qPCR) method for microRNA (miRNA) quantification. (
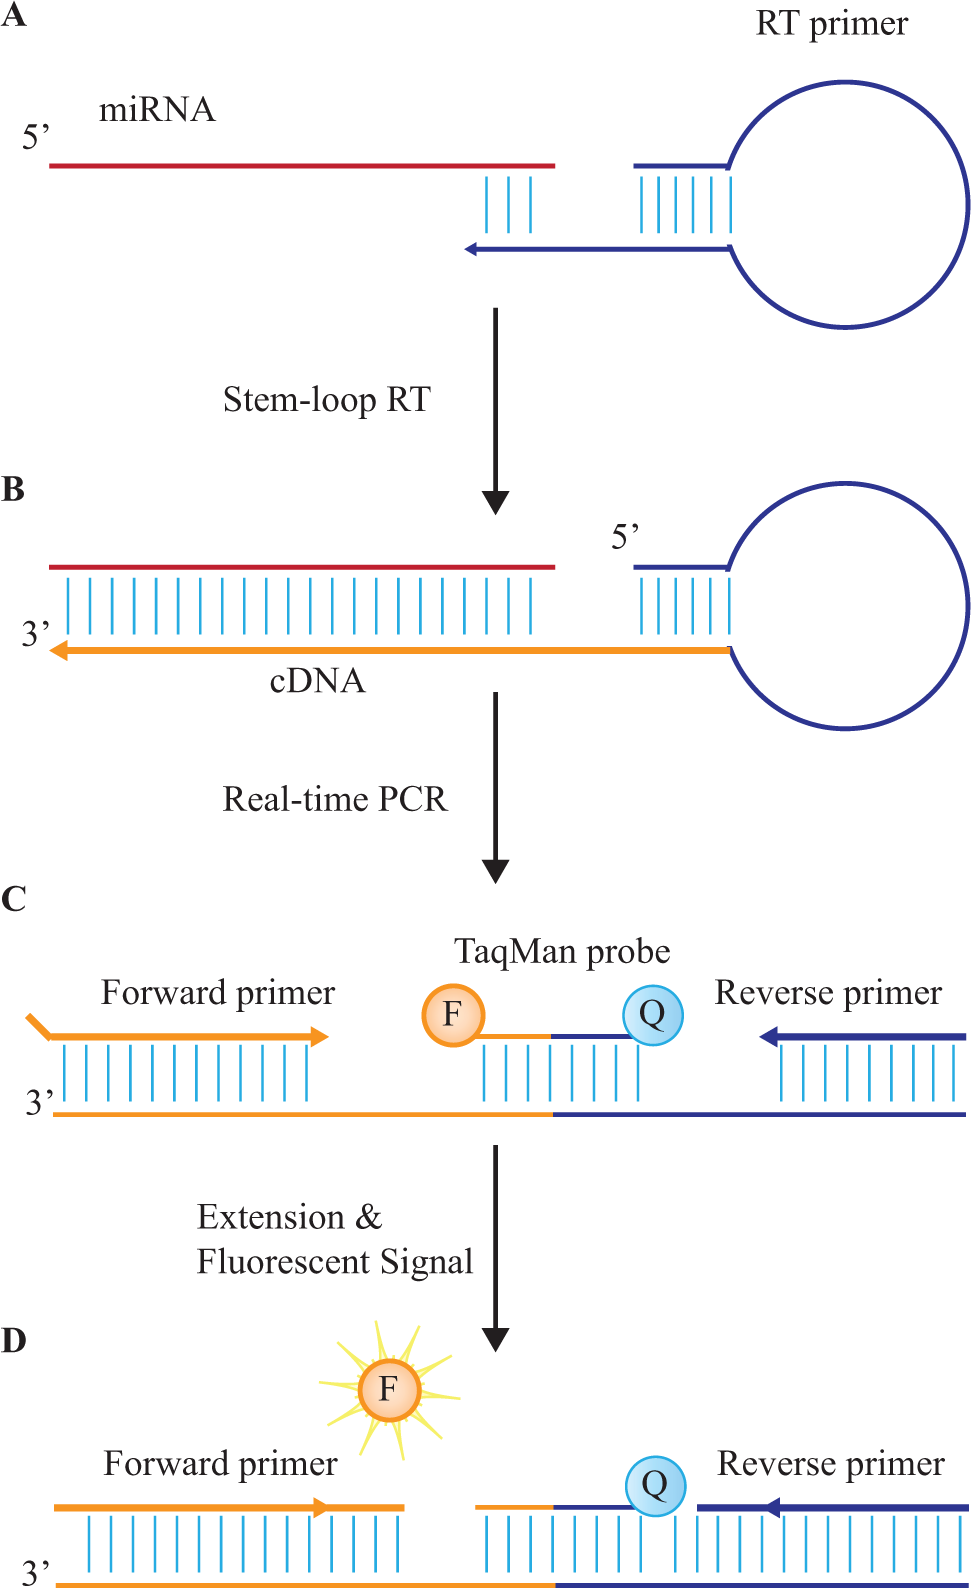
Schematic of stem-loop microRNA (miRNA) quantification. (
The poly(A) tail method involves enzymatic polyadenylation to extend all RNAs, before reverse transcription with a universal RT primer, resulting in cDNA synthesis from all RNA strands present in the sample ( Fig. 3 ).48,63 Next, PCR amplification proceeds using a miRNA-specific forward primer and a universal reverse primer complementary to the 5′ end of the RT primer, 62 with real-time detection based on intercalating dyes. This approach results in a high quantification yield and increased sensitivity.64,65 However, nonspecific RNA strand complements may be produced during RT, decreasing specificity. 48
The stem-loop RT primer method is direct, without polyadenylation prior to reverse transcription. 48 The specific primers and probes avoid nontarget amplification. RT is performed using miRNA-specific stem-loop RT primers that both stabilize and lengthen the miRNA ( Fig. 4 ). 63 A miRNA-specific forward primer then initiates qPCR amplification, with real-time fluorescence detection mediated via Taqman probes.60,63 This stem-loop primer method prevents nonspecific amplification and increases specificity. 60
miRNA quantification via RT-qPCR is based on the comparative threshold cycle (Ct), which is the cycle number at which the fluorescence measurement in the real-time amplification curve passes a fixed fluorescent threshold amount.60,66 Synthetic miRNA spikes, and/or endogenous miRNA of high abundance, may serve as the positive control and quantification standard.61,67 Although endogenous controls have the advantage of exhibiting natural physiochemical properties during quantification, they may not be suitable as internal controls. Synthetic miRNA spikes, derived from Arabidopsis for instance, may be more suitable because they do not display homology with human miRNAs. 67 miRNAs in the sample can be quantified using a standard curve, obtained by plotting the log of known standard concentrations against their Ct value. However, such external standard curves do not account for sample-to-sample variability in extraction and amplification efficiency. Therefore, relative changes in miRNA expression can be derived by comparing the Ct value of the target miRNA to the Ct value of the positive control and quantification standard, using the 2-ΔΔCt method. 68
RT-qPCR using the poly-A tail method, with detection based on dye intercalation, can only be performed as singleplex assays. In contrast, the stem-loop method with detection via fluorescently labeled probe oligonucleotides enables low levels of multiplexing within the same reaction. In either case, determining expression-level changes for large panels of miRNAs requires hundreds of individual RT-qPCR reactions per sample. For example, the miRCURY human miRNome panel entails two 384-well plates for analysis of 742 different miRNAs, with one replicate each, plus reference genes, calibrators, and controls. 69 In general, RT-qPCR has high analytical sensitivity, requiring <500 ng extracted RNA. However, this sensitivity is decreased by splitting the sample among a large number of RT-qPCR reactions. Higher levels of multiplexing can be achieved via microarrays or NGS. This can overcome issues of limited RNA quantities for profiling differential expression of large numbers of miRNAs. 70
Microarray-Based miRNA Expression Analysis
Microarrays specifically optimized for miRNA quantification include several platforms commercialized by Affymetrix, Agilent, Exiqon, and Life Technologies. Some of these microarray platforms target a subset of several hundred miRNAs, whereas others provide a high-throughput format that enables genome-wide profiling of thousands of validated mature miRNAs. 71
miRNAs extracted from the sample are fluorescently labeled, and then hybridized to an array containing thousands of complementary miRNA-specific oligonucleotide probes immobilized on discrete sites of a solid surface. The array is then subjected to multiple stringency wash steps to remove undesired, nonspecifically bound sequences, followed by imaging and data analysis. Microarrays can use either a two-color or one-color detection approach. A one-color approach entails labeling miRNAs from breast cancer and healthy controls with the same fluorophore, and then hybridizing the cDNA onto two separate arrays. One-color arrays include the Affymetrix GeneChip (Affymetrix, Santa Clara, CA), the Illumina BeadChip (San Diego, CA), Agilent single-channel arrays, Applied Microarrays CodeLink arrays (Applied Microarrays, Tempe, AZ), the Eppendorf DualChip and Silverquant (Eppendorf, Hamburg, Germany), and the miRCURY LNA miRNA array platform (Exiqon). Alter-natively, miRNAs extracted from breast cancer and healthy controls can be labeled with two different fluorophores (e.g., Cy3 and Cy5), combined, and then hybridized to the same microarray. Two-color arrays include Agilent’s Dual-Mode platform and Eppendorf’s DualChip platform for colorimetric Silverquant labeling. The general workflow for two-color microarray-based miRNA quantification is illustrated in Figure 5 .
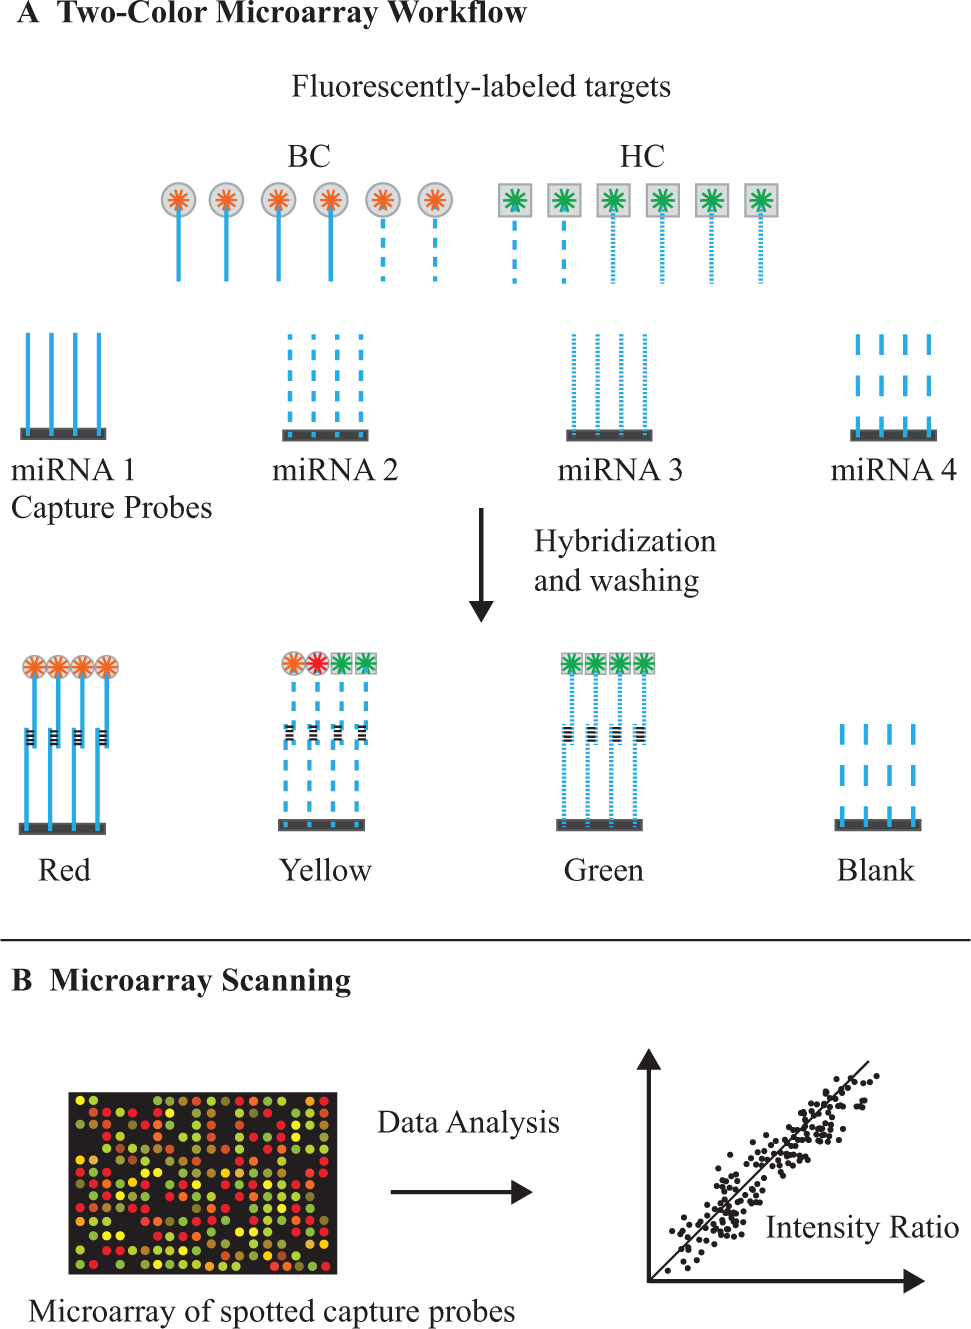
MicroRNA (miRNA) expression analysis using microarrays. (
Various fluorescent labeling techniques have been developed, with the goal of achieving high labeling yield to attain a good signal to noise, while avoiding labeling bias that can compromise the results. Fluorescent labeling can be accomplished either by direct labeling of the miRNA or by indirect labeling of a cDNA obtained from the miRNA through reverse transcription ( Fig. 6 ). For direct labeling, T4 RNA ligase can be used to directly add a fluorescent-modified nucleotide on the terminal 3′-OH of the miRNA. An alternative direct enzymatic-labeling approach involves the 3′ tailing of the miRNA [e.g., with poly(A)], followed by splinted ligation to a fluorescently labeled oligonucleotide (e.g., Invitrogen NCode).72,73 Given that direct enzymatic-labeling methods can introduce substrate sequence bias, 74 direct chemical-labeling approaches have been developed that include chemical alkylation (Mirus Bio Label IT, Mirus Bio, Madison, WI) and platinum coordination chemistries [Kreatech Universal Linkage System (ULS), Amsterdam, the Netherlands].
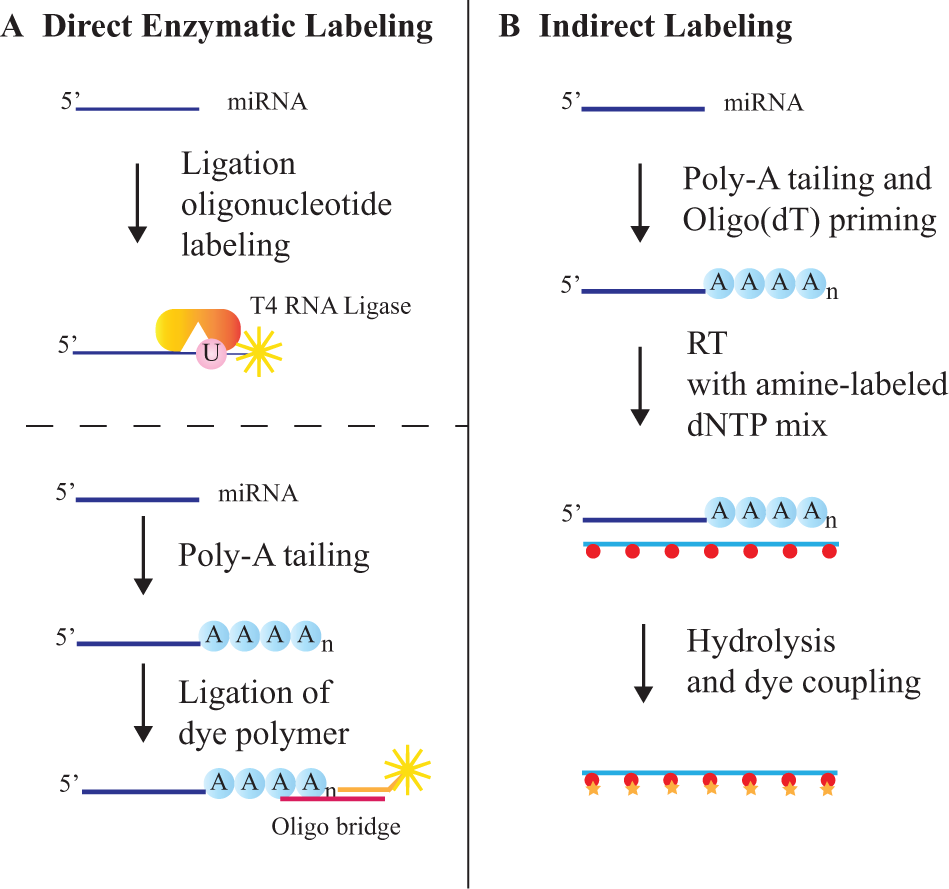
MicroRNA (miRNA) labeling methods. (
Indirect labeling requires reverse transcription of miRNAs, which can be accomplished using random primers. However, the use of a random primer provides poor specificity and can introduce errors. 75 Alternatively, a poly(A) tail can be added to the 3′ end of the miRNAs, followed by priming with a poly(dT) primer. Fluorescent labeling of the cDNA can be accomplished by incorporating fluorophore-conjugated deoxynucleotide triphosphates (dNTPs) during the RT reaction. 76 Alternatively, primary amine–containing dNTPs can be incorporated during cDNA synthesis, and the cDNA products can be conjugated to fluorophores via amide bond formation, using an N-hydroxysuccinimide ester. A major advantage of this two-step approach is that more amino-modified nucleotides can be incorporated into each miRNA, which enhances the detection sensitivity. 75 The cDNA products, which serve as surrogate markers for the RNA, are purified and hybridized to the microarray.
The majority of commercially available microarrays probe a predefined set of miRNAs. Agilent offers customizable arrays that can be tailored to interrogate a user-defined set of miRNAs, whereas for other platforms, the fabrication process makes customization less feasible and more expensive. 70 Custom arrays that encompass a lower number of potential miRNA biomarkers may be more suitable for biomarker validation using a larger set of clinical samples. Likewise, targeted microarrays are being used as detection methods in several US Food and Drug Administration (FDA)-cleared in vitro diagnostic platforms.77–80
Furthermore, custom arrays enable probe optimization to ameliorate some of the limitations inherent in hybridization microarrays with respect to sensitivity and specificity. Ideal capture probes for miRNA microarrays are highly specific synthetic oligonucleotides or cDNA fragments of high affinity. Capture probes with lower than average guanine–cytosine (GC) content and melting temperature (TM) values will yield lower fluorescent signals, whereas capture probes with higher GC content and TM values will display higher signals but impaired nucleotide discrimination and thus lower specificity. 81 To resolve these issues, locked nucleic acid (LNA)-modified capture probes can be used to improve overall duplex stability (Exiqon). LNAs are a class of RNA analogues that create increased thermal stability relative to DNA when they are complexed with complementary DNA or RNA. 82 They are considered “locked” because the 2′ oxygen and the 4′ carbon positions in the ribose ring are connected. The increase in thermal stability allows for shorter PCR primers and enables the design of two miRNA-specific PCR primers per miRNA. LNA probes can also distinguish between highly similar sequences, such as when profiling miRNAs within the same family. 83
Further technical considerations for probe design include the use of hairpin structures attached to the 5′ end of the probe to differentiate the target miRNA from nontarget RNA containing the same sequence (e.g., pre- and pri-miRNA). The hairpin structure is incorporated onto the 5′ end of the probe and directly abuts the 3′ end of the hybridizing sequence. The hairpin destabilizes hybridization to larger nontarget RNAs, and it can provide additional stabilization if the target–probe duplex stacks with the probe hairpin. 81 Overall, the physicochemical characteristics of the target sequences help determine the specificity and sensitivity of the microarray.
A scanner generates the fluorescence intensity values at the different array spots, which identify the miRNAs and their relative quantities ( Fig. 6 ). Microarray data must be background corrected and normalized using a variety of control probes as reference points. This removes bias attributed to differences in dye labeling, hybridization, and scanning. 84 Controls must be included in different processing steps to discern miscellaneous variations from biologically relevant alterations. Control probes facilitate cross-platform comparisons of miRNA expression, and enable robust meta-analyses in miRNA expression studies. Retesting and averaging the intensity values for data analysis validate the results of microarray-based miRNA expression analysis, increase the sensitivity and specificity, and minimize contamination bias (e.g., scratches and dust). 85 After normalization, the log2 ratios between sample and reference miRNAs are calculated. Subsequent analysis of the miRNA expression profile identifies significant differential expression through gene clustering.
Most microarrays require approximately 100–1000 ng RNA extract as starting material,81,86 which may be an issue if only a limited amount of biological material is available. For example, it has been reported that the GeneChip miRNA 2.0 Array platform from Affymetrix was not reliable at a low input level, corresponding to the amount of miRNAs that can be recovered from a 250 µl aliquot of plasma. 87
Next-Generation Sequencing
Next-generation sequencing (NGS) technologies have greatly increased the amount of sequence output per run, lowered costs, and improved computational accuracy, compared to traditional Sanger sequencing. 88 NGS platforms developed by Roche, Illumina, and Life Technologies 55 use in vitro clonal fragment amplification via PCR, which significantly simplifies the preparation of sequencing libraries. These platforms can accommodate millions to billions of individual reads per run, which is a vast improvement over the 96 reads that can be sequenced on a high-end Sanger system.
The sequencing coverage refers to the average number of times a nucleotide is read during the sequencing process. For example, a human genome sequenced at 30× coverage implies that each base, on average, is present in 30 distinct sequence reads. In miRNA sequencing (miRNA-seq), the number of reads obtained per miRNA directly correlates with the abundance of the miRNA in the sample, which is linked to its relative expression level. Therefore, the coverage in miRNA-seq is expressed as millions of sequence reads obtained for the sample. The number of reads required depends on how sensitive the experiment needs to be for detection of low-abundance miRNAs. It is estimated that a minimum depth of 200 million paired-end reads is required for the discovery of novel transcribed elements, and to obtain strong quantification of known transcript isoforms in human samples. 89 Achieving ultra-deep sequencing enables the identification of mutations in miRNAs, such as inversions, deletions, and translocations, 82 even if these occur in only a small fraction of the sample. Such mutational events often occur in molecularly heterogeneous tumors, which is the case in breast cancer. 90 However, such high coverage incurs significant costs per sample, which has led many investigators to consider profiling miRNAs at a lower number of reads per sample.91–93 Five million reads per sample have been considered sufficient to provide the statistical power necessary for differential expression analysis and to achieve a high discovery rate of novel miRNAs. 94
Sample preparation for miRNA-seq ( Fig. 7 ) typically begins with total RNA extraction, followed by size fractionation (e.g., through PAGE) to enrich RNAs between 17 and 25 nucleotides in length. Nearly all commonly used sequencing technologies require DNA libraries; therefore, RNA must be converted into cDNA. RNA adaptors are ligated to the 5′ and 3′ ends of the isolated small RNAs, which function as primer-binding sites during reverse transcription and PCR amplification,95–97 and are also important during the subsequent sequencing run. Alternatively, size selection can be performed after the adapter ligation and reverse transcription steps. 98 The workflow for sample preparation requires a minimum of 4 days to complete. 99
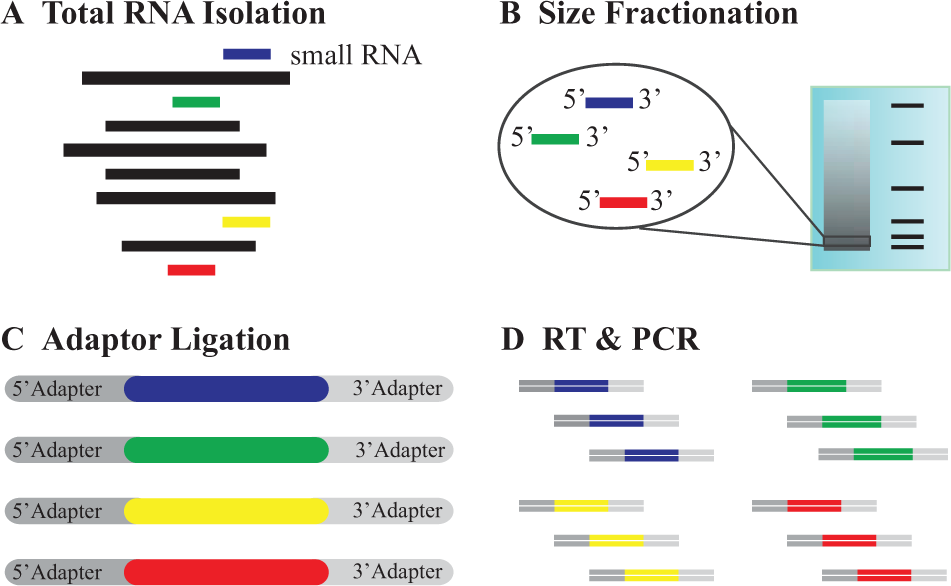
MicroRNA library preparation for sequencing. (
Once the library has been generated, these cDNA amplicons are sequenced, using NGS platform-specific methods. For the Illumina NGS analyzers, the cDNA library is denatured into single strands, which then anneal to complementary oligonucleotides that are pre-bound to a glass surface within a flow cell ( Fig. 8 ). Following polymerase extension and denaturation, this results in linearized single-stranded cDNA copies covalently attached to the surface. Next, clusters of identical cDNA molecules are generated via bridge amplification inside the fluidic channels. One adapter sequence is then cleaved, leaving clusters of single-stranded templates of the sense strand that are ready for sequencing. The sequencing method relies on polymerase-mediated incorporation of fluorescence-labeled nucleotides, termed reversible dye terminators. These nucleotides are chemically blocked at the 3′ hydroxyl position such that only one nucleotide incorporation event occurs per fragment population per sequencing cycle. 46 These incorporation events are detected via a fluorescence signal that identifies the specific base that has been incorporated. The fluorescent dye and 3′ blocking group are then chemically cleaved, and the cycle is repeated to interrogate the next nucleotide base.
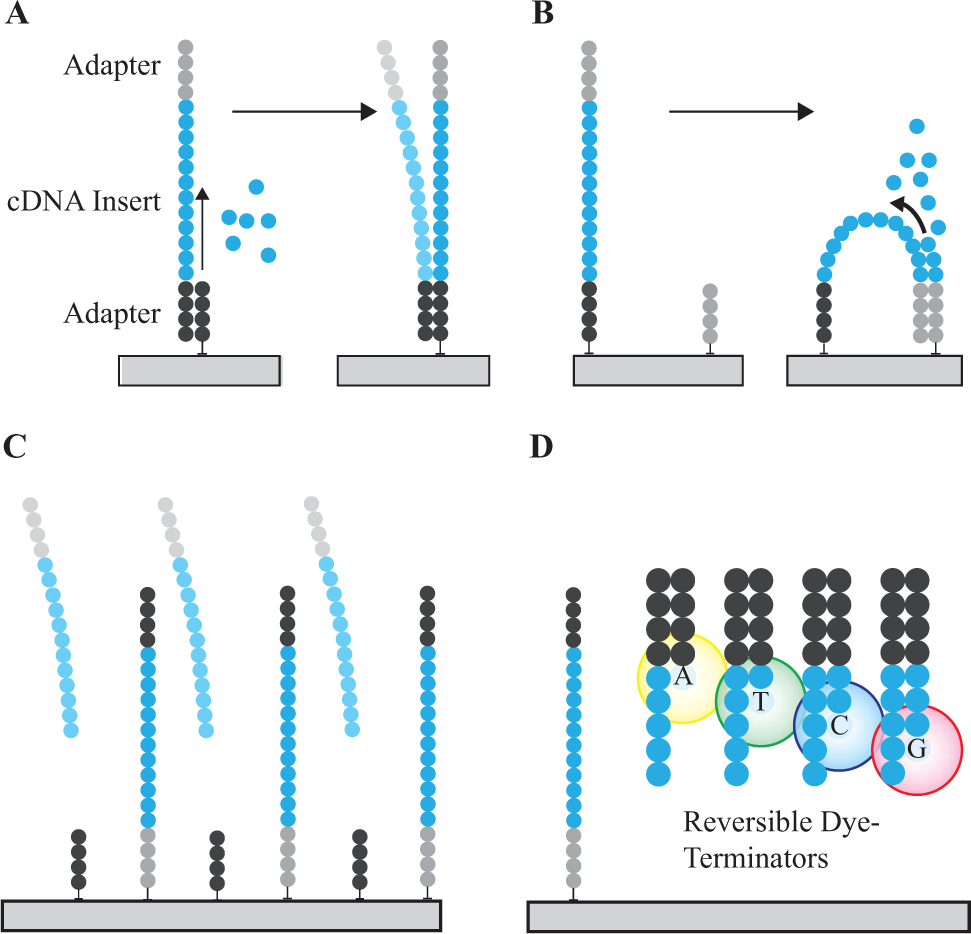
Illumina sequencing process overview. (
miRNA-Seq data analysis and interpretation begin with pre-processing of the short reads to remove adapters and low-quality sequences. 100 The resulting reads are then mapped onto a genome reference sequence using a miRNA sequencing software tool such as miRDeep, mirTools, or MIReNA. 101 For miRNA-seq, miRNA quantification is expressed as the number of sequence reads for a given miRNA relative to the total number of reads mapped to the genome or to known miRNAs obtained from the sample.82,102 However, there is a need for improvement and general consensus between investigators to improve normalization of sequence reads. Because relative miRNA quantification is dependent on the size of the library, differences in library preparation (e.g., due to inconsistencies in sample preparation) can result in different miRNA abundance measured from samples derived from the same patient.
Technology Comparison
Different miRNA profiling methods vary in terms of the attainable throughput, accuracy, sensitivity and dynamic range, cost, and complexity ( Table 3 ). Throughput entails two different aspects: how many miRNAs can be readily analyzed per sample, and how many different samples can be readily analyzed in a single run. MicroRNA profiling via microarrays or NGS offers high-throughput with respect to assaying the expression levels of hundreds to thousands of miRNAs or miRNA variants in a single experiment, 55 which is especially useful in early biomarker discovery efforts. NGS further enables detection of novel miRNAs and the precise identification of miRNA sequences. RT-qPCR panels such as the miRCURY platform enable quantification of hundreds of miRNAs, but in a large number of separate reactions, which increases the overall cost and setup time. However, it is anticipated that for the envisioned clinical applications, only a small number of miRNAs will need to be assayed per sample, 45 which is more readily accomplished via RT-qPCR or with customized microarrays. The high-throughput offered by NGS is unnecessary if breast cancer detection only requires relative quantification of a limited number of miRNAs per sample. However, the emergence of multiplex barcodes, such as those used in Illumina TruSeq small RNA kits, has improved throughput by allowing the user to simultaneously sequence up to 48 samples on a single flow cell. 99 Thus, multiplexing several patient samples on a single run will continue to ameliorate the expense of NGS.
MicroRNA-Profiling Technologies.
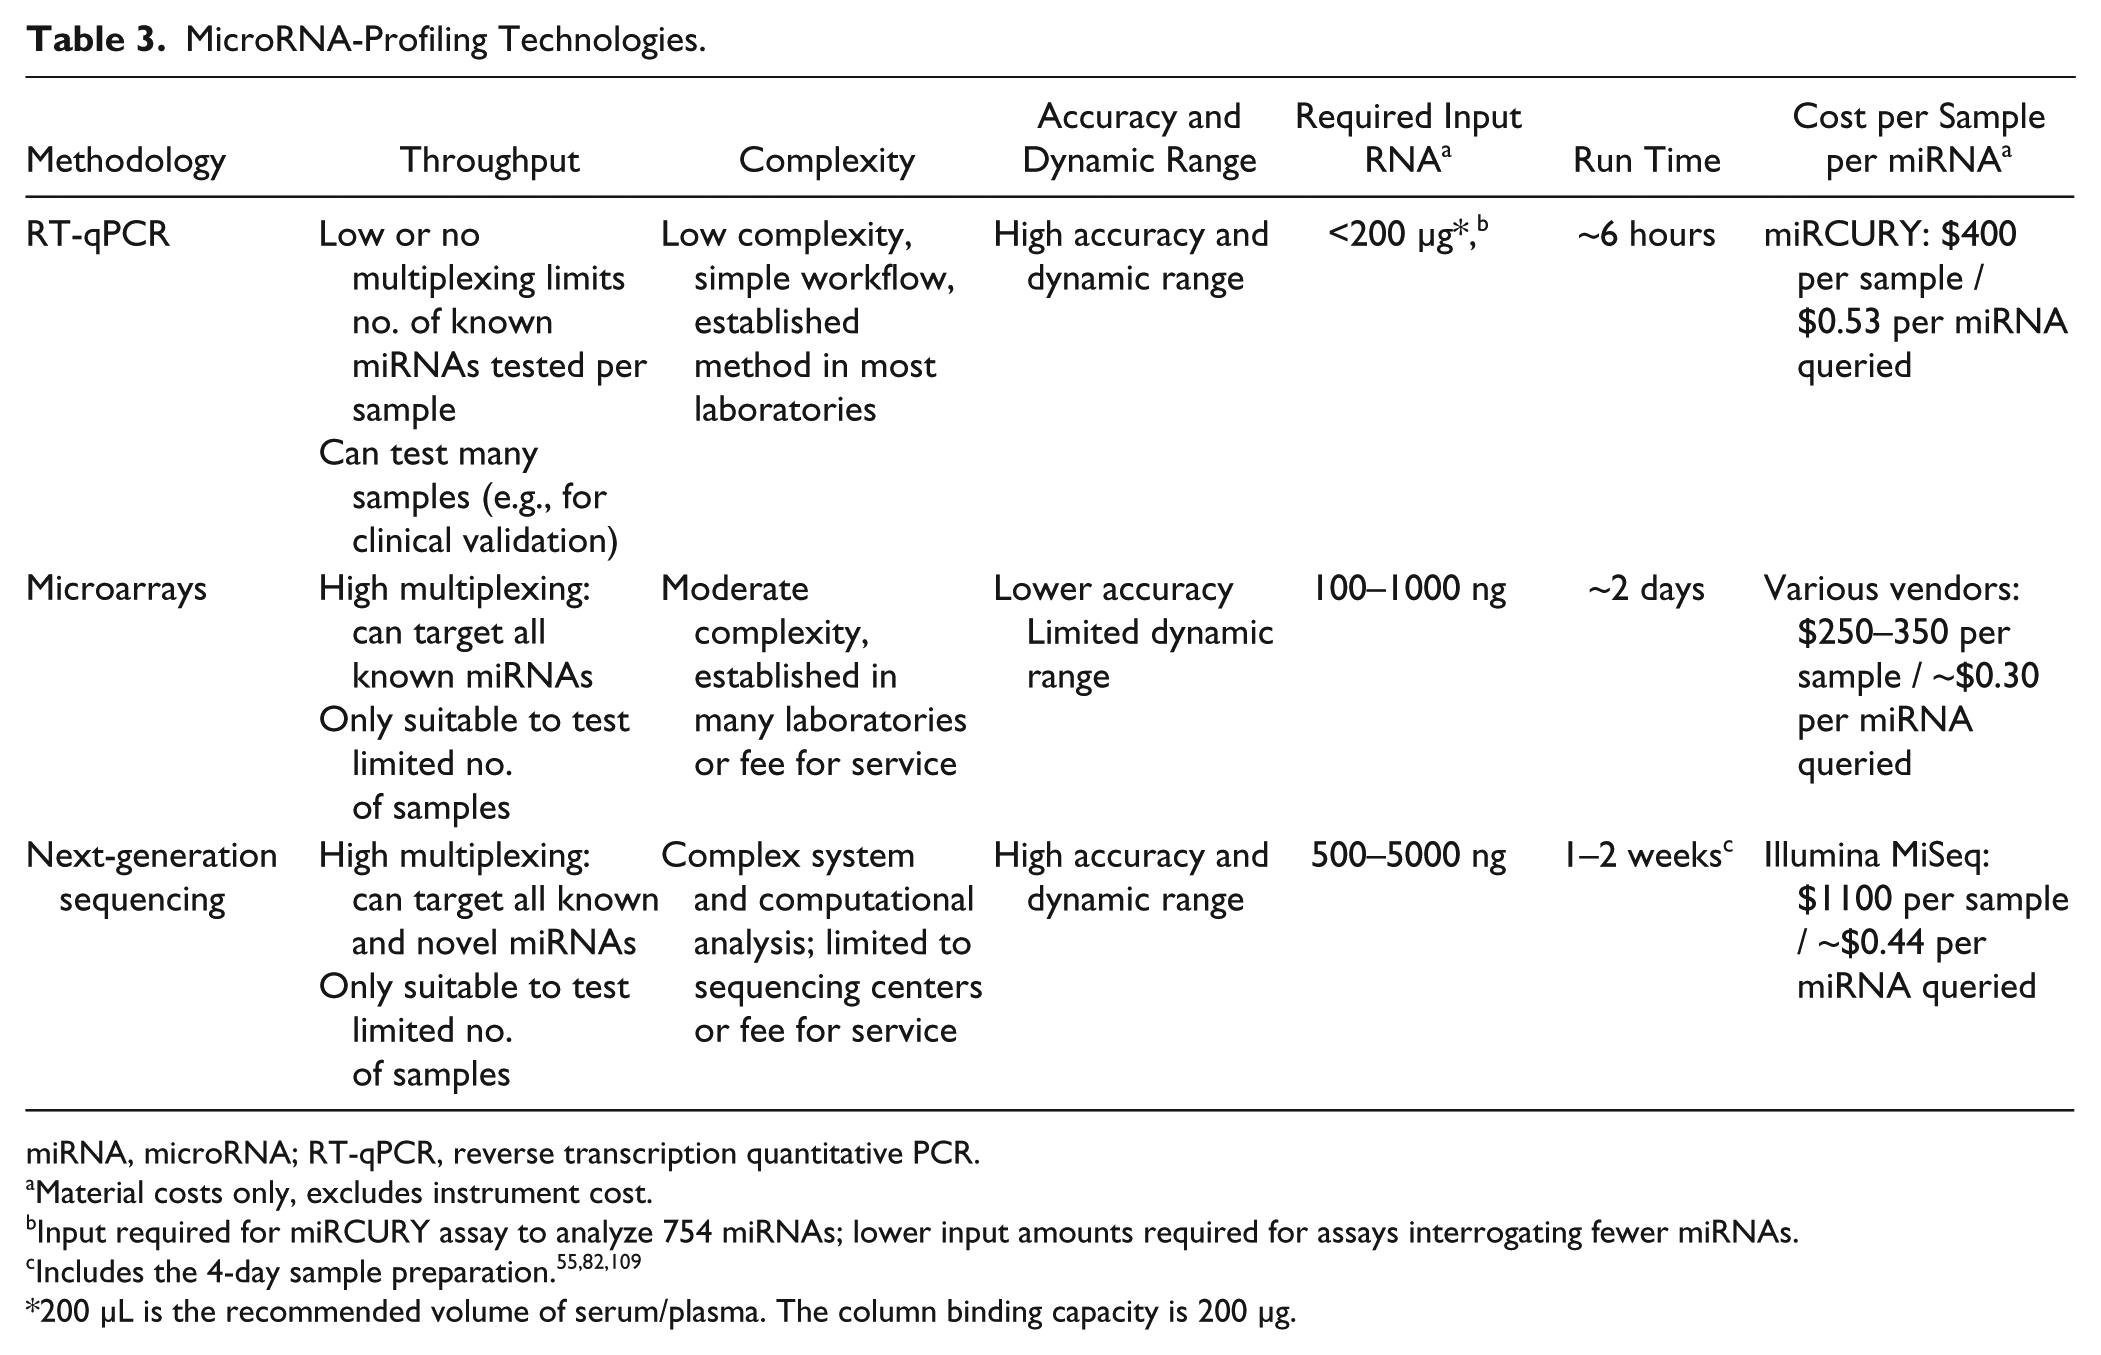
miRNA, microRNA; RT-qPCR, reverse transcription quantitative PCR.
Material costs only, excludes instrument cost.
Input required for miRCURY assay to analyze 754 miRNAs; lower input amounts required for assays interrogating fewer miRNAs.
200 µL is the recommended volume of serum/plasma. The column binding capacity is 200 µg.
Accuracy is defined as the ability of a platform or technology to correctly identify fold-change differences, or relative expression level changes, in a biological sample. The accuracy of miRNA profiling methods has been characterized in several intra- and interplatform reproducibility studies.72,103–106 The analytical sensitivity, or limit of detection, dictates the required amount of input RNA that has to be extracted from the sample and the number of miRNAs that can be queried per sample. In addition, a wide dynamic range is desirable to enable accurate identification of fold-change differences for miRNAs present in both high and low abundance. 107 Traditionally, RT-qPCR has been considered to offer the highest accuracy, sensitivity, and dynamic range, and it is therefore frequently used to validate microarray and NGS results.93,108 For example, the stem-loop RT primer chemistry in combination with Taqman has been found to offer a dynamic range of up to seven orders of magnitude. 107 miRNA microarrays provide the lowest dynamic range of four to five orders of magnitude.81,109 Various studies have demonstrated that RT-qPCR and NGS offer higher sensitivity and accuracy than microarray analysis.72,103,110 NGS technologies enable highly sensitive miRNA identification and can provide a dynamic range of ≥10 orders of magnitude. 111 However, the dynamic range depends on read counts and biological sample types. 112 Highly abundant miRNAs reduce the number of available reads for other miRNAs, which cannot be accounted for with current normalization methods. 55 Consequently, comparisons between samples with high variance in miRNA distribution of expression may not be reliable. 82 Concerning accuracy, a performance comparison study investigated miRNA profiling on human breast cancer cell lines via miRCURY RT-qPCR and two NGS platforms (SOLiD4 and Illumina HiSeq). 69 The results indicate that the relative fold-change difference in expression level (malignant versus normal) was comparable between RT-qPCR and NGS, and between the two NGS platforms, for miRNAs present at both high and low abundance ( Fig. 9 ). However, if the relative change in expression level was less than threefold, higher variability was observed between the different platforms. Therefore, the relative expression-level difference of potential miRNA breast cancer biomarkers should be at least threefold to be unequivocally determined. 69 Discrepancies between studies reported to date for less abundant miRNAs may thus be due to differences in platform sensitivity and specificity.72,113 The major advantage of miRNA-seq is the detection of both novel and known miRNAs. 82 miRNA-seq studies with ultra-deep coverage enable relative quantification of miRNA transcripts present at low abundance, and they make it possible to distinguish miRNAs that differ by a single nucleotide and identification of miRNA variants that differ in length. 82
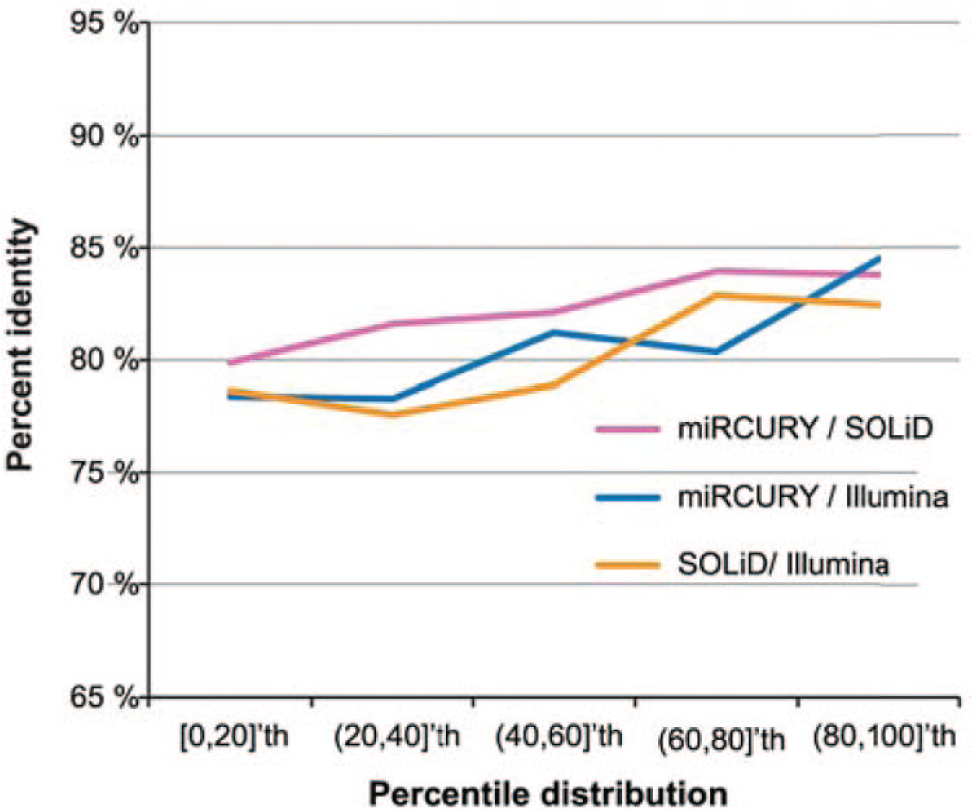
Platform accuracy in relation to microRNA (miRNA) concentration. The percent identity refers to the percentage of miRNAs for which an identical fold-change expression-level difference was determined by the two platforms compared in each series. The percentile distribution refers to increasing miRNA abundance in the sample. All platform combinations provided an average percent identity value of 81% ± 2%, with only slightly lower percent identity observed for low-abundance miRNAs. Therefore, the accuracy of the Illumina and SOLiD NGS platforms is comparable to each other, and to miRCURY RT-qPCR. Adapted from Reference 69 .
The complexity of a method entails the experimental workflow, instrumentation, and data analysis. The cost entails two aspects: cost per sample and cost per miRNA. RT-qPCR entails the lowest complexity, 70 and is well established in most research and many clinical laboratories. The cost of RT-qPCR can be substantial if hundreds of miRNAs are analyzed per sample. However, in eventual clinical use, only a few miRNAs will likely be assayed per sample, which can be done most cost-effectively via RT-qPCR. Microarray-based miRNA quantification, although more complex than RT-qPCR, is a widely adopted method with reasonably cost, simple workflow, 114 and well-defined guidelines. 115 NGS-based miRNA profiling currently entails the highest cost and complexity, and it is typically performed in sequencing centers with suitable infrastructure and personnel. Analysis of datasets on NGS platforms requires substantial computational support, including sophisticated data storage, data transfer, data analysis, and training of personnel. For the general research community, miRNA-seq is attainable on a fee-for-service basis. However, the emergence of benchtop NGS platforms such as the Illumina MiSeq, the Life Technologies IonTorrent PGM, and the Roche 454 GS Junior (Roche, Basel, Switzerland) will continue to drive down the cost and increase accessibility of sequencing. 116 Furthermore, applying barcoded adaptors enables analysis of a greater number of samples in a single sequencing reaction, which further reduces the cost per sample.
In conclusion, the increased sophistication of miRNA profiling tools provides the technical capabilities required for miRNA biomarker discovery and validation. Intra- and interlaboratory reproducibility has been facilitated through method standardization and through guidelines developed for RNA expression analysis via RT-qPCR, 117 microarrays, 115 and NGS RNA-seq. 118 Remaining technical challenges are related to standardizing protocols for miRNA extraction from biological specimens such as serum or plasma, and to normalizing measured values and controls. 102 Observed discrepancies in miRNA biomarker validation studies ( Table 2 ) may be a result of technical inconsistencies, but also could be attributable to biological heterogeneity as a function of breast cancer subtypes and general patient-to-patient variability. Most clinical validation studies performed to date have been limited to fewer than 100 subjects. Much larger, prospective studies are required to clearly validate a limited subset of miRNAs and advance their use into clinical practice. This field has experienced rapid progress in a very short time, as evidenced by the accelerated pace of circulating miRNA publications, with early noninvasive breast cancer detection and prognosis as one of the key targeted applications.
Footnotes
Declaration of Conflicting Interests
The authors declared no potential conflicts of interest with respect to the research, authorship, and/or publication of this article.
Funding
The authors received no financial support for the research, authorship, and/or publication of this article.