
Abstract
Alzheimer’s disease (AD) is a neurodegenerative disease that inhibits cognitive functions and has no cure. This report reviews the current diagnostic standards for AD with an emphasis on early diagnosis using the cerebrospinal fluid (CSF) biomarkers amyloid-beta, t-tau, and p-tau and fluorodeoxyglucose positron emission tomography imaging. Abnormal levels of these CSF biomarkers and decreased cerebral uptake of glucose have recently been used in the early diagnosis of AD in experimental studies. These promising biomarkers can be measured using immunoassays performed in singleplex or multiplex formats. Although presently, there are no Food and Drug Administration–approved in vitro diagnostics (IVDs) for early detection of AD, a multiplex immunoassay measuring a panel of promising AD biomarkers in CSF may be a likely IVD candidate for the clinical AD diagnostic market. Specifically, the INNO-BIA AlzBio3 immunoassay kit, performed using bead arrays on the xMAP Luminex analyzer, allows simultaneous quantification of amyloid-beta, t-tau, and p-tau biomarkers. AD biomarkers can also be screened using enzyme-linked immunosorbent assays that are offered as laboratory-developed tests.
Keywords
Alzheimer’s disease (AD) is the most common type of dementia, a condition caused by neuronal death or dysfunction. 1 The altered neuronal landscape in patients with dementia can cause changes in an individual’s memory and behavior, inhibiting their ability to live a normal and healthy life. 2 AD is characterized by the gradual inability to remember new information. As the disease progresses, higher cognitive functions, such as problem solving and task completion, are impaired.
In 2013, about 5.2 million Americans had AD. 2 Of those, 5 million individuals were 65 y or older.2,3 Today, Americans are increasingly living longer than 80 y of age, and consequently, a greater number of individuals will be affected by age-related diseases, such as AD.4,5 By 2025, the number of individuals 65 y and older with AD is projected to be 7.1 million, which is a 40% increase from those currently affected. AD is the sixth leading cause of death in the United States. 2 In 2013, about half a million people in the United States will die from AD.2,6
Genetic predispositions to AD have also been observed for early-onset AD. Mutations in the genes coding E280A presenilin 1, presenilin 2, and amyloid-beta precursor protein (APP) increase the risk of AD.7–9 In addition, the apolipoprotein ϵ type 4 allele (apoE4) has been associated with AD, and the findings have since been confirmed by several other studies.10-12 Individuals with one ϵ4 allele have a two- to threefold increased risk, whereas those with two copies of the ϵ4 allele have a 12-fold risk increase compared with those with no ϵ4 alleles. 13
Although the direct cause of AD is elusive, increased accumulation of amyloid-beta may be responsible for disease onset and progression. Increased concentrations of Aβ1-42 correlate with premature symptoms of AD. Another proposed cause of AD is the presence of neurofibrillary tangles (NFTs) in the brain. These NFTs become distributed in the cell body and dendrites of neurons, leading to neurodegeneration and eventual death.14–16
Diagnosis
AD is customarily diagnosed by the patient’s primary care physician based on the patient’s medical, family, and psychiatric histories. Changes in cognition and behavior are also considered.2,17 The Diagnostic and Statistical Manual of Mental Disorders, fourth edition, contains a list of symptoms characteristic of AD to aid physicians in diagnosis. The clinical assessment recommends a series of cognitive tests, such as the Mini-Cog. This test requires the patient to remember a short list of unrelated words, correctly draw a clock, and then recall the list. This simple, brief test has 99% sensitivity for AD diagnosis and is uninfluenced by the education level or language of the patient. 18 Other tests, including the General Practitioner Assessment of Cognition, the Memory Impairment Screen, and the Informant Questionnaire on Cognitive Decline in the Elderly, have proven to be fairly effective at diagnosing AD qualitatively.19,20 However, many of the disease traits are ambiguous, and symptoms may be confounded with typical age-related mental changes or other disorders. 21 In addition, waiting for symptoms to arise makes early diagnosis and treatment very difficult. Many home screening tests have been marketed to assist with diagnosis22–27 ( Table 1 ); however, more effective diagnostic techniques are needed.
Home Screening and Genetic Tests Available for Purchase. a
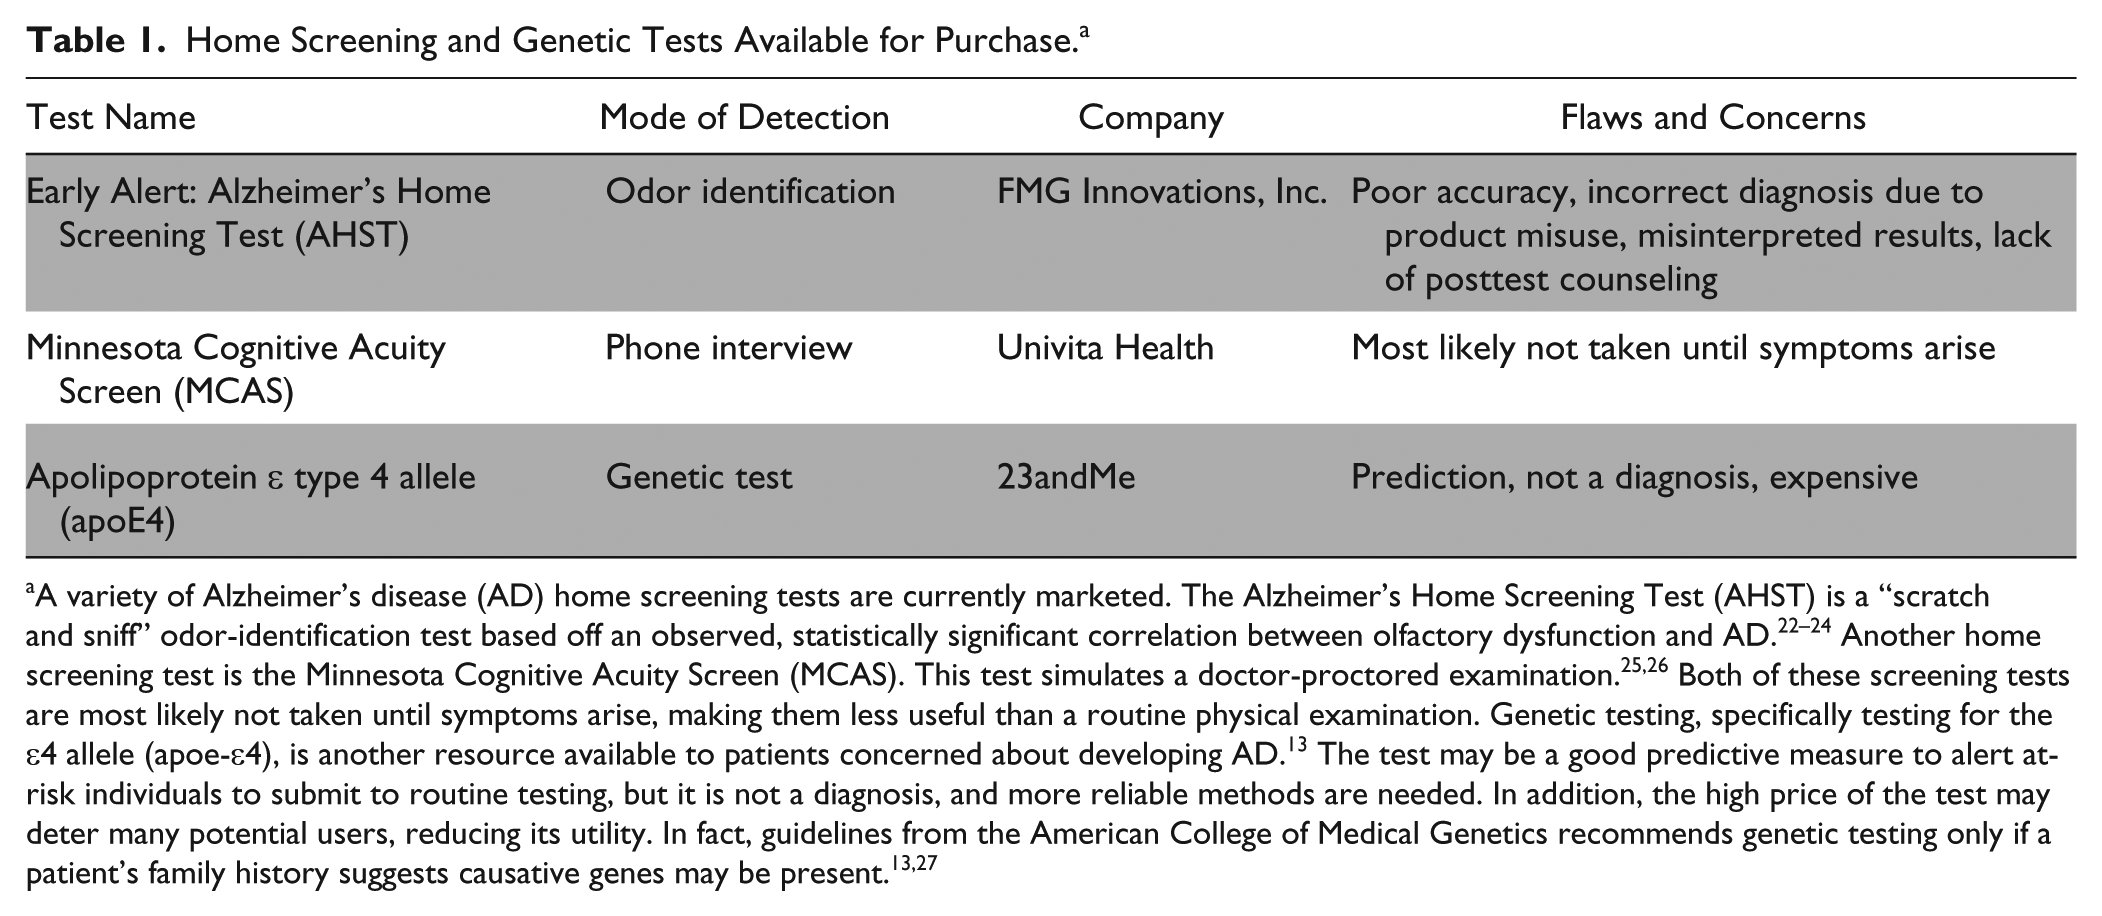
A variety of Alzheimer’s disease (AD) home screening tests are currently marketed. The Alzheimer’s Home Screening Test (AHST) is a “scratch and sniff” odor-identification test based off an observed, statistically significant correlation between olfactory dysfunction and AD.22–24 Another home screening test is the Minnesota Cognitive Acuity Screen (MCAS). This test simulates a doctor-proctored examination.25,26 Both of these screening tests are most likely not taken until symptoms arise, making them less useful than a routine physical examination. Genetic testing, specifically testing for the ϵ4 allele (apoe-ϵ4), is another resource available to patients concerned about developing AD. 13 The test may be a good predictive measure to alert at-risk individuals to submit to routine testing, but it is not a diagnosis, and more reliable methods are needed. In addition, the high price of the test may deter many potential users, reducing its utility. In fact, guidelines from the American College of Medical Genetics recommends genetic testing only if a patient’s family history suggests causative genes may be present.13,27
Characteristic changes in the brain due to AD can occur almost 20 y before symptoms arise and a clinical diagnosis can be made. 28 This long asymptomatic or minimally symptomatic phase provides a potential opportunity for therapeutic intervention aimed to slow or perhaps prevent the advancement to clinical AD. 21 In 2011, noting this early phase in AD progression, the Alzheimer’s Association proposed a new set of criteria for AD diagnosis from the 1984 guidelines, with two main additions. First, the guidelines recognize three distinct stages of AD progression: preclinical AD, mild cognitive impairment (MCI) due to AD, and dementia due to AD. 21 The preclinical AD stage is before symptoms begin to appear but initial changes are present in areas of the brain that function at rest. This area is called the default mode network, which includes the medial frontal and temporal lobes, posterior cingulate cortex, and precuneus. 29 The MCI stage occurs when noticeable symptoms begin and dementia is anticipated in 3 to 4 y. Finally, the dementia stage begins when daily function is significantly impaired. 21 Recognition of presymptomatic brain changes may have significant research and diagnostic implications. The second addition entails the inclusion of biomarker tests. These tests may be paramount to early (preclinical) diagnosis, treatment monitoring, and continued Alzheimer’s research. However, more research is needed to validate promising biomarkers before they can be implemented in clinical diagnostics. 30
Because MCI is the stage before AD, the conversion from MCI to AD has been of great interest in the research of biomarkers for early AD detection. Although not all MCI patients develop AD, all AD patients have had previous MCI. The rate of MCI conversion is therefore important when finding biomarkers to aid in the diagnosis of AD. Of significant research interest is determining specific biomarkers that indicate whether a person with MCI will convert to AD later on. However, there is a need for standardizing such biomarkers and performing more longitudinal studies to establish serial biomarker measurements. 31
Amyloid-Beta
Amyloid-beta is the protein associated with amyloid plaques present in the brain and cerebrospinal fluid (CSF) of Alzheimer’s patients. Modification of APP can create multiple forms of amyloid-beta, including Aβ1-40 and Aβ1-42. Newly expressed APP protein undergoes posttranslational processing via proteolytic cleavage 32 ( Fig. 1 ). Aβ1-40 is a common protein found in patients without disease. However, increased production of Aβ1-42, a second derivative that is less soluble, aggregates to form amyloid plaques. 7 These insoluble deposits disrupt the structure and function of tissue, which includes neuronal signaling. The plaques are stable, resistant to degradation, and cannot be cleared out of the system. The imbalanced amyloid-beta regulation may be a result of increased production, decreased clearance, or both. 33
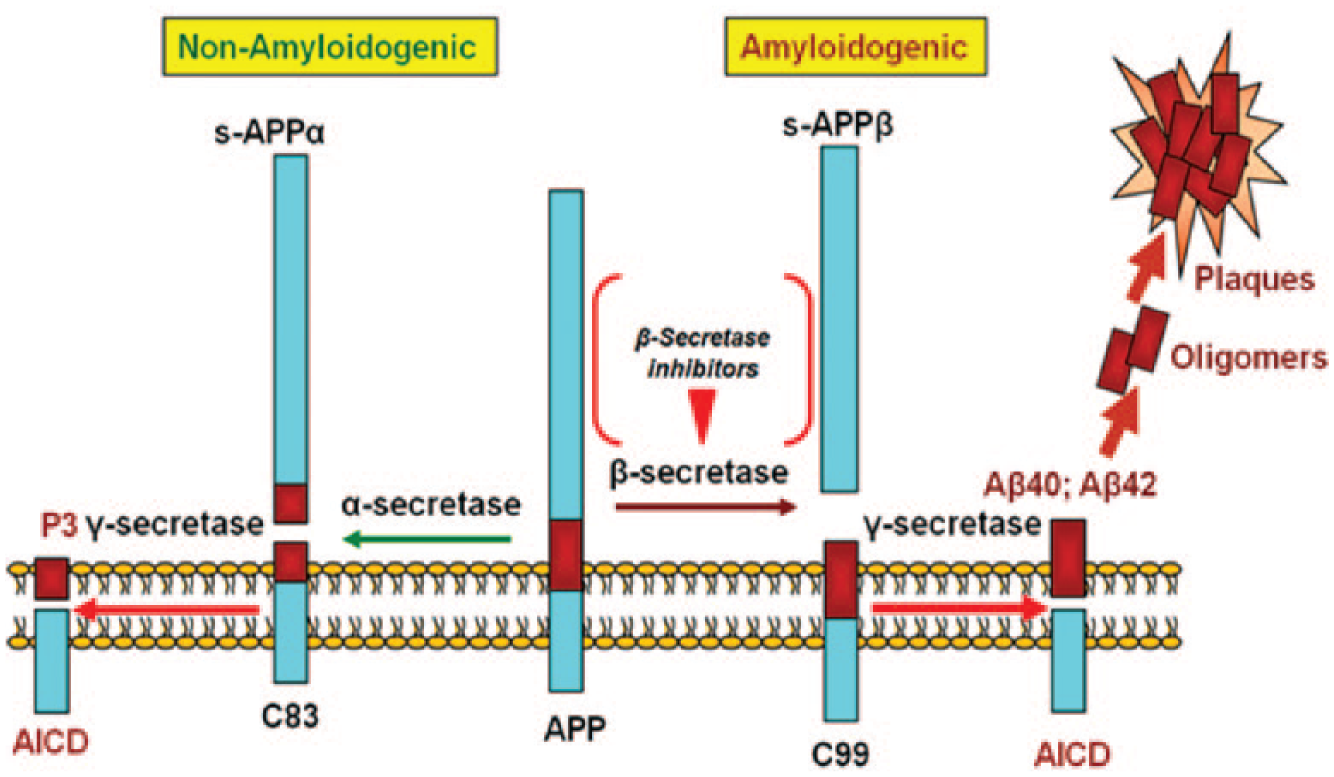
Formation of amyloid-beta from amyloid precursor protein (APP). The APP protein can be cleaved by a β-secretase to form c99, which is cleaved by a ϒ-secretase to create amyloid-beta that then aggregates to form plaques that disrupt the function in the brain. The APP protein could alternatively be cleaved by α-secretase and then cleaved by a ϒ-secretase to create P3 instead of amyloid-beta. Figure adapted from ref. 32.
The presence of amyloid-beta speeds up hyperphosphorylation of tau proteins, which aggregate to form the NFTs commonly associated with AD. Tau protein transgenic mice injected with Aβ1-42 fibrils have shown dramatic increases in NFTs after 18 d, and a fivefold increase in NFTs led to a decrease in mitochondrial function of the surrounding cells in the amygdala.34,35 Interestingly, NFTs are also present in other neurological disorders such as Parkinson’s disease and frontotemporal dementia. However, amyloid-beta is not found in these other tauopathies, suggesting that the presence of increased levels of Aβ1-42 accelerates pathological symptoms of AD. 35
Tau and Phosphorylated Tau
Microtubule-associated protein tau is an important part of microtubule (MT) stabilization within neuronal axons. Tau is expressed as six different isoforms in the CSF, each possessing either a 3R or 4R MT-binding repeat composed of a tubulin motif that facilitates tau’s interaction with MT’s β-tubulin pockets. 36 Furthermore, each tau protein has multiple MT binding abilities that facilitate the formation of three to four MT dimers that further contribute to axonal MT stability. 36
Normally, tau stabilizes neurons by directly binding to the neuronal axon’s MT β-tubulin pockets. 36 Binding is regulated by phosphorylation (decreases affinity for MTs) and dephosphorylation (increases affinity for MTs) of tau. This negative regulatory system is key to the movement of vesicles, mitochondria, and the normal function of neurons ( Fig. 2 ). However, tau hyperphosphorylation leads to decreased solubility and misfolding. The presence of misfolded tau or tau fibrils induces the formation and aggregation of NFTs via a nucleation mechanism. 37
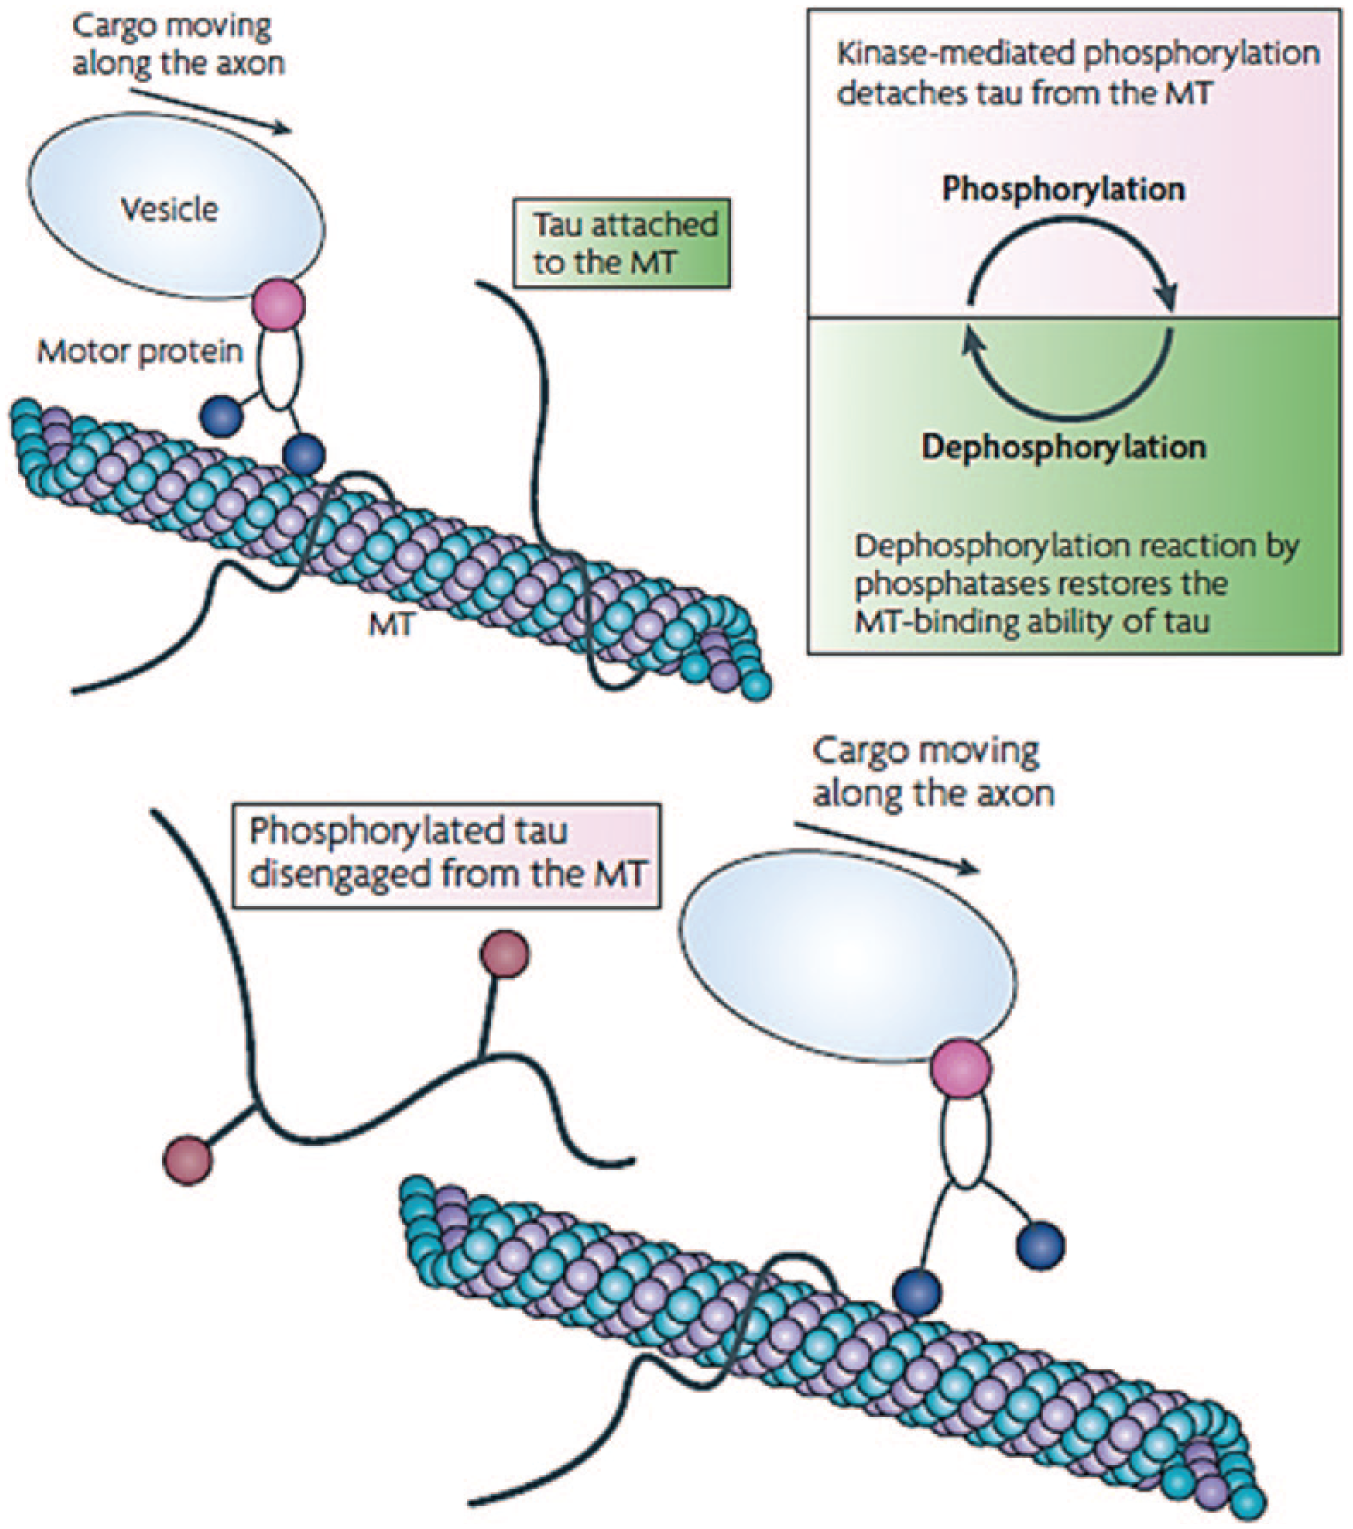
Phosphorylation/dephosphorylation mechanism in neurofibrillary tangle formation. Under normal conditions, tau bound to the microtubule (MT) dissociates through phosphorylation, allowing the vesicle to gain access and move along the axonal MT. Dephosphorylation of tau increases its binding affinity to the MT, assisting in MT stabilization. 36
As biomarkers, both Aβ1-42 and p-tau181 have the capacity to differentiate between mild cases of AD from cognitively normal groups and thus have promise in early detection, especially for predicting conversion to AD from MCI patients. Moreover, the predictive capability of these biomarkers significantly improves when associated with other proteins found in the CSF. 38
Glucose
Decreased glucose uptake in specific regions of the brain is correlated with AD, and thus, the measurement of glucose metabolism in the brain can be used as a metabolic biomarker for early AD diagnosis.29,39,40 Glucose is transported across the blood-brain barrier and into the neuron-astrocyte functional unit by different isoforms of GLUT transporters.29,41 Once transported into the cell, glucose undergoes multiple aerobic and anaerobic oxidation processes. 41 To trace the glycolytic pathways, glucose is labeled using [18Fluorine]. Fluorodeoxyglucose (FDG) uptake into different areas of the brain is measured using positron emission tomography (FDG-PET).29,41 Diminished glucose metabolism is linked with an overall decrease of synapse number or synaptic metabolic activity. 29
Using FDG-PET imaging, physicians are able to determine the general neuronal integrity of an individual’s brain and their relative risk of AD development. Most hypometabolism is found in brain regions of language and working memory, including the “association” cortex (posterior lateral and medial temporal-parietal), posterior cingulate-precuneus, and lateral frontal cortex.29,42
Metabolic dysfunction of these regions is reflective of AD symptomology and can be used as a predictor of AD susceptibility among nonsymptomatic elderly. 29 Furthermore, examination of the association cortex can also reveal the progression of the disease. Hypometabolism in the medial temporal cortex is greatly correlated with earlier stages of AD, whereas later stages of AD are related to metabolic failure in the temporoparietal cortex. 29 There are also different diagnostic indications for age of onset, either early-onset (type I) or late-onset (type II) AD, that are associated with the type of metabolism of reduced glucose. 40 For instance, a measured loss of ATP production reflects a reduction of aerobic glycolysis in the medial temporal part of the brain, which is closely correlated with diagnosing late-onset AD (type II). On the other hand, hypometabolism from decreased anaerobic activity is found in the posterior lateral temporoparietal region of the brain and is related to type I AD.29,40
Other Biomarkers in Development
Additional biomarkers may prove to be useful in developing criteria for AD diagnosis. For the majority of these potential biomarkers, the decreased invasiveness and ease of sample procurement make them an attractive alternative to established CSF biomarkers. However, further research is required to fully understand their utility.
CSF
Although invasive to extract, the CSF contains cargo proteins that may aid in AD diagnosis. 43 These cargo proteins are found in neuronal secretory vesicles and help aid in neuronal survival and fast axonal transport. Cargo proteins include chromogranin-B, α-synuclein, neuregulin-1, and nonamyloidogenic N-terminal fragment of APP (sAPPα). Using a heavy water (2H2O) pulse-deuterium labeling method, cargo proteins can be monitored to indicate deficiencies in axonal transport. 44 However, there have yet to be any significant distinctions of CSF cargo protein levels between clinically defined groups of cognitively impaired patients. Clinical research studies to use these cargo proteins as in vitro diagnostic (IVD) biomarkers are ongoing.43,44
Furthermore, the CSF also contains other proteins that may be involved in detecting early AD. Apart from tau and amyloid-β, the CSF proteome contains four auspicious candidates: YKL-40 (chitinase-3 like-1, human cartilage glycoprotein-39, and chondrex), carnosinase I, chromogranin A, and NrCAM (neuronal cell adhesion molecule). Levels of each of the above CSF proteins are found to be statistically different among clinically defined patient groups with different degrees of cognitive impairment. 38 With the ability to better distinguish cognitive groups, examination of these protein biomarkers may allow for the establishment of standardized measurements that definitively indicate both the presence of AD and stage of development.
The CSF protein marker YKL-40 has gathered significant interest for its potential role in determining disease progression and evaluating risk for MCI conversion to AD. YKL-40 is an astrocyte-derived protein that plays an integral part in the brain’s inflammatory response and tissue remodeling. In AD patients, this protein is highly up-regulated, releasing large amounts of extracellular-bound basic fibroblastic growth factors. Although YKL-40 is also known to be involved in other inflammatory diseases, such as arthritis and asthma, the protein is able to identify a normal patient’s risk for developing cognitive impairment as well as rate of dementia progression. There is also a correlation between amyloid plaque buildup and plaque-associated activation of the astrocytes. Therefore, a combination measurement of Аβ1-42 and YKL-40 can aid in the prognosis of AD patients in both the preclinical and early clinical stages of development, predicting faster conversions with higher ratios of CSF YKL-40/Aβ1-42. Moreover, the combination also helps minimize the ambiguity of the AD diagnosis with other neurodegenerative disorders such as progressive supranuclear palsy. With the advent of early detection and greater specificity, CSF YKL-40 protein may be useful as an inflammatory biomarker for AD. 28
Blood
Another promising biomarker for AD is apoE, specifically the apoE4 isoform. Plasma levels of apoE4 may be a less invasive option for diagnosing patients. As an integral component in synaptogenesis and neural growth, apoE facilitates the delivery of cholesterol and promotes neuronal functionality. Decreased apoE4 levels associated with neuronal degradation are suggestive of AD. Using nucleic acid testing, AD patients who are ϵ4 homozygous demonstrated the lowest apoE levels compared with controls. 11 However, results are inconsistent across various studies. The correlation between altered levels of apoE and apoE4 with AD pathology is still not definitive, and standardization of methods is needed. 11
Several studies have been conducted comparing the telomere length of peripheral blood leukocytes with those in the cerebellum.40,45 The shortening of telomere length is indicative of chronic stress on the human body, common in AD patients. Therefore, the shortened telomere length of peripheral leukocytes can be demonstrative of an individual’s risk for developing AD. 45 However, cerebellar telomere length is not considered a diagnostic tool to evaluate the risk of inherited AD (type I).40,45 Moreover, many other diseases also contain pathologies that induce stress on the body, so results may be confounded with other underlying health problems.
Urinary
High concentrations of neuronal thread protein (NTP), specifically AD-associated NTP (AD7c-NTP), in urine is found to be representative of AD pathology. 45 NTP is a brain protein that interacts with antibodies produced against pancreatic thread protein (PTP), a protein that contains structural components highly similar to the fibrils found in neuronal plaques in AD patients.45,46 Moreover, AD7c-NTP is reflective of neuronal cell dysfunction. High immunoreactivity of NTP in the brain is associated with AD. 46 Because PTP levels parallel the relative NTP concentration in both CSF and urine, high NTP levels in urine can be used as a diagnostic tool to indicate AD. The concentration of NTP in urine was measured using a monoclonal antibody–based assay, and an NTP concentration larger than 22 µg/mL was considered indicative of AD. 47 Unfortunately, NTP is more useful in determining the progression of the disease in patients who already have AD and not for early diagnosis. 47
Current Therapies
Current therapies focus on treating disease symptoms rather than causes. Cholinesterase and glutamate inhibitors are the two classes of medications that have been approved by the Food and Drug Administration (FDA) for the treatment of AD. 2 Their main function is to treat the symptoms of memory loss and cognitive decline. 2 In general, cholinesterase inhibitors, such as galantamine, are administered in the early to moderate stages (I-II) and work to prevent the breakdown of acetylcholine. 2 For patients in the moderate to severe stages (II-III), memantine is administered to regulate glutamate levels. Although these therapies do show modest symptomatic benefit, there is little evidence that either treatment class significantly alters disease progression.48,49
Ongoing research aims to develop new therapies to prevent or slow the advance of the disease by affecting the brain changes caused by AD. Many prospective treatments focus on the reduction of amyloid-beta levels by inhibiting/modulating β- or ϒ-secretases or by antioxidant treatment.50-53 In addition, amyloid-beta immunotherapy has been tested as a method to enhance amyloid plaque clearance. 54 Of primary importance is the observation that amyloid-beta reduction is most likely to show effectiveness in early AD cases before significant Aβ deposition, synaptic damage, and/or neuronal changes have occurred. In keeping with this observation, the majority of preclinical trials showing efficacy with amyloid-beta reduction therapy have treated subjects before the onset of (or early in) amyloid pathology.55,56 With many anti-Aβ therapy clinical trials under way, the importance of an early AD diagnostic method is further emphasized.
Technical Product Analysis
Appropriate methods for nonsymptomatic based AD diagnosis can be listed under two general domains: assay testing and neuroimaging. For AD diagnosis, assay testing allows for the qualitative or quantitative assessment of CSF, blood, or urine.
Immunoassays
Immunoassays use specific antibodies to quantify the protein biomarkers in a sample fluid. Prior to use, biomarker cutoff levels must be established. Research has led to the widely accepted conclusion that ideal biomarker cutoff values ought to confer >80% sensitivity and >80% specificity. 57 The majority of immunoassays used in AD diagnostics includes enzyme-linked immunosorbent assays (ELISAs) and multiplex bead array assays (MBAA). In AD diagnostics, there is one major laboratory-developed test (LDT) that uses the sandwich ELISA technique for antigen detection: the INNOTEST. The INNOTEST has three derivatives that test for p-tau, t-tau, or amyloid-beta levels in CSF. ELISAs are simple, flexible, cost-effective, and well established in clinical laboratories. 58 Despite these advantages, ELISAs are labor intensive, can be associated with high intra- and interlab variability, and study only one analyte at a time.59 -61 Multiplexed immunoassay formats, such as the MBAA, can address some of these concerns.
Multiplex Bead Array Assay
The MBAA, like the ELISA, uses capture antibodies to bind analytes of interest. However, an MBAA contains multiple beads, which can be bound to different capture reagents, including antibodies, oligonucleotides, peptides, and receptors. This allows for detection of multiple analytes in a single assay.59,62 Two readily used LDTs that follow the MBAA technique in AD diagnostics are the INNO-BIA AlzBio3 and the INNO-BIA Plasma Amyloid-Beta (Aβ) Forms Assay, both of which are performed on the xMAP Luminex analyzer.59 -64
The INNO-BIA AlzBio3 diagnostic immunoassay kit contains a specific set of bead-bound capture antibodies and fluorescently labeled detection antibodies. These components are used on the xMAP Luminex analyzer to detect and quantify amyloid-β1-42 (Aβ42), total tau protein (T-tau), and tau phosphorylated at position threonine 181 (P-tau) in CSF.63,65,66 The INNO-BIA Plasma Aβ Forms Assay uses the same procedure but contains detection antibodies for only the two major types of amyloid-beta, Aβ1-40 and Aβ1-42. 65
The MBAA allows for high-throughput detection of multiple analytes in a single test, requires a smaller sample size, and is less laborious than an ELISA. Standardization of the Luminex platform limits intra- and interlab variability.59,60 The microsphere beads allow for solution-phase antibody-antigen binding kinetics, which are preferred over the solid-phase kinetics of flat, solid bound assays. However, the Luminex platform is costly, and the presence of multiple analytes introduces the potential for cross-reactivity in the reaction vial. 59 Despite these differences, both the ELISA and the xMAP Luminex MBAA have similar accuracies. 60
Overall, the use of immunoassays in AD diagnostics has been successful. Assay testing of Aβ42, t-tau, and p-tau in combination has been largely validated, with approximate sensitivity and specificity values of >95% and >85%, respectively, in comparison to AD diagnosis via autopsy.67,68 However, AD diagnostic immunoassays remain limited by intra- and interlab variation in laboratory procedures, inclusion criteria, and results analysis. Therefore, there is a need for multicenter collaboration and standardization of sample handling, clinical assessments, and biomarker cutoff levels.61,62,69
As an alternative to assay testing, neuroimaging technologies provide an in vivo and minimally or noninvasive method for early AD detection. Neuroimaging technologies fall under three categories: structural, functional, and molecular imaging. These imaging types reveal neural changes that can aid the detection of early-stage AD. The most commonly used neuroimaging techniques for AD are magnetic resonance imaging (MRI) and PET. 70
Magnetic Resonance Imaging
Structural MRI (sMRI) creates a three-dimensional image that evaluates the brain’s physical structure. 71 Volumetric measurements of specific regions affected by AD progression, such as the hippocampus and enthorhinal cortex, can be valuable in evaluating disease prognosis. Specifically, hippocampal atrophy in MCI patients is measured via sMRI imaging. The magnitude of hippocampal atrophy indicates how far along the neurodegenerative path an individual is and thus predicts an individual’s proximity to AD progression. 72
Blood flow and metabolism in the brain reflects brain activity. In a functional MRI (fMRI), blood flow is measured by applying a magnetic field that aligns and measures resonance frequencies produced by protons in blood. 73 The measured resonance frequencies enable tracking and visualization of blood flow. The low-energy waves used in MRI are safer than those gamma rays used in a PET scan, but fMRI is an indirect measurement of neural activity.73,74 Using fMRI, AD individuals show decreased activity in the medial prefrontal cortex and orbitofrontal gyrus in comparison to MCI patients, brain regions associated with the human default-mode network. The default-mode network is involved in autogenic thought, and its deterioration in AD patients is reflective of a continuous breakdown of spontaneous brain activity during disease progression. 75
Positron Emission Tomography
PET imaging uses cellular metabolism to explore neural activity. 74 Radioactive tracers are covalently attached to molecules, such as glucose, which can then be metabolized by the human body. 76 The release of the attached tracers results in the emission of gamma rays via positron-electron collisions73,77 ( Fig. 3A ). Based on the amount of measured gamma rays, a colored three-dimensional or two-dimensional computerized image is generated, and physiological changes related to AD can be evaluated58,78,79 ( Fig. 4 ). Prior to a PET scan, the patient is given a low dose of a radioactive compound. The isotopes release positrons that collide with electrons and produce gamma photons for PET to register as “coincidence events”77,78 ( Fig. 3B ). Despite the gamma rays’ high energy, many photons are gradually lost in the tissue and fail to reach the detector.
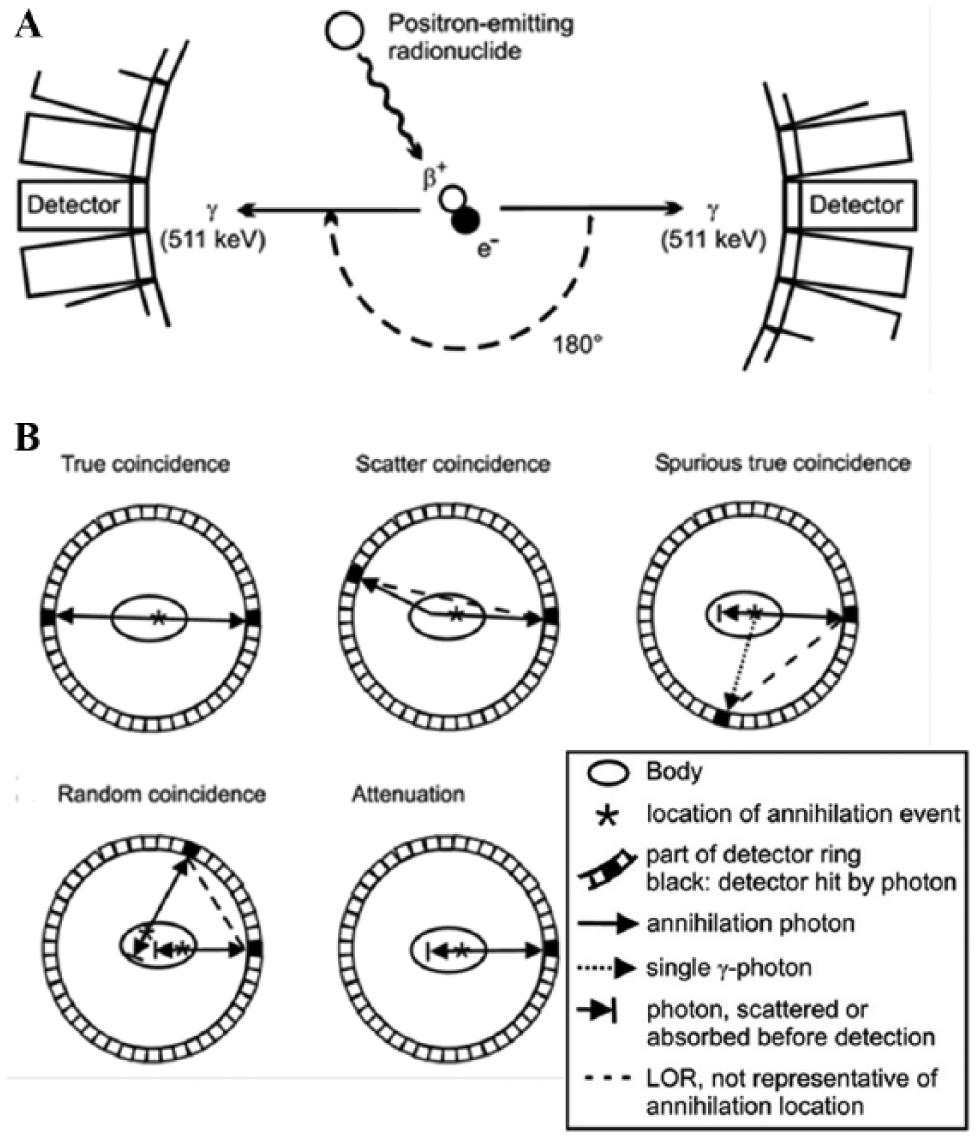
Principles of positron emission tomography (PET). (
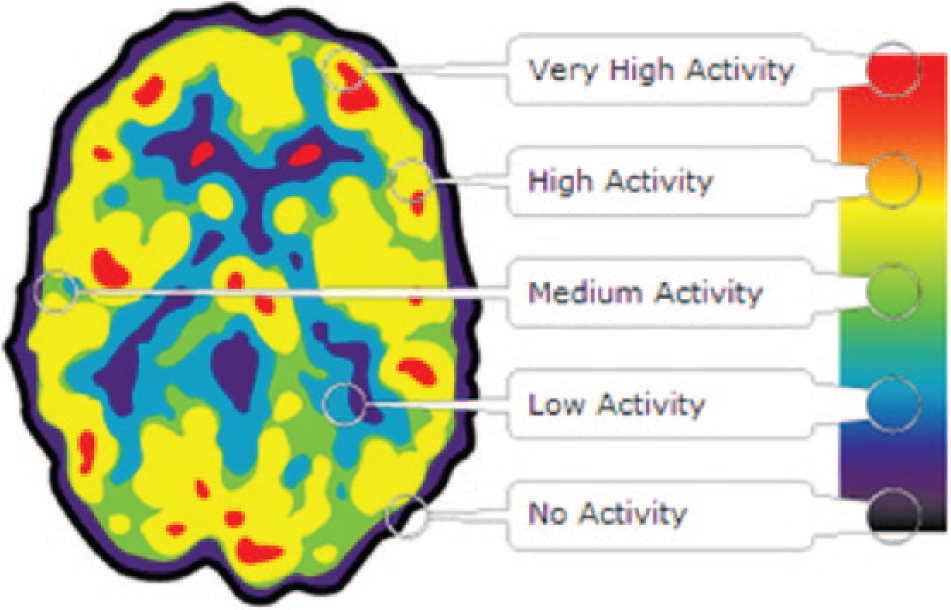
Positron emission tomography (PET) brain image. PET scan produces colored images composed of the measurements as a series of dots. The color indicates the energy intensity or amount of gamma rays released. A black color signifies little to no activity, whereas red indicates high activity. Figure adapted from ref. 79.
PET imaging can be used to detect Aβ plaque deposits and neurodegeneration with the radiotracer amyloid-beta Pittsburgh Compound-B (PiB). PiB-PET is highly reliable method of AD diagnosis and prognosis but demonstrates a low specificity as amyloid lesions can be found in both other forms of dementia. In addition, amyloid imaging is a relatively new technique with fewer longitudinal studies than FDG-PET studies. 80
As mentioned previously, PET technology is also used to measure glucose consumption in the cerebrum with the radiotracer 2-[18F] fluoro-2-deoxy-D-glucose (FDG) for AD diagnosis. FDG-PET imaging has a high sensitivity for detecting the earliest signs of pathology and distinguishing AD from controls but a slightly lower specificity because similar metabolic reductions can be found in other forms of dementia. 81
Despite significant scientific and clinical validation to support PET applications, the time-sensitive procedure and the expensive nature of radiotracers make PET use for AD diagnosis nonideal. 82
Additional emerging technologies in AD diagnosis include genotyping to assess disease predisposition and microRNA (miRNA) assays as an early diagnostic tool. Genotyping of patients involves the use of single nucleotide polymorphism microarrays, in which specific immobilized nucleic acid probes detect polymorphisms within a given genetic region. Genetic sequencing is another rapidly growing field that detects polymorphisms. The apoE gene is the focus of the majority of genetic detection technology. 83 A newer technique, miRNA quantification by stem-loop reverse transcriptase polymerase chain reaction, detects the miRNA sequence miR-101, which inhibits expression of APP and has been shown to be present in reduced levels among AD patients.60,84–86
Clinical Application
Biomarkers for AD diagnosis may enable early disease detection and allow for more effective disease treatment. Alternatively, a biomarker-based approach may allow for precise identification of an MCI patient’s transition to clinical AD. For research purposes, a comparison of biomarker levels in healthy, MCI, and AD patients may shed light on Alzheimer’s pathology and uncover measurable distinctions between AD and other dementias.
For early, pre-MCI Alzheimer’s detection in a clinical setting, serial biomarker measurements appear to be the most appropriate detection method. For individuals at high risk for developing AD (family history, apoE4 carriers, etc.), yearly AD biomarker measurements may be measured and compared with the intent of finding a point of inflection or gradual change from individual baseline levels. As mentioned previously, 95% of AD cases begin after the age of 65 y, and characteristic AD brain changes begin and can be detected up to 20 y before symptoms begin.87–90 Thus, age 50 seems to be an appropriate milestone for the initiation of serial biomarker measurements in high-risk AD patients.
A primary issue with this method subsists in the possibility of a biomarker plateau before true AD or the lack of any observable pattern in the biomarker measurements leading up to AD. Although further research is needed to address these concerns, recent evidence suggests that the decrease of the CSF biomarker Aβ1-42 mirrors disease progression in the early stages up to clinical AD. In addition, the biomarker level decrease does not reach a plateau until full-blown demented syndrome. 91
For a more definitive diagnosis of AD in patients with a history of MCI, a screen for biomarker level variation may also be used to determine the point of transition from MCI to AD. Alternatively, a retrograde comparison of serial biomarker levels in MCI patients who are Alzheimer’s negative at autopsy and in patients who are Alzheimer’s positive at autopsy may uncover a characteristic biomarker difference between the two disorders. Although no standard variance in biomarker signature between MCI and AD patients has been determined, combinations of CSF YKL-40/Аβ1-42, p-tau181/Аβ1-42, and tau/Аβ1-42 have been shown to reliably predict the proclivity of cognitive impairment in both cognitively normal and MCI individuals.28,92
For early AD biomarker screening, the use of an MBAA immunoassay performed on the xMAP Luminex analyzer is recommended. It is a relatively cost-effective method to accurately quantify multiple biomarker levels and thus is a reasonable method for repeat testing.67,68 Preferably, a clinical AD screening diagnostic would use blood or urine samples to minimize invasiveness. Despite evidence of a potential AD signature in the blood, data are minimal and validation of these non-CSF markers is inconsistent.93–95 Thus, until further research is performed, CSF assays remain the most viable option for clinical AD diagnosis.
There is substantial overlap of biomarker values among healthy, MCI, and AD patients. Therefore, the use of any one biomarker would be insufficient in aiding the early diagnosis of AD. 38 To maintain reliable accuracy in early AD diagnosis, the MBAA would allow for the combined measurement of multiple biomarkers. With regard to specific biomarkers examined in this early AD diagnostic multiplex, levels of CSF biomarkers p-tau, t-tau, amyloid- β1-40/1-42, AD-associated NTP (AD7c-NTP), CSF YKL-40, and CSF cargo proteins should be measured. Generally, accuracy of assay AD diagnosis increases when more biomarkers are measured.43,46 In addition to the relatively proven diagnostic biomarkers (p-tau, t-tau, amyloid-beta), this recommended MBAA includes testing of AD7c-NTP, YKL-40, and CSF cargo proteins to improve diagnostic accuracy. These additional CSF proteins are among the more promising new biomarkers under investigation for AD diagnosis, and significant clinical trials are under way to further characterize their validity.38,43,44,46,96,97. It should be noted that this proposed assay is similar to the INNO-BIA AlzBio3 multiplex assay, which tests for Aβ1-42, t-tau, and p-tau.
In addition to assay testing of CSF biomarkers, imaging techniques may also aid in AD screening. When compared with current diagnostic methods, the clinical utility of FDG-PET has been shown to be significant. 80 Despite the diagnostic power of FDG-PET for AD, it is not a feasible option for repeat testing in early AD screening. A PET scan is costly and does expose the patient to radiation. However, FDG-PET may be useful for the examination of MCI patients. Research suggests that FDG-PET can accurately predict MCI conversion to AD, most likely because of the method’s high sensitivity. The literature further suggests that FDG-PET analysis can more accurately determine the conversion than can measurement of Aβ and tau levels. 98 Taking this into consideration, it is recommended that MCI patients complete a yearly FDG-PET scan to determine if and when conversion to AD occurs. In this way, the magnitude of neurodegeneration in the brain can also be better visualized. Should further research confirm the validity of FDG-PET in diagnosing MCI transition to AD, it may replace the need for measurement of CSF biomarkers in MCI patients.
With the incorporation of FDG-PET into the Alzheimer’s diagnoses timeline, an alternative diagnostic approach arises. This method would encompass a longitudinal at-risk patient evaluation in which serial MBAA measurement of the CSF biomarker begins early for the exclusive purpose of AD screening. Measurements cease when MCI symptoms begin and are replaced by serial FDG-PET scans for the purposes of AD surveillance.
Market Assessment
Currently, there is no FDA-sanctioned IVD test for AD. 99 Despite the lack of approved diagnostics, there are commercial LDTs available. The INNO-BIA AlzBio3 and the INNO-BIA Plasma (Aβ) Forms Assay are patented quantitative assay kits produced by Innogenetics that use the multiplex bead assay technique and have consistently produced accurate data in comparison with other assays. The test is performed on the Luminex 100 IS Total System, the Luminex 200 IS Total System, or the Bio-Plex 200 System. 100
In addition to the patents listed above, several antibodies for amyloid-beta and tau protein have been patented, as have a wide array of detection methods, including nucleic acid testing and glycosylated transferrin testing.101–107
With regard to AD diagnostic imaging, there are two in vivo diagnostic radiotracers approved by the FDA to aid in AD diagnosis: Amyvid (florbetapir-fluorine-18) in 2012 and Vizamyl (flutemetamol F18) in 2013. Both are drugs that help visualize the beta-amyloid plaques in the brain via PET imaging.
Barriers to Market Entrance
With an industrial opportunity for an FDA-approved IVD for AD, the potential regulatory avenues for device approval must be evaluated. The proposed immunoassay has comparable diagnostics in the LDT marketplace: the Athena Diagnostics ADmark, the INNOTEST ELISA, the INNO-BIA AlzBio3, and the INNO-BIA plasma Aβ. However, no diagnostic is FDA approved, and without a predicate device, a 510(k) cannot be filed to the FDA for diagnostic approval. Therefore, an application for premarket approval (PMA) must be filed to establish new clinical relevance and use. Unfortunately, the timeline for a PMA is expensive and extensive. The lack of AD therapies also reduces our potential market size for an FDA-approved diagnostic. Until further clinical validation of AD diagnostic biomarkers is discovered, development as an in-house LDT remains the best available option for an AD diagnostic array.
The Clinical Laboratory Improvement Amendments (CLIA) requires the laboratory to establish performance characteristics of its developed LDT before it can accept human samples for testing. 108 Experiments must be designed to establish accuracy, precision, reportable range, reference interval, and analytical sensitivity/specificity of the proposed diagnostic device.109,110 Although CLIA would require testing of the complete multiplex assay, this additional testing is likely to be minimal as the individual components of the test are well researched. The xMAP system is an established platform technology that has been extensively developed and is frequently used in research for diagnostic purposes. The clinical utility of the CSF biomarkers Aβ1-42, t-tau, and p-tau for AD diagnosis has been well documented in the laboratory. In addition, AD7c-NTP, CSF YKL-40, and CSF cargo proteins are all undergoing clinical trials for further validation as indicators for AD. It is the test’s combination of all of these biomarkers that establishes a multiplex assay likely to be more accurate in comparison with other available LDTs.
Despite the positive standing of multiplex assay validation, bringing an IVD device to the AD market remains problematic. The lack of standardized techniques makes diagnostic accuracy across all scenarios difficult to achieve. In addition, current AD diagnostic standards using evaluation of clinical presentation have maintained a high level of accuracy, which decreases market value of any assay or imaging biomarker test. Furthermore, there is no cure for the disease, and the few existing AD therapies are not ideal. For an early AD diagnostic test to be clinically useful, a sufficient AD therapy is needed. It is imperative that research and development toward standardization of AD biomarker testing continue—not only to improve patient outcome via early diagnosis but also to have an accurate diagnostic method available when a treatment is discovered.
Footnotes
Declaration of Conflicting Interests
The authors declared no potential conflicts of interest with respect to the research, authorship, and/or publication of this article.
Funding
The authors received no financial support for the research, authorship, and/or publication of this article.