
Abstract
Due to the rapid adoption and use of human induced pluripotent stem cells (iPSCs) in recent years, there is a need for new technologies that standardize the evaluation of iPSCs to allow the objective comparison of results across different experiments and groups. In this article, we present a noninvasive, fully automated, and analytical system for morphology-based evaluation of iPSC cultures that consists of time-lapse microscopy and novel image analysis software. The presented system acquires low-light phase-contrast images of iPSC growth collected during a period of several days in culture, measures geometrical- and texture-based features of iPSC colonies throughout time, and derives a set of six biologically relevant features to automatically rank the quality of the cell culture. In a study of 94 iPSC cultures, we demonstrated the accuracy of the system by comparing the automated ranking with an independent expert evaluation based on visual review of the time-lapse movies. To our knowledge, this is the first demonstration of a fully automated and objective assessment of iPSC culture quality using noninvasive methods.
Introduction
There has been significant progress in using induced pluripotent stem cells (iPSCs) for modeling of human disease by harvesting somatic cells from patients, reprogramming the somatic cells into a pluripotent state, and then differentiating the pluripotent cells into a specific cell type affected by the disease. Such disease-in-dish models hold great promise for treating a wide range of human diseases, and they are currently used for studying cellular disease mechanisms, drug screening, and toxicity testing. 1 Recent studies have demonstrated that recapitulating a disease phenotype in vitro is feasible for numerous monogenic diseases, confirming the transformative potential of iPSCs toward disease modeling and therapeutic testing.2–4
After reprogramming, iPSCs are expanded and maintained in culture through cell proliferation and passaging. Once the iPSCs have reached a time point of interest or specific passage number, they are characterized using a variety of assays, such as immunofluorescence, gene expression profiling, karyotyping, and methylation analysis. 5 Despite the diverse set of tools available to researchers today, there are limitations in the current practice of iPSC characterization. First, in most studies, characterization of iPSCs is performed at sparse time points, typically using antibody staining and requiring the sample to be destroyed. Second, the phenotypic quality of cell cultures is mainly assessed through snapshot visual examinations, which are limited in scope and accuracy. Third, iPSC experiments are prone to a high degree of variability from factors such as cell line stability, culture conditions, reagent lot differences, and user technique. As the use of iPSC technology continues to grow and thousands of new lines are created, there is a need for technologies that can standardize the evaluation of iPSC cultures to allow the objective comparison of results among multiple experiments and different laboratories. This is particularly important because the starting state of an iPSC culture is a determining factor in the eventual fate of the differentiated cells. Efforts toward standardization have been initiated by other groups; for example, recent studies in gene expression profiling have led to the development 6 and subsequent commercialization of real-time quantitative PCR assays that evaluate iPSC pluripotency and are designed to allow comparison of results against a global “scorecard” reference.
In this article, we present for the first time a noninvasive system for morphology-based evaluation of iPSC cultures via time-lapse microscopy and automated image analysis. We focus on the period of iPSC expansion and maintenance, when iPSCs are vulnerable to sporadic changes as well as variations in handling and culture. We believe that our system enables the fully automated and objective assessment of iPSC quality, which can be extended toward other types of cells. Unlike most other characterization techniques, our morphology-based analysis is noninvasive, thereby allowing samples to be continuously monitored without being disturbed, and it enables the direct evaluation of iPSCs in almost any application.
Materials and Methods
Overview
An overview of our system is illustrated in Figure 1 . The system includes imaging hardware, analytical software, and a cloud-computing platform to efficiently manage and process large quantities of imaging data. The system acquires low-light phase-contrast images of cells collected during a period of several days in culture and in standard dishes. The iPSC culture can be performed following standard culture protocols and in standard cell-culture plates, requiring no additional handling or variation to the common cell-culture practice. The images are automatically uploaded to the cloud (i.e., a computing server). The analytical software then processes images; measures geometric- and texture-based features of iPSC colonies throughout time; and, based on those features, computes a set of six biologically relevant features: iPSC doubling time, the degree of cell compaction, colony border spikiness, sensitivity to media change, the prevalence of dead cells, and the prevalence of spontaneously differentiated cells. The output of the system is the above feature set along with an automated ranking of iPSC cell cultures to good, fair, and poor categories based on a classification tree trained on the feature set extracted from training data (i.e., a set of images manually labeled by an expert).
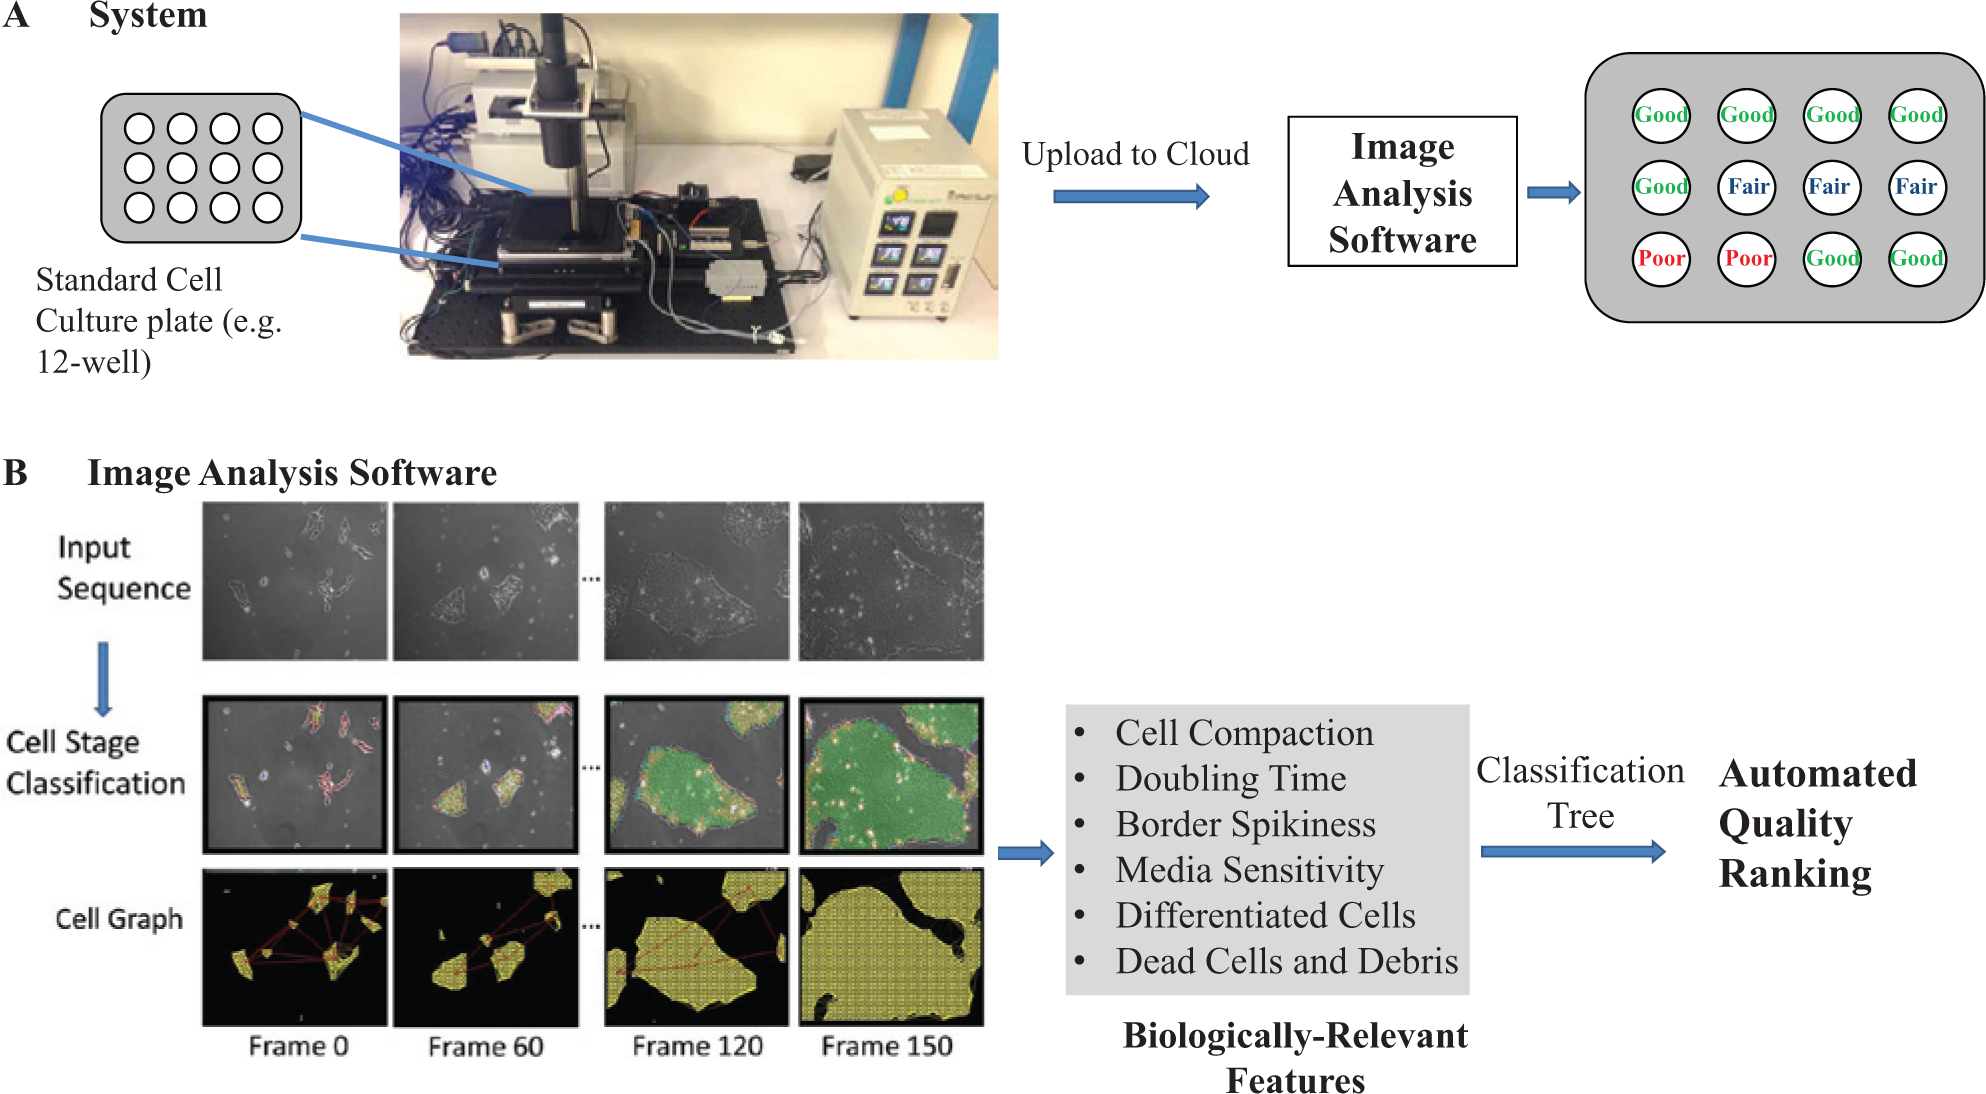
Overview of the presented system for induced pluripotent stem cell (iPSC) evaluation based on time-lapse microscopy and automated image analysis. (
For the purpose of development and validation of the software, we collected time-lapse image data of 94 iPSC cultures (12 separate clones among four iPSC lines) with six observations of each culture, resulting in a total of 564 time-lapse data sets. We used half of the data for training the classification tree to maximize correlation with the expert ranking of each data set, and we used the other half for validation. In the following sections of this article, we describe the details of the system, experiments, and results.
Imaging and Experiment Setup
The imaging system is constructed using 10× phase-contrast imaging objectives (Nikon), high-precision multiwell plate scanners and z-focus motors (Thorlabs), and 1.3 megapixel 2/3-in complementary metal oxide semiconductor monochrome cameras (Pixelink). The microscope is connected to a Windows-based personal computer, and image capture is controlled with custom-developed software. Images are saved in TIFF format with no additional compression. The multiwell plate scanner was configured to work with Tokai Hit stage-top incubators (model WSKM) that include precise temperature regulation via a thermocouple placed in one of the wells and temperature feedback control. Images are acquired using 625-nm low-light phase-contrast illumination.
A typical imaging experiment of iPSC culture involves imaging of cells every 30 min at multiple x–y locations per well to obtain an adequate sample of the cells, for 3–4 days or until the cells reach about 95% confluence. The images are acquired with seven images per z-stack to capture a range of focus. Media changes on the culture are performed during time intervals when the time-lapse images are not being captured.
In a single experiment that includes 12-well scanning and six observations per well, up to 100,000 images can be captured. To manage this large volume of data, directly after capture, images are automatically uploaded to a secure cloud-based system for subsequent processing and analysis. For each data set, a time-lapse movie is also generated with the optimal focal plane extracted from the z-stack.
Image Analysis Software
To analyze the iPSC image sequences, we developed robust and automated image analysis algorithms that capture cell dynamics and morphology throughout time. Different textural patterns of cells are observed in stem-cell colony formation. We have identified seven distinct cell-stage patterns, as shown in
Figure 2a
: single cells, medium compaction, full compaction, dead cells, differentiated cells, debris, and background. Medium-compaction cells are typically visible in small colonies via the presence of bright phase-contrast halos in between neighboring cells, whereas full-compaction cells are typically visible in medium- to large-sized colonies when cells are flat and in full contact with neighbors. Differentiated cells mostly appear as flat large cells without bright halos. Dead cells appear as bright regions with irregular texture. The prevalence and distribution of each class in the image provide valuable information about the stage, growth pattern, and quality of cells in the culture. For example, in some cases, medium-compacted cells can be a sign of stress or lack of proper culture conditions, whereas full-compacted cells can be a sign of healthy or good-quality cells. Differentiated cells are a sign of poor culture conditions and exhibit a different morphology than iPSCs. Taking advantage of machine-learning techniques in dealing with such data for which an explicit model is impossible to define, we used an extended version of our previously proposed method
7
to compute textural and intensity-based features from the images, and we built and trained a classifier to predict the label given the computed features. As presented in Maddah and Loewke,
7
every image is decomposed to overlapping blocks. For every block, the intensity histogram and local binary pattern
8
are calculated and concatenated, resulting in a one-dimensional feature vector per block. In the training image set in which the images are labeled manually, each block (and therefore each feature vector) is associated with a label. We generate a training matrix from this set, scaled to range between −1 and 1, to train a linear support vector machine (SVM) classifier9,10 with a Gaussian kernel. Parameters of the classifier are then optimized within a search range for each parameter to obtain the highest classification accuracy in predicting labels of training images using fivefold cross-validation, achieving 98% accuracy. Here, we followed the same approach but with two additional classes for background and debris, and larger block size. Once trained, the classifier is then applied to classify each foreground pixel in a given image to one of the seven cell stages. For regions that are classified as dead cells, further processing is performed to infer the type of region underneath them. For example, if a dead-cell region is surrounded by pixels classified as full compaction, that dead-cell region takes a new label that indicates dead cell on top of full-compaction region. If the dead-cell region is mostly surrounded by the background, it keeps the class label of dead cells.
Figure 2b
shows the result of classification for four different frames (see also
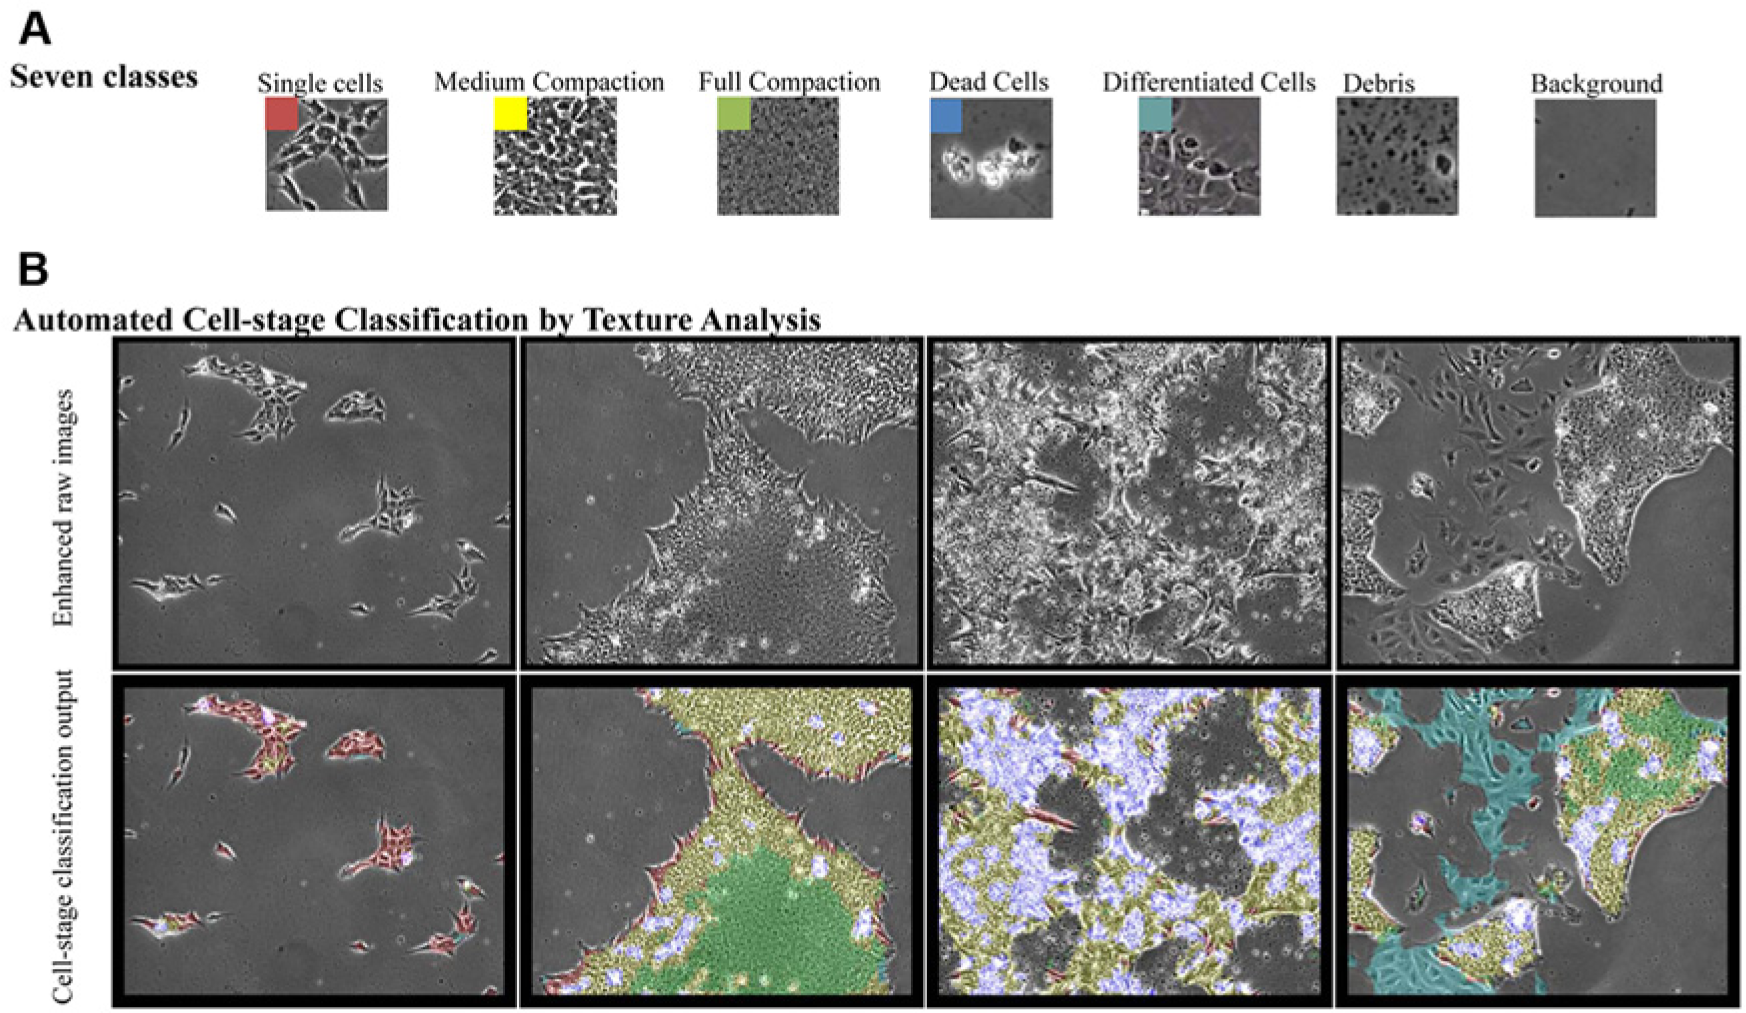
Classification of induced pluripotent stem cells (iPSCs) into seven different classes using texture information and machine learning. (
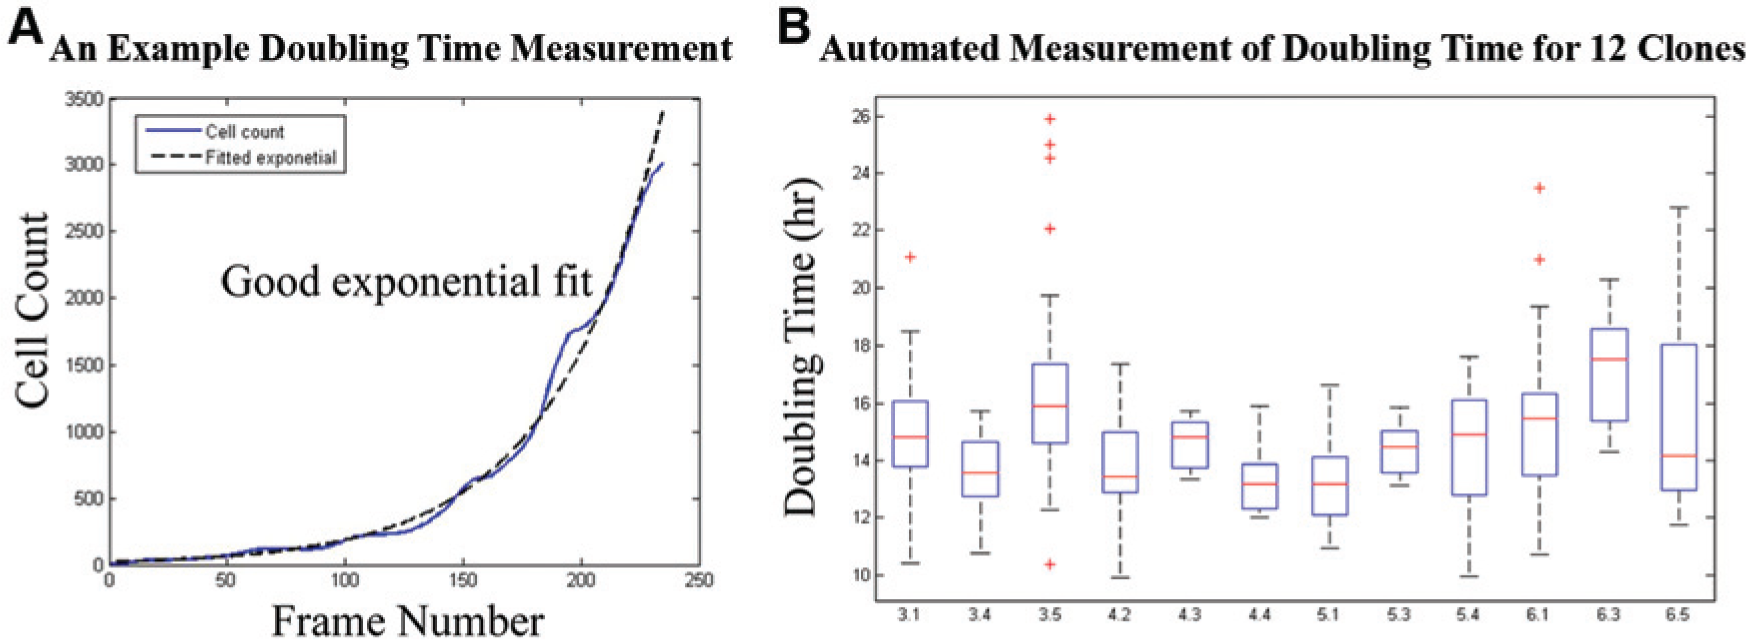
Automated, noninvasive measurement of induced pluripotent stem cell (iPSC) doubling time based on cell-stage classification. (
To robustly capture the connectivity and dynamics of colonies, we construct a geometric graph in which the nodes of the graph are defined by the uniform sampling of each cluster. The edges are formed by constructing the Delaunay triangulation between the nodes, and they are weighted by the inverse of geodesic distance between the nodes. The geodesic distance is the shortest path between the nodes constrained by the foreground regions ( Fig. 1b ). A graph-based feature that manifested itself as a robust measure of the quality of iPSCs is the percentage of weak edges in the graph, which represents the spikiness of colony borders. Poor organization of colonies (e.g., holes in the colonies) or spikiness of borders results in edges with low weight (high geodesic distance value), due to the absence of a straight line connecting the nodes that passes through the foreground pixels.
We used all the raw geometric- and texture-based features to identify metrics that correlated best with the expert ranking of training data. The resulting biologically relevant features are as follows:
Degree of cell compaction: The percentage of full-compacted cells, averaged among the frames with 70–90% confluence. This period is obtained using the total cell-cluster area and is relative to the field of view of the image.
Doubling time: As described, the doubling time is calculated from a cell-count curve estimated by cell-stage classification.
Sensitivity to media change: We observed that some iPSCs exhibit sensitivity to media change, in which the colony size retracts temporarily. To quantify this feature, we measure the magnitude of drops in the cell-cluster area. The sum of drops throughout time is used as the measure of media sensitivity.
Colony-border spikiness: We use the percentage of weak edges in the graph analysis within the 70–90% confluence period as a measure of the edge spikiness of large growing colonies.
Prevalence of dead cells and debris: A high prevalence of dead cells or debris can also be a sign of low-quality iPSCs. These features are computed by the average percentage of dead cells and debris throughout time.
Prevalence of differentiated cells: Due to nonideal cell-culture conditions or poor quality of iPSC lines, the culture may contain nonpluripotent cells that have spontaneously differentiated. Detecting and quantifying the number of those cells in the culture are determinative factors in assessing the quality of cell lines and their culture. This feature is defined as the average prevalence of differentiated cells throughout time.
After creating measurements of these six features for all training data, we computed their conditional probability distributions with class labels of good, fair, and poor (see Fig. 4a ). Examples of class labels are shown in Figure 4b , which were independently assigned by an expert biologist who visually examined each time-lapse movie. Based on the probability distributions, we defined a set of ranges for each feature that would result in the highest prediction accuracy in our training data, as shown in Figure 4c . Per-position predictions (six observations in each well) were then summarized in a single prediction for each well based on the majority rule. The features with the highest predictive power are the degree of cell compaction and the doubling time, followed by the colony-border spikiness and sensitivity to media change. We found that the prevalence of dead cells and differentiated cells did not increase the accuracy of our prediction in the training data; however, these features still provide relevant information and may be applied to other data sets to identify poor-quality cultures.
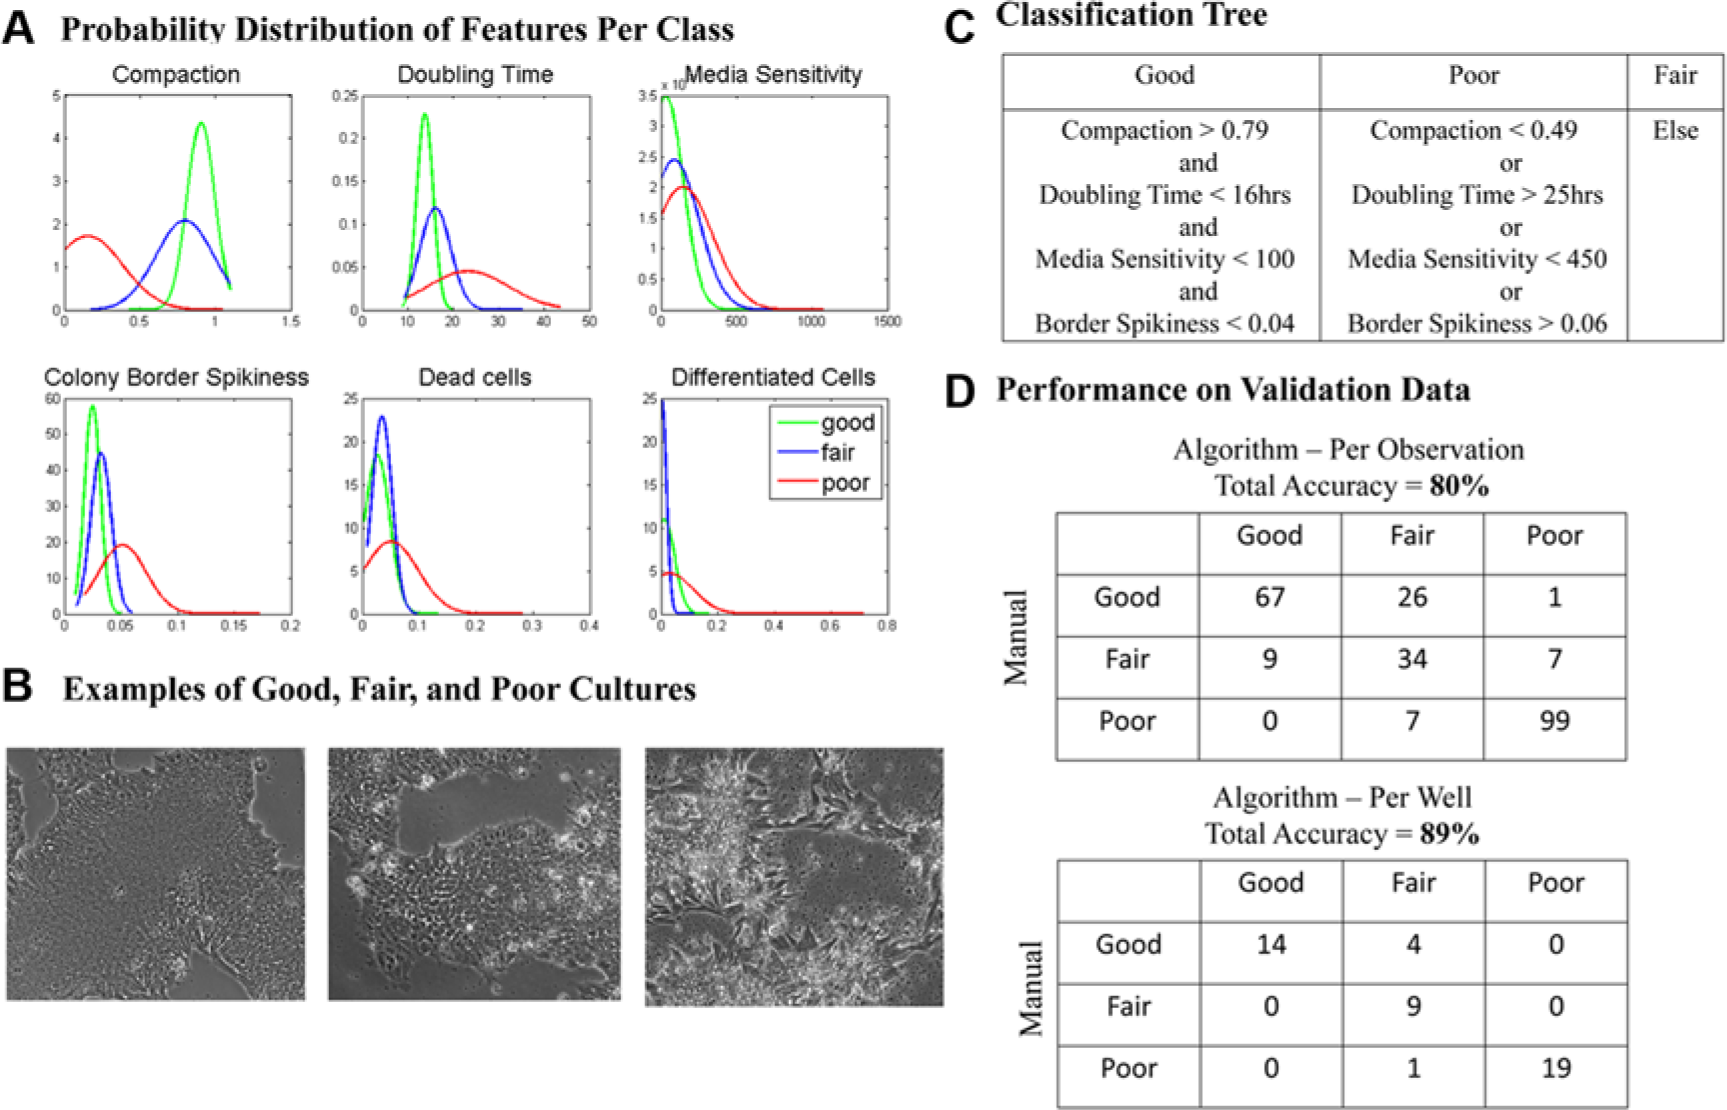
Three-tiered ranking system for induced pluripotent stem cell (iPSC) quality based on automated feature measurement. (
Experiment
Cell Culture
Using the Sendai Reprogramming Kit (Life Technologies), we reprogrammed skin fibroblasts purchased from the Coriell Institute (http://ccr.coriell.org)—two healthy patients and two patients with LRRK2 mutations—into iPSCs.11,12 We selected and tested 16 iPSC clones from the four patient fibroblast lines for consistent human pluripotent colony morphology, presence of normal karyotype, clearance of Sendai virus, and expression of pluripotent markers (
Data Collection
For this study, we collected time-lapse image data of 94 iPSC cultures (12 separate clones among four iPSC lines;
Results and Discussion
We present a system for automated iPSC evaluation that includes noninvasive time-lapse microscopy and analytical software. We collected more than 500 time-lapse movies of iPSC growth among 12 different clones. We used half of the data to develop and train a classifier of iPSC quality based on a set of six relevant biological features: iPSC doubling time, degree of cell compaction, colony-border spikiness, sensitivity to media change, the prevalence of dead cells, and the prevalence of spontaneously differentiated cells. We independently tested the software on the other half, achieving an overall classification accuracy of 80% per position (with six positions per well) and 89% accuracy per well. Of all the features we examined, the degree of cell compaction and the doubling time were shown to be the features with the highest predictive power in determining the quality of iPSC cultures. Our results show the following: (1) A higher percentage of full-compacted cells in large growing colonies is associated with high-quality iPSCs; (2) slower doubling time is associated with lower iPSC quality; (3) higher colony-border spikiness and sensitivity to media change are associated with lower-quality iPSCs; and (4) higher prevalences of dead cells and differentiated cells were found in poor-quality cultures. As shown in Figure 4d , the highest incidence of mismatch occurred on cultures that were ranked as good by manual review and fair by the algorithm, indicating that the algorithm is slightly more stringent in assigning a good rating.
The ranking showed no statistical correlation with line identity, indicating that our ranking system is primarily addressing the overall quality of the culture and environmental conditions, rather than inherent qualities associated with the individual lines that we tested. One of the features, iPSC doubling time, however, can potentially be used to identify line-specific trends. As shown in Figure 3b , by taking measurements of doubling time among multiple experiments (under normal culture conditions), we can evaluate the average doubling times as well as the variation among experiments (through the distribution of each boxplot). Based on our demonstration of measuring doubling time in an automated and noninvasive manner, we anticipate that our methods will enable future larger-scale studies on iPSC doubling time.
Our experiments with nonideal environmental conditions in the cell culture produced interesting results. We observed that low-CO2 conditions generated changes in iPSC cell-compaction patterns as well as increased cell death, whereas low-temperature conditions slowed down iPSC growth and generated an increased amount of spontaneously differentiated cells. Performing media changes every other day resulted in an increased sensitivity to media changes, but it had no apparent effect on other features such as compaction patterns or doubling time. With time-lapse imaging and our image-analysis tools, these variations in the quality of cell cultures can be captured and quantified.
Given the successful outcome of the presented study, we plan to conduct future studies that will involve collection of data from a larger number of lines, and with experiments conducted by other labs and personnel following their own standard protocols to cover cell-line differences as well as operator variability in passaging, plating, and culture. We anticipate that our overall framework will be fully applicable among a broad range of input data, although refinement and retraining of certain algorithm modules based on a more complete data set will likely be needed. One drawback of this approach is that if a cell-culture protocol changes the morphology of cell stages significantly, then retraining of the algorithm will be needed in both cell-stage classification and cell densities per class. In addition, a limitation of our method is that our quality metrics are based on visual features, rather than a direct measurement of underlying biological processes. Future work may address this issue by performing correlative studies to examine the relationship between morphology-based features and biological assays such as gene-expression profiling or integrated cell-culture (ICC) characterization.
We believe that our results demonstrate the first fully automated and objective assessment of iPSC cultures using noninvasive methods. We anticipate future commercial applications of our system, including characterizing the dynamic response of cells to stress and drugs, implementing quality control during the manufacture of stem-cell reagents, evaluating new protocols and testing changes to existing ones, developing new types of media and other reagents, testing reagent lots, and training new scientists and technicians on the aforementioned activities. We also anticipate that these methods can be applied to quantify the dynamics of other types of cells, including, for example, looking at growth patterns and doubling times of cancer cells.
Footnotes
Acknowledgements
We thank Azucena Lemus for assistance with cell culture and ICC characterization, and Renee Reijo Pera, Matt Burkhardt, and Mike Hasak for helpful discussions and review of the manuscript.
Declaration of Conflicting Interests
M. Maddah and K. Loewke are the shareholders of Cellogy Inc.
Funding
The work for this article was funded by Cellogy Inc.
References
Supplementary Material
Please find the following supplemental material available below.
For Open Access articles published under a Creative Commons License, all supplemental material carries the same license as the article it is associated with.
For non-Open Access articles published, all supplemental material carries a non-exclusive license, and permission requests for re-use of supplemental material or any part of supplemental material shall be sent directly to the copyright owner as specified in the copyright notice associated with the article.