
Abstract
This study investigated a new method of flow cytometry (FCM) for analysis of red blood cell (RBC) osmotic fragility. Venous peripheral blood collected in a sampling tube coated with EDTA 2Na was analyzed using FCM to determine RBC osmotic fragility. RBCs were represented as a double-peaked forward scatter (FSC) histogram in FCM. RBCs showed ballooning and spherical shape change in hypotonic solutions before hemolysis. The ballooning of RBCs was expressed as a disappearance of the minor peak and by narrowing and a shift to the right of the FSC histogram. The process of hemolysis was expressed as shrinking of the RBC cytogram in the right upper quadrant on the scatter plot of side scatter versus FSC and by emergence of a cell debris cytogram in the left lower quadrant. The ratio of intact RBCs in hypotonic solution was available as an indicator of osmotic fragility. Acidic solution made erythrocytes less tolerant to hypotonic solution by inducing spherical shape change. In conclusion, FCM can be used to assess RBC osmotic fragility.
Flow cytometry (FCM) has allowed tremendous advances in the fields of immunology and hematology. While a wide variety of flow cytometric techniques have been developed to analyze leukocyte characteristics and functions, the use of flow cytometry for analysis of erythrocytes has been relatively limited. The present study introduces a new method for analysis of red blood cell (RBC) osmotic fragility using FCM.
Materials and Methods
Blood Sample
Venous peripheral blood was drawn from the forearm of healthy volunteers using vacuum blood sampling tubes coated with EDTA 2Na. The blood samples were kept at room temperature until FCM analysis. FCM was carried out within 1 h after blood sampling. The healthy volunteers had not taken any medication for at least 1 month before blood sampling. The samples were thoroughly checked to exclude inappropriate samples, such as clot formation and obvious hemolysis, before experiment.
Peripheral Blood Count
Hemoglobin (Hb) concentration, hematocrit (Ht), mean corpuscular volume (MCV), and mean corpuscular hemoglobin (MCH) were measured using an automatic blood cell analyzer (HEG-L; Sysmex Co., Kobe, Japan).
FCM
Before FCM, 0.5 mL of blood was washed with 2 mL of phosphate-buffered saline (PBS) and centrifuged at 1000 rpm for 5 min. After the supernatant was discarded, 2 µL of blood was suspended in 1 mL of PBS adjusted at various osmotic pressures with distilled water for 3 min. Approximately 10,000 RBCs were analyzed in a scatter plot of side scatter (SSC) versus forward scatter (FSC) and an FSC histogram using FACScan and Cell Quest analyzing software (Becton Dickinson, San Francisco, CA).
Comparison between Hemolysis Rate of RBCs and Lactate Dehydrogenase Concentration in the Supernatant
The serum was discarded to minimize the contamination of serum lactate dehydrogenase (LDH). After two washings with normal saline solution, 200 µL of RBCs was mixed with 1 mL of normal saline solution/distilled water mixture adjusted at various osmotic pressures ranging from 0 to 300 mOsm. Then, the LDH in the supernatant and the hemolysis rate of the RBCs were measured using Labospect 008 (Hitachi Co., Tokyo, Japan) and FACScan (Becton Dickinson), respectively.
Statistical Analysis
Comparison between the two groups was performed using the paired or unpaired t test. When comparing three or more groups of data, the Scheffé F test was used as a post hoc test, and significance was set at a value less than 0.05 after analysis of variance. All measured values are presented as the mean ± SD. Spearman’s correlation coefficients were calculated to determine the correlation between the size of RBCs and FSC and between the percentages of hemolyzed RBCs and LDH concentration in the supernatant.
Ethical Considerations
This study was conducted following the guidelines for the use of biological samples for clinical tests by the Japanese Society of Clinical Laboratory Medicine and was approved by the ethics committee of Akita University Graduate School of Medicine.
Results and Discussion
RBC Shape and Cytogram
The RBC cytogram in the scatter plot of SSC versus FSC had a dense right half and a less dense left half. The right and left halves represented the major and minor peaks in the FSC histogram, respectively. The mean value of the FSC histogram, representing the size of RBCs, correlated with MCV ( Fig. 1 ).
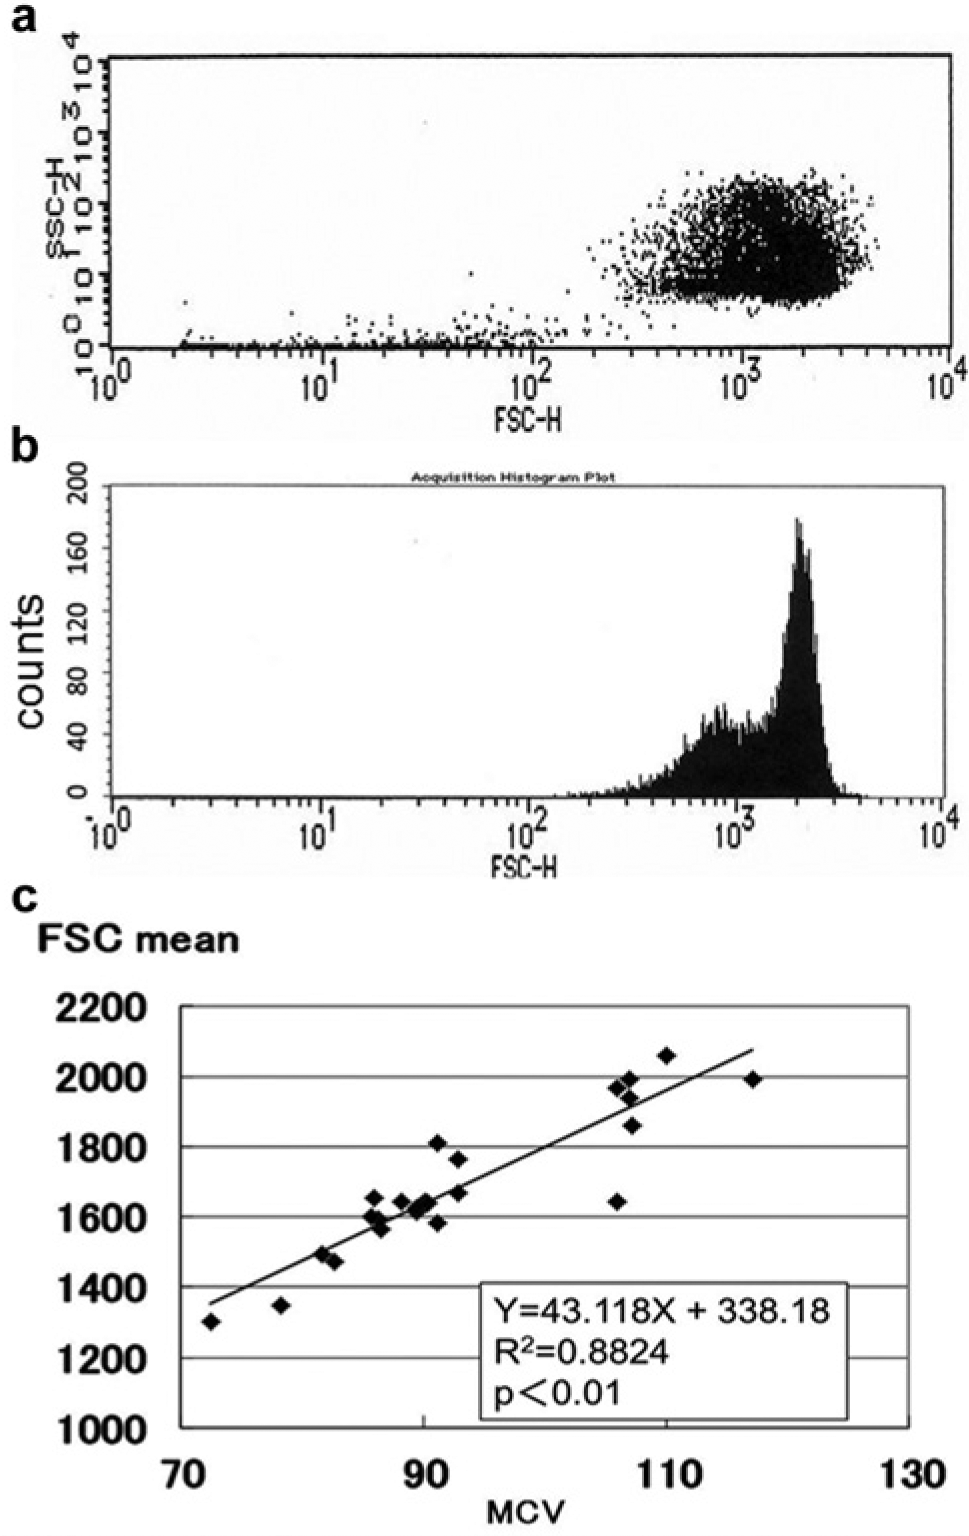
Cytogram and forward scatter histogram of red blood cells (RBCs). Scatter plot of side scatter (SSC) versus forward scatter (FSC) of RBCs (
Shape Change in Hypotonic and Hypertonic Solution
RBCs suspended in hypotonic (140 mOsm) solution became larger in diameter and more spherical in shape under microscopic observation. As a result, the FSC histogram showed a shift to the right, a narrower base, and disappearance of the minor peak. When these RBCs were washed and resuspended in isotonic (280 mOsm) solution, the shape and FSC histogram returned to normal ( Fig. 2 ).
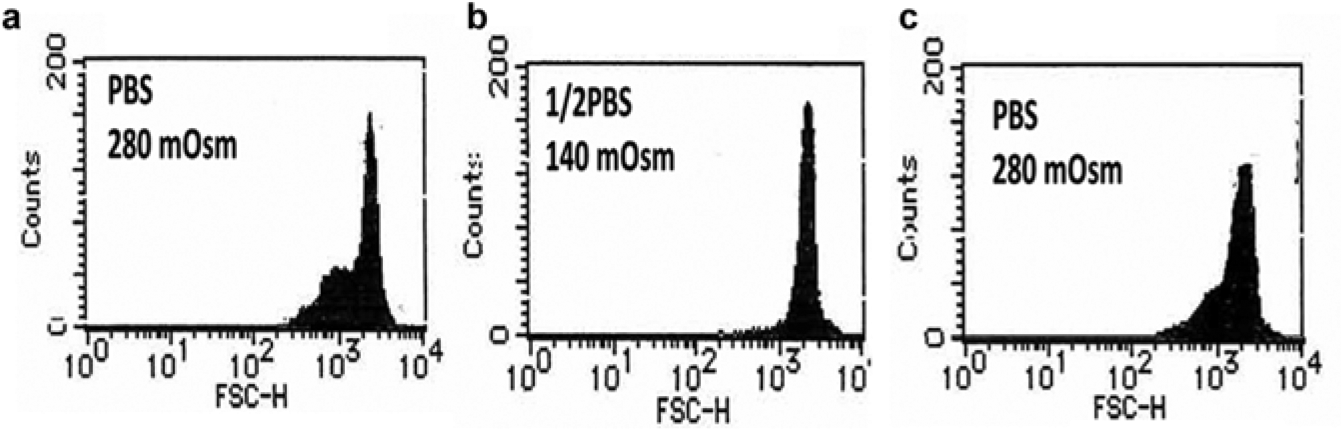
Reversible change in red blood cell (RBC) shape suspended in hypotonic solution. The forward scatter (FSC) histograms of RBCs suspended in isotonic solution (
Hemolytic Test in Healthy Volunteers
As shown in Figure 2 , the shape of RBCs exposed to hypotonic solution was reversible until they reached the point of hemolysis. When RBCs reached the point of hemolysis, the intracellular contents spouted out of the corpuscle, which was accompanied by a decrease of the SSC and FSC on the cytogram. As a result, hemolyzed RBCs moved to the left lower quadrant of the scatter plot of SSC versus FSC, and intact RBCs stayed in the upper right quadrant ( Fig. 3 ). The rate of hemolyzed RBCs, that is, 1 – (cell counts in the upper right quadrant / total cell counts) × 100 (%) on the scatter plot, had a strong correlation with the LDH concentration of the supernatant of the sample ( Fig. 4 ). In this experiment, serum was removed and RBCs were washed twice with normal saline solution before hemolysis to avoid serum LDH contamination, which may vary under various circumstances such as liver disease and neoplasms. FCM was carried out within 1 h after blood sampling because the hemolytic rate slightly but significantly increased thereafter (data not shown). Applying this method, RBC osmotic fragility was investigated. The percentage of intact RBCs showed a gradual decrease until they were exposed to 50% saline solution, and then, a sudden decrease of intact RBCs occurred between the exposures to 50% and 40% PBS ( Fig. 5 ). Although this method may not explicitly provide osmotic fragility measured by a conventional test, the RBC hemolytic curve obtained with this method was compatible with that obtained by the conventional method. 1 Exposure to acidic conditions induced ballooning of RBCs, which was represented as an increase in FSC and a decrease in SSC. As a result, RBCs suspended in PBS adjusted at pH 6.5 became less tolerant to hypotonic solution ( Fig. 6 ). Hemolysis of RBCs in hypotonic solution is caused by influx of water into the cell. As shown in this study, the increase of FSC and the decrease of coefficient of variation (CV) of the FSC histogram indicated the increase of RBC volume and spherical shape change, respectively. RBC membrane functions, such as deformability2,3 and oxygen transport, 4 are altered by multiple factors, including aging 2 and several pathological conditions, such as diabetes mellitus5,6 and sepsis. 7 Aged RBCs are smaller in size and more fragile than young RBCs. Flow cytometric analysis of RBC shape was described by Piagnerelli et al 8 in 2007. In this study, the spherical shape change of RBCs before hemolysis in hypotonic solution as well as in acidic solution was clearly demonstrated by FCM. Recently, Won and Suh 9 and Warang et al 10 reported a sensitive and specific FCM method for detection of hereditary spherocytosis that focused on hemolysis after deionized water spiking. RBCs obtained from two patients with hereditary spherocytosis were easily discriminated by their increased osmotic fragility using our method (data not shown). The osmotic fragility test demonstrated in this report is simple and requires no chemical reagents. Further applications of this method for quantitative evaluations of pathological conditions accompanying RBC fragility are expected.
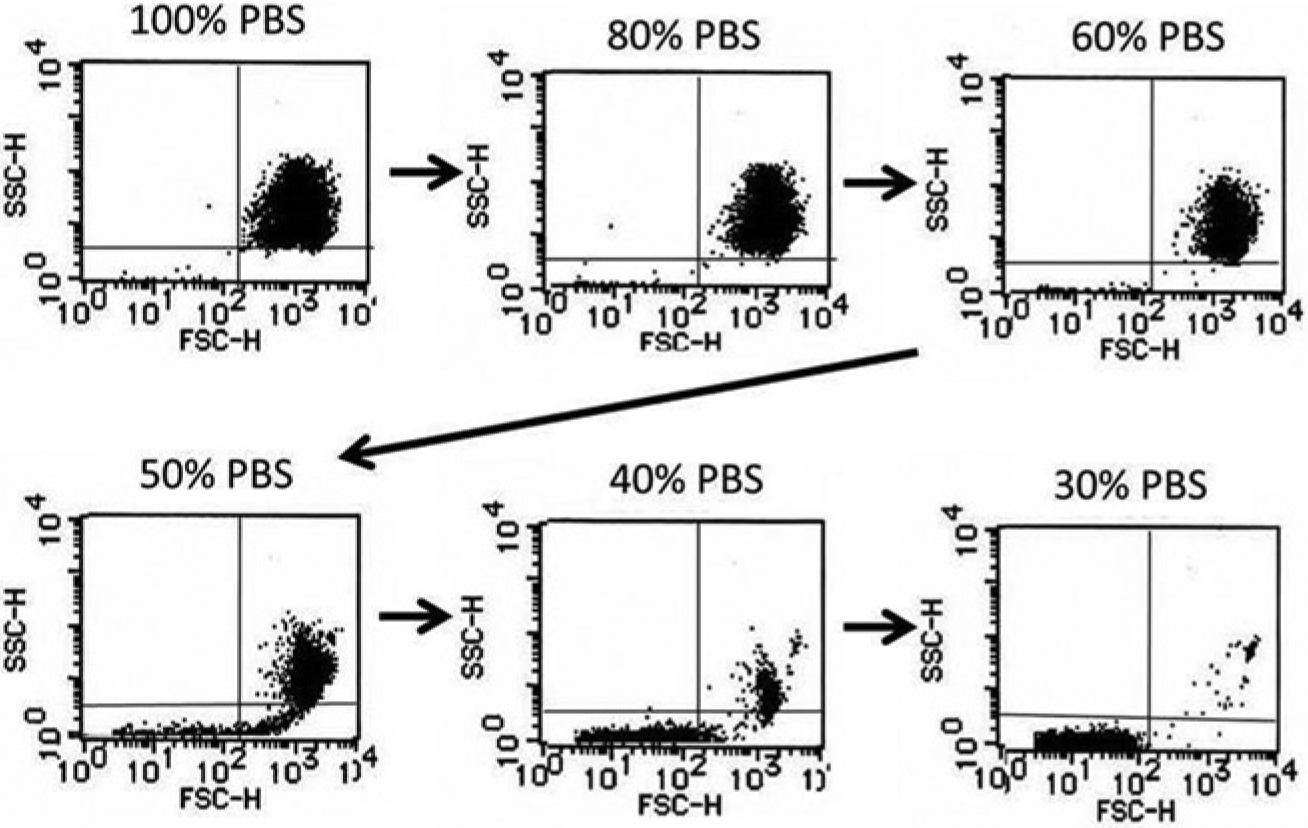
Change of dot-plot cytogram induced by hemolysis. Intact red blood cells (RBCs) are plotted on the right upper quadrant in the scatter plot of side scatter (SSC) versus forward scatter (FSC). Hemolyzed RBCs shrink and move to the left lower quadrant (right lower panel). The formula indicating the hemolytic rate (%) is (1 − cell count in the right upper quadrant / total cell count) × 100. PBS, phosphate-buffered saline.
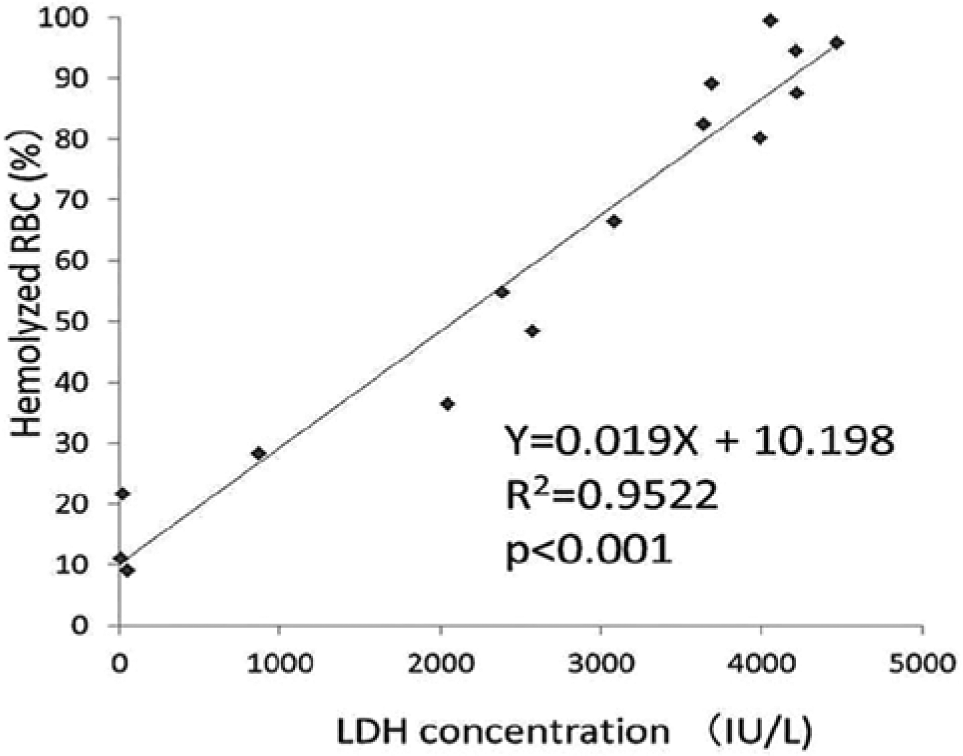
Correlation between lactate dehydrogenase (LDH) and hemolytic rate. The percentage of hemolyzed red blood cells (RBCs) calculated from the cytogram correlates with the LDH concentration of the sample supernatant (n = 15).
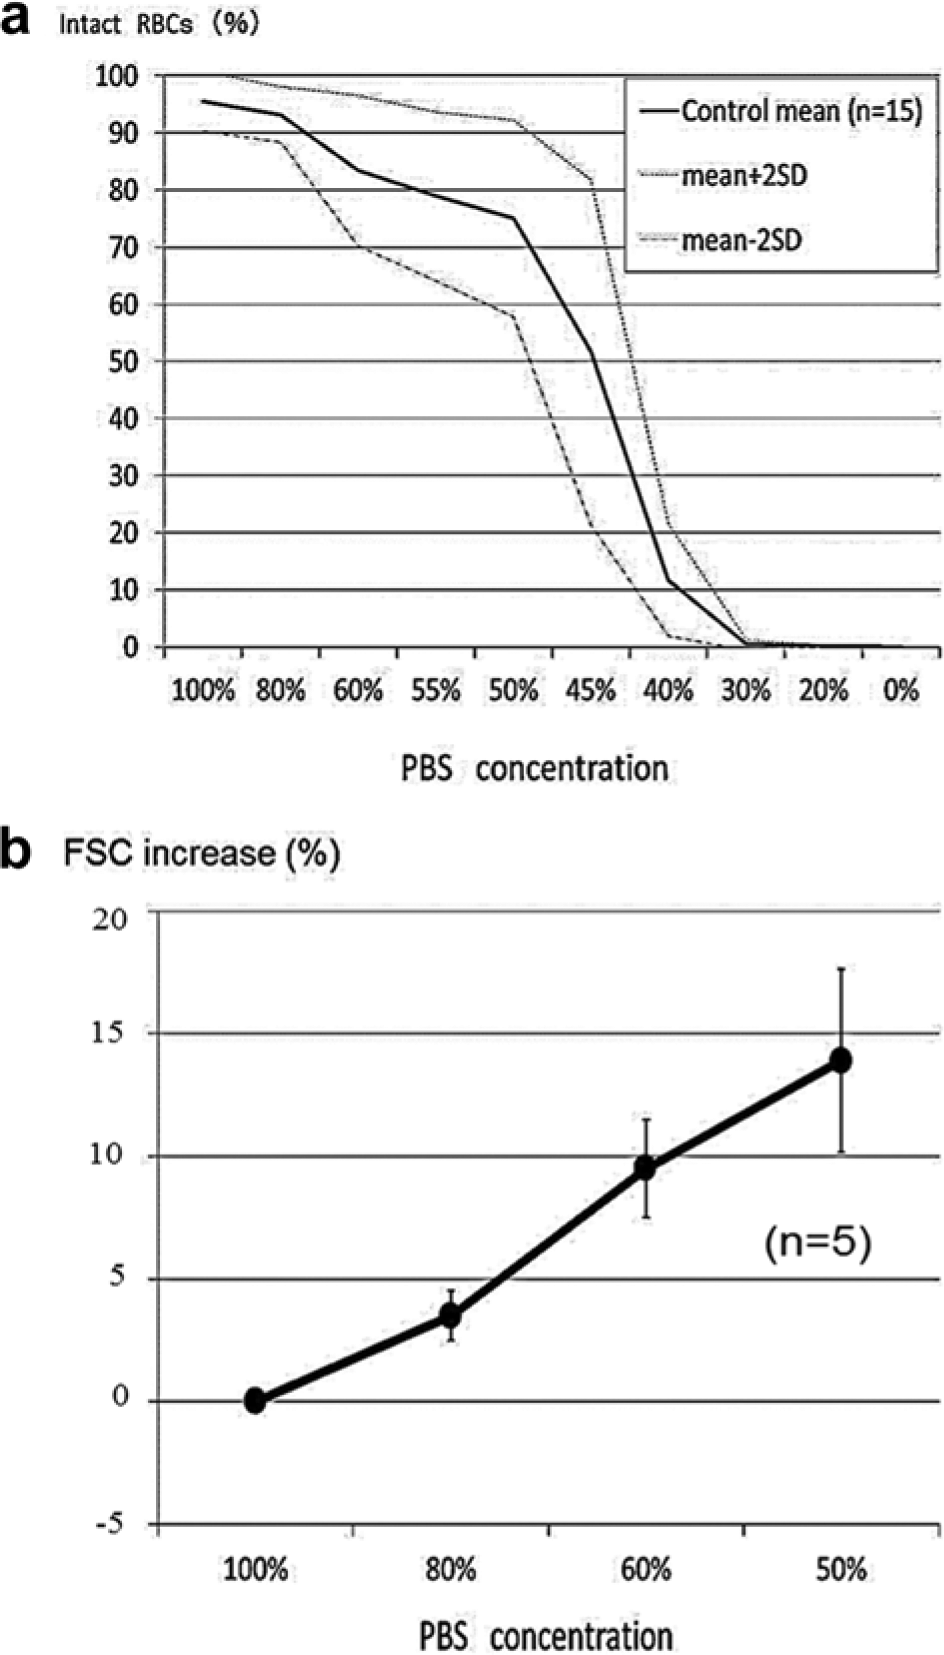
Red blood cell (RBC) osmotic fragility curve obtained by flow cytometry (FCM). The RBC hemolytic curve in the present study (
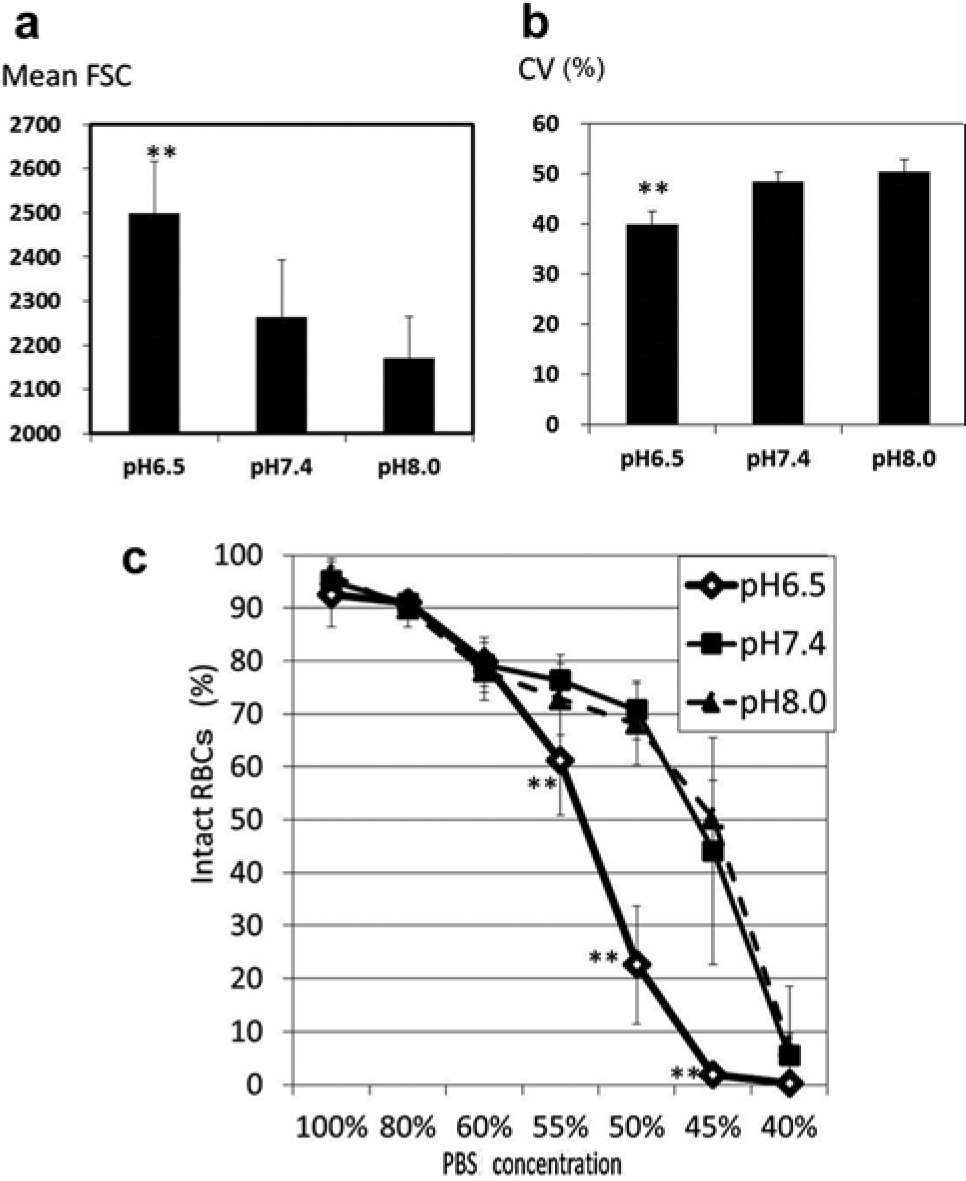
Effect of pH on red blood cell (RBC) osmotic fragility. Exposure to acidic conditions, but not alkaline conditions, increases forward scatter (FSC) on the RBC cytogram (
Footnotes
Acknowledgements
We thank Dr. Yumiko Kamata of Akita University Hospital for her technical assistance in flow cytometry.
Declaration of Conflicting Interests
The authors declared no potential conflicts of interest with respect to the research, authorship, and/or publication of this article.
Funding
The authors disclosed receipt of the following financial support for the research, authorship, and/or publication of this article: This study was supported by a Grant-in-Aid for Exploratory Research (No. 23659292) from the Japanese Society for the Promotion of Science.