
Abstract
CXCR3 is a chemokine receptor, upregulated upon activation of T cells and expressed on nearly 100% of T cells in sites of inflammation. SCH 900875 is a selective CXCR3 receptor antagonist. Thrombocytopenia and severe hemolytic anemia with acanthocytosis occurred in rats at doses of 75, 100, and 150 mg/kg/day. Massively enlarged spleens corresponded histologically to extramedullary hematopoiesis, macrophages, and hemosiderin pigment and sinus congestion. Phagocytosed erythrocytes and platelets were within splenic macrophages. IgG and/or IgM were not detected on erythrocyte and platelet membranes. Ex vivo increased osmotic fragility of RBCs was observed. Lipid analysis of the RBC membrane revealed modifications in phosphatidylcholine, overall cholesterol, and/or sphingomyelin. Platelets exhibited slender filiform processes on their plasma membranes, analogous to those of acanthocytes. The presence of similar morphological abnormalities in acanthocytes and platelets suggests that possibly similar alterations in the lipid composition of the plasma membrane have taken place in both cell types. This phenotype correlated with alterations in plasma lipids (hypercholesterolemia and low triglycerides) that occurred after SCH 900875 administration, although other factors cannot be excluded. The increased cell destruction was considered triggered by alterations in the lipid profile of the plasma membranes of erythrocytes and platelets, as reflected morphologically.
Keywords
Introduction
SCH 900875 is a selective, noncompetitive, high-affinity CXCR3 receptor antagonist. CXCR3 is a seven-transmembrane G protein-coupled chemokine receptor. In the rat, CXCR3 is predominantly expressed constitutively on CD45RC+ CD8+ T cells and some Natural Killer (NK) cell populations, with low or no expression on total CD4+ or CD4+ CD45RC+ T cells or on circulating B cells, monocytes, or neutrophils. Upon in vitro activation of rat T cells, CXCR3 expression is typically upregulated. CXCR3 is expressed on nearly 100% of tissue-infiltrating T cells and Th1 cells and mediates the transendothelial migration and recruitment of effector T cells to inflamed tissues in response to its ligands Mig (CXCL9), IP-10 (CXCL10), and I-TAC (CXCL11). The marked upregulation of CXCR3 ligand expression and the increased number of CXCR3+ leukocytes in chronically inflamed tissues indicates the importance of CXCR3-mediated recruitment in the pathology of chronic inflammatory diseases (Kunkel et al. 2002; Mahad et al. 2003; Mohan et al. 2005; Qin et al. 1998; Rottman et al. 2001; Segerer et al. 2004). As predicted, treatment with SCH 900875 significantly delayed disease onset and attenuated disease severity in animal models of collagen-induced arthritis, experimental autoimmune encephalomyelitis, and dermal inflammation (unpublished data, Schering-Plough Research Institute Lafayette, NJ).
Preclinically, genetic toxicology, safety pharmacology in rats and monkeys, and reproductive toxicology studies in rats and rabbits did not show any significant test article-related findings (unpublished data, Schering-Plough Research Institute). SCH 900875 was not photomutagenic, and no cutaneous or ocular toxicity was observed in pigmented Long-Evans rats. It was evaluated in 3-month rat and cynomolgus monkey studies with little adverse effect at daily doses of 10, 30, and 60 mg/kg in rats and 3, 10, and 30 mg/kg in monkeys. Clinical pathology findings in rats included a minimal decrease in hematocrit with reticulocytosis, thrombocytopenia and neutrophilia, higher serum cholesterol, and lower serum triglycerides. In monkeys, transient decreases in erythroid mass parameters with regenerative response were present at week 3/4. All these findings were reversible following a 1-month postdose recovery period. A 1-month immunotoxicity study in rats at doses of 10, 30, and 60 mg/kg showed no effects on NK cell activity or T-cell-dependent antibody response (TDAR). Increased total lymphocyte counts were seen in males at 30 mg/kg (primarily attributed to increased helper T lymphocytes) and in both sexes at 60 mg/kg (all lymphocyte subsets increased with the exception of B lymphocytes and NK T lymphocytes in females). Recovery was complete after a 28-day postdose period. During the course of the 3-month dose-range-finding study in rats at higher doses, moderate thrombocytopenia and severe regenerative hemolytic anemia with acanthocytosis developed unexpectedly. Herein we describe the pathology observed in this study and the investigations conducted to determine the causes of the hemolytic anemia and thrombocytopenia and to assess the significance for human risk assessment.
Cytopenias are the most common drug-induced hematologic complications and are classified into two broad categories: cytopenias caused by decreased production by the bone marrow and those resulting from an increased destruction of cells (Vandendries and Drews 2006). Among the latter, drug-induced hemolytic anemias are well-recognized serious adverse effects that, mechanistically, occur via immunologic or nonimmunologic destruction (Bloom and Brandt 2008). Immunologic destruction of erythrocytes, mediated by the interaction of IgG or IgM antibodies on the surface of erythrocytes, has been implicated for a large number of drugs acting via several different mechanisms for which penicillin, quinidine, and α-methyldopa are prototypes (Vandendries and Drews 2006; Bloom and Brandt 2008). Nonimmune hemolytic anemia, in contrast, comprises three main categories, consisting of microangiopathic anemias usually induced by some chemotherapeutic agents; oxidative injury with characteristic Heinz body formation caused by drugs like phenacetin and phenylhydrazine; and paroxysmal nocturnal hemoglobinuria, which occurs with benzene, vitamin C, or anti-thymocyte globulin (Vandendries and Drews 2006; Bloom and Brandt 2008). Similarly, excessive destruction of platelets may be immune-mediated such as seen after exposure to penicillin, quinidine, gold, or mitomycin; or it may occur via nonimmunologic mechanism, after exposure to GM-CSF, IL-2, or snake venom, for instance. Nothing in the chemical structure, pharmacology, and biological activity of SCH 900875 predicted the destruction of red blood cells and platelets that was observed in rats. This study describes the pathogenesis of an unusual drug-induced hemolysis and thrombocytopenia associated with acanthocytosis.
Materials and Methods
Test Compound
SCH 900875 was synthesized as a mesylate salt. Dosing solutions were prepared weekly in 0.4% (w/v) aqueous methylcellulose at concentrations of 15, 20, and 30 mg/ml.
Test System
Ninety-four male and female Sprague-Dawley (Rat/Crl:CD® [SD] VAF/Plus®) rats (Charles River Laboratories, Inc., Kingston, NY), 6 weeks of age and weighing 177 to 226 g (males) and 132 to 181 g (females) at dosing initiation, were assigned to the toxicity portion of the study. The rats were housed individually in suspended, stainless-steel cages in a temperature- (72 ± 4 F) and humidity-controlled (30-70%) environment with a 12-hour light/dark cycle and provided Certified Rodent LabDiet® 5002 (PMI Nutrition International, Inc., Richmond, IN) and drinking water (automatic watering system) ad libitum. All animal care and procedures were in accordance with the Guide for the Care and Use of Laboratory Animals (National Research Council 1996).
Experimental Design
Study Design
After an acclimation period, the rats were randomly assigned to treatment groups (toxicity portion: 10 rats/sex/group) based upon body weight and sex using an online data collection/management system (PROVANTIS). Rats were dosed once daily orally by gavage with SCH 900875 at 75, 100, or 150 mg/kg in 0.4% (w/v) aqueous methylcellulose for 97 or 98 days. Control rats received vehicle alone. Doses for this study were selected based on the results of a previous 3-month study in rats at doses of 10, 30, and 60 mg/kg, in which only limited toxicity was observed. Clinical observations were made twice daily, and body weights and food consumption were recorded weekly. Ophthalmologic examinations were done once pretest and during weeks 5 and 13. Blood samples for hematology, coagulation assays, and serum chemistry were performed during weeks 5/6 and 13/14. Samples were obtained on week 3 for the high-dose female rats sacrificed on day 20. Urinalysis was done during the 24 hours preceding the scheduled hematology/serum chemistry evaluations. Plasma concentrations of SCH 900875 and its metabolite SCH 769676 were determined in EDTA-anticoagulated blood samples obtained on days 0 and 65 from rats assigned to the satellite portion of the study (toxicokinetic animals: 15 rats/sex/group) at 1, 2, 4, 8, and 24 hours postdose (3 rats/sex/group/timepoint).
Pathology
Following an overnight fast, rats were exsanguinated under isoflurane anesthesia, and a complete necropsy was performed at the end of the study. Absolute and relative (to body weight) weights of the adrenal glands, brain, epididymides, heart, kidneys, liver, lungs, ovaries, pituitary gland, ventral prostate gland, spleen, testes, thymus, thyroid glands, and uterus were recorded. All organs/tissues were fixed in 10% neutral buffered formalin, embedded in paraffin, sectioned at 3-5 μm, and stained with hematoxylin and eosin (H&E). Special stains included Prussian blue or Perl’s stain for iron on spleen, liver, and kidney to demonstrate the presence of hemosiderin and Hall’s stain for bile in the liver. All analyses described herein were done on animals surviving to the scheduled necropsy, with the exception of immunohistochemistry and transmission electron microscopy on the spleen, which were done on high-dose female rats (group sacrificed on day 20).
Immunohistochemistry
Immunohistochemistry was performed on the spleens of high-dose females sacrificed on day 20 to determine whether IgG and/or IgM antibodies were adhered to the plasma membrane of erythrocytes. Antibodies used were the goat anti-rat IgG, Fc γ fragment specific and goat anti-rat IgM, μ chain specific (Jackson ImmunoResearch Laboratories, West Grove, PA). Plasma cells present in the tissue in all slides provided an internal immunopositive control.
Transmission Electron Microscopy
To look for platelets and erythrocytes phagocytosed by splenic macrophages, sections of formalin-fixed spleens from selected female rats (nos. 3501, 3505, and 3508) from the 150 mg/kg dose group were further processed for transmission electron microscopic examination. The samples were fixed in sodium-cacodylate-buffered 2.5% glutaraldehyde and postfixed in 2% buffered osmium tertroxide. The samples were then rinsed, dehydrated through a graded series of ethanols, cleared in 2 changes of propylene oxide, and embedded in resin. Sections were cut at 60-90 nm, stained with uranyl acetate and lead citrate, and examined on a Philips CM10 transmission electron microscope.
Scanning Electron Microscopy
Platelet morphology was assessed on blood collected in EDTA tubes containing 2.5% glutaraldehyde and 0.12M cacodylate buffer from the abdominal aorta during week 14/15 from 2 control rats (nos. 104M, 502F), 3 middose females (nos. 2503F, 2504F, 2506F), and 1 high-dose male (no. 3001M). After centrifugation, the superficial buffy coat was drawn off and captured on a Nucleopore® membrane filter. The samples were washed, dehydrated, and dried in situ using the critical point method, then sputter coated with Au/Pd and observed at 5kV using an Hitachi S-520 scanning electron microscope.
Direct Flow Cytometric Erythrocyte and Platelet Immunofluorescence Assay
The presence of IgG and/or IgM antibodies on the plasma membrane of erythrocytes and platelets was examined by flow cytometry according to the method described by Quigley et al. (2001) on whole blood collected from all rats/group on week 5 (erythrocyte) and from the first 5 rats/group from the control, middose females, and high-dose males on week 10 (platelets). Antibodies used were the goat anti-rat IgG FITC (Bethyl Laboratories, Montgomery, TX) and mouse anti-rat IgM FITC (Clone HIS49; BD Bioscience, San Jose, CA). Data were acquired on a FACSCalibur flow cytometer (Becton Dickinson Biosciences, San Jose, CA).
In Vitro Red Blood Cell Osmotic Fragility Assay
To assess the hemolytic potential of SCH 900875 and its metabolite SCH 769676 in rat blood, 15 μg/ml of SCH 900875 and 1.2 μg/ml of SCH 769676 alone and in combination were added to freshly collected EDTA-anticoagulated rat blood and exposed to increasingly hypotonic solutions of saline. Concentrations of the drug and its metabolite were selected to be equivalent to the concentrations at Cmax found in rat plasma following administration of 150 mg/kg of SCH 900875. Hemolysis was determined spectrophotometrically, using a Becton DU 800 spectrophotometer, and expressed as a percentage of maximal hemolysis induced by the positive control (2% Triton-X 100). Data were expressed as lytic concentration 50% (LC50), the highest concentration of NaCl assayed that produced hemolysis ≥ 50% of maximal.
Ex Vivo Red Blood Cell Osmotic Fragility Assay
Hemolysis of EDTA-anticoagulated whole blood collected on week 10 from the first 5 rats/group from control, middose females, and high-dose males and diluted with increasingly hypotonic solutions of saline was determined spectrophometrically. Data were acquired on a Becton DU 800 spectrophotometer, and percentage hemolysis was calculated relative to 0.150% NaCl as positive control. Data were expressed as lytic concentration 50% (LC50), the highest concentration of NaCl assayed that produced hemolysis ≥ 50% of maximal.
Red Blood Cell Membrane Lipid Analysis
Analysis of phospholipids, sphingomyelin, and cholesterol was performed on blood collected from the first 5 rats/group from all dose groups surviving to scheduled euthanasia. Approximately 80 μL packed red blood cells from EDTA-anticoagulated whole blood were added to 3 mL 71% methanol and frozen at –80°C. Methods for analysis of various lipid components are described in the sections below.
Phospholipid Quantification for Analysis by Mass Spectrometry
Phospholipid quantity was determined by assessment of lipid phosphorus in fractions isolated using Bligh and Dyer extraction protocol. Briefly, fractions were dried under N2, heated to 150°C for 2 hr with 0.4 mL perchloric acid, cooled to room temperature, and excess perchloric acid neutralized with 1 mL of 4.5M KOH. Samples were centrifuged at 2,000 × g for 10 min to pellet the potassium perchlorate precipitate and the supernatant removed for analysis of lipid phosphorous (Itaya and Ui 1966).
Characterization of Cholesterol Using Liquid Chromatography-Atmospheric Pressure Mass Spectrometry (LC-APCI-MS)
Lipids were extracted using the method of Bligh and Dyer (1959). Separation and identification of cholesterol and its esters was accomplished using HPLC with atmospheric pressure chemical ionization mass spectrometry (Saldanha et al. 2006) and phospholipid mass determined using a microphosphate assay (Itaya and Ui 1966). Cholesterol was identified based on its retention time; co-elution with internal standards; and mass to charge (m/z) ratios of 386.6 (total cholesterol), 384.6 (hydroxycholesterol), and 370.6 (degraded cholesterol, or fragmented cholesterol without water). Overall cholesterol levels included total cholesterol (m/z 386.6), hydroxycholesterol (m/z 384.6), and degraded cholesterol (m/z 370.6). Select data fit the Dixon’s Q-tests criteria as being statistically calculated outliers at greater than the 90% level and were excluded from calculation of group means.
Characterization of Phospholipids and Sphingomyelin Using Electrospray Ionization Mass Spectrometry (ESI-MS)
Lipids were extracted from RBC (~ 1 × 10⁶ cells) using chloroform and methanol according to the method of Bligh and Dyer (1959) at 4°C. Lipid extract samples (500 pmol/μL) were prepared by reconstituting in chloroform:methanol (2:1, v/v). Mass spectrometry was performed as described previously (Taguchi et al. 2000). Samples were analyzed using a LCT Premier time of flight mass spectrometer (Waters, Milford, MA) equipped with an electrospray ion source. Samples (5 μL) were introduced by means of a flow injector into the ESI source at a rate of 0.2 mL/min. The elution solvent was acetonitrile:methanol:water (2:3:1, v/v/v) containing 0.1% (w/v) ammonium formate (pH 6.4). The mass spectrometer was operated in the positive ionization mode. The flow rate of nitrogen drying gas was 10 L/min at 80°C. The capillary and cone voltages were set at 2.5 kV and 30V, respectively. Qualitative identification of individual phospholipid molecular species was based on their calculated theoretical monoisotopic mass values, and quantification was done by comparison to the most abundant phospholipid in each sample (typically 758.5 or 34:2 phosphatidylcholine). For sphingomyelins, species studied included 16:0, 18:0, 20:0, 22:1, and 24:1. Data were also analyzed based on total abundance of all sphingomyelin species.
Immunophenotyping Analysis of Circulating Leukocytes
To characterize the circulating lymphocyte populations, flow cytometric analysis was performed on EDTA-anticoagulated blood samples collected during the 10th week of dosing. Naïve, memory, and activated lymphocytes (T, B, and NK cells) and activated monocytes were determined by multiparameter flow cytometry. A total of 20 μl of whole blood was incubated with 5 μg rat Fc block for 10 min at room temperature to block nonspecific binding. Final antibody dilutions in cocktails were either 1:100 (FITC, APC, PerCP conjugates) or 1:200 (PE conjugates). The following antibodies were used: CD3 (1F4), CD4 (Ox35 and W3/25), CD8 (OX8), CD25 (OX39), CD161a (10/78), CD62L (HRL1), RT1B (OX-6), and CD45RA (OX33) (all obtained from BD Biosciences, except for CD4 [W3/25], which was obtained from Caltag, Carlsbad, CA). Matched fluorochrome-conjugated isotype antibodies were used as controls. Plates were acquired on a FACS Calibur flow cytometer (BD Biosciences) and analyzed with FlowJo software (Treestar, Ashland, OR). For analysis of T-cell subpopulations, leukocytes were gated sequentially on CD3, and then CD4 or CD8. To assess the activation state of T cells, CD25, RT1B, and CD62L expression was determined on CD3+, CD4+, and CD8+ cells. Activated cells were defined as either RT1B+ or CD25+ or by a reduction in mean fluorescence intensity for CD62L. CD45RC expression on T cells was used to differentiate naïve and/or revertant (CD45RC+) versus memory (CD45RC–) T cells. CD45RA expression was used to identify B cells, and the mean fluorescence intensity of RT1B (HLA-DR) was used to assess their activation state. CD3 and CD161 were used to identify NK (CD3–, CD161Hi) and NK-T (CD3+, CD161+) cells. Circulating monocytes were identified as CD410 CD3–, and the mean fluorescence intensity of RT1B was used to assess their activation state. Data for each relevant cell population was reported as the percentage of parent cell population, and statistical analysis was carried out using one-way ANOVA. Values for each treated group were compared with the vehicle control group using the Dunnett’s multiple comparison test. Statistical significance was assigned at p < .05.
Measurement of Circulating Serum Cytokine and Chemokines
The levels of serum mediators were determined on rat serum from blood collected during week 14/15 using Mesoscale analysis (Mesoscale Discovery [MSD], Gaithersburg, MD; CXCL1, CCL2, GM-CSF, IL-1β, IL-4, IL-6, IFNγ, TNFα) or ELISA (R&D Systems, Minneapolis, MN; IL-2 and IL-10). For analysis by ELISA, serum samples were assayed in duplicate together with control standards according to the manufacturer’s instructions. The optical density was determined using a micro-plate reader (Spectra MAX 190, Molecular Devices, Sunnyvale, CA), and the concentration of the mediators was calculated using SOFTmax PRO (Molecular Devices). Analysis by MSD was performed using the rat 8 plex MSD plate according to the manufacturer’s instructions, and the signal was measured on a MSD plate reader (SECTOR Imager 6000). Statistical analysis was performed as above.
Results
Four females at 150 mg/kg were found dead on days 18 and 20. Main clinical signs of toxicity in these rats were abdominal distention, hypoactivity, dehydration, and pallor. As a result of these mortalities and clinical signs, the remaining high-dose females were sacrificed on day 20 for humane reasons. Pertinent macroscopic findings at day 20 necropsy included jaundice and massively enlarged spleens. Subcutaneous edema and hydrothorax were also observed in some of the high-dose females. A 36.3% reduction in mean body weight gain and a 22.3% decrease in mean food consumption (grams/kg/day) were observed in the high-dose females compared with controls on day 14. In contrast, males in the high-dose group only exhibited urogenital staining and loose/soft stool and a 9.3% decrease in mean body weight and a 14.1% decrease in mean body weight gain compared with controls on day 96. Interestingly, mean food consumption in mid-dose females was increased by 7-27% (grams/animal/day) (+27.3% on day 96) during the course of the study compared with controls. No test-article-related changes in mean food consumption were observed in females in the low-dose group or in males. Ophthalmologic examination was unremarkable throughout the study.
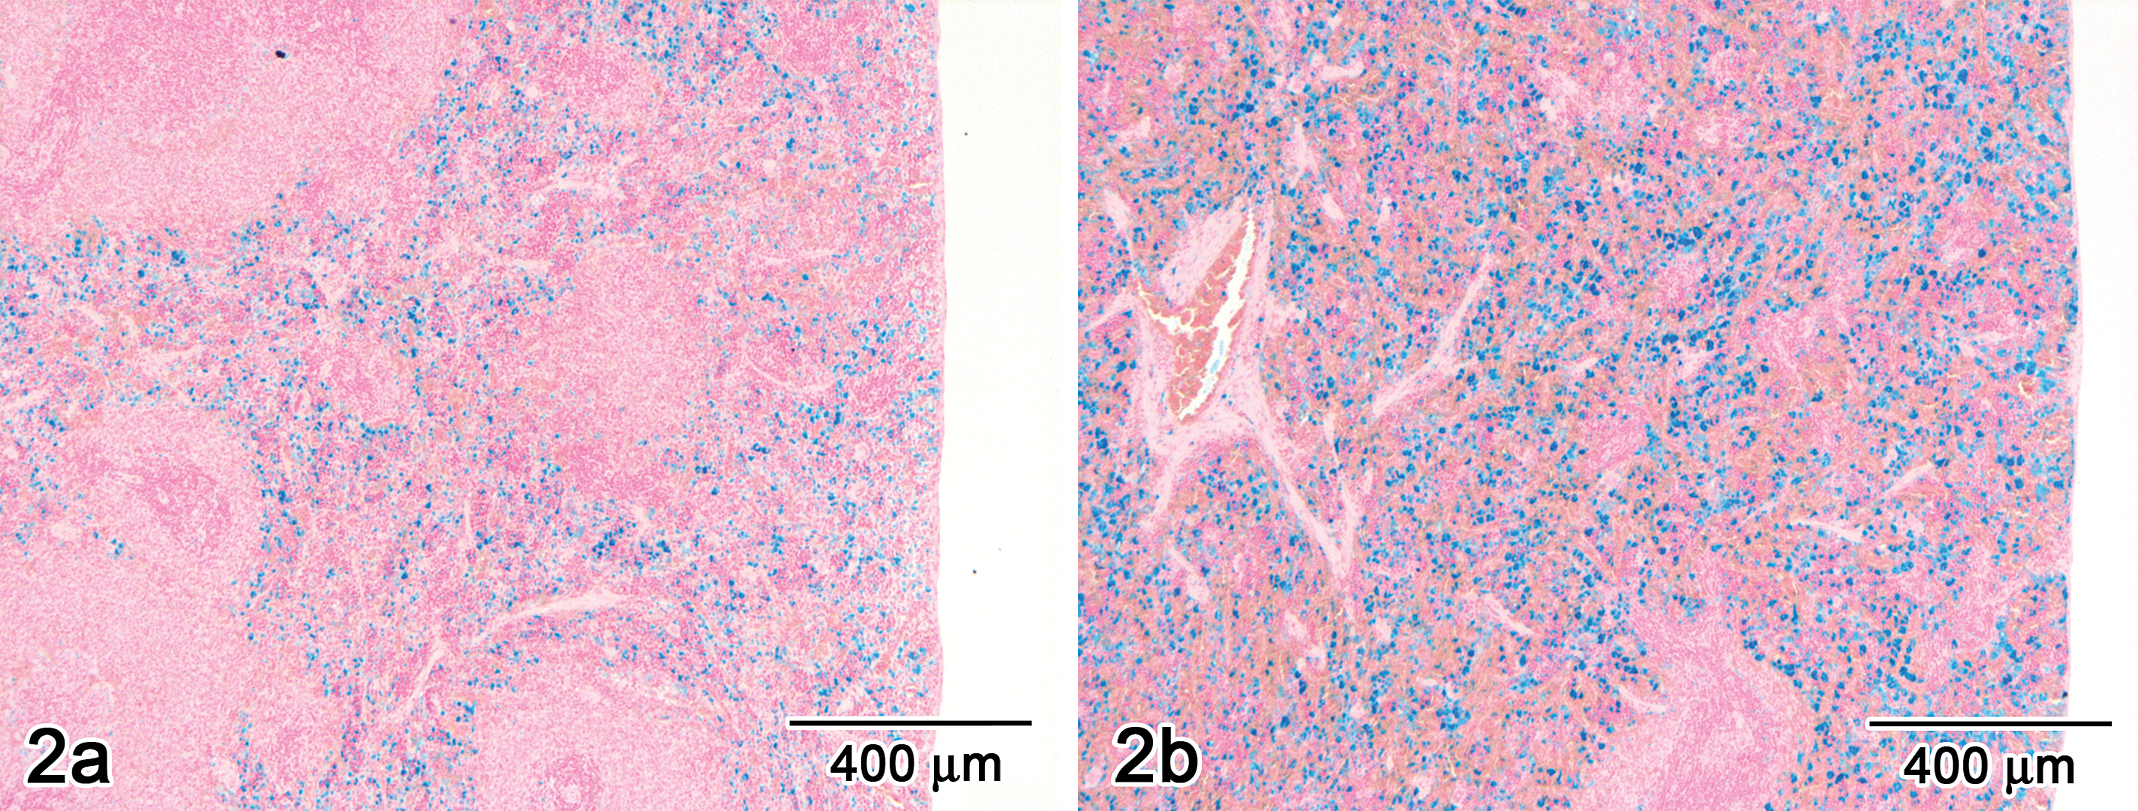
Only the SCH 900875-related findings that are pertinent to this article will be presented here; findings affecting other organ systems were deemed not contributory to this case and beyond the scope of this article. At terminal necropsy, the spleen of males and females at all doses was massively enlarged (Figure 1 ), and the mean absolute and relative spleen weights were higher than those of concurrent controls (Table 1 ). Microscopically, the spleen (Figure 2 ), liver, and bone marrow exhibited evidence of florid hematopoiesis and/or hemosiderin pigment accumulation (as demonstrated by Prussian blue or Perl’s stain for iron). Histopathologic findings in the spleen consisted of extramedullary hematopoiesis (responsible in large part for the enlargement observed at necropsy), accumulation of macrophages and hemosiderin pigment, and sinus congestion. Minimal to mild hypertrophy of Kupffer cells, hemosiderin pigment accumulation, and extramedullary hematopoiesis were observed in the liver. Hall’s stain for bile was not remarkable. A small amount of hemosiderin pigment was detected in the tubular cells of the kidney (Figure 3a). Other kidney changes included vacuolation of the tubular epithelial cells (inner stripe), tubular cast(s), and focal tubular basophilia (Figure 3b).
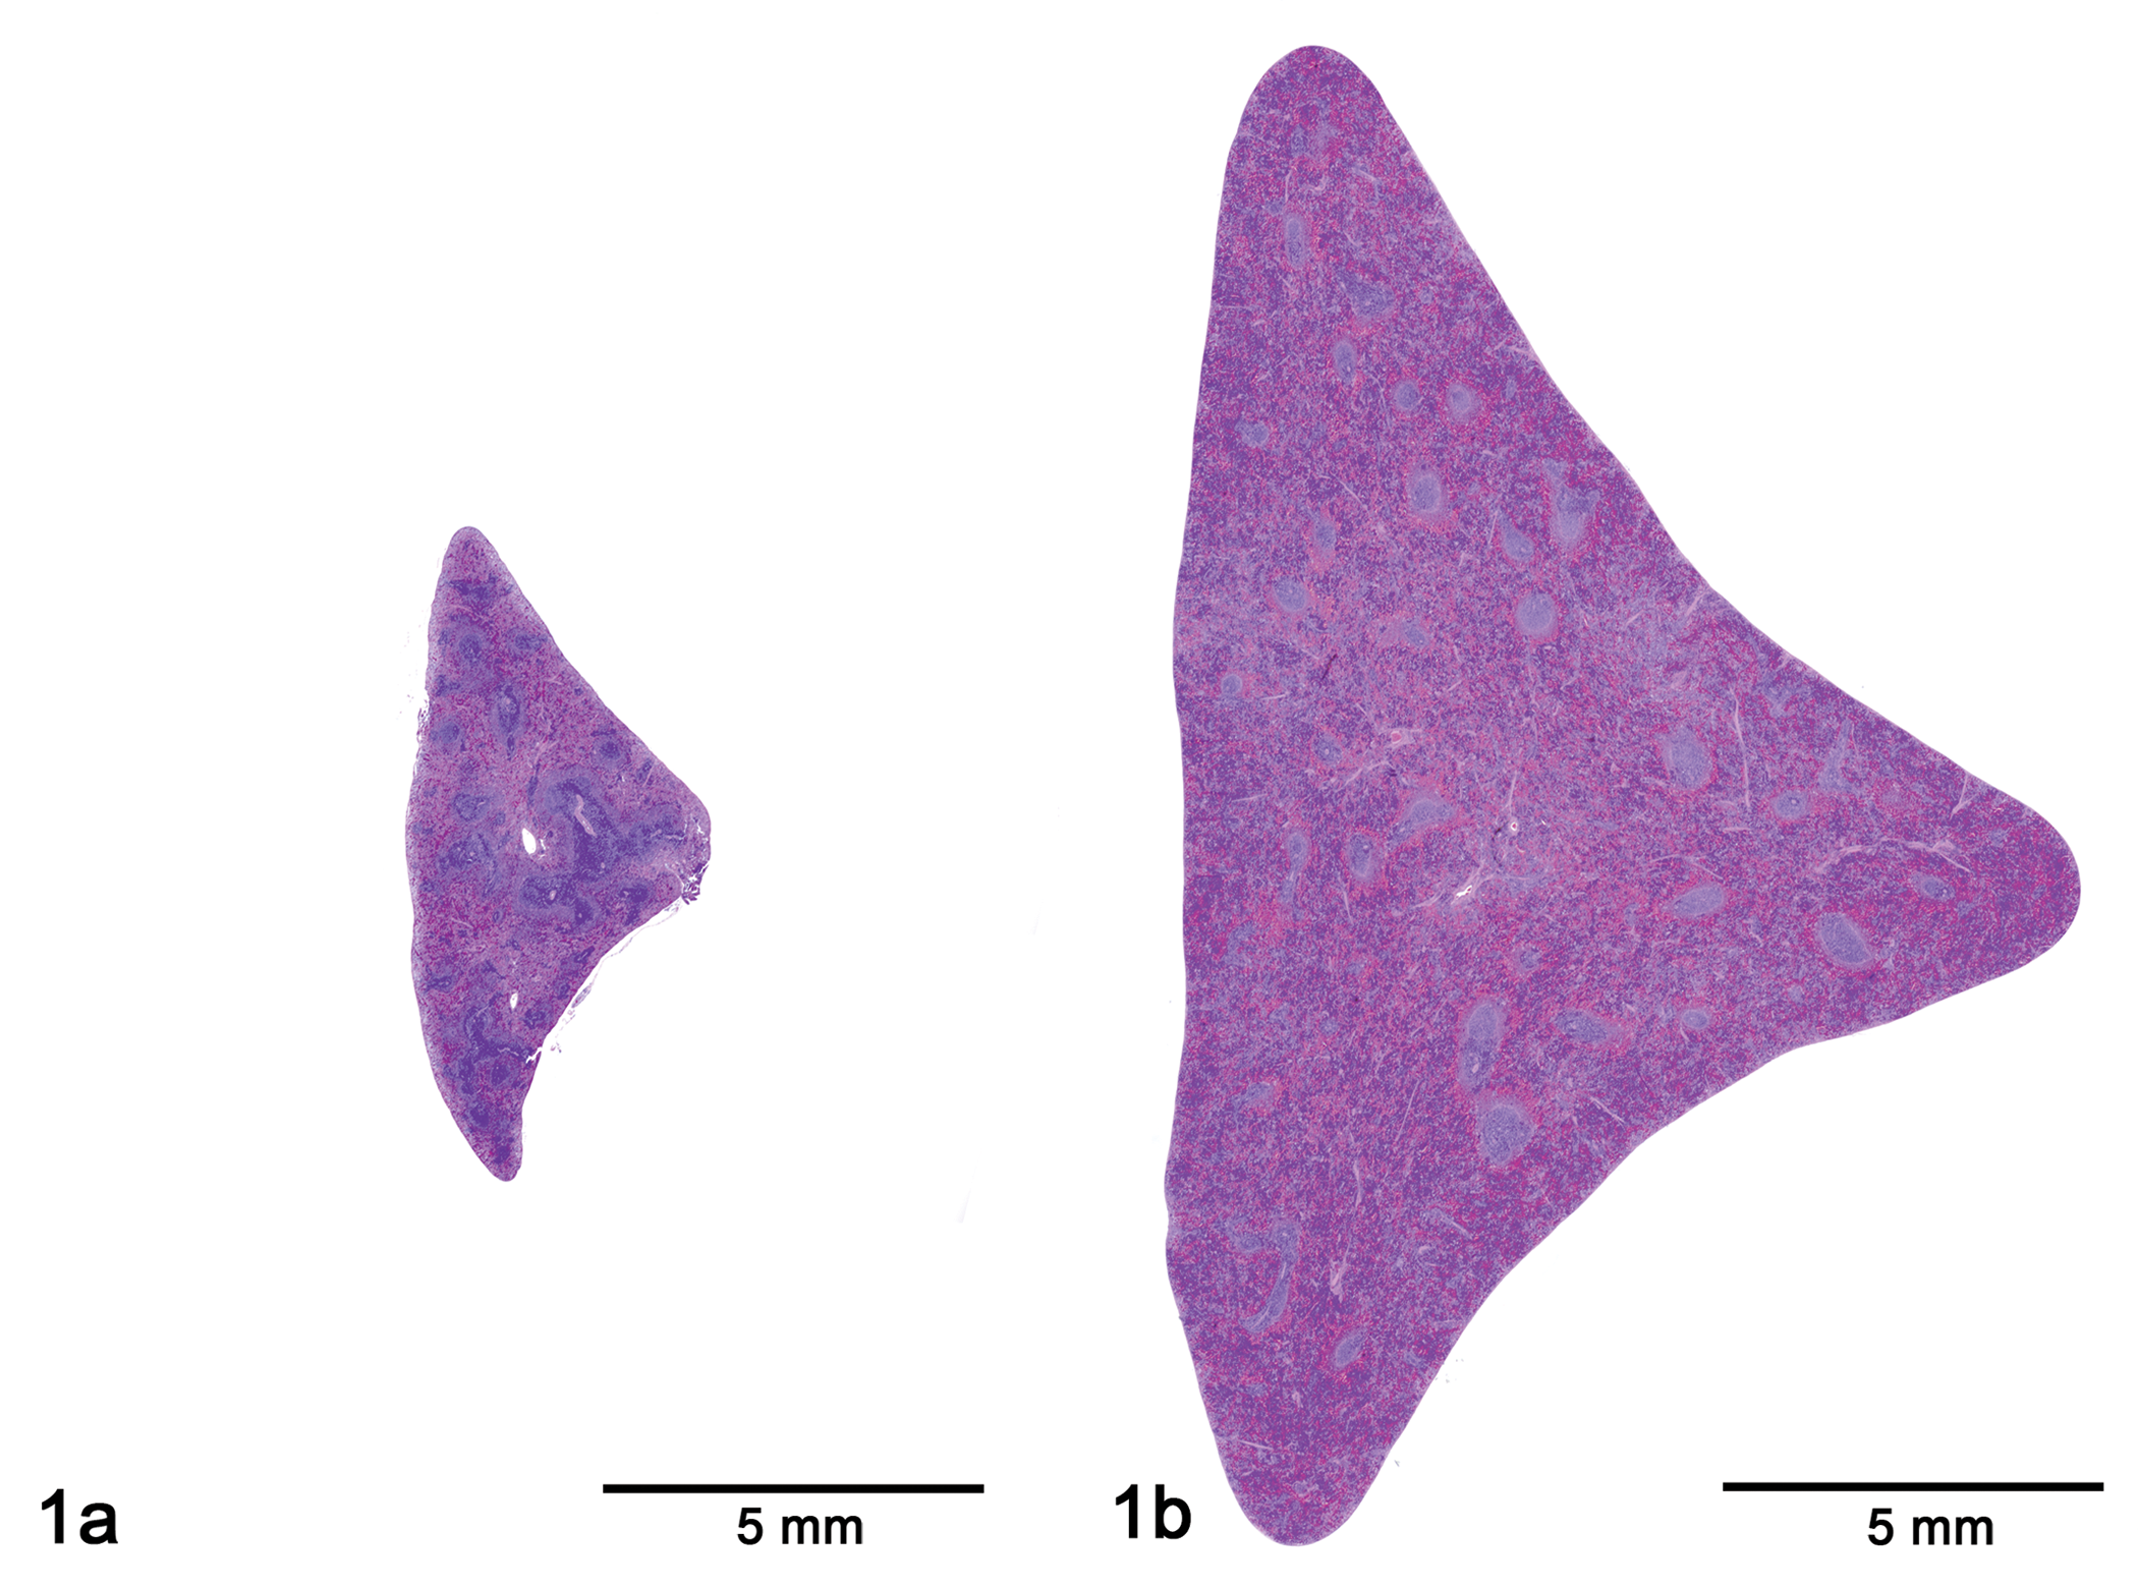
Light photomicrograph of spleen of control female no. 508 (left) and middose female no. 2503 (right) at scheduled terminal necropsy at same magnification. The spleen of the SCH 900875–treated female is massively enlarged by a combination of mostly extramedullary hematopoiesis and accumulation of hemosiderin-containing macrophages and congestion. H&E, bar = 5 mm.
SCH 900875–related findings in the spleen.
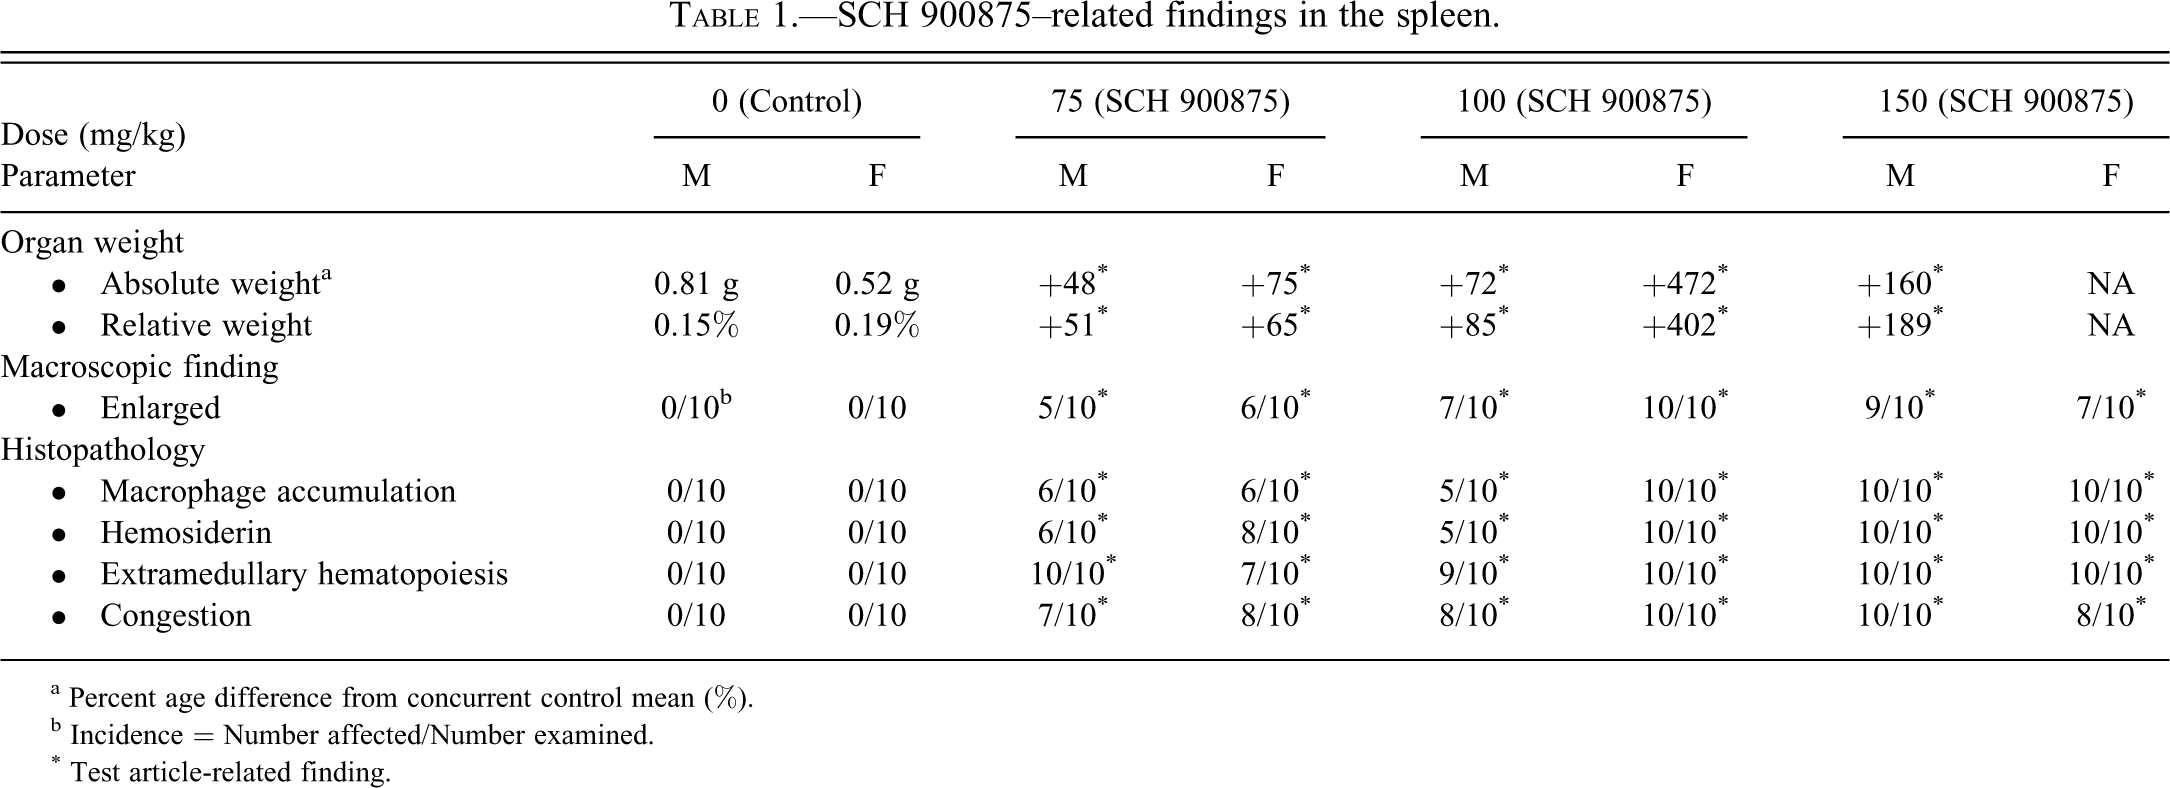
a Percent age difference from concurrent control mean (%).
b Incidence = Number affected/Number examined.
* Test article-related finding.
Light photomicrograph of spleen of control female no. 510 (left) and middose female no. 2501 (right) at scheduled terminal necropsy. The Perl’s stain for iron highlights abundant hemosiderin-containing macrophages. Bar = 400 μm.
Light photomicrograph of kidney from high-dose male no. 3001. (a) Perl’s stain for iron demonstrates the presence of hemosiderin in the epithelial tubular cells. Bar = 200 μm. (b) Tubular basophilia and clusters of mononuclear inflammatory cells are present multifocally in the interstitium. H&E, bar = 100 μm.
Hematology findings in the 150 mg/kg-dosed female rats sacrificed on day 20 consisted of a moderate, strongly regenerative anemia (Table 2 ). Altered red blood cell morphology consisting of acanthocytosis, spherocytosis, poikilocytosis, and microcytosis was consistent with the regenerative process and extravascular destruction. There was also a marked regenerative thrombocytopenia. The regenerative process of both erythrocytes and platelets was associated with macrocytosis, large platelets, increased mean corpuscular and platelet volume, and bone marrow hypercellularity involving the erythroid and megakaryocytic cell lineages. In addition, leukocytosis consisting of a moderate lymphocytosis, mature neutrophilia, and a minimal monocytosis was also observed (Table 2). Similar but less severe findings were noted in all dose groups at weeks 5, 10, and/or 13, and changes were more severe in females compared with males.
SCH 900875–related hematologic findings.
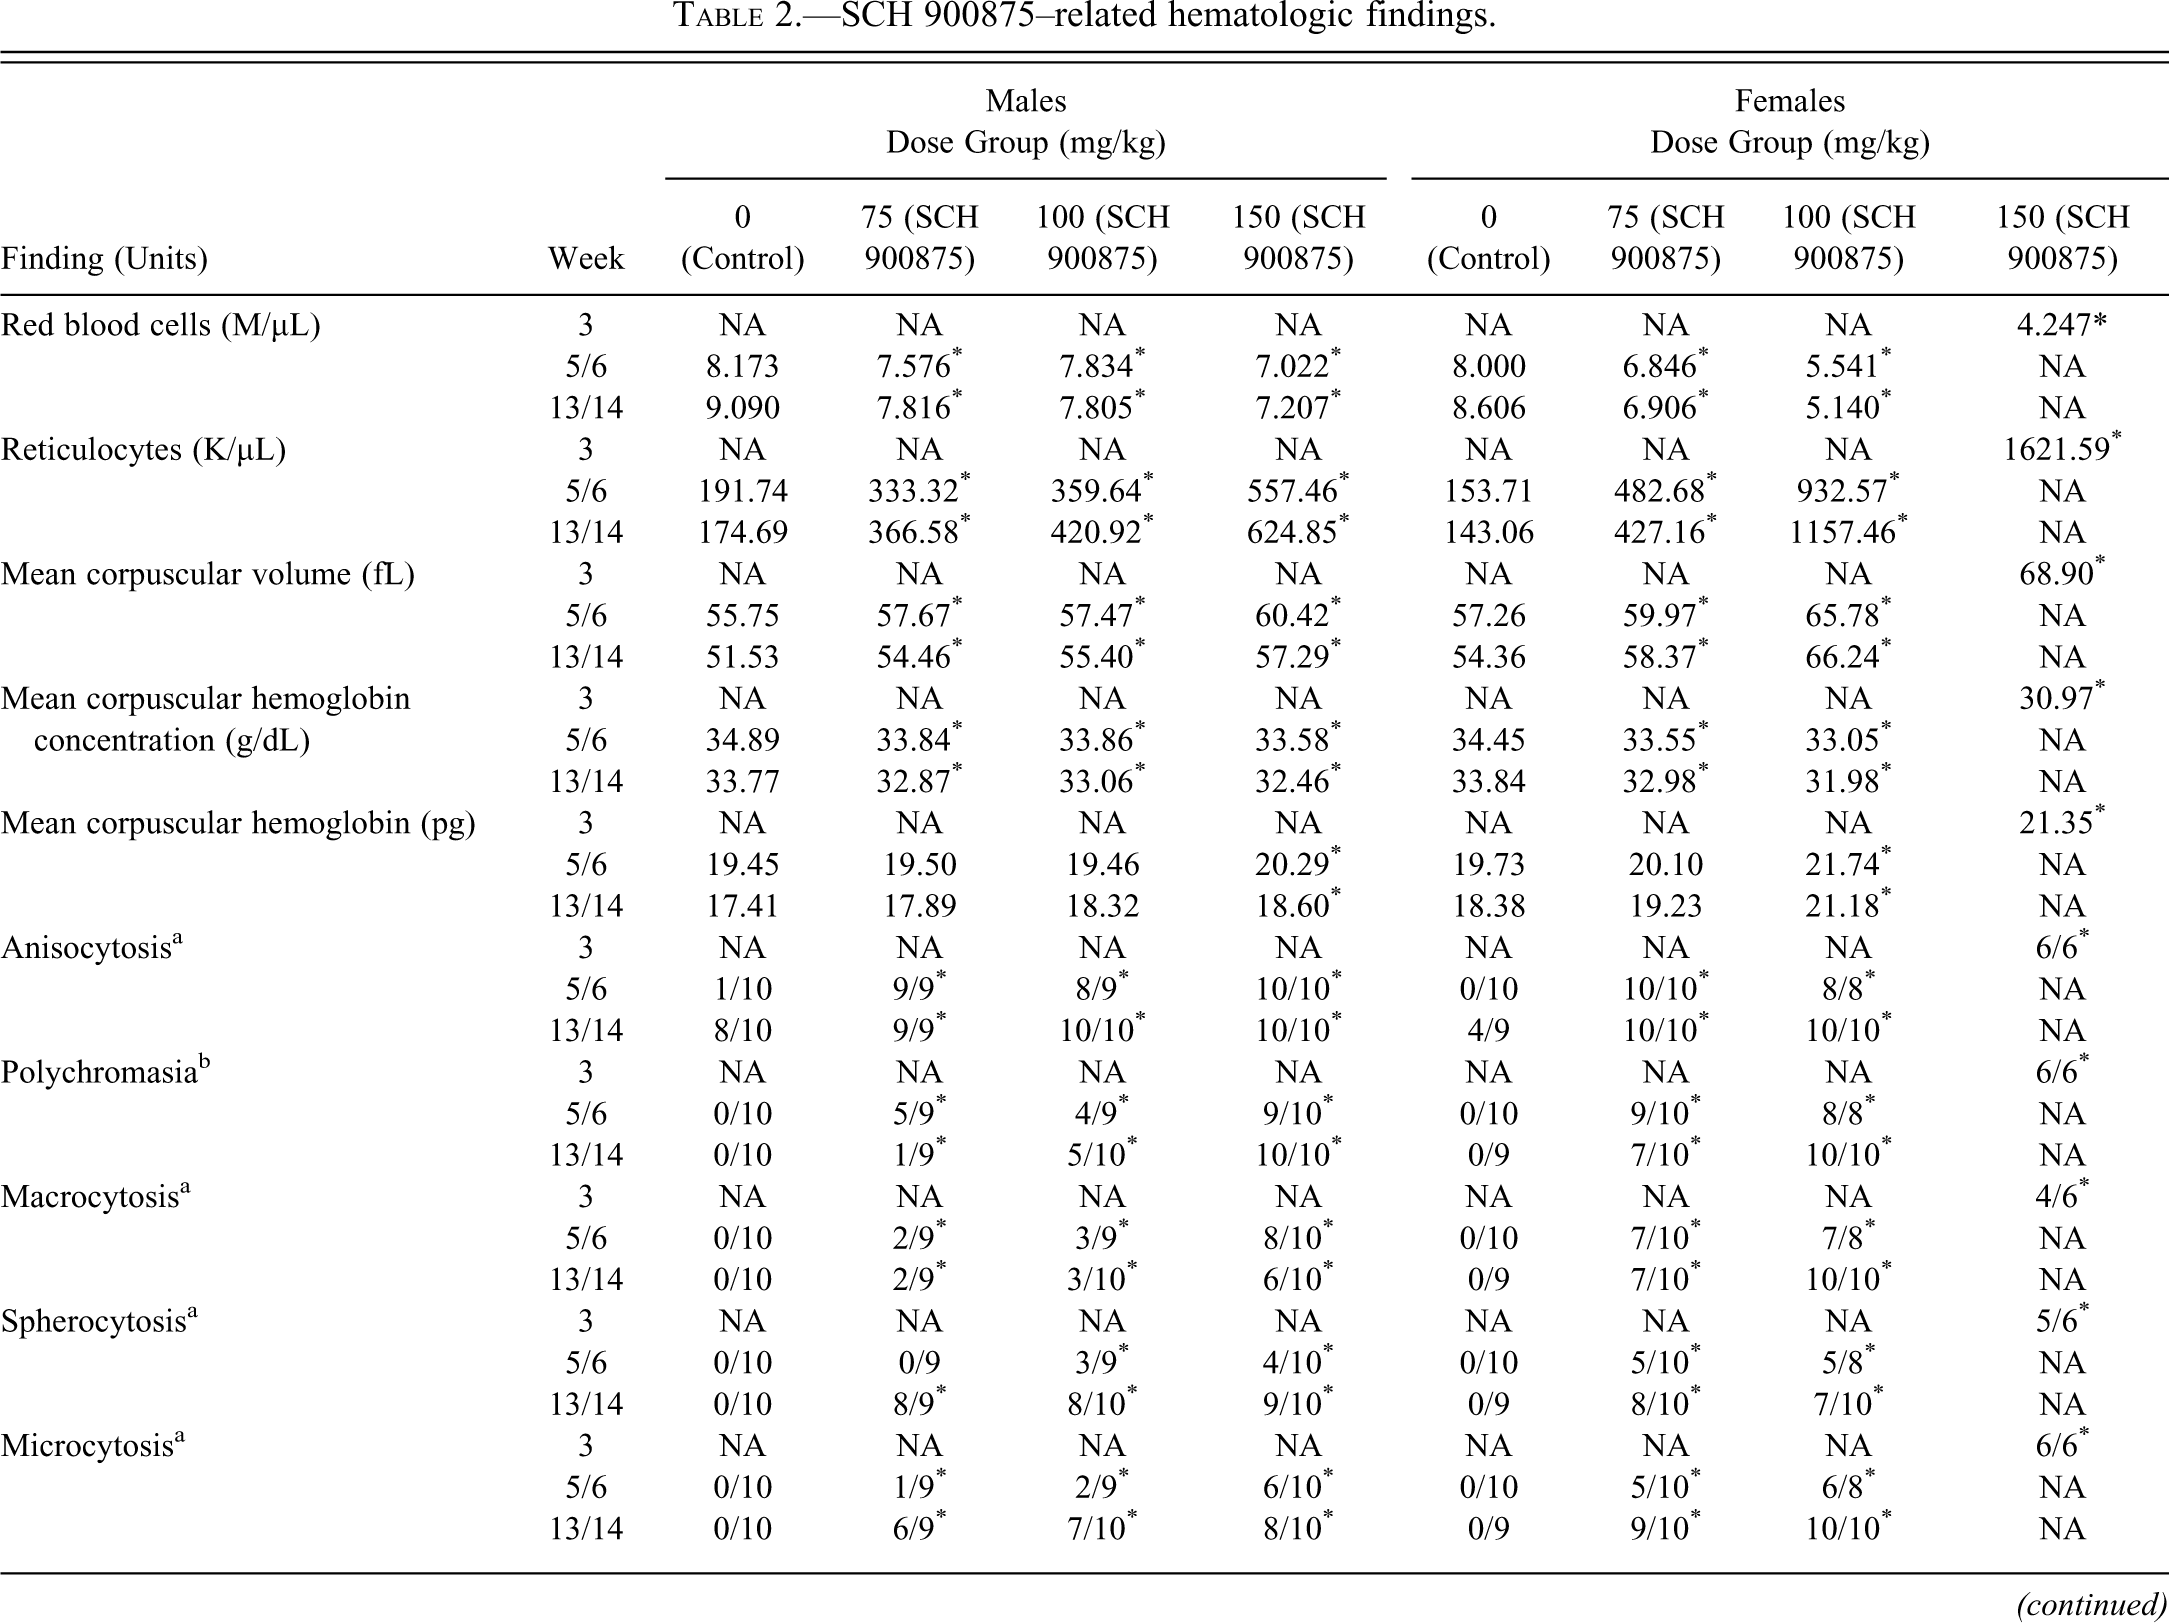
a Incidence = Number affected (grade of 1+ or higher)/Number examined.
b Incidence = Number affected (grade of 2+ or higher)/Number examined.
c Value reported for female rat No. 3505 only. The remaining sample mean platelet volumes were not reported because of assay interference.
d Incidence = Number affected/Number examined.
e Incidence = Number affected/Number examined followed parenthetically by the range of values for affected individuals and compared to the mean control value, when available.
f Control group mean at Week 5/6 added for comparison.
* Test article-related finding.
NA, Not applicable.
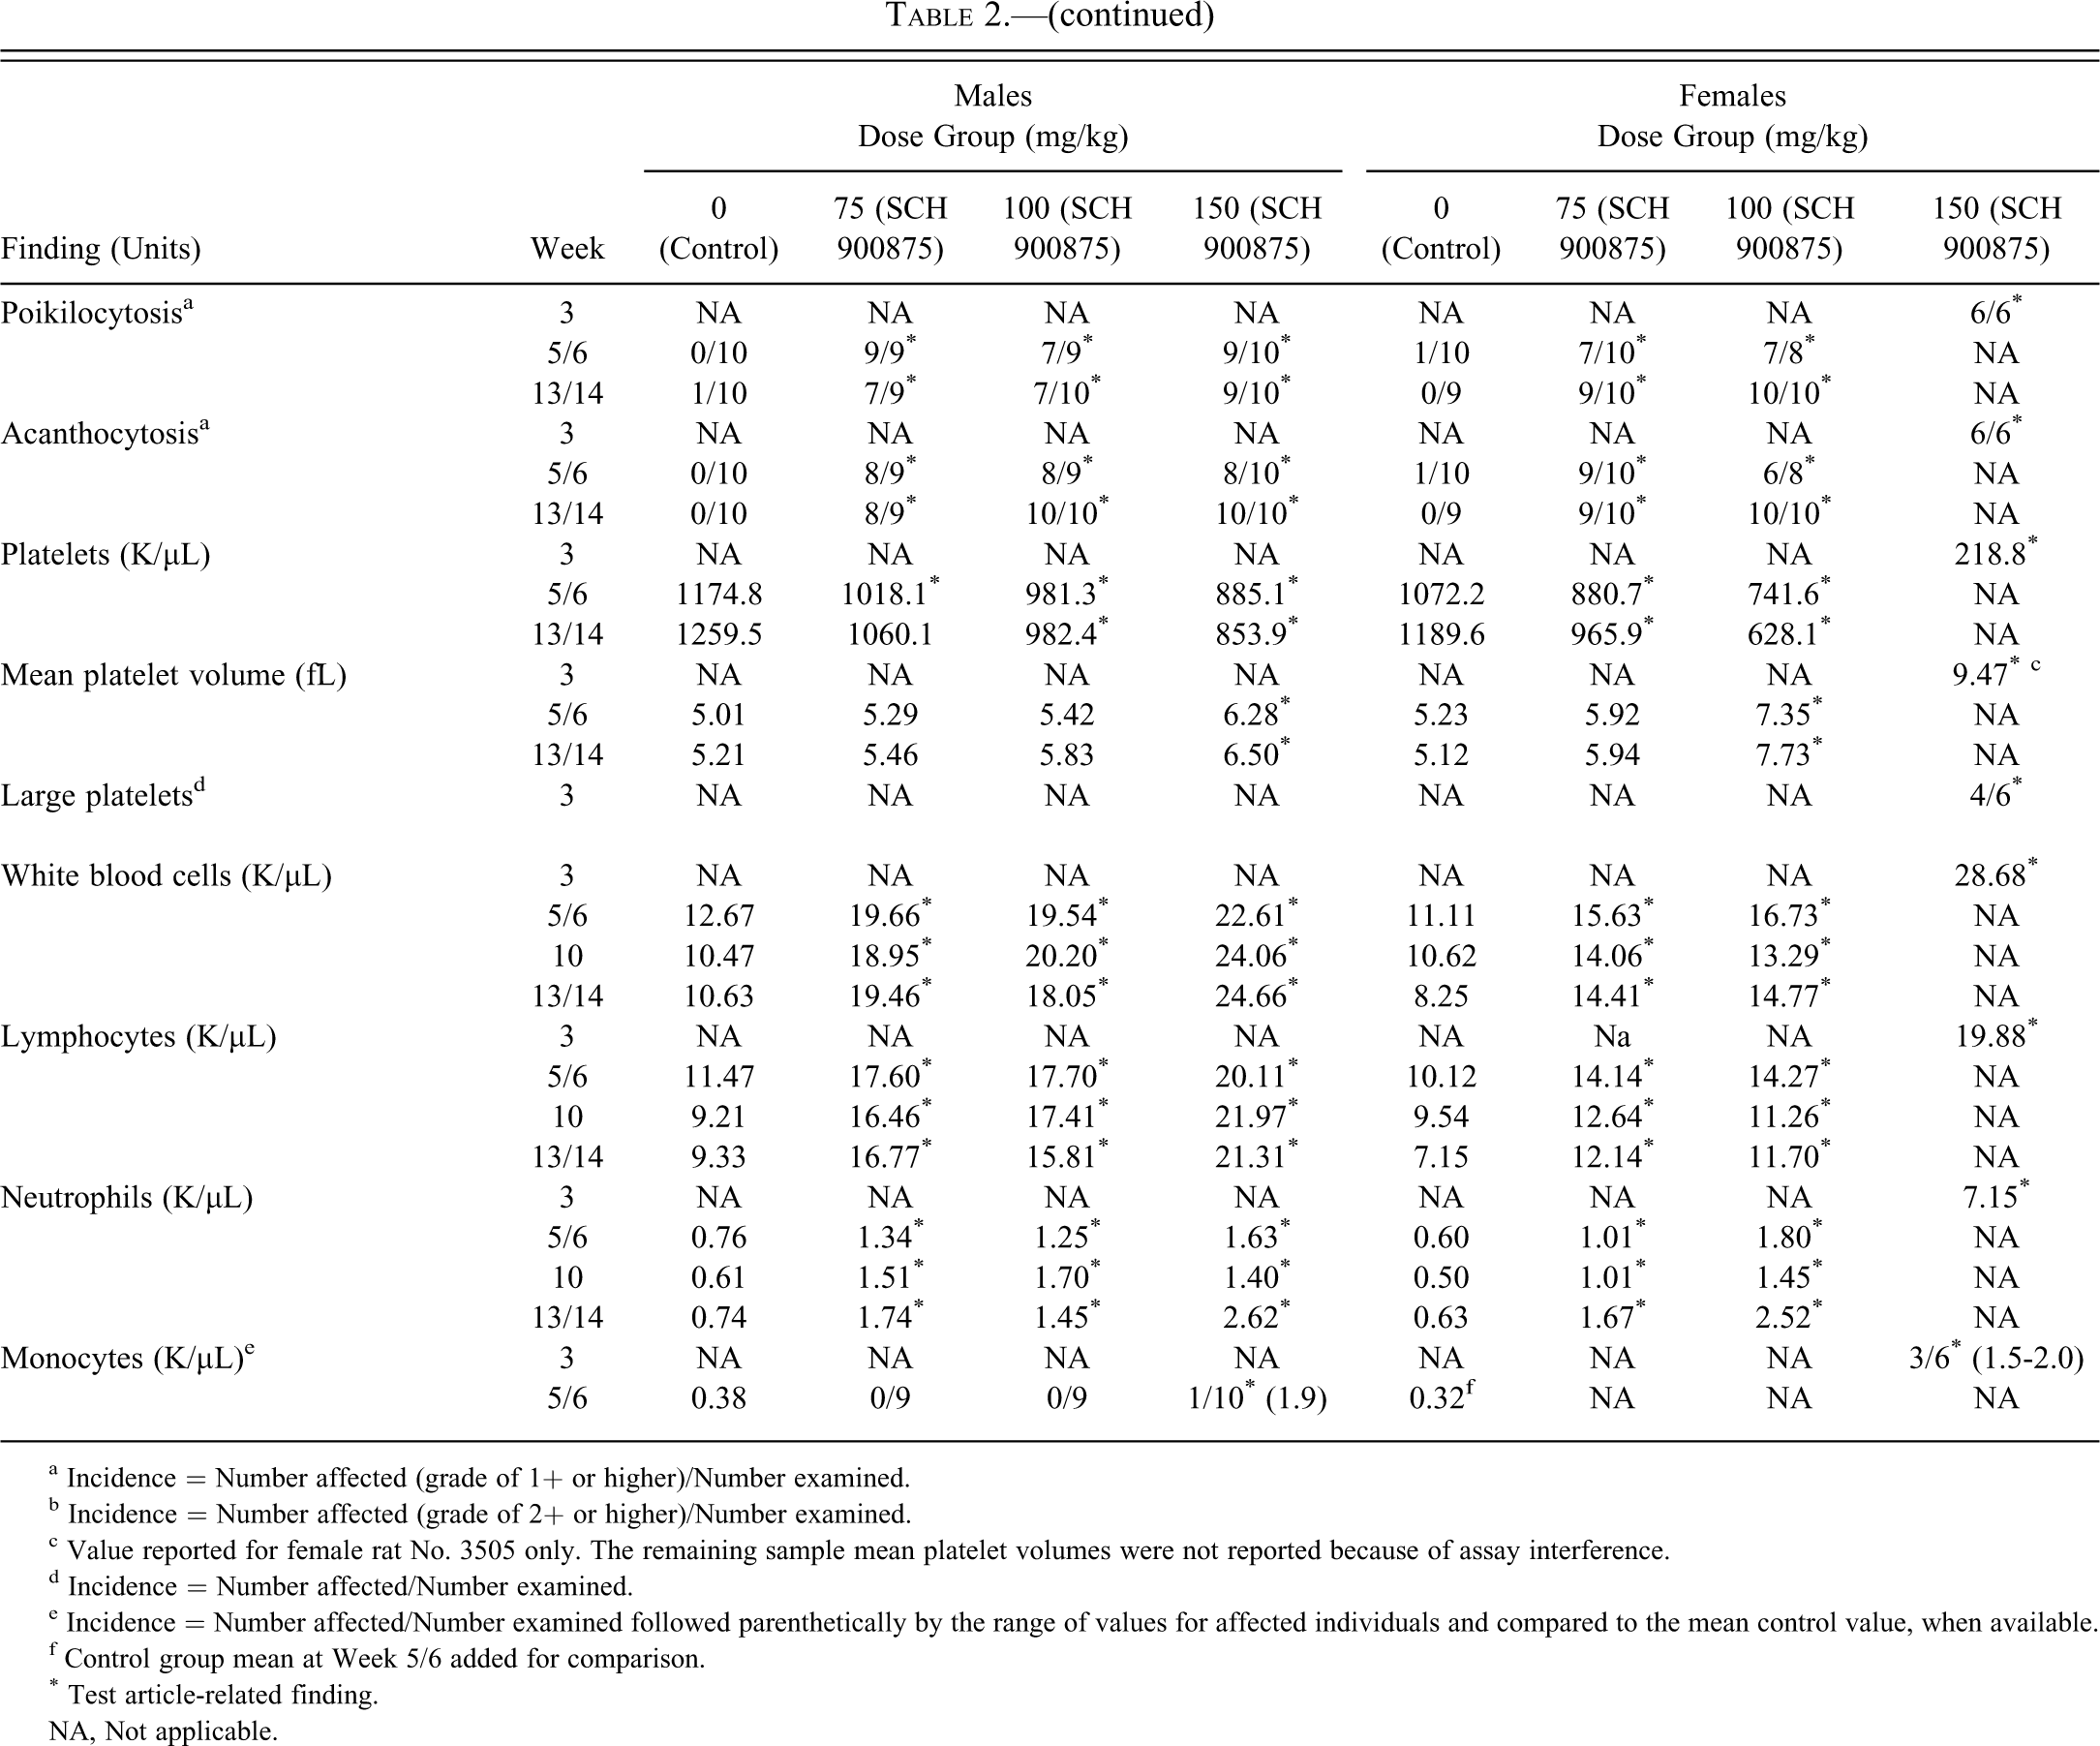
Serum chemistry findings consisted of mild to moderate increases in cholesterol and moderate to marked decreases in triglycerides at all doses (Table 3 ). Visual assessment of the serum was unremarkable, ruling out significant hemoglobinemia. Higher total bilirubin and mean gamma-glutamyl transferase (GGT) activity occurred in both sexes. In addition, there were also minimal to mild lower mean total protein, albumin, and globulin concentrations in middose and high-dose females. Minimally higher mean serum glucose and phosphorus concentrations were seen in high-dose females. Urinalysis was unremarkable.
SCH 900875–related pertinent serum chemistry values.
a Rat No. 2004 had a minimal increase in total bilirubin (1.4 mg/dL) and a minimal increase in direct bilirubin (0.3 mg/dL).
b Rat No. 2503 had a minimal increase in total bilirubin (1.7 mg/dL) and a minimal increase in direct bilirubin (0.7 mg/dL).
* Test article-related finding.
NA, Not applicable.
Transmission electron microscopic examination of the spleens of high-dose females was then performed to identify the fate of the erythrocytes and platelets in the spleen, as both histopathology and clinical pathology pointed to the removal of these cells by the spleen. Most venous sinuses were unremarkable and contained erythrocytes and platelets as expected. Only a few macrophages were identified in the tissue sections. In some instances, a phagocytosed erythrocyte and/or platelet could be found within the cytoplasm of splenic macrophages (Figure 4 ).
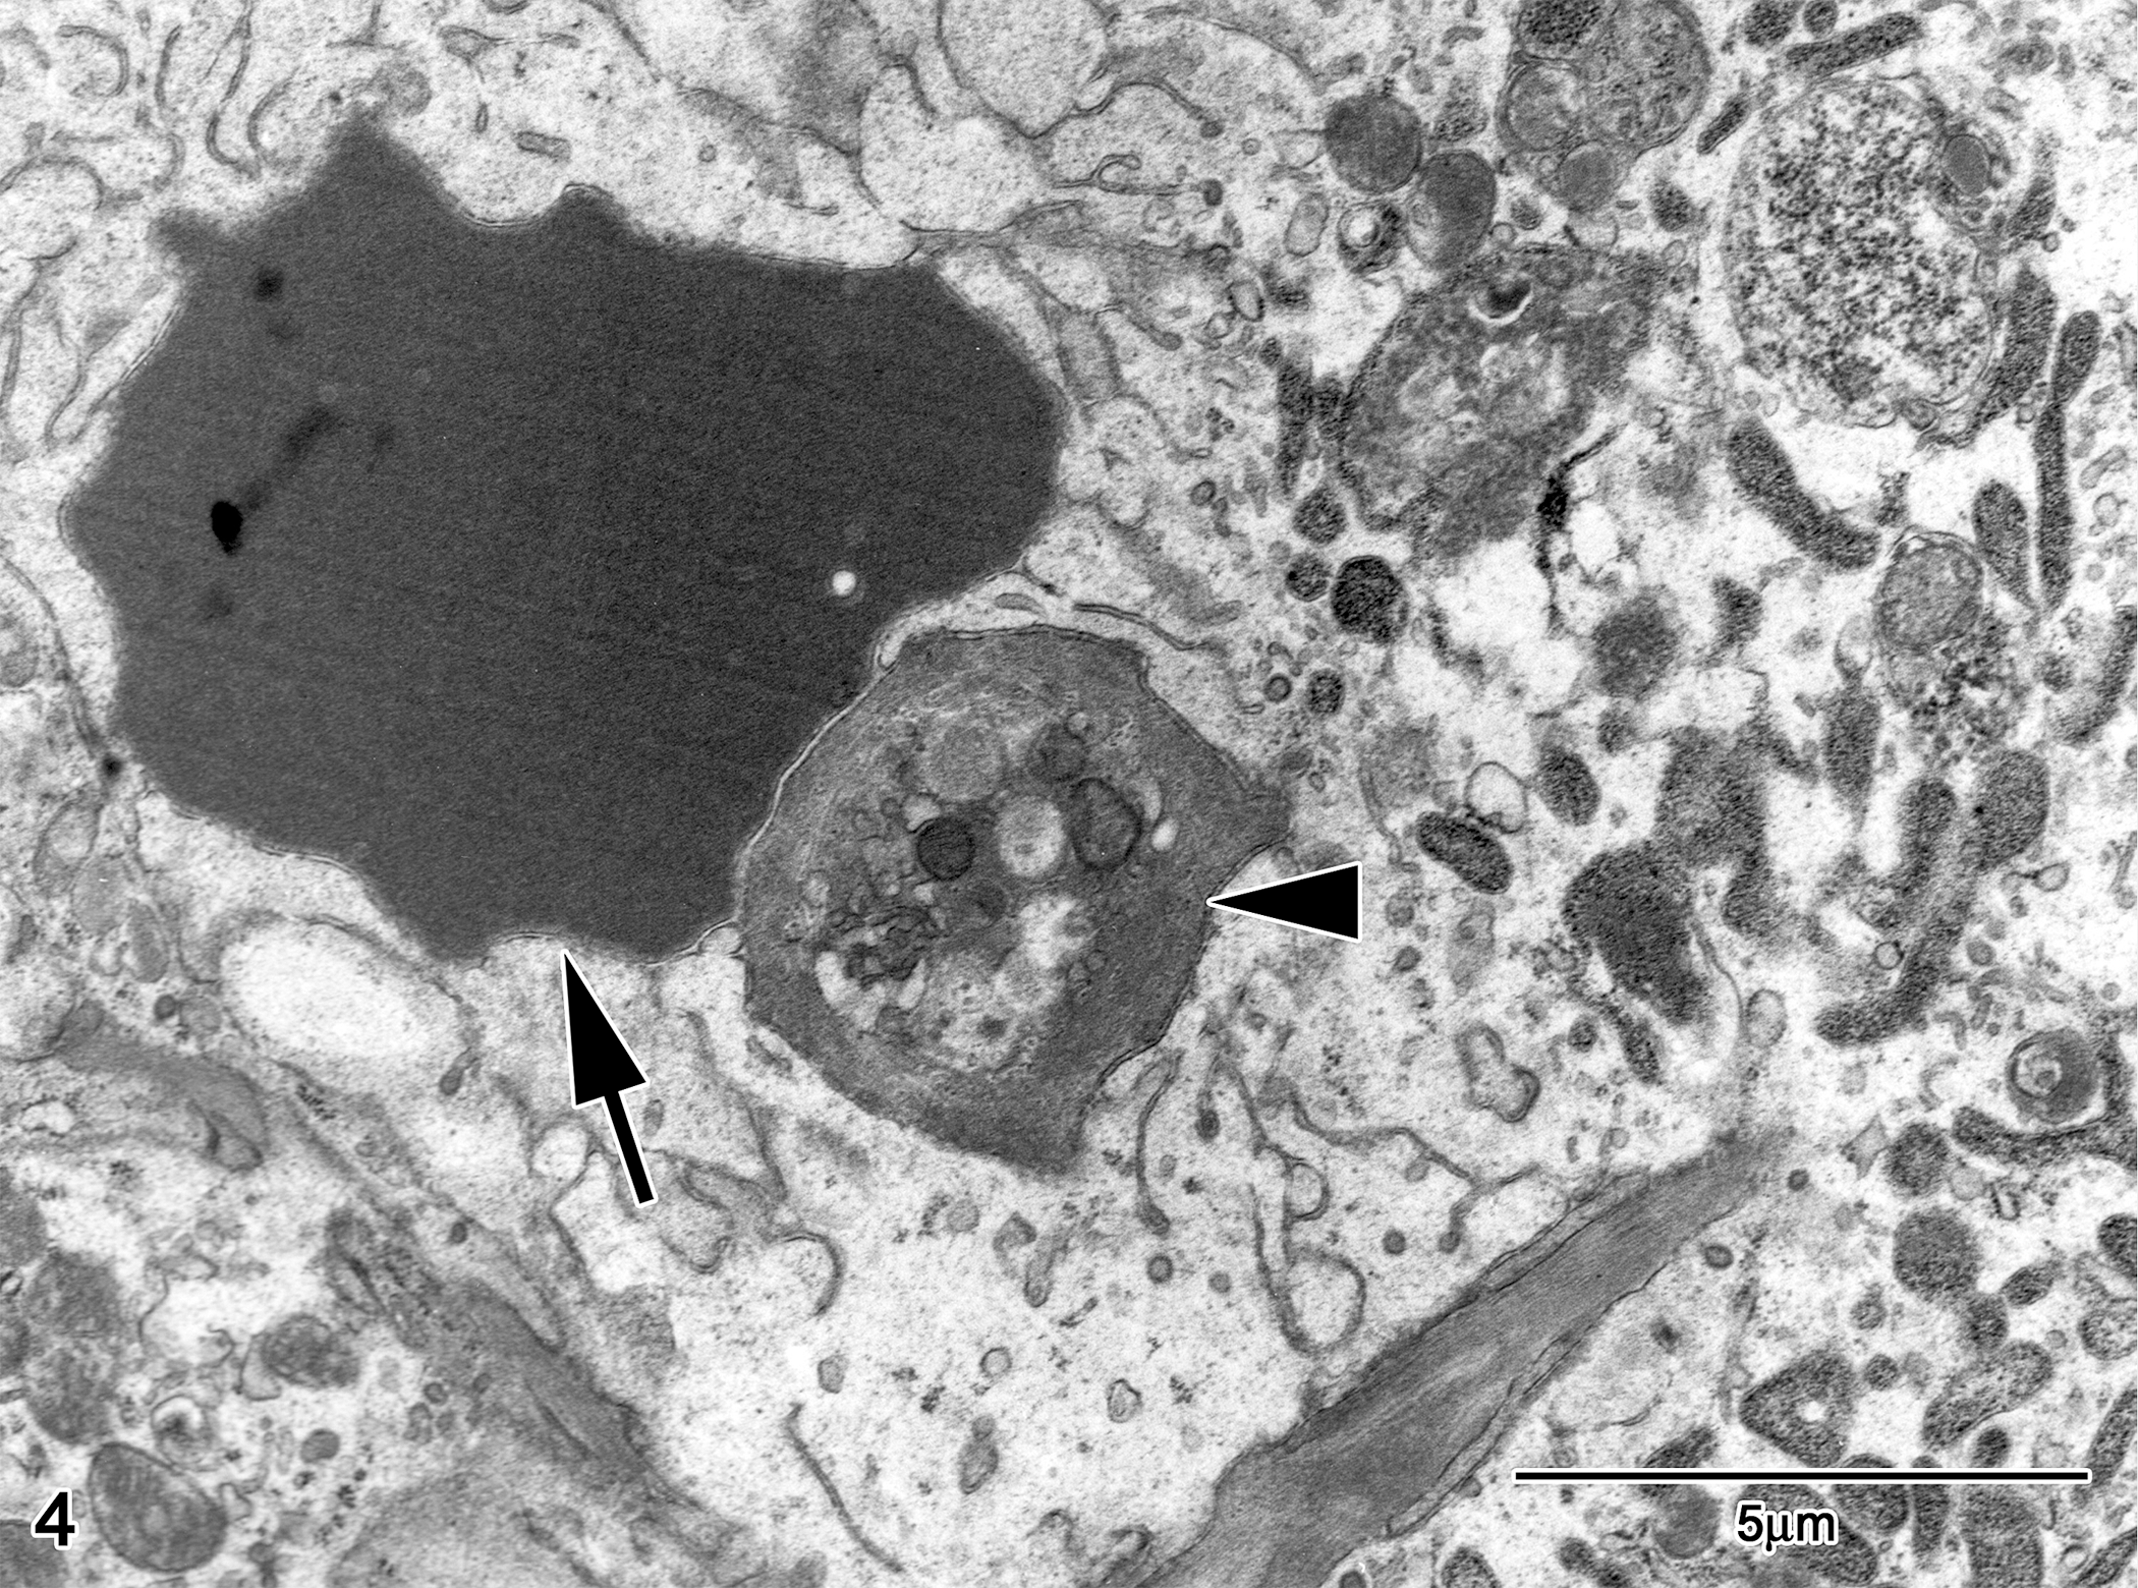
Transmission electron micrograph of spleen of high-dose female no. 3505. A splenic macrophage contains a phagocytosed red blood cell (arrow) and platelet (arrowhead). Uranyl acetate and lead citrate. Bar = 5 μm.
Next, to determine whether immune-mediated mechanisms were eliciting the destruction of these blood cells, two complementary methods, immunohistochemistry on spleen sections and flow cytometric direct antiglobulin assay, were used. Immunohistochemical detection of IgG and/or IgM antibodies on the spleens of high-dose female rats sacrificed on day 20 showed no accumulation of immunoglobulins on the erythrocyte plasma membranes (Figure 5 ). In each slide, scattered plasma cells were immunopositive, serving as internal positive control. Similarly, direct flow cytometric erythrocyte and platelet immunofluorescence assays demonstrated no evidence of high affinity (IgG and IgM) antibody on the surface of the cells. Taken together, these results did not seem to support an immune-mediated mechanism for the anemia and the thrombocytopenia.
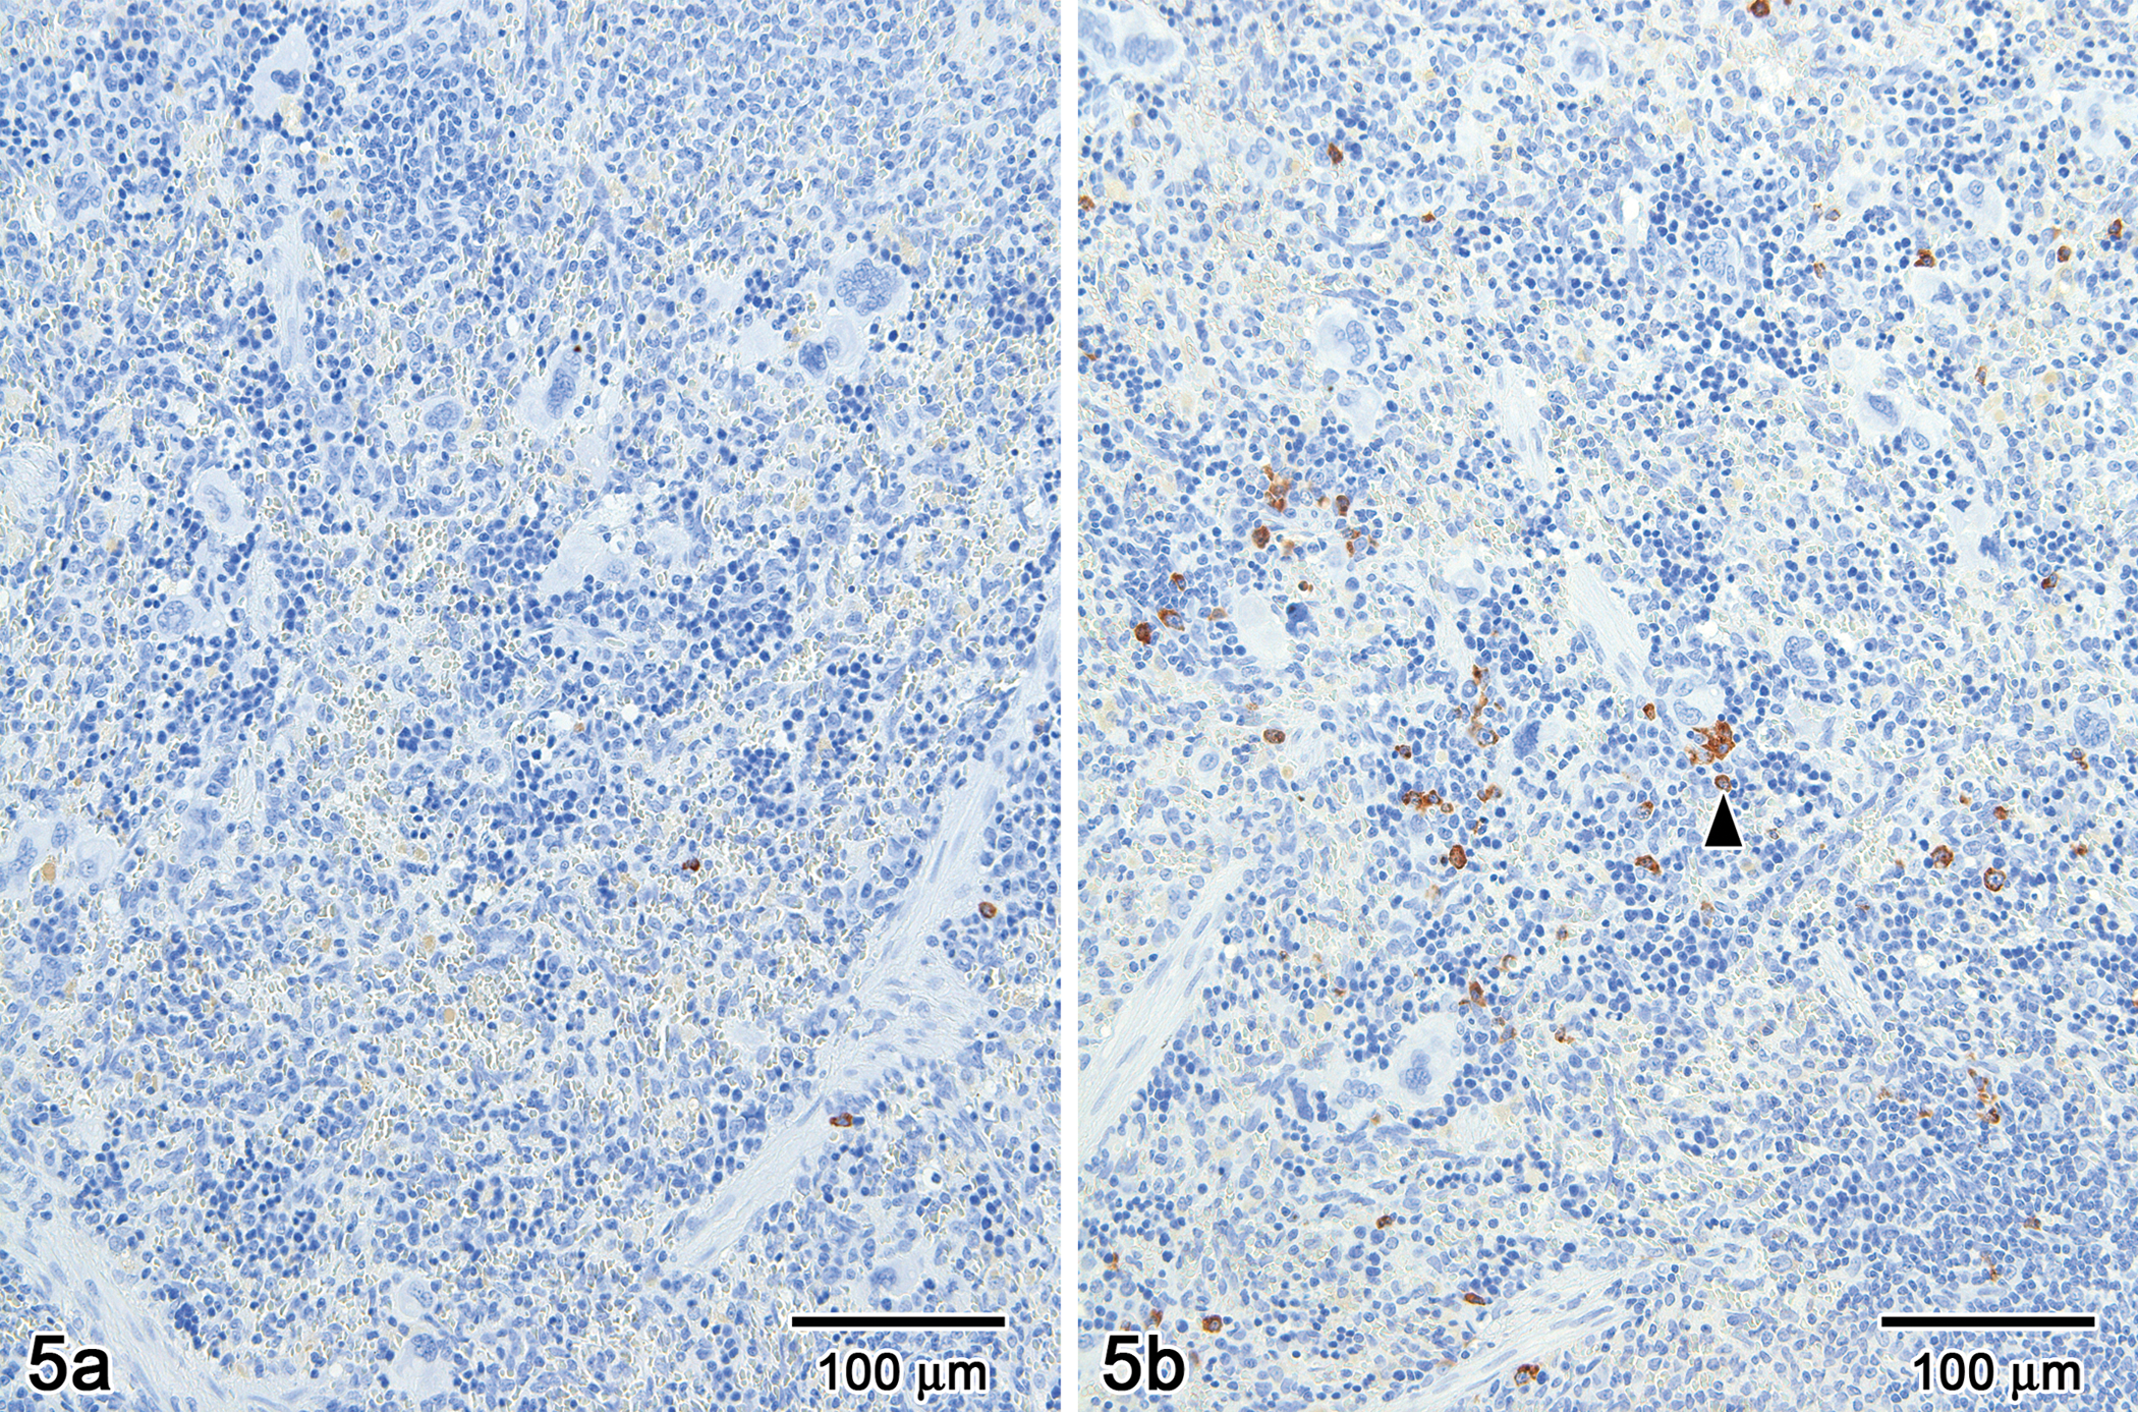
Immunohistochemichal detection of IgG (a) and IgM (b) in spleen of high-dose female no. 3505. Neither red blood cells nor platelets show immunopositivity. Scattered plasma cells (arrowhead) within the tissue serve as internal positive controls. Hematoxylin counterstain, bar = 100 μm.
No increase in osmotic fragility of naïve erythrocytes was detected in vitro when erythrocytes were incubated in the presence of the drug with/without its metabolite, providing no evidence of a direct test article-related effect on the cells. The ex vivo osmotic fragility assay, however, showed increased osmotic fragility in 4/5 middose female and 3/5 high-dose male rats, indicating that the cells from the SCH 900875–dosed rats were rendered more susceptible to hemolysis (Table 4 ).
In vitro and ex vivo red blood cell osmotic fragility.
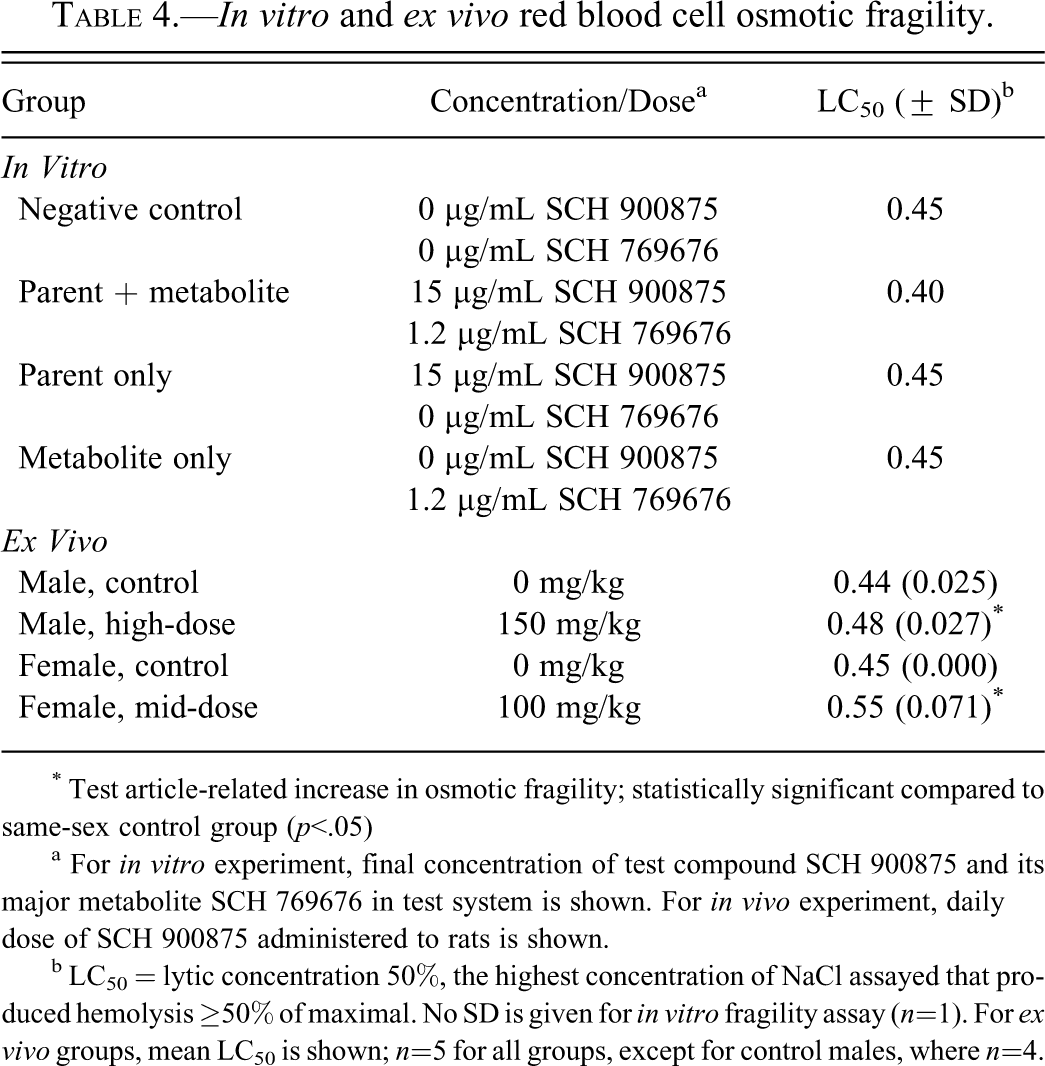
* Test article-related increase in osmotic fragility; statistically significant compared to same-sex control group (p<.05)
a For in vitro experiment, final concentration of test compound SCH 900875 and its major metabolite SCH 769676 in test system is shown. For in vivo experiment, daily dose of SCH 900875 administered to rats is shown.
b LC50 = lytic concentration 50%, the highest concentration of NaCl assayed that produced hemolysis ≥50% of maximal. No SD is given for in vitro fragility assay (n=1). For ex vivo groups, mean LC50 is shown; n=5 for all groups, except for control males, where n=4.
Acanthocytes were noted in the peripheral blood of SCH 900875–treated rats. Because acanthocyte formation is generally associated with alterations in lipid composition and fluidity of the red cell membrane, lipid analysis of the red blood cell membrane was performed. Little difference was observed between the types and abundance of the top ten most abundant phosphatidylcholine (PtdCho) phospholipids expressed in red blood cells isolated from male and female rats with the exception that higher levels of variation were seen in females, which may result from hormonal differences. Because it was the most consistently abundant phospholipid, 34:2 PtdCho (the first number refers to the number of carbons and the second to the number of double bonds) was used as reference in both sexes. Red blood cell lipid analysis demonstrated alterations in the lipid membrane profiles of SCH 900875–dosed rats (Table 5 ). In female rats, decreases were seen for 34:0, 36:1, 36:2, and 36:3 PtdCho. The only PtdCho found to increase after treatment was 34:1, from 52 ± 6% in controls to 88 ± 18% in females at 100 mg/kg. Differences seen with other PtdCho were not considered biologically significant because of the high standard error of the control samples. In contrast, SCH 900875 did not alter the expression pattern or abundance of any phospholipid studied in male rats.
SCH 900875–related effects on the lipid composition of the erythrocyte plasma membrane.
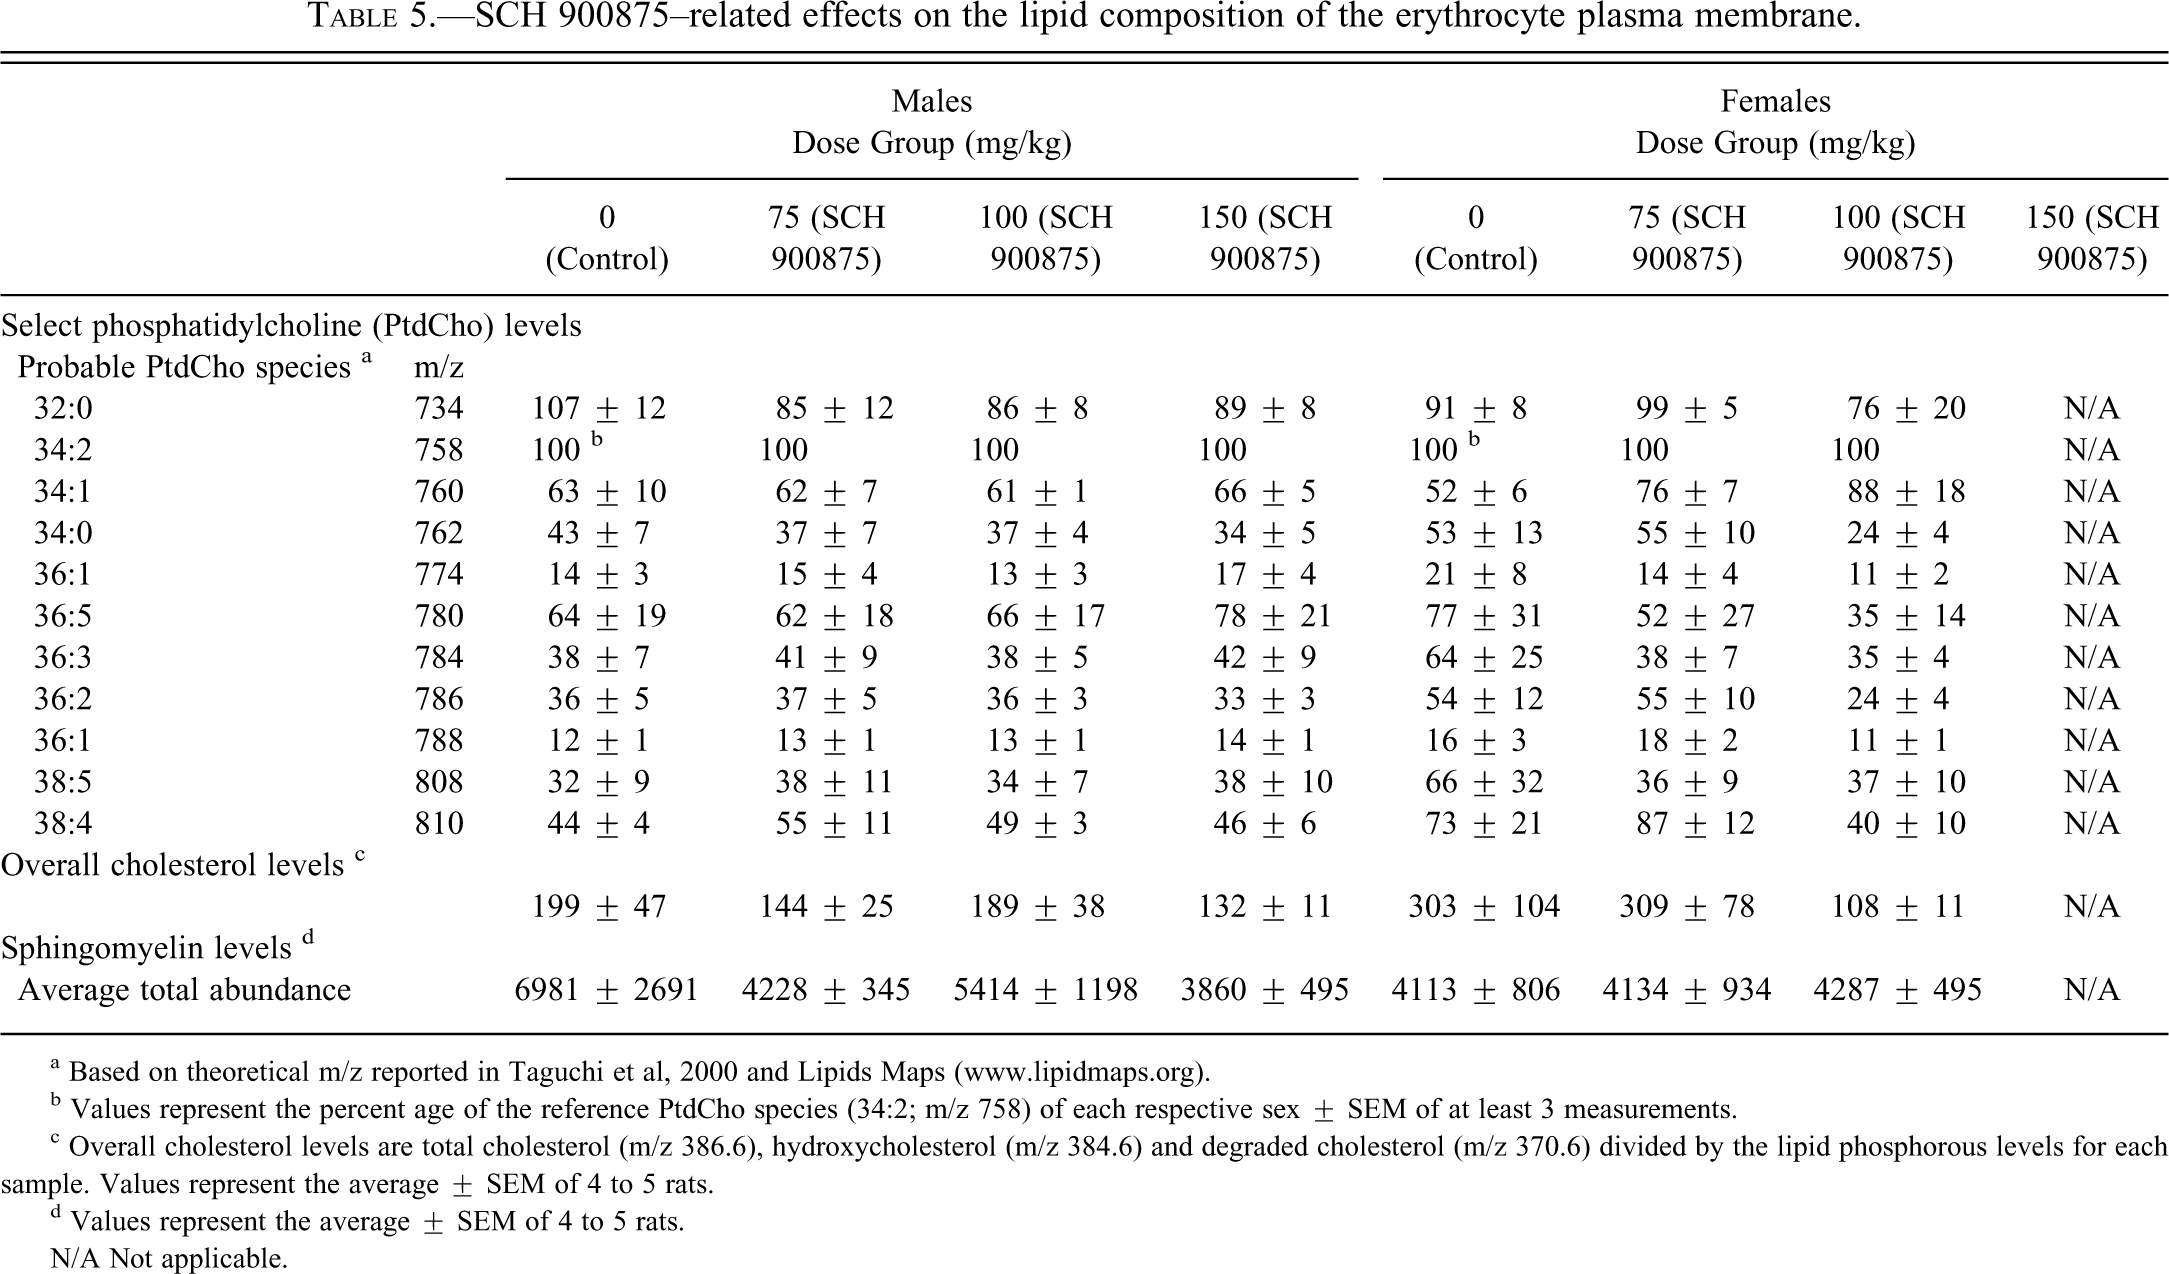
a Based on theoretical m/z reported in Taguchi et al, 2000 and Lipids Maps (www.lipidmaps.org).
b Values represent the percent age of the reference PtdCho species (34:2; m/z 758) of each respective sex ± SEM of at least 3 measurements.
c Overall cholesterol levels are total cholesterol (m/z 386.6), hydroxycholesterol (m/z 384.6) and degraded cholesterol (m/z 370.6) divided by the lipid phosphorous levels for each sample. Values represent the average ± SEM of 4 to 5 rats.
d Values represent the average ± SEM of 4 to 5 rats.
N/A Not applicable.
The overall cholesterol levels in red blood cell membranes (Table 5) were normalized based on the total lipid phosphorous levels in each sample, which were not significantly different among treatment groups (data not shown). Female rats tended to have higher levels of overall cholesterol in the membrane of their erythrocytes compared with males and, as for PtdCho levels, there was variability in the cholesterol levels of control females that was not seen in the male controls. Compared with controls, erythrocyte overall cholesterol levels in male rats were slightly decreased in the 75 and 150 mg/kg dose groups. In females, the decrease in overall cholesterol was particularly pronounced in the 100 mg/kg dose group (108 ± 11 at 100 mg/kg versus 303 ± 104 in controls). Although a strict dose relationship was not observed in male rats, the overall cholesterol levels in erythrocyte membrane correlated with hematocrit values, inasmuch as severe anemia was associated with low plasma membrane overall cholesterol levels in females at 100 mg/kg and males at 150 mg/kg. Finally, SCH 900875 lowered the overall abundance of sphingomyelin in males at 150 mg/kg. This effect was not seen in females. Collectively, these data suggest that administration of SCH 900875 to rats may alter the membrane lipid composition and fluidity of red blood cells.
To determine whether a similar mechanism of plasma membrane alteration was responsible for the destruction of the platelets and because it was not practically feasible to directly analyze the lipid composition of platelet plasma membrane due to their small volume, scanning electron microscopy was performed on quiescent platelets on selected rats. Small clusters of morphologically normal platelets and biconcave erythrocytes were present in the control rats. The platelets in these rats appeared as ovoid or biconvex discs with a smooth plasma membrane. In contrast, in middose female rats, acanthocytes were admixed with normal erythrocytes, and a great number of platelets exhibited slender filiform processes of their plasma membrane, similar to, albeit longer than, the bulbous elongated projections of the acanthocytes (Figure 6 ). Comparable platelet morphological changes were seen in the high-dose males examined but were less severe and less frequent.
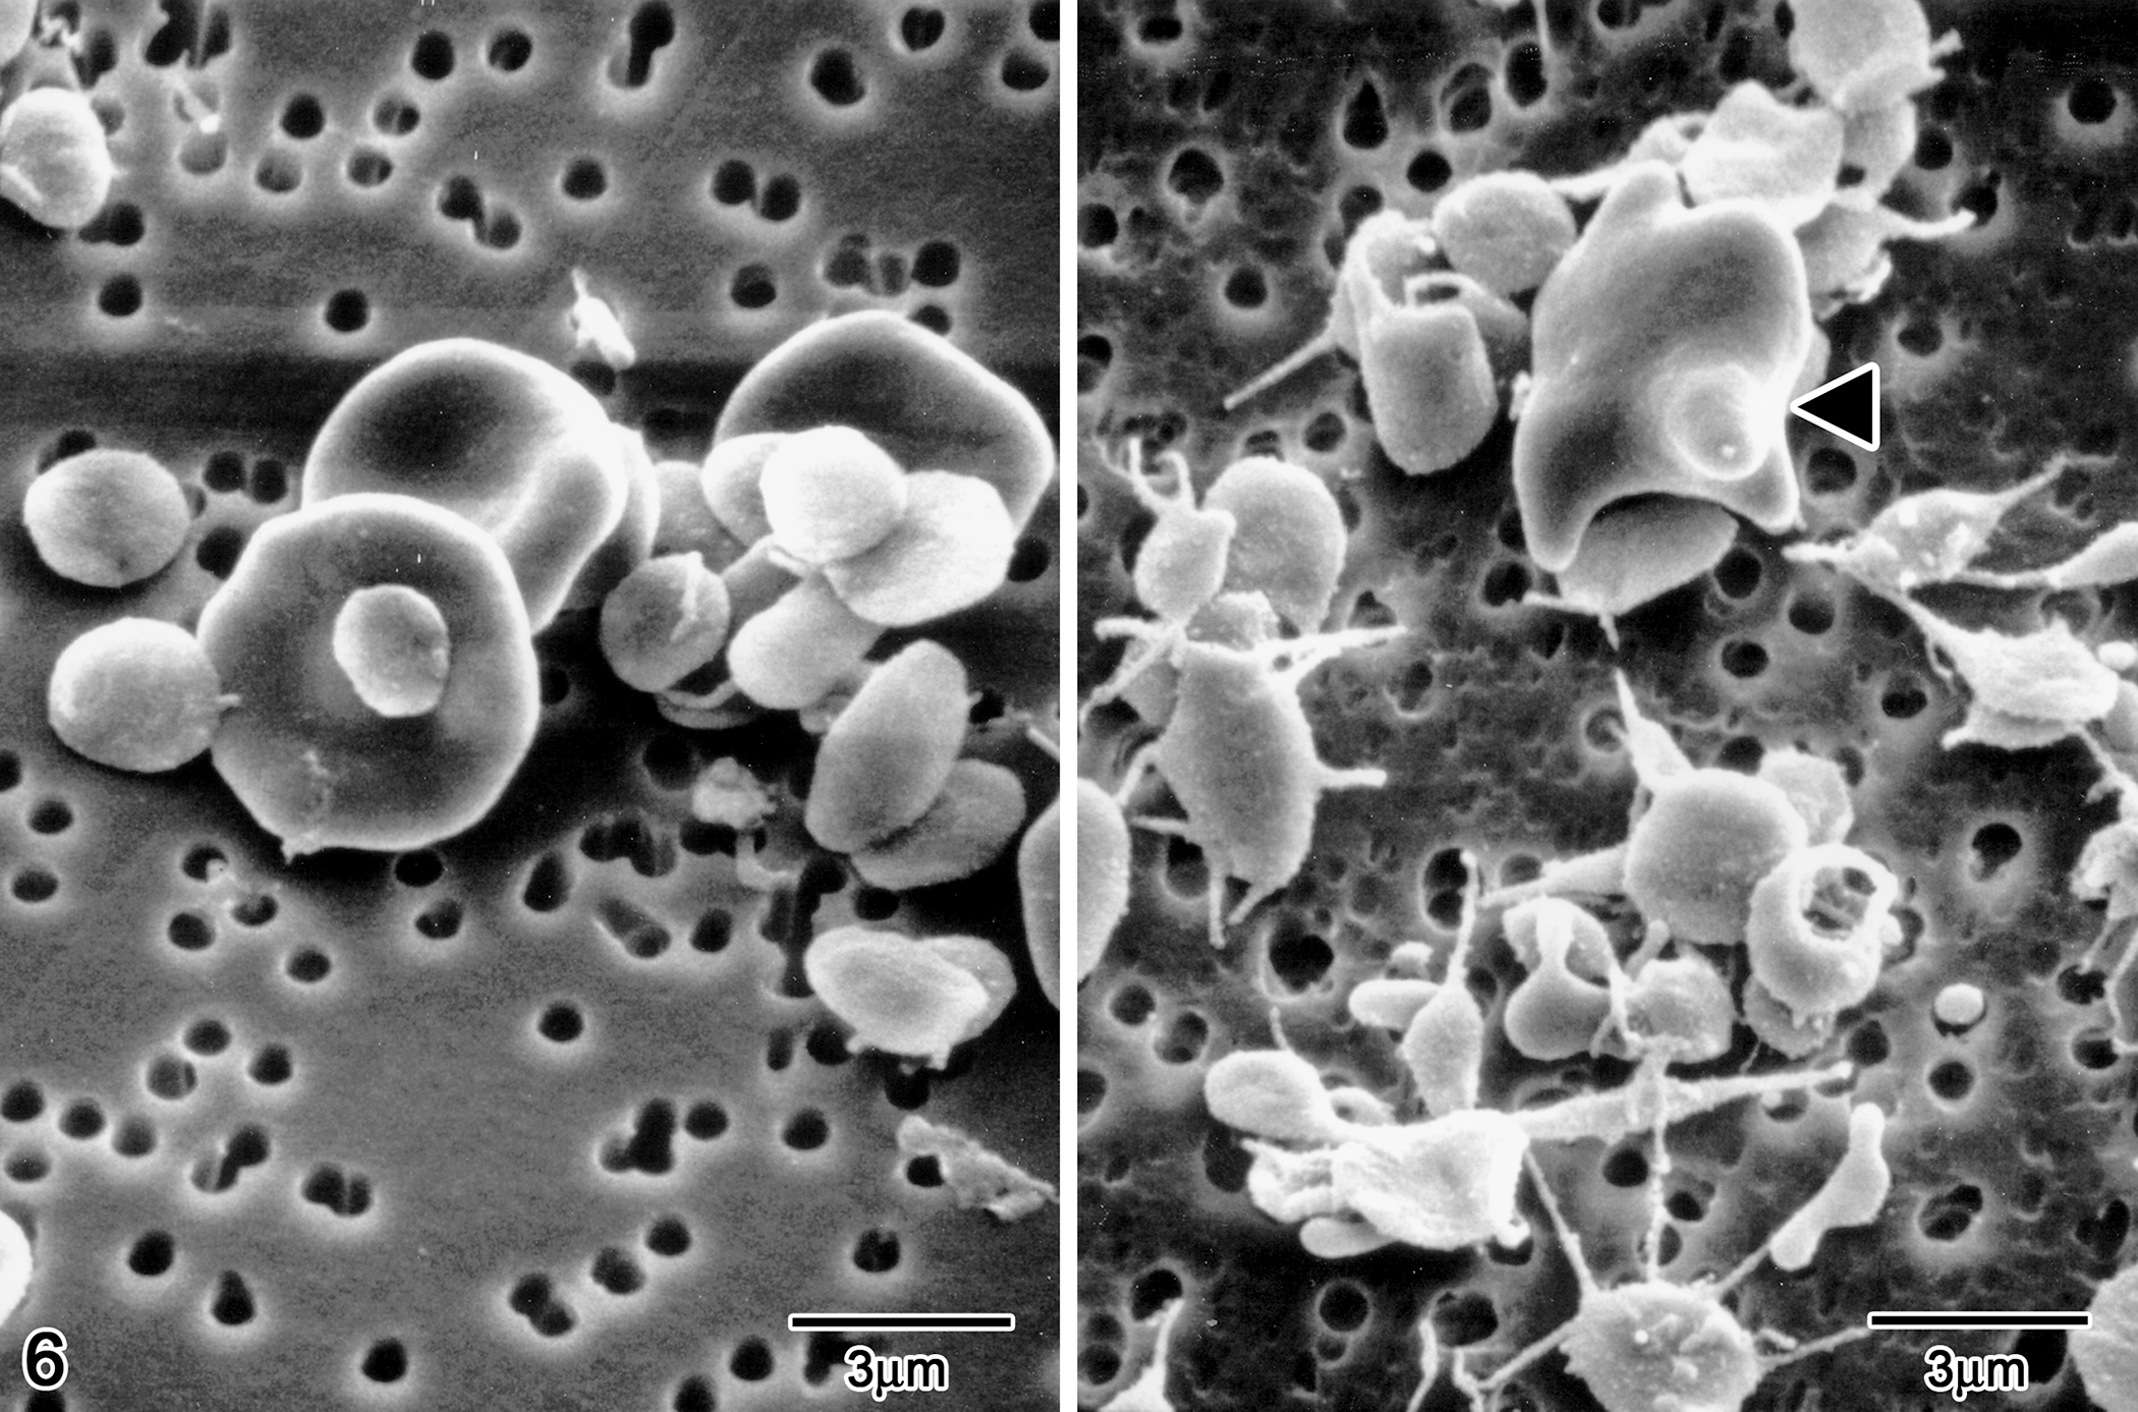
Scanning electron micrograph of red blood cells and platelets from control rat (left) and rat administered 150 mg/kg SCH 900875 (right). An acanthocyte (arrowhead) and several platelets with irregular elongated plasma membrane projection are present. Bar = 3 μm.
Because of the immunomodulatory potential of the drug, the ongoing inflammatory changes in the SCH 900875–treated rats were fully evaluated to explore the possibility of a pharmacologically mediated effect on the immune system. Immunophenotyping analysis of circulating lymphocytes was performed to characterize the lymphocytosis. The observed lymphocytosis was proportional across lymphocyte subpopulations, indicating the lack of a selective effect of SCH 900875 on specific subsets. There were no significant increases in proportion of CD4 or CD8 subsets, or based on CD45RC (naïve/revertant cells). There was a mild to moderate reduction in surface CD62L expression on circulating T cells and a moderate increase in RT1B+ on circulating T and B cells. Minimal to mild increases in RT1B expression on circulating monocytes were also seen. No significant change in the expression of the activation marker CD25 was noted. Circulating T cells, B cells, and monocytes thus demonstrated a test-article-related phenotype consistent with recent and/or ongoing activation. These effects were thought to be secondary and result from the concomitant destruction of erythrocytes and platelets.
Serum concentrations of the T cell–derived cytokines IFNγ, IL-2, IL-4, IL-6, IL-10, and GM-CSF demonstrated no or minimal elevations, which suggested that the observed lymphocytosis and change in CD62L and RT1B seen in this study were unlikely to be mediated by an induction of T cell–derived cytokines. Similarly, there were no or minimal increases in serum levels of the pro-inflammatory mediators IL-1β and TNFα, which indicated that no pro-inflammatory cytokine cascade ensued from the administration of SCH 900875. Although a minimal but statistically significant elevation in serum TNFα levels was observed (33.25 pg/mL for males at 150 mg/kg and 43.85 pg/mL for females at 100 mg/kg versus 19.82 and 22.30 pg/mL for male and female controls, respectively), the concentration of TNFα was notably low in all dose groups and, hence, considered of negligible biological importance. Levels of IL-1β remained below the limit of detection in all groups. As indicated above, serum concentrations of IL-6, which can also be produced by myeloid cells, remained below the limit of detection in all dose groups. A minimal to mild elevation of serum CXCL1 (2-fold) in females at 100 mg/kg and CCL2 (2- to 3-fold) in both sexes at 100 and in males at 150 mg/kg was noted, which may be related to the neutrophilia and the phagocytosis of erythrocytes and platelets by macrophages.
Toxicokinetic data demonstrated that systemic exposure was independent of sex (Table 6 ). Peak plasma concentrations were observed between 1 and 4 hr postdose, with the exception of males at 150 mg/kg, in which the peak was observed 8 hr postdose. Following repeated administration, the plasma concentrations of SCH 900875 were similar at 75 to 100 mg/kg in both sexes but were higher at 150 mg/kg in males (data were available for males only at 150 mg/kg because of the early sacrifice of the high-dose females on day 20). At a given dose, systemic exposure to the major metabolite SCH 769676 was lower than systemic exposure to SCH 900875. Metabolite-to-parent AUC(0-24 hr) ratios ranged from 0.090 to 0.140 in males and from 0.133 to 0.171 in females and remained constant with increasing dose.
Summary of pharmacokinetic parameters following administration of 75, 100, or 150 mg/kg SCH 900875 (males and females combined).
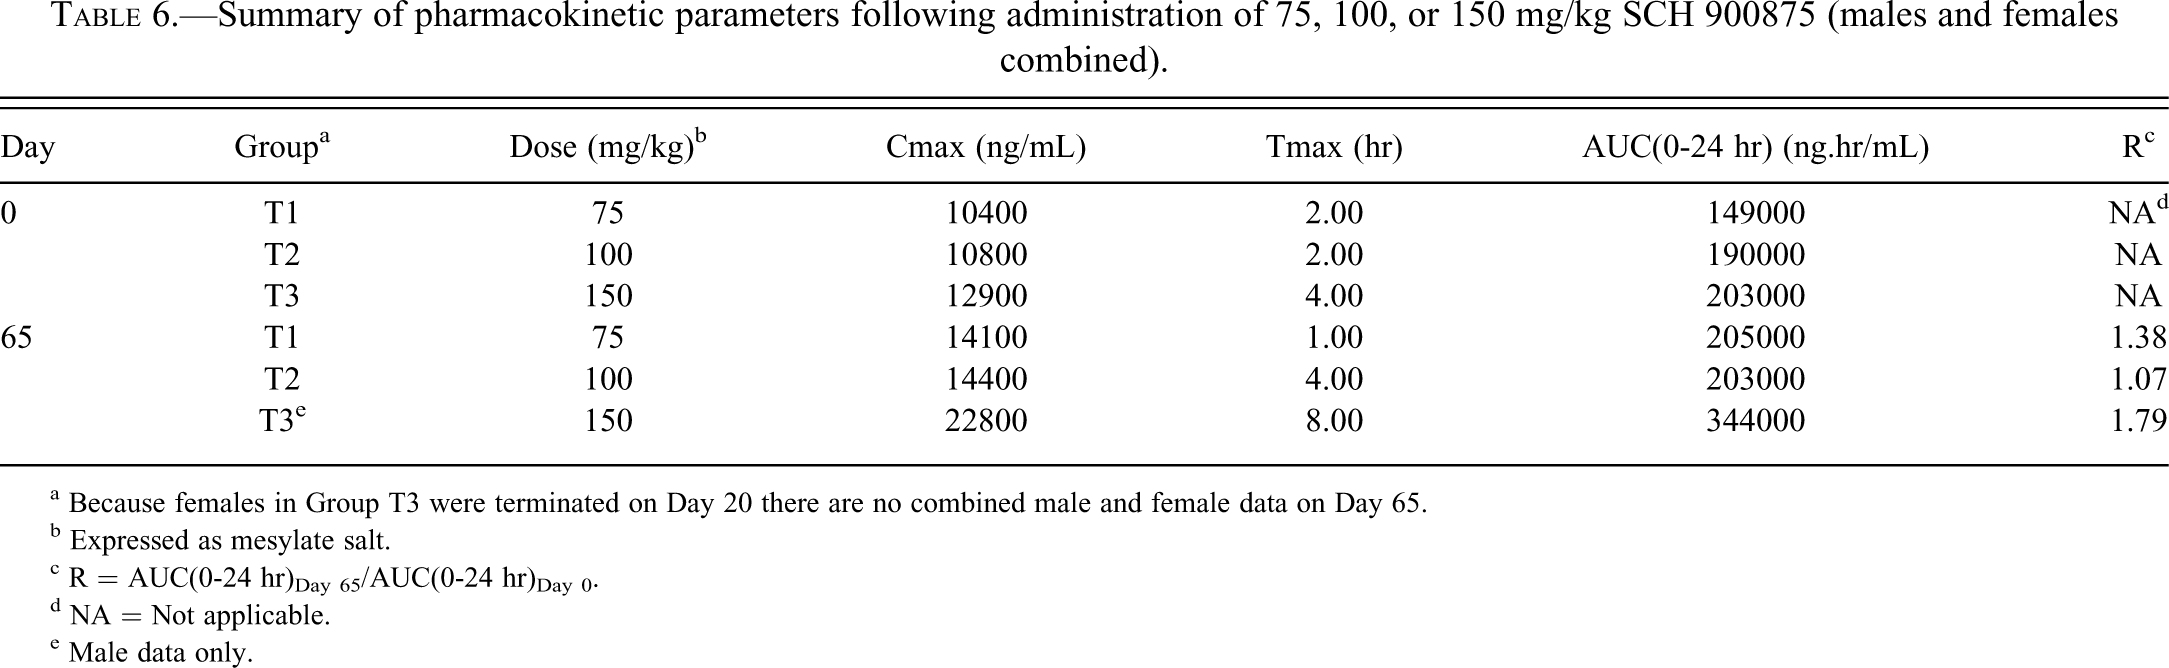
a Because females in Group T3 were terminated on Day 20 there are no combined male and female data on Day 65.
b Expressed as mesylate salt.
c R = AUC(0-24 hr)Day 65/AUC(0-24 hr)Day 0.
d NA = Not applicable.
e Male data only.
Discussion
The absence of obvious internal or external hemorrhage, together with observed erythrocyte morphologic changes (spherocytosis), hyperbilirubinemia, and the strongly regenerative nature of the anemia were indicative of a hemolytic process. Since there was no evidence of intravascular hemolysis such as hemoglobinemia, hemoglobinuria, or increased MCHC, the anemia was considered to be primarily due to extravascular destruction. Likewise, without obvious causes of consumptive coagulopathy such as alterations in coagulation parameters or histologic evidence of thrombi, the regenerative thrombocytopenia was considered most consistent with extravascular destruction. The histopathologic findings in the spleen and bone marrow of accumulation of hemosiderin pigment and/or florid hematopoiesis were consistent with the clinical pathology findings of regenerative, predominantly extravascular hemolytic anemia. The presence of hemosiderin pigment in the tubular cells of the kidney revealed a small amount of leakage of hemoglobin through the glomerular filter, suggesting that a minor intravascular component accompanied the mostly extravascular hemolysis.
The failure to detect immunoglobulin (IgG or IgM) on the surface of red blood cells and/or platelets by flow cytometry or immunohistochemistry did not support an immune-mediated mechanism of destruction. The most frequent type of poikilocyte noted in this study was the acanthocyte. In addition, scanning electron microscopy of blood from 3 middose females and 1 high-dose male rat revealed platelets with slender filiform processes of the plasma membrane. The presence of acanthocytic red blood cells and platelets has been previously associated with altered lipid membrane profiles (Doll 1982; Gallagher and Jarolim 2000). Red blood cell lipid analysis revealed alterations in the lipid membrane profiles, and ex vivo osmotic fragility testing demonstrated increased red blood cell fragility in SCH 900875–dosed rats. This change in RBCs is similar to that observed in dogs with acanthocytic anemia, in which red blood cell fragility was increased, concordant with an increased incidence of acanthocytes (Cooper et al. 1980). Together, the observations of higher red blood cell fragility, increased incidence of acanthocytes, and changes in the lipid membrane profile suggest that alterations in cell membrane composition, structure, and/or function likely contributed to the extravascular destruction of erythrocytes and platelets in this study.
Acanthocytes, or “spur cells,” are abnormally shaped erythrocytes whose plasma membrane structure has been compromised by modification of the normal interactions between the lipid bilayer, membrane proteins, and membrane ion transport systems (Gallagher and Jarolim 2000; Mohandas and Chasis 1993). The cells appear spiculated, with a few blunt elongated surface projections of varying size and surface distribution. Acanthocytes are infrequently described in a few various clinical conditions in humans (Betticher and Pugin 1991; Cooper 1978; Kay and Stricker 1983), and animals (Christopher and Lee 1994; Cooper et al. 1980; Gelberg and Stackhouse 1977; Hirsch, Jacobsen, and Mills 1981; Ng and Mills 1985; Ohba et al. 2007; Shull et al. 1978; Weiss, Kristensen, and Papenfuss 1993). They were first described in the late 1950s in humans as the “spur cells” of the hemolytic anemia associated with alcoholic hepatic cirrhosis (Zieve 1958) and have since been associated with abetalipoproteinemia, anorexia nervosa, severe liver disease, hereditary red cell defects (Gallagher and Jarolim 2000), and hypothyroidism (Betticher and Pugin 1991; Cooper 1978; Kay and Stricker 1983). In these conditions, acanthocyte morphology and the underlying etiology are generally similar, in that an imbalance is created between the outer and inner hemileaflets of the cell plasma membrane, which then drives the outward curvature of the outer hemileaflet. This hypothesis is based upon the fact that the shape of the erythrocyte reflects the ratio of the surface areas of the two hemileaflets. The normal erythrocyte shape of a biconcave disc is a result of an asymmetric composition of the lipid bilayer with phosphatidylcholine and sphingomyelin being the main phospholipids of the outer hemileaflet. The most frequent cause of acanthocyte formation appears to be an alteration in the erythrocyte plasma membrane lipid composition, proportion, or distribution (Cooper 1978).
Beyond these similarities, the specific pathogenesis and lipid composition of the acanthocytes often differ greatly among the various conditions in which they are seen. In humans, acanthocytes of abetalipoproteinemia are characterized by an increased sphingomyelin/phosphatidylcholine ratio (Cooper, Durocher, and Leslie 1977; Iida et al. 1984), while those of severe liver disease exhibit excess cholesterol (Cooper, Durocher, and Leslie 1977) and those of hypothyroidism are partly characterized by decreased phosphatidylcholine (Betticher and Pugin. 1991). In veterinary medicine, an increase in red cell cholesterol/phospholipid ratio caused the hemolytic anemia in dogs fed a cholesterol-rich atherogenic diet (Cooper et al. 1980). Less is known in other instances where associations but no causative mechanisms have been found in animals: acanthocytosis in dogs with hemangiosarcomas (Gelberg and Stackhouse 1977; Hirsch, Jacobsen, and Mills 1981; Ng and Mills 1985) and in a calf with orotic aciduria (Ohba et al. 2007). In dogs and cats with severe liver disease, a striking similarity exists between the veterinary and the human syndromes of the “spur cell” hemolytic anemia (Christopher and Lee 1994; Shull et al. 1978; Weiss, Kristensen, and Papenfuss 1993).
There appears to be no linear relationship between the presence of acanthocytes and the severity of the anemia, and acanthocytes have been associated with variable degrees of hemolysis (Filippini et al. 2007; Betticher and Pugin 1991; Kay and Stricker 1983; Cooper et al. 1980; Shull et al. 1978; Ng and Mills 1985). This may be explained by the complex physicochemical properties that govern red blood cell membrane deformability and behavior under stress (Mohandas and Chasis 1993). In human patients with spur cell anemia, animals fed an atherogenic diet, and in vitro, it has been demonstrated that cholesterol enrichment of RBC membranes led to changes in membrane surface area, cell phenotype, and membrane fluidity (Cooper 1978; Cooper et al. 1975, 1980). However, decreases in fluidity correlated closely with increases in membrane cholesterol/phospholipid ratios over the range from 1.0 to 2.0, but only little additional decreases in fluidity were seen with cholesterol/phospholipid ratios of 2.0 to 3.0 (Cooper 1978). In one controlled experiment where dogs were fed an atherogenic diet, increases in cholesterol/phospholipid ratio and decreased membrane fluidity appeared within 3 days; however, increased osmotic fragility and decreased hematocrit only followed 6 weeks later. Moreover, the severity of the anemia varied greatly among individual dogs and different breeds (Cooper 1978).
In all the cases described, the acanthocytic phenotype is acquired from the plasma as the red blood cells, lacking the machinery to synthesize lipids de novo, do not directly control the chemical composition and fluidity of their plasma membrane. It has been demonstrated that lipids readily exchange over time between the plasma and the erythrocyte membrane compartments to reach equilibrium (Cooper et al. 1975; Cooper 1978). However, the variability in incidence under seemingly equivalent circumstances suggests that other factors may influence the development of acanthocytosis. In this study, we have demonstrated a decrease in phosphatidylcholine, overall cholesterol, and/or sphingomyelin in the plasma membrane of the erythrocytes of the SCH 900875–treated rats associated with the acanthocytic phenotype. Concomitant with the changes in the lipid composition of the erythrocyte plasma membranes, increased cholesterol and decreased triglycerides levels were observed in the serum of SCH 900875–treated rats. As cholesterol and phosphatidylcholine are known to be the most exchangeable of the red blood cell membrane lipids, we believe that the alterations in plasma lipid composition have in some fashion dictated the changes in the composition of the red blood cell membranes that ultimately resulted in decreased membrane deformability and consequently extravascular hemolysis. According to this, incubating normally shaped erythrocytes in the plasma from rats with acanthocytosis would result in the incubated erythrocytes acquiring the acanthocytotic phenotype over time when into the plasma with altered lipid composition. The lack of increased osmotic fragility after in vitro incubation of naïve erythrocytes with the drug with/without its metabolite indicates that the mere presence of the drug does not suffice to induce increased osmotic fragility, supporting the hypothesis that drug intercalation within the RBC membrane was not directly responsible for erythrocyte destruction. Conversely, increased osmotic fragility in the ex vivo assay suggests that the intervention of event(s) occurring in vivo was necessary for the observed clinical manifestations.
By their nature as anucleated cells, platelets most likely share with red blood cells increased susceptibility to altered environmental conditions. Indeed, scanning electron micrographs showed that the platelets possessed membrane changes similar to those occurring in red blood cells after administration of SCH 900875. Other investigators have demonstrated that the erythrocyte abnormalities in acanthocytosis were extended to platelets and that, similarly to red blood cells, platelets incubated in the plasma of patients with acanthocytosis acquired the characteristic membrane abnormalities (Doll 1982; Ulibarrena, Vecino, and Cesar 1994). In the present case, the detection by SEM of morphological deformities in platelets analogous to those noted in the acanthocytic erythrocytes suggests that possibly similar alterations in the lipid composition of the plasma membrane have taken place in both erythrocytes and platelets. Therefore, we postulated that the thrombocytopenia observed in this study resulted from excessive destruction of platelets following acquired morphologic changes in their plasma membrane. It has been previously suggested that the membrane abnormalities in platelets of patients with spur cell anemia could be associated with alteration of function and/or activation (Doll 1982). In this study, increased platelet activation seems unlikely given the absence of clinical and anatomic pathologic evidence of activation of coagulation. Alternatively, we cannot exclude the possibility that platelets may be sequestered in the enlarged spleens or undergoing apoptosis (Warkentin and Kelton 2000; Mason et al. 2007; Kile 2009).
Hypercholesterolemia and low serum triglycerides were previously observed at lower doses in rats with minor changes in hematologic parameters. In a previous 3-month study in rats at doses of 10, 30, and 60 mg/kg, a minimal decrease in hematocrit and platelet numbers with reticulocytosis was observed in males and females at 30 and 60 mg/kg, respectively. Recovery was complete after 1 month, indicating that these changes were reversible. In that study, triglyceride levels were decreased in males at 60 mg/kg and in females at all doses, and cholesterol levels were increased in females at 60 mg/kg. The cholesterol/triglycerides ratio in the serum was 2.5 in females at 60 mg/kg versus 0.47 in controls and returned to 0.8 after the postdose recovery period. In the 3-month dose-range-finding study described in this article, the serum cholesterol/triglycerides ratio was 4.21 in females at 100 mg/kg and 2.50 in males at 150 mg/kg compared with 0.26 and 0.28 in female and male controls, respectively. Decreases in serum triglycerides are usually attributed to changes in food consumption. In this study, the decreases in triglycerides occurred while the food consumption was actually increased in females at 100 mg/kg and males at 150 mg/kg. The mechanism by which SCH 900875 alters serum lipids is unknown. There were no changes in mean serum lipid values in the 3-month monkey study at doses of 3, 10, and 30 mg/kg. However, the monkeys at 30 mg/kg developed a mild transitory regenerative anemia on week 3/4, which recovered spontaneously by the end of the study. This transient anemia was not reproduced in the 9-month monkey study. The absence of serum lipid changes with SCH 900875 treatment in the monkey may reflect differences in species sensitivity or exposure to the drug.
The significance of the lymphocytosis is unclear. Lymphocytosis was proportional across subpopulations and was not accompanied by an increase in serum globulins or antibody bound to red blood cell or platelet membranes. There were no effects on TDAR or NK responses in a previous rat immunotoxicity study at doses up to 60 mg/kg. These changes in leukocyte parameters (moderate leukocytosis due to lymphocytosis and neutrophilia) were suggestive of an inflammatory leukogram associated with circulating T cells, B cells, and monocytes demonstrating recent or ongoing cell activation as shown by changes in surface expression of CD62L and RT1B+ and minimal to mild elevations in CXCL1 and CCL2 (neutrophil and monocyte chemokines, respectively) that could be associated with the extravascular destruction of platelets and red blood cells. These increases in white blood cell numbers were not associated with changes in serum levels of GM-CSF, IFNγ, IL-1β, IL-2, IL-6, IL-10, and TNFα suggestive of further modulation of immune function.
Finally, other serum chemistry changes, such as minimal hyperglycemia, seen in female rats at 150 mg/kg sacrificed on day 20 for humane reasons were attributed to stress and the rats' compromised condition. Loss of serum proteins into the subcutaneous edema and/or fluid in the thoracic cavity may have contributed to the lower total protein, albumin, and globulin values in these high-dose females. The hyperbilirubinemia was most consistent with increased turnover of heme that accompanies extravascular hemolysis. The high GGT values were consistent with increases in biliary hyperplasia seen histologically in the liver.
This is, to the authors' knowledge, the first study characterizing a dose-dependent hemolytic anemia and thrombocytopenia in rats in which increased cell destruction was probably triggered by alterations in the lipid composition of the plasma membrane of erythrocytes and platelets, which were, in turn, associated with hypercholesterolemia and decreases in serum triglycerides caused by SCH 900875. Although we cannot exclude the possible involvement of other factors intervening from the serum lipid values to the altered lipid composition of the plasma membrane of the cells, both the serum lipid alterations and the anemia observed constitute clear biomarkers that lend themselves to straightforward monitoring.
Footnotes
Acknowledgments
The authors thank Mr. Kenard Lee for outstanding photographic assistance.