
Abstract
Formaldehyde has long been used in the chemical inactivation of viral material during vaccine production. Viral inactivation is required so that the vaccine does not infect the patient. Formaldehyde is diluted during the vaccine manufacturing process, but residual quantities of formaldehyde are still present in some current vaccines. Although formaldehyde is considered safe for use in vaccines by the Food and Drug Administration, excessive exposure to this chemical may lead to cancer or other health-related issues. An assay was developed that is capable of detecting levels of residual formaldehyde in influenza vaccine samples. The assay employs incubation of dosage formulation suspensions with hydralazine hydrochloride under mildly acidic conditions and elevated temperatures, where formaldehyde is derivatized to yield fluorescent s-triazolo-[3,4-a]-phthalazine. The assay has been traditionally run by high-performance liquid chromatography, where runtimes of 15 minutes per sample can be expected. Our laboratory has developed a plate-based version that drastically improved the throughput to a runtime of 96 samples per minute. The assay was characterized and validated with respect to reaction temperature, evaporation, stability, and selectivity to monitor residual formaldehyde in various influenza vaccine samples, including in-process samples. Heat transfer and evaporation will be especially considered in this work. Since the assay is plate based, it is automation friendly. The new assay format has attained detection limits of 0.01 µg/mL residual formaldehyde, which is easily able to detect and quantify formaldehyde at levels used in many current vaccine formulations (<5 µg/0.5-mL dose).
Introduction
Formaldehyde, while carcinogenic and mutagenic, is ubiquitous in our environment. It can be emitted from sources such as insulation, wooden furniture, automobile emissions, and cigarette smoke and is a major component of indoor air pollution. 1 Formaldehyde is used extensively in industrial applications such as in the production of resins used in adhesives, laminating agents, foam insulation, fabrics, and coatings and is one of the most prevalent and problematic pollutants found in the workplace and ambient environments. 2 Acute exposure to formaldehyde can cause nausea, headache, thirst, contact dermatitis, allergic reaction, and tiredness, while prolonged exposure can lead to respiratory issues such as asthma or even cancer.2,3 In addition, the toxicity of formaldehyde to bacteria, viruses, fungi, and parasites has been exploited by the food/beverage and vaccine production industries. 4
To ensure patient safety, influenza vaccines are typically manufactured and marketed as killed or inactivated (injection) or live attenuated (intranasal spray) products. Although both are safe and effective, vaccines made of inactivated influenza virion are the most popular and have been in use for 60 years. 5 Formaldehyde is one of two common inactivation agents in the production of influenza vaccines. Even though free formaldehyde must never exceed 0.74 g/L in the United States 6 and 0.2 g/L in Europe, 7 the currently marketed influenza injectable vaccines have been reported to contain anywhere between ≤5 µg/0.5 mL and ≤100 µg. 8 In fact, the lowest amount of formaldehyde reported in a marketed vaccine product is 0.6 µg/mL.
Many methods rely on a variety of analytical techniques to detect and quantify residual formaldehyde. Due to its low molar absorbance, formaldehyde analysis has typically involved chemical derivatization followed by absorbance or fluorescence detection. 9 Many common derivatization reagents have the potential to react with additional aldehydes present in the vaccine formulation, decreasing overall assay specificity; therefore, separation-based detection methods such as gas chromatography (GC) or high-performance liquid chromatography (HPLC) are often employed following the derivatization reactions. Instrumentation required for these assays can take up significant space in a laboratory, can be complicated to use, and usually requires extensive training of technical staff. Analysis times are typically in the range of 10 to 15 min per sample, decreasing overall throughput.1,9
Chromogenic assays for the detection of formaldehyde offer the convenience of reduced analysis time and decreased instrumental complexity. Throughput of these assays can be slightly higher than chromatographic methods; however, there are many issues involving reagent stability and safety. 10 Microplate-based methods are another popular option for formaldehyde detection as they are more simplified, are faster, and have the potential to be automated, which can improve throughput. One such automated method measures bacterial growth inhibition via fluorescence detection, but bacterial cultures must first be grown for 18+ h followed by a 3-hour incubation in the microplate. 11 Another plate-based method offers the convenience of a commercially available kit and a 15-min room temperature incubation, but the detection reagent must be weighed out and reconstituted in a DMSO solution each day, opening up the potential for variability. 12
Here we present a robust, high-throughput, high-temperature, rapid, microplate-based assay for quantitative formaldehyde detection based on the reaction of formaldehyde with the derivatization reagent hydralazine hydrochloride ( Fig. 1 ). This assay is based on the HPLC platform originally described by Cohen and Tway 9 and relies on the detection of the fluorescent product formed by the derivatization of formaldehyde with hydralazine hydrochloride. Our assay offers many advantages over the current technologies: it is relatively short and simple, with sample preparation taking place in under 30 min. We have proposed an assay platform that can be run safely and successfully at high temperatures, can be fully automated, and requires relatively inexpensive reagents and instrumentation, with the results being analyzed on a standard fluorescence plate reader. As World Health Organization (WHO) member countries increase influenza vaccine manufacturing capabilities in the event of pandemic, this assay presents a promising platform that could easily be incorporated into a vaccine release testing portfolio.
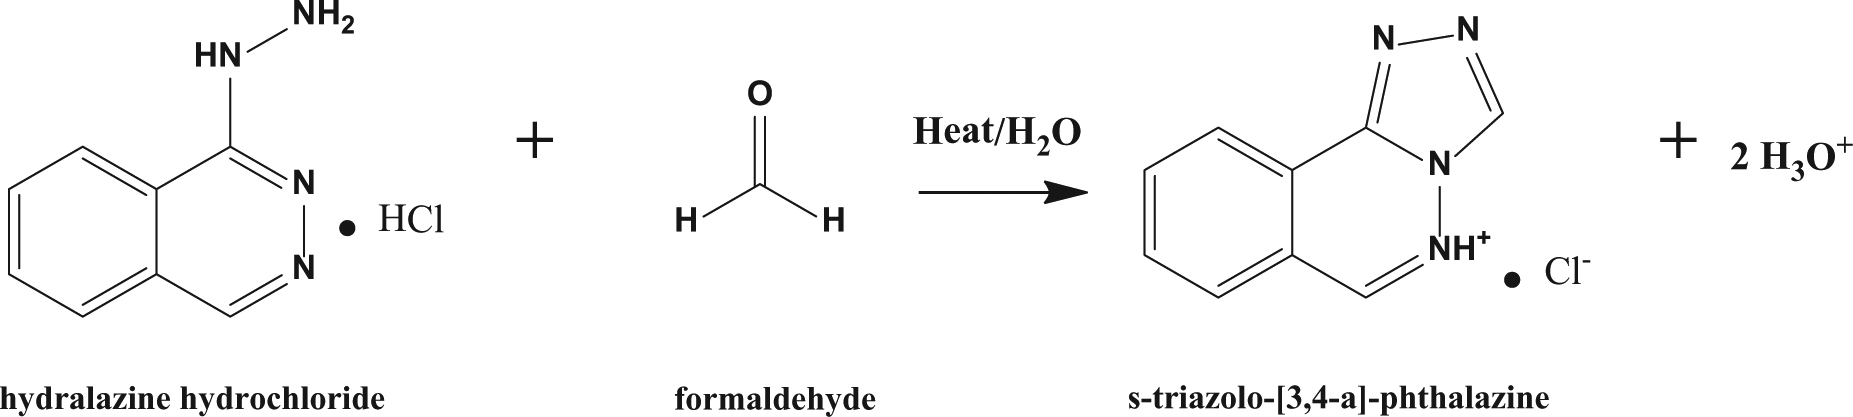
Hydralazine reaction schematic, where the s-triazolo-[3,4-a]-phthalazine product is fluorescent at 398 nm upon excitation at 250 nm.
Materials and Methods
Materials
Formaldehyde stock solution (36.5%–38%), used to prepare working standards, and hydralazine hydrochloride, used as the derivatization reagent, were both supplied from Sigma-Aldrich (St. Louis, MO). Potassium phosphate monobasic was purchased from Fisher Scientific (Fair Lawn, NJ). Black polystyrene, flat-bottomed, 96-well microplates (3650; Corning, Corning, NY) were used in the initial plastic versus glass microvial studies. Adhesive PCR sealing film was purchased from Thermo Scientific (Waltham, MA). A microplate shaker (Titer Plate Shaker, model no. 4625) was from Barnstead International (Dubuque, IA). A heating block (model no. 2052FS) with an insert to fit a 96-well plate was purchased from Fisher Scientific (Dubuque, IA). A microplate reader (Synergy 4) and its accompanying software, Gen5 Data Collection and Analysis, were from BioTek Instruments (Winooski, VT). A 96-well aluminum base plate along with 0.5-mL glass cylinder vials (Laboratory Supply Distributors Corp., Vineland, NJ) was used to carry out the derivatization reaction. A Precision XS automated liquid handler (BioTek Instruments) was used for all automated liquid transfers and assay assembly. The performance of the Precision XS automated liquid handler was evaluated by an MVS Multichannel Verification System (Artel, Westbrook, ME).
Solution Preparation
A 20-µg/mL stock solution of formaldehyde standard was prepared by diluting 50 µL of the 36.6% formaldehyde solution into 1 L of analytical grade water (MilliQ Integral System; EMD Millipore, Billerica, MA). This solution was then diluted 1:10 in potassium phosphate buffer for working standards starting with 2 µg/mL as the highest concentration. Hydralazine hydrochloride was diluted in 0.2 M potassium phosphate buffer, pH 4.6, to a concentration of 0.1 mg/mL. This solution is light sensitive and was therefore stored in an amber bottle with a shelf life of approximately 2 weeks.
Conventional Microplate Format
Formaldehyde standards were diluted across a 96-well plate using 0.2 M phosphate buffer, pH 4.6, as the diluent and ranged from 2.0 to 0.0020 µg/mL. A 2-fold serial dilution was performed in the plate beginning with 200 µL of a 2.0-µg/mL formaldehyde working standard, then transferring 100 µL across the plate, mixing with 100 µL phosphate buffer diluent. The total volumes of diluted standards in each well were 100 µL, with one column in the plate reserved for blanks only containing 100 µL of phosphate buffer. Next, 100 µL of 0.1 mg/mL derivatization reagent (optimized concentration to provide best signal, as described later) was then added to all wells containing standards and blanks. An adhesive PCR plate-sealing film was applied to the plate; the plate was placed on a plate shaker for 1 min to mix the reaction and was then transferred to a heat block set to 70 °C. After incubating for 30 min, the plate was allowed to cool to room temperature. The plate was placed in the plate reader after carefully removing the plate seal. Fluorescence detection was accomplished via the double grating monochromator mode in the Synergy 4 multimode plate reader, where the excitation wavelength was set to 250 nm (2-nm spectral bandpass) and the emission wavelength was set to 398 nm (2-nm spectral bandpass).
Alternative High-Temperature Glass Microvial Format
An aluminum plate base was loaded with 96 glass well-shaped vial inserts (“glass microvial format”) ( Fig. 2 ). A 400-µL aliquot of 2.0 µg/mL formaldehyde working standard was added to column 1 and 200 µL of buffer added to all other wells. A 2-fold serial dilution was performed by transferring 200 µL of formaldehyde from column 1 to the subsequent columns across the entire plate. Next, 200 µL of derivatization reagent was added to all wells, where the total well volume was 400 µL. The plate was then sealed with a silicone lid, and the reaction was allowed to proceed at 100 °C for 15 min. After the reaction was complete, the plate base and glass vials were cooled to room temperature. A 200-µL aliquot was then transferred from each well via the Precision XS automated liquid dispenser to a black 96-well plate for fluorescence detection.
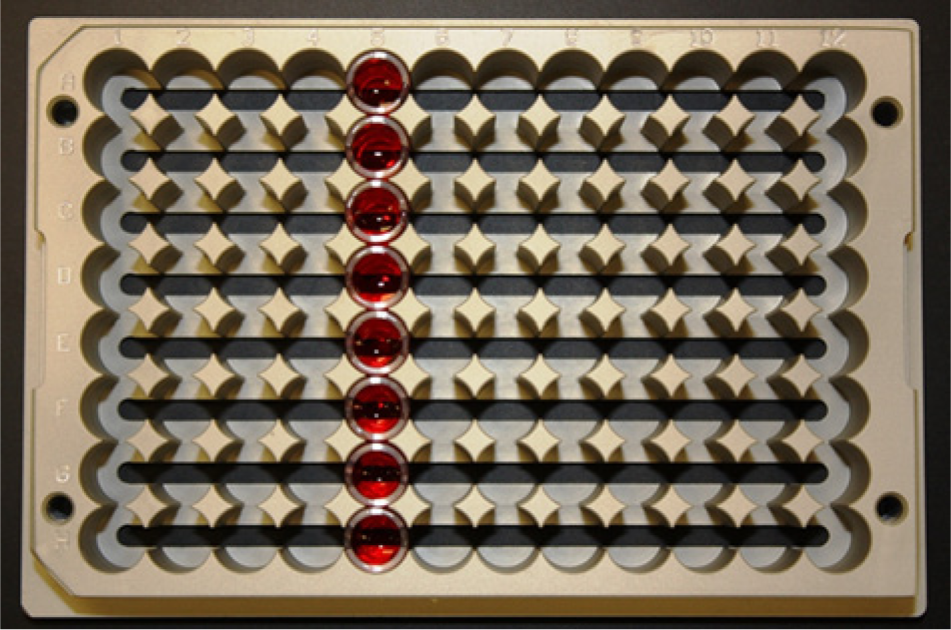
Photograph of the 96-well aluminum base plate with glass microvials in column 5. The aluminum base plate fits into standard SLAS (ANSI/SBS 2-2004) microplate dimensions.
Optimization of Reaction Conditions
After evaluating different heating and cooling times as well as reaction temperatures, it was determined that the most accurate and time-efficient method was to use the 96-well glass microvial format incubated at 100 °C for 15 min. Incubation in the polystyrene 96-well plate was accurate and reliable but was not as time-efficient as the former. It required longer incubation times at lower temperatures such as 70 °C for 30 min with a 30-min cooling period and still resulted in slight plate deformation due to melting. This created problems such as an increase in variability and higher background noise. The glass microvial format is heat and chemical resistant and is in the same footprint as a standard 96-well plate, making automation possible.
HPLC Method
High-performance liquid chromatography based on a method by Cohen and Tway 9 was used to provide additional corroborative data. The HPLC system (Prominence UFLC, Shimadzu, Japan) consisted of a photodiode array detector (UV absorbance monitored at 254 nm) and a fluorescence detector (excitation set to 250 nm and emission set to 398 nm). The column temperature and flow rate were held constant at 40 °C and 0.6 mL/min, respectively. A 20-µL sample injection was separated on a Kinetex C18, 2.6 µm, 100Å, 150 × 4.6–mm column (Phenomenex, Cupertino, CA). The formaldehyde derivative was separated from other species by use of the following gradient: 0 to 9.50 min (30% B to 43% B), 9.50 to 10.0 min (43% B to 30% B), and 10.0 to 14.0 min (30% B). Mobile phase A consisted of 50 mM potassium phosphate buffer, pH 4.6, and mobile phase B consisted of 100% acetonitrile.
Results and Discussion
To determine optimal reaction conditions, hydralazine derivatization reagent concentration, reaction vessel, reaction time, and reaction temperature were considered. Although the concentration of derivatization reagent was 0.1 mg/mL as described by Cohen and Tway, 9 we felt it was prudent to investigate a wider range of concentrations due to the differences in assay format. By increasing the concentration to 10 mg/mL, the fluorescence signal was significantly suppressed ( Fig. 3 ). To examine possible causes, the completed reactions were then analyzed by HPLC. All samples but the lowest concentration of derivatization reagent, as expected, had the same signal level ( Fig. 4 ). Since HPLC separates mixtures into components ( Fig. 5A , B ), the results indicate that the quenching is due to a component and not that the reaction mixture was incomplete. Notice the large peak in Figure 5A at a retention time of about 2.5 min. This peak is not evident in the fluorescence chromatogram in Figure 5B , where the main peak is the derivatized formaldehyde product. Furthermore, a similar trend was observed by spiking completed reactions with an additional 5-µL aliquot of 10 mg/mL of hydralazine reagent. In this case, the signal was measured by obtaining a fluorescence spectrum to see whether the emission wavelength shifted. As seen in Figure 6 , the signal was suppressed, but the emission wavelength remained unchanged. These results indicate that compounds (likely hydralazine itself, since it does absorb light near the excitation wavelength of the reacted derivative) within the reaction can quench the overall fluorescence signal in the plate. Therefore, 0.1 mg/mL hydralazine derivatization reagent was used for the remainder of the studies.
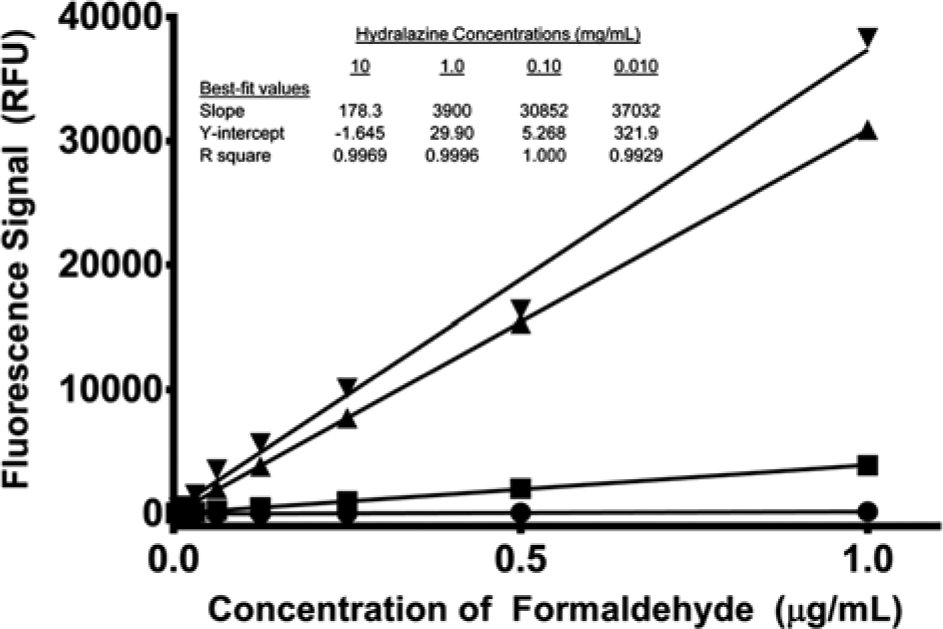
Effect of hydralazine derivatization reagent concentration on signal, where detection was conducted by the plate reader. The hydralazine concentrations were 0.01 mg/mL (▼), 0.1 mg/mL (▲), 1 mg/mL (■), and 10 mg/mL (●). The lines represent the best fit using linear least squares regression for each concentration of hydralazine. RFU, relative fluorescence units.
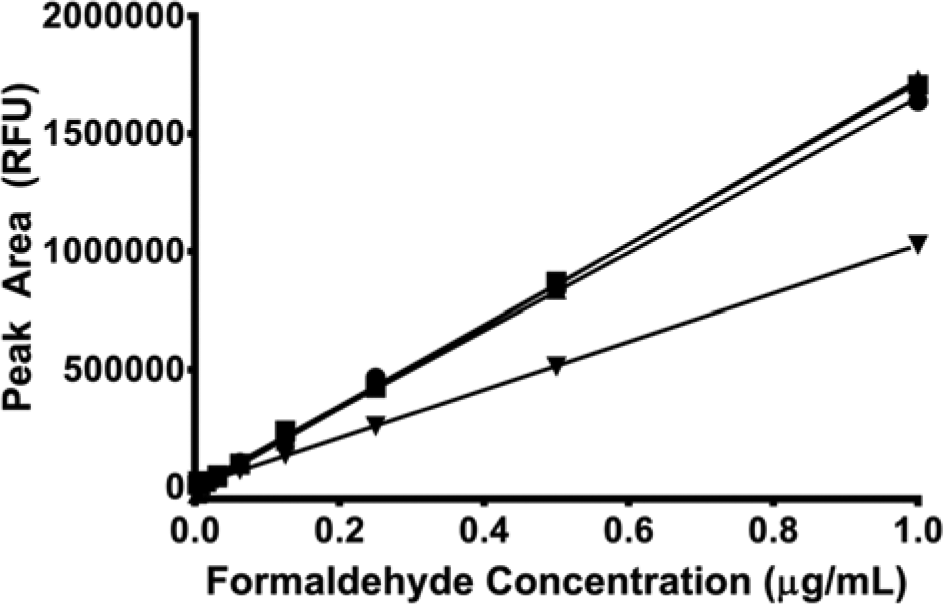
Effect of hydralazine derivatization reagent concentration on signal, where detection was conducted by high-performance liquid chromatography. The hydralazine concentrations were 0.01 mg/mL (▼), 0.1 mg/mL (▲), 1 mg/mL (■), and 10 mg/mL (●). The lines represent the best fit using linear least squares regression for each concentration of hydralazine. RFU, relative fluorescence units.
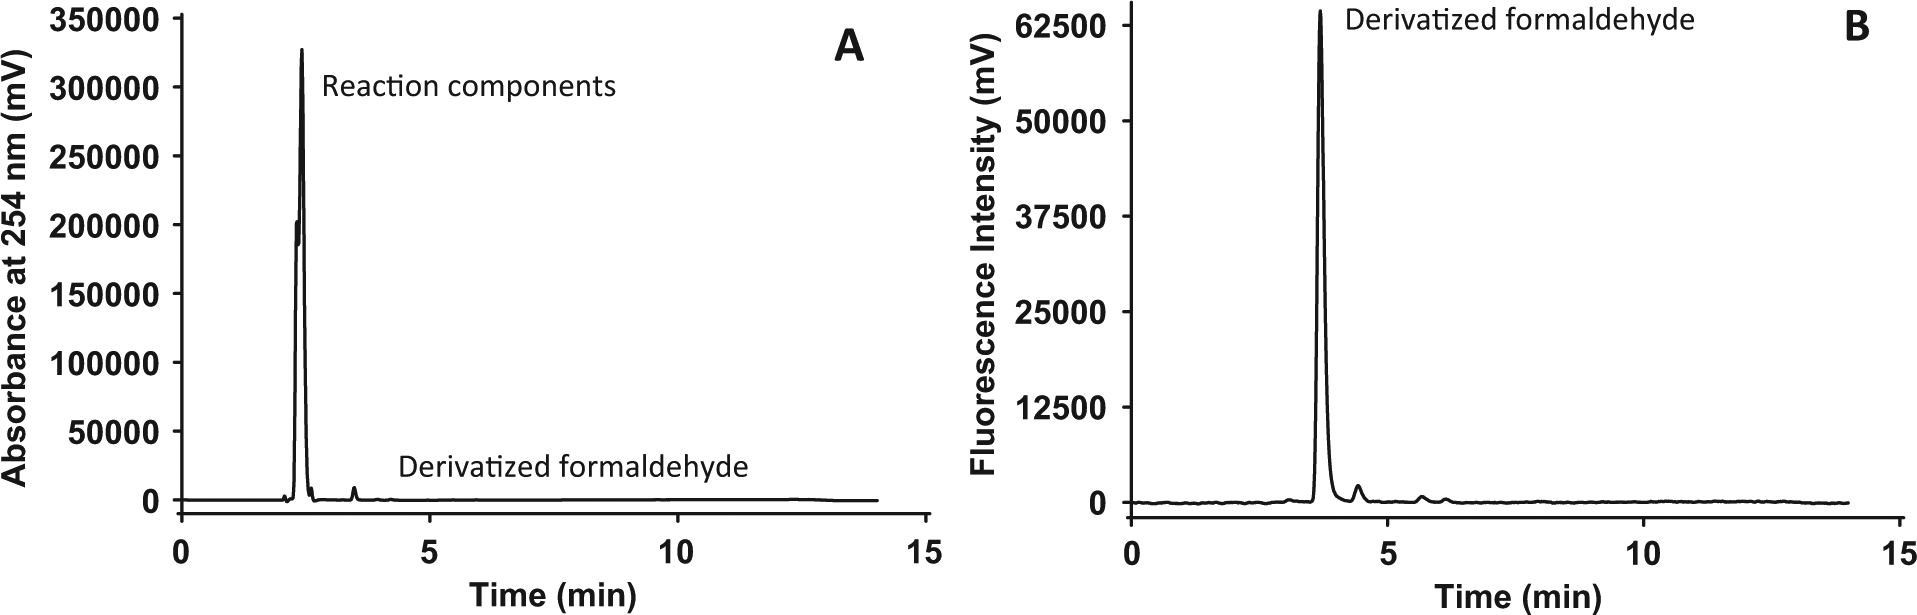
Representative high performance liquid chromatographs displaying UV absorbance (A) and fluorescence (B) detection. The detection occurred in tandem for the same sample injection. The chromatogram was obtained by allowing hydralazine (1 mg/mL) to react with formaldehyde (2.0 µg/mL) for 10 minutes at 100 °C in glass vials.
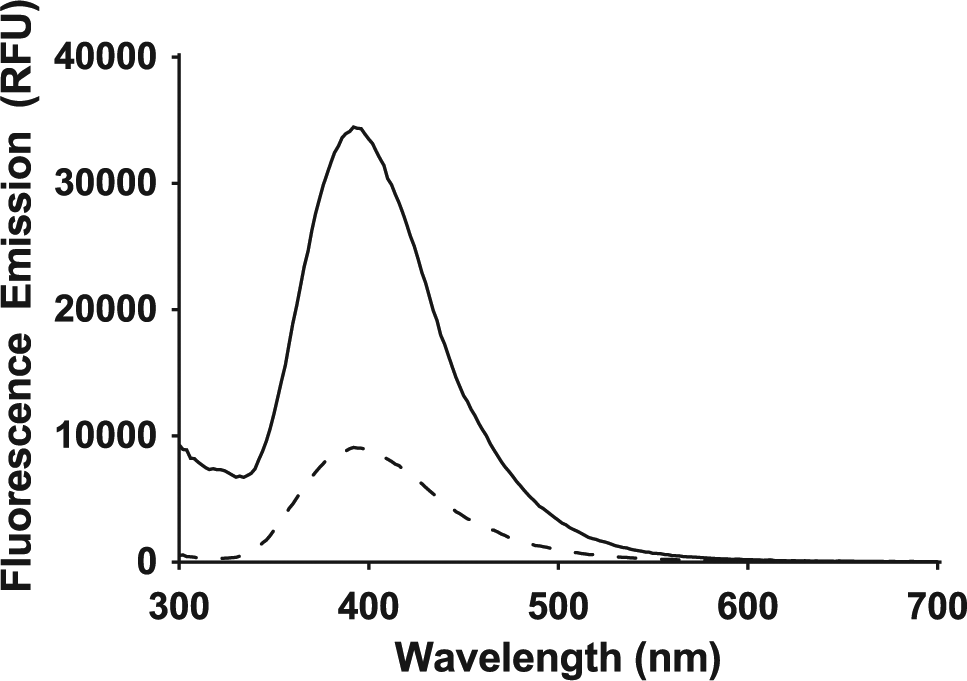
Spectral scans on reaction solution before (–) and after (---) the hydralazine spike. Excitation was set to 250 nm while the emission spectra were monitored from 300 to 700 nm in 2-nm increments. RFU, relative fluorescence units.
The use of plastic 96-well plates versus glass microvials was investigated. The benefits of using the same plastic microplate for reaction as well as detection may seem obvious: it minimizes an assay transfer step, thereby minimizing some assay variability due to liquid transfer. Upon initial tests, the structural integrity of the black polystyrene plate became compromised during incubation at temperatures higher than 75 °C. Furthermore, leaching of plasticizers3,13 into the reaction solution likely contributed to a higher background (data not shown). The glass microvials behaved similarly in nature to the glass test tubes previously described, 9 in that they were inert. Furthermore, they are designed to withstand higher temperatures, which results in shorter reaction times. Finally, the aluminum base plate conducts heat very well, allowing for faster and more even heating. Although the standard curves were similar in terms of linearity, the limit of detection for the glass microvials (0.015 µg/mL) was approximately 10 times lower than the plastic plate (0.12 µg/mL).
Assay Optimization
Reaction kinetics was examined by testing both plastic microplates and glass microvials. In these cases, it was found that plastic microplates needed to be heated for at least 30 min at 70 °C to obtain a reasonable signal. Longer reaction times and higher temperatures improved signal but resulted in higher variability due to plate warping and evaporation. The glass microvials required heating for only 15 min at 100 °C ( Fig. 7 ). Other reaction temperatures (25, 37, and 50 °C) were studied, but virtually no product was detectable within a reasonable period (<60 min).
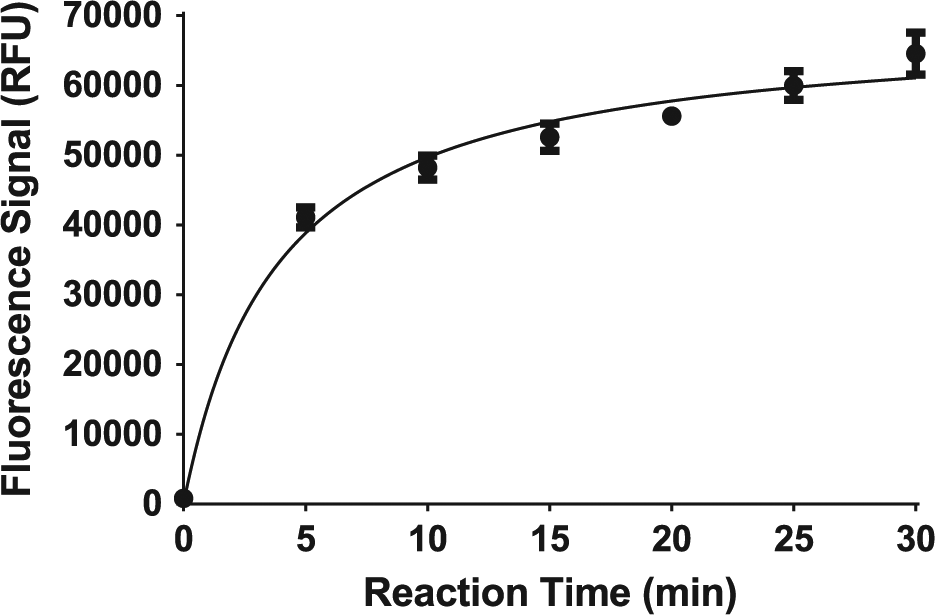
Effect of reaction time on assay signal, where the reaction was carried out in the glass microvial format at 100 °C. Each point reflects the mean (n = 3) ±1 standard deviation. RFU, relative fluorescence units.
Reaction cooling time was also evaluated by reading the plates at different times following the reaction. The plastic microplate needed to be cooled at room temperature for at least 30 min prior to reading. Although the glass microvials required an initial cooling of about 10 min, additional rapid cooling occurred within the tips during the transfer step as well as when the liquid came into contact with the assay microplate. This more rapid, even cooling method translated into improved precision for the glass microvial format.
The effect of buffer pH on reaction efficiency was monitored by evaluating pH 4.6, 6.0, 7.0, and 8.0 ( Fig. 8 ). The signal continued to drop as the pH increased. In fact, relative to pH 4.6, the signal dropped by 22% at pH 6.0 and by 26% at pH 8.0. A similar trend was observed in both plastic microplate and glass microvial formats. These results indicate an optimal pH of 4.6.
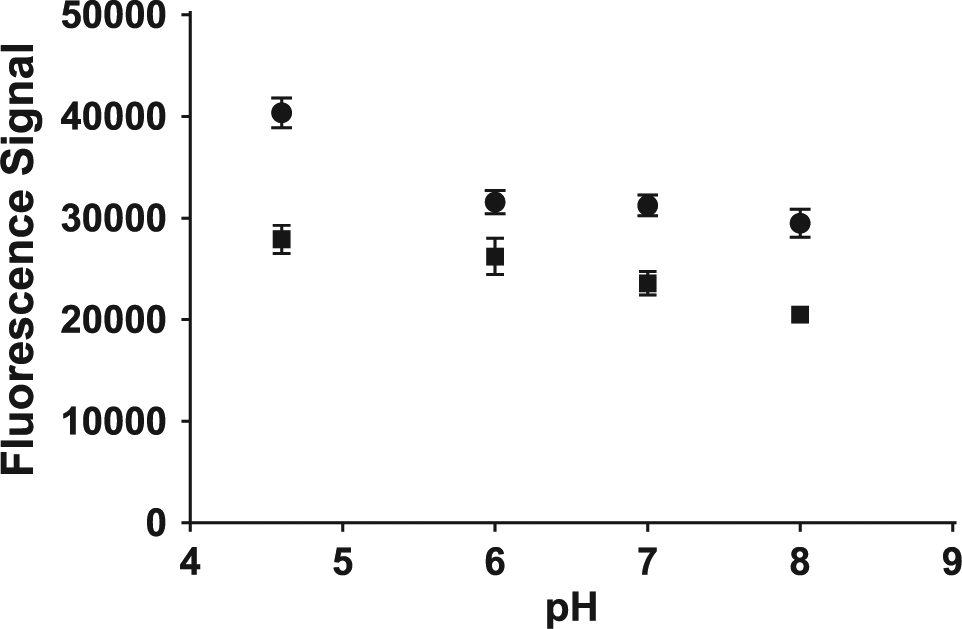
Effect of reaction pH on signal, where the reaction was conducted in the glass microvial (●) and plastic microplate (■) formats. Each point reflects the mean (n = 3) ±1 standard deviation.
Next, reaction stability was tested in both formats. In this case, the reaction was allowed to proceed as described previously and was then measured by fluorescence over time at room temperature. The signal in the plastic microplate continued to increase by almost 30% until about 8 h. The reaction eventually leveled off between 24 and 72 h, where the signal increased by approximately 70%. We postulate that the reaction continued slowly due primarily to plastic leachates ( Fig. 9 ). In contrast, the glass microvial format changed only negligibly by less than 2% out to at least 5 h ( Fig. 10 ).
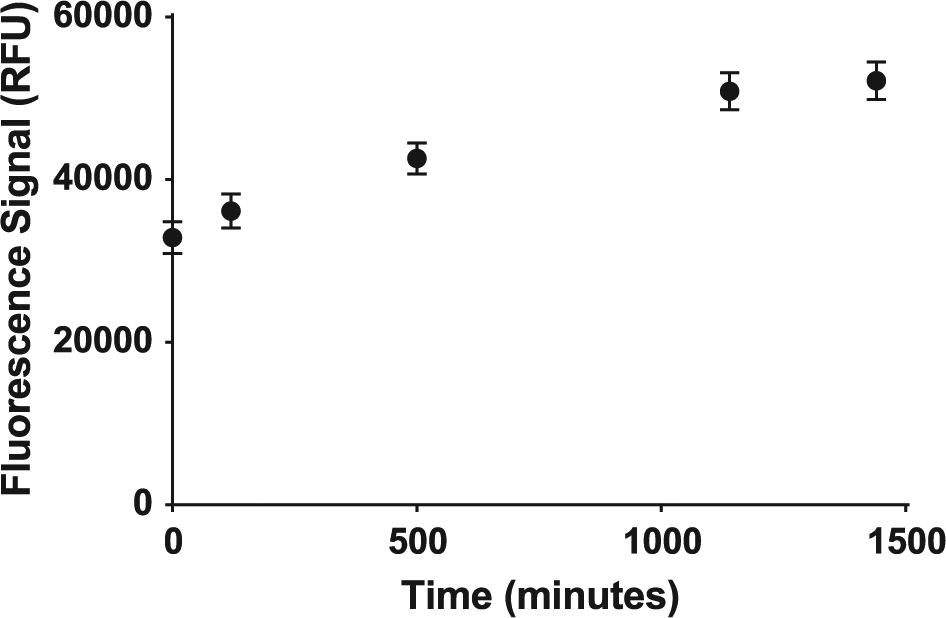
Reaction signal stability for polystyrene microplate, where the reaction was conducted at 75 °C for 30 min. Each point reflects the mean (n = 3) ±1 standard deviation. RFU, relative fluorescence units.
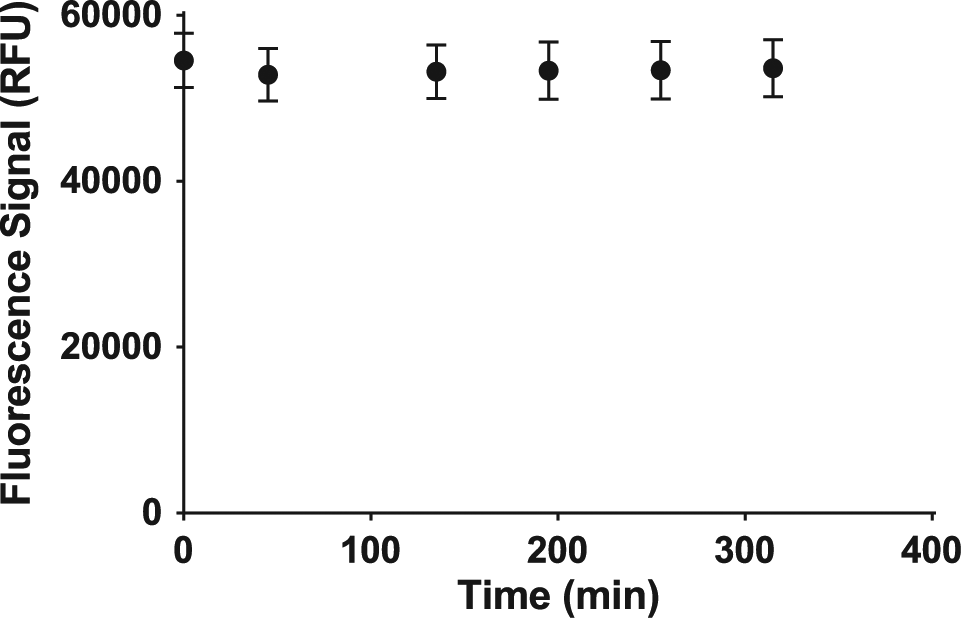
Reaction signal stability for the glass microvial, where the reaction was conducted at 100 °C for 15 min. Each point reflects the mean (n = 3) ±1 standard deviation. RFU, relative fluorescence units.
Assay Validation: Linearity, Accuracy, and Precision
For the assay validation, only the glass microvial format was investigated. The range of formaldehyde concentrations studied for the assay linearity included 2.0 to 0.0078 µg/mL. The calibration curve shown in Figure 11 represents the mean of three replicates. The results indicate excellent linearity (r2 = 0.9997) over the entire range. In addition, the average slope across the set of curves is 25,629 ± 91 relative fluorescence units (RFU)/µg mL−1, representing a 0.3% relative standard deviation (RSD). As part of an intermediate precision study, linearity was examined across multiple experiments spread across several days. In this case, the data are summarized in Figure 12 , where the average slope across the entire study (n = 8) was 23,094 ± 378 RFU/µg mL−1, representing a 1.6% RSD.
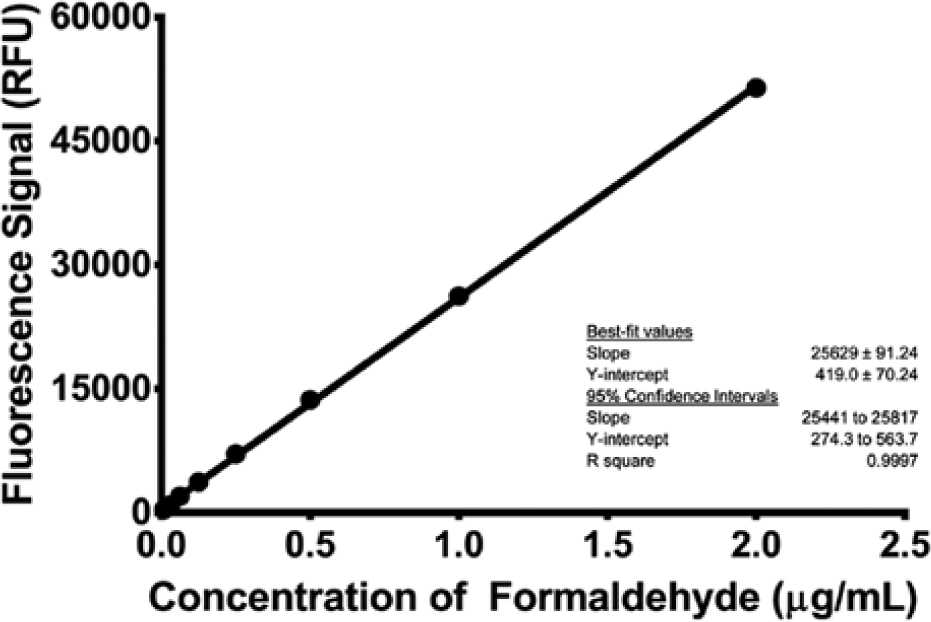
Calibration curve for formaldehyde detected in a glass microvial. Each point represents the mean (n = 3) ±1 standard deviation. The line represents the best fit using linear least squares regression. RFU, relative fluorescence units.
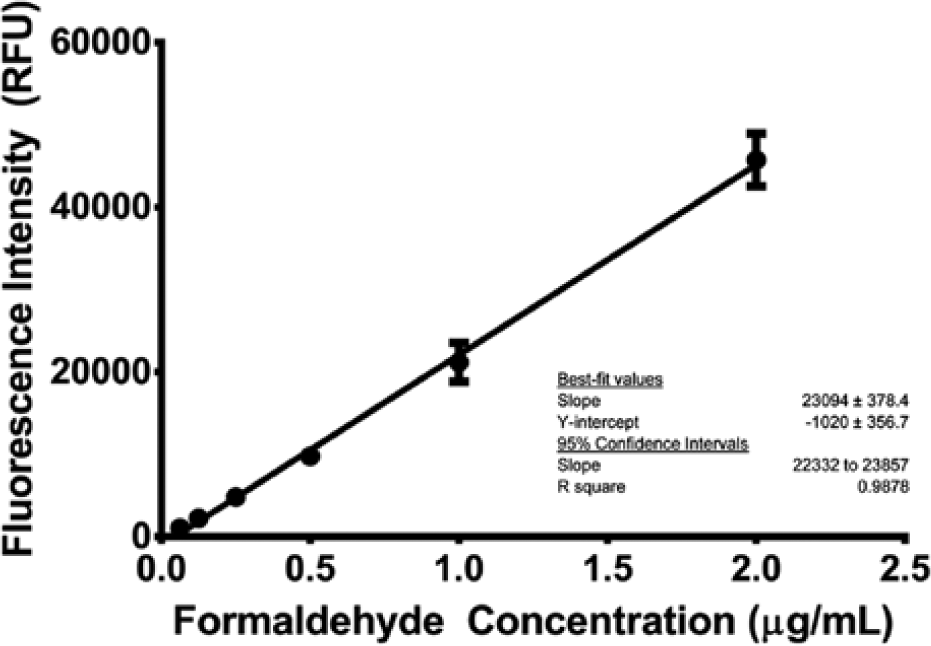
Calibration curve for formaldehyde detected in a glass microvial. Each point represents the mean (n = 8) ±1 standard deviation for data collected over several days. The line represents the best fit using linear least squares regression. RFU, relative fluorescence units.
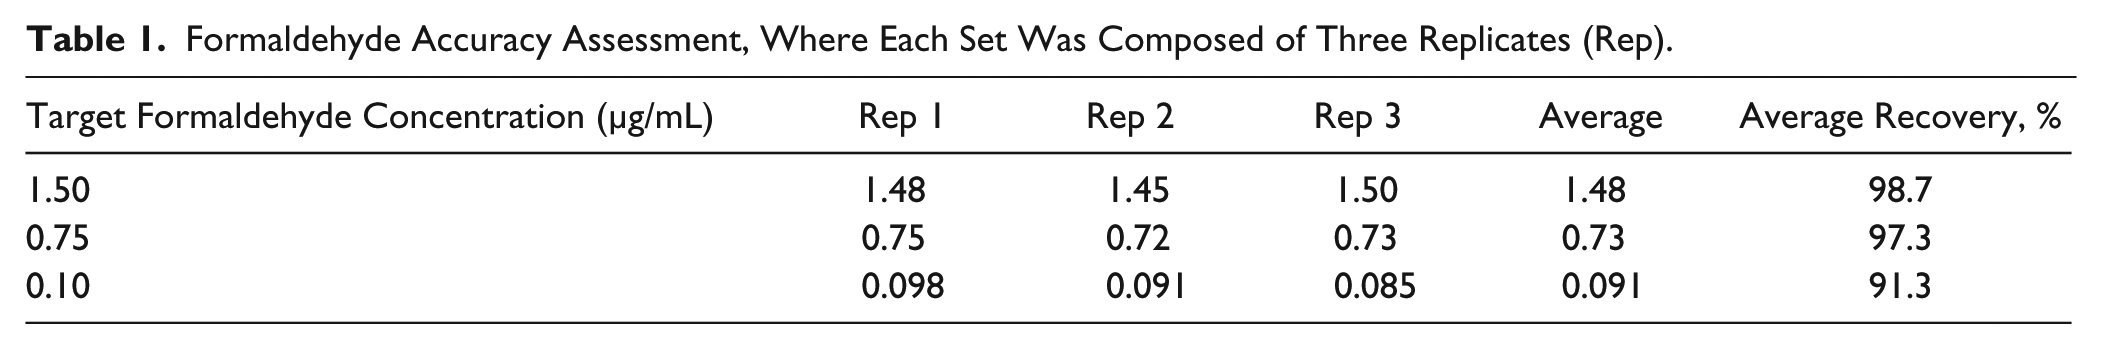
Accuracy was also studied where three concentrations of formaldehyde (1.5, 0.75, and 0.1 µg/mL) in triplicate were prepared. As Table 1 shows, average accuracy values for 1.5, 0.75, and 0.10 µg/mL formaldehyde were determined to be 98.8%, 97.6%, and 91.2%, respectively.
Formaldehyde Accuracy Assessment, Where Each Set Was Composed of Three Replicates (Rep).
Precision was conducted by preparing six independent formaldehyde solutions at three different concentrations (2, 0.25, and 0.062 µg/mL), where the lowest value represents the limit of quantitation. This experiment was conducted four times for a total of 24 replicates for each concentration. Table 2 presents the summarized precision data, where precision is expressed as %RSD.
Formaldehyde Precision Assessment, Where Each Set Was Composed of Six Replicates and the Average Was a Composite of All Sets (n = 24).
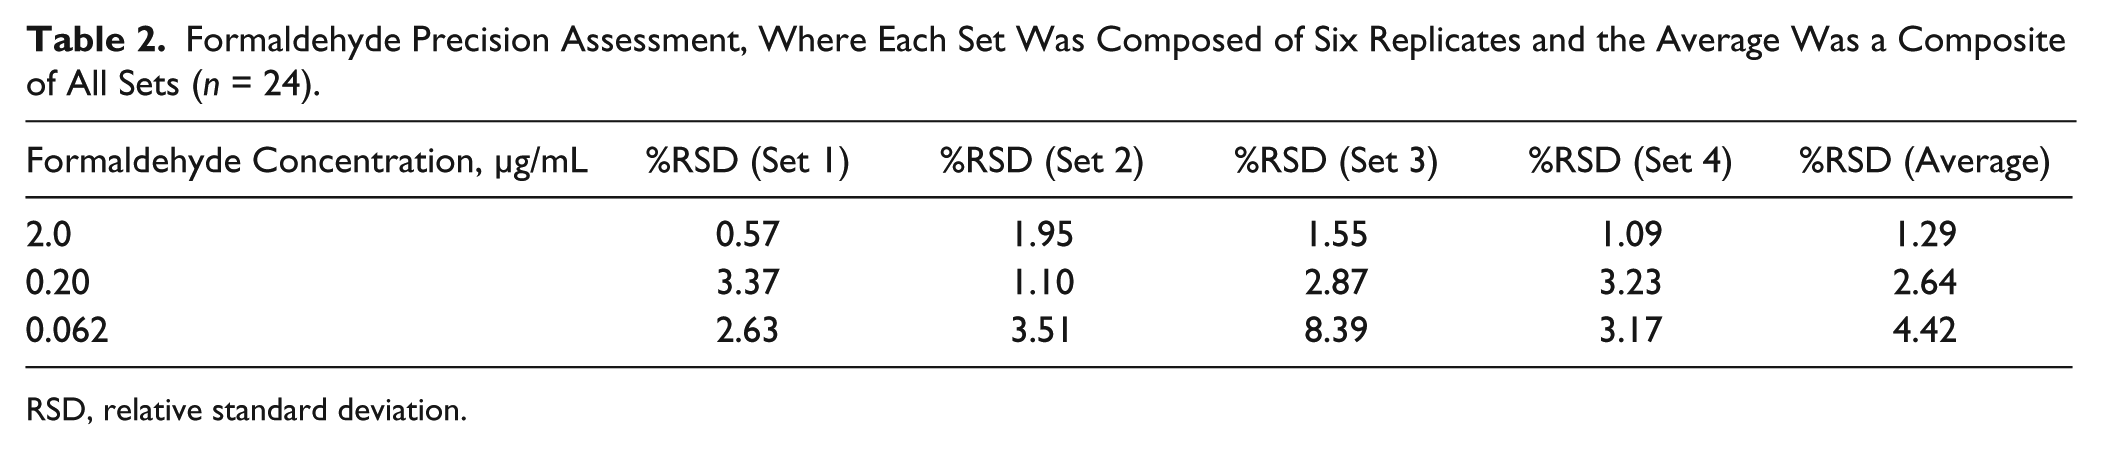
RSD, relative standard deviation.
An additional level of precision was evaluated, whereby an entire plate was executed by automated liquid handling. Specifically, the entire plate was compared to center wells and edge wells to identify any plate biases due to heating/cooling. In this case, a whole plate for each 2.0, 0.20, and 0.020 µg/mL of formaldehyde was prepared. As Table 3 shows, there are insignificant differences between the center of the plate and the edge wells and center wells, where the 95% confidence intervals (CIs) overlap entirely for each concentration of formaldehyde studies. Furthermore, by plotting the whole-plate data in a scatterplot form ( Fig. 13 ), trends from row-to-row or column-to-column bias can be detected. In this case, no obvious trends are present.
Whole-Plate Variability Assessment, Comparing All Wells of a 96-Well Plate with Wells Located in the Center and Edge.
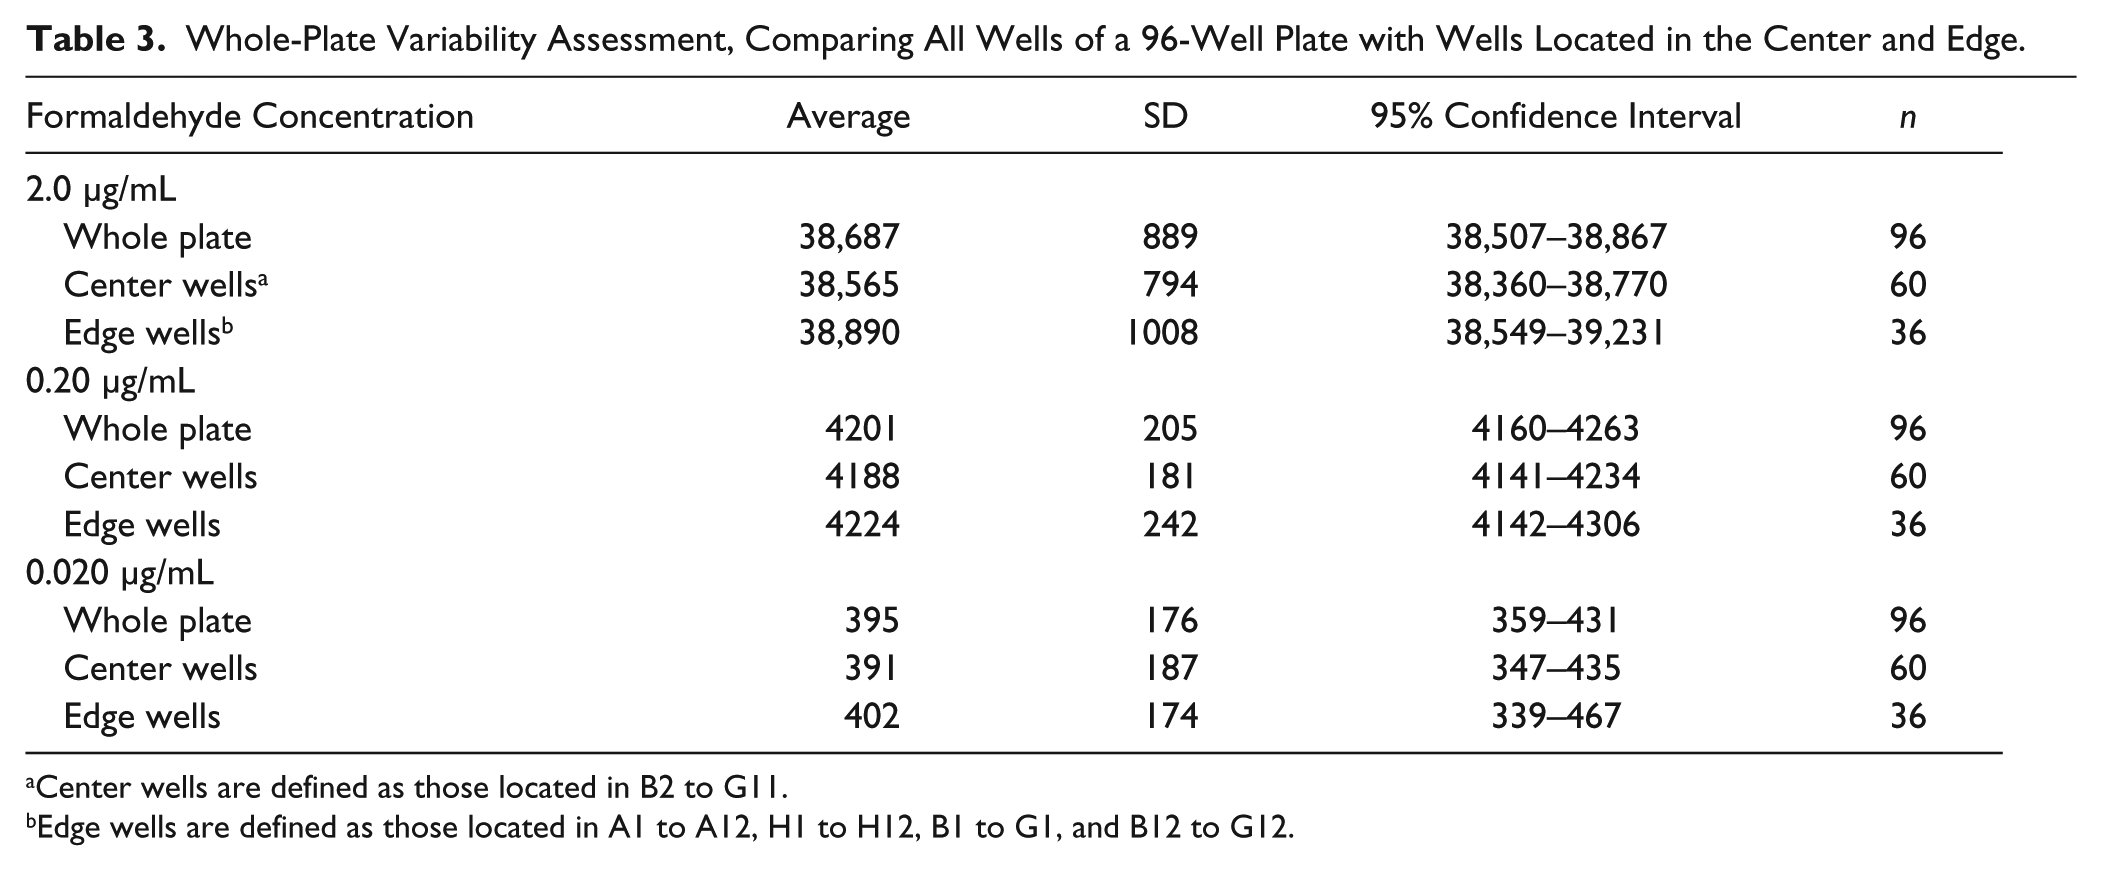
Center wells are defined as those located in B2 to G11.
Edge wells are defined as those located in A1 to A12, H1 to H12, B1 to G1, and B12 to G12.
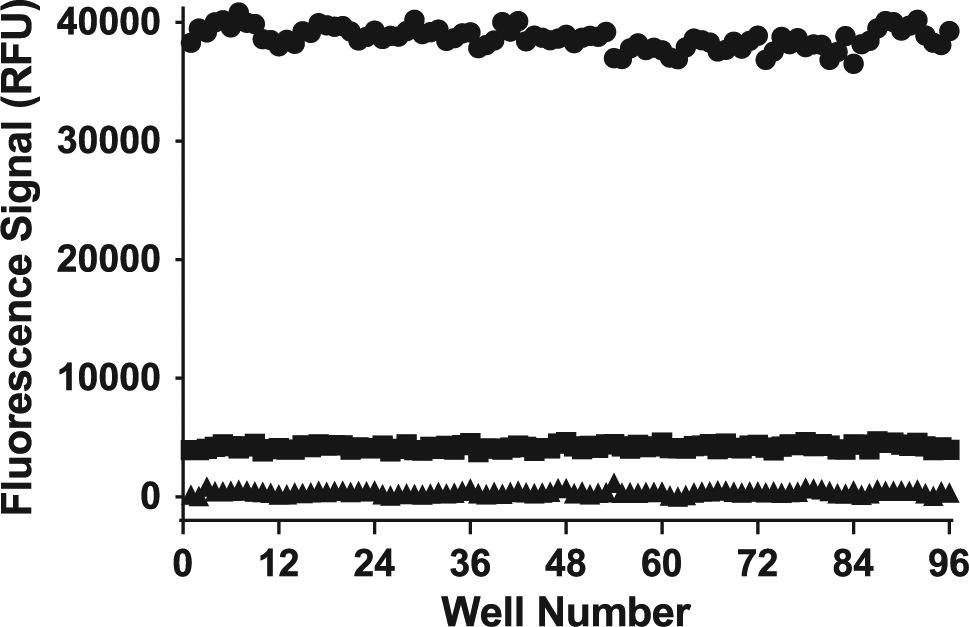
Whole-plate variability. Formaldehyde concentrations were 2.0 µg/mL (●), 0.20 µg/mL (■), and 0.020 µg/mL (▲). RFU, relative fluorescence units.
For the final level of assay validation, formaldehyde was measured in the presence of a variety of potential interferences, including ovalbumin, bovine serum albumin, and virus antigen, all of which were tested at concentrations near values reported in currently marketed influenza vaccines, which are approximately 0.05 mg/mL per dose. 8 It should be noted that the residual host cell proteins are typically much less than 0.05 mg/mL in marketed formulation, so these concentrations serve as a worst-case scenario. For example, ovalbumin is typically less than 1 µg per 0.5-mL dose. 14
As demonstrated by the data in Table 4 , neither ovalbumin nor bovine serum albumin appreciably affected the signal as compared with 2.0 µg/mL formaldehyde diluted in phosphate buffer alone. In each case, protein concentrations as high as 0.05 mg/mL affect the assay signal by less than −1%. Finally, virus antigen itself was tested for interference against formaldehyde detection. In this case, formaldehyde standards were prepared in solutions containing phosphate buffer only and virus antigen at 0.05 mg/mL. The standard curves are presented in Figure 14 and appear to slightly decrease the signal. The slope (or sensitivity) decreases from about 21,000 RFU/µg mL−1 in phosphate buffer to about 17,000 RFU/µg mL−1 in solution containing 0.05 mg/mL virus antigen (Center for Biologics Evaluation and Research [CBER] reference standard). However, when we compare in-process samples of our own PR8 viral antigen, the signal remains almost unchanged ( Fig. 15 ). These data indicate that viral antigen preparations may affect the assay sensitivity due to a previously unaccounted-for matrix component. Even so, the limit of detection (LOD) and limit of quantitation (LOQ) are well below the lowest concentration of residual formaldehyde (0.6 µg/mL) in current marketed vaccine formulations. 8 Referring to Table 5 , the Brisbane antigen CBER reference standard yielded an LOQ almost three times below the lowest level of formaldehyde in marketed vaccines, while the PR8 virus produced in house resulted in an LOQ of almost 10 times below the 0.6 µg/mL level.
Interference Study Examining the Effect of Potential Matrix Components on Formaldehyde Assay Signal.
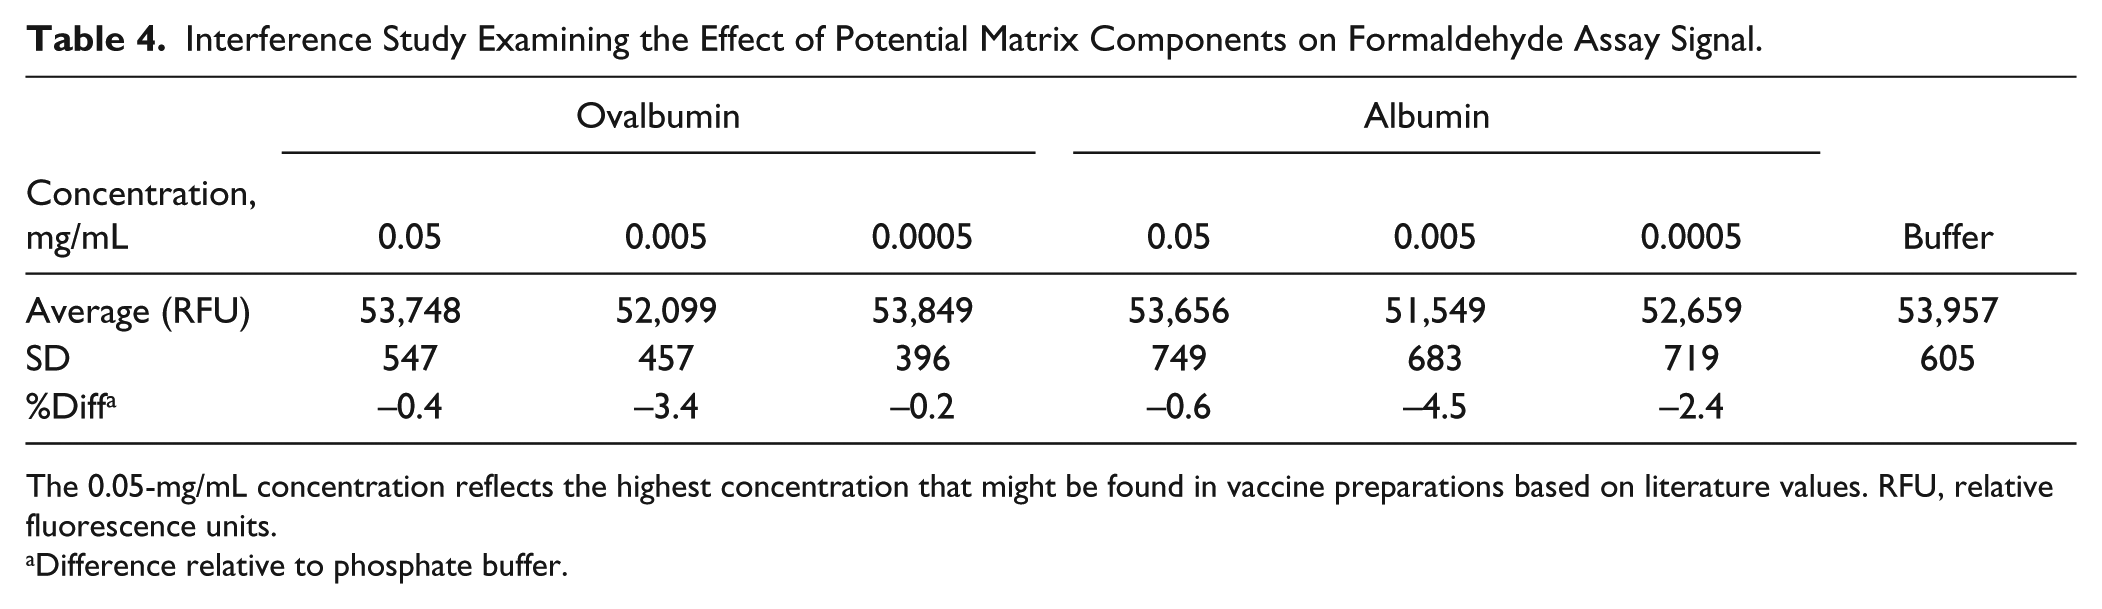
The 0.05-mg/mL concentration reflects the highest concentration that might be found in vaccine preparations based on literature values. RFU, relative fluorescence units.
Difference relative to phosphate buffer.
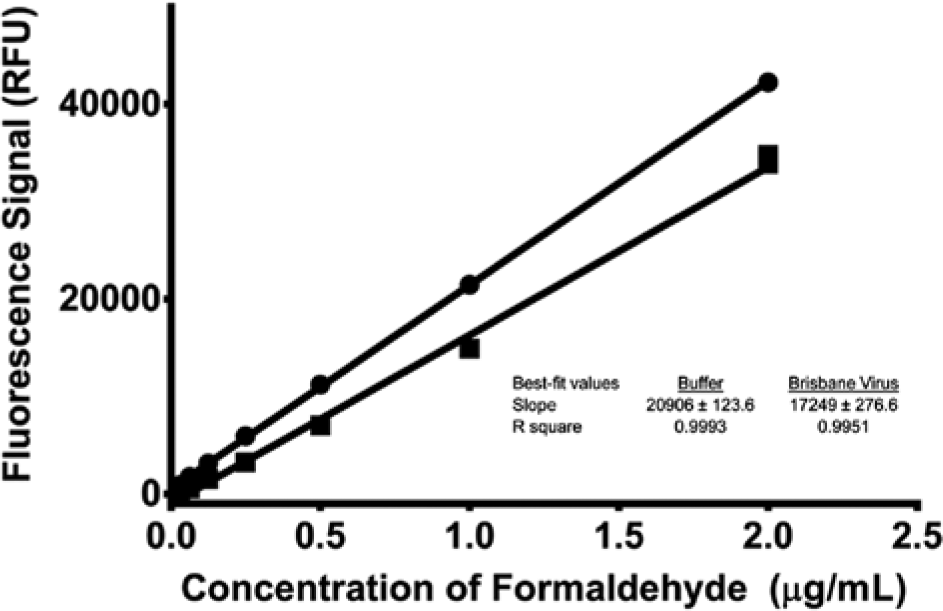
Calibration curve for formaldehyde detected in a glass microvial. Matrix conditions were phosphate buffer (●) and 0.05 mg/mL Brisbane (Center for Biologics Evaluation and Research reference standard) virus (■). Each point represents the mean (n = 3) ±1 standard deviation. The lines represent the best fit using linear least squares regression for each matrix. RFU, relative fluorescence units.
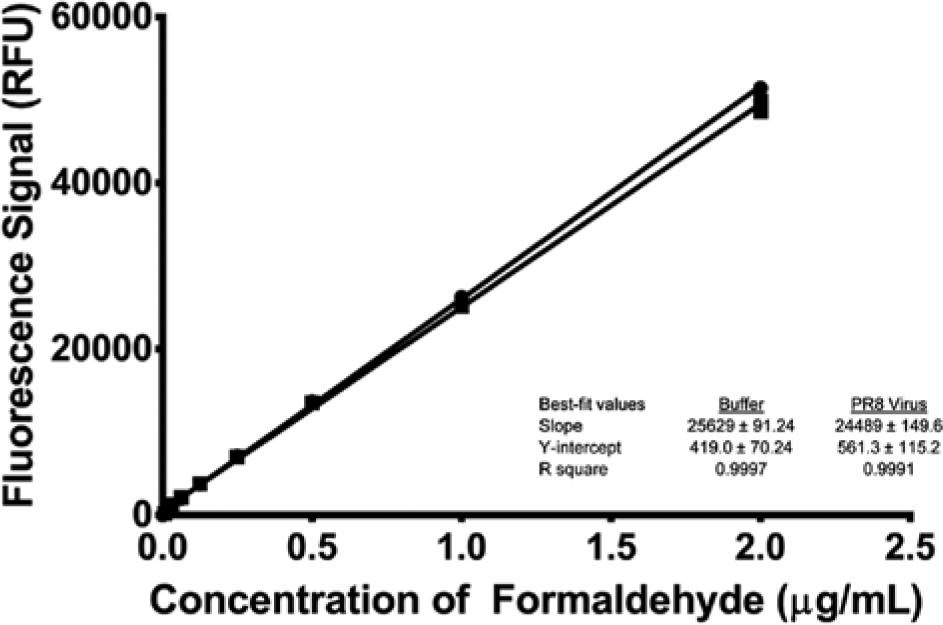
Calibration curve for formaldehyde detected in a glass microvial. Matrix conditions were phosphate buffer (●) and 0.05 mg/mL PR8 virus (■). Each point represents the mean (n = 3) ±1 standard deviation. The lines represent the best fit using linear least squares regression for each matrix. RFU, relative fluorescence units.
Comparison of Formaldehyde LOD and LOQ Values in Different Virus Antigen Samples.
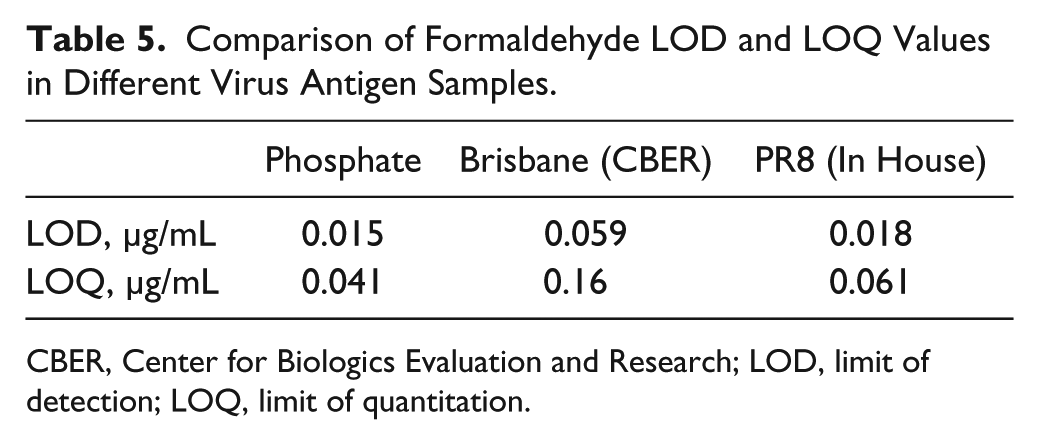
CBER, Center for Biologics Evaluation and Research; LOD, limit of detection; LOQ, limit of quantitation.
The original intent of this research was to develop an inexpensive, high-throughput assay capable of detecting residual formaldehyde in vaccine formulations. The conventional format included large-volume (3 mL total volume) sample preparation in test tubes, followed by transfer to HPLC vials for liquid chromatographic analysis. While this format realized very low detection limits, it is not easy to automate. In contrast, the plate-based format described in this article is very easy to automate from sample preparation through detection due to its 96-well format. Also, sample preparation was carried out in only a 200-µL total assay volume (100 µL of sample and 100 µL of hydralazine derivatization reagent). Furthermore, this research demonstrates the feasibility of successfully performing high-temperature assays in a high-throughput format. Since this assay was automated, the level of precision attained in this plate-based format rivaled that of conventional high-throughput in vitro biochemical assays (eg, <5% RSD).
Cost and ease of use were also important considerations. By using off-the-shelf, commercially available reagents, the cost per data point was kept to <$0.01. Also, the use of a plate reader format obviates the need for an expert user such as for HPLC-based assays. An additional cost consideration is the detection system itself, both in terms of capital costs, consumables, and maintenance. The plate reader format is a less expensive (as much as 10 times lower) assay format compared with HPLC. This can be especially attractive for developing countries that are striving to manufacture vaccines that meet the high-quality standards expected by the U.S. Food and Drug Administration or other national medicines regulatory authorities governed by the WHO.
Many conventional assays employed by the vaccine manufacturing industry are very low throughput. For example, sodium dodecyl sulfate polyacrylamide gel electrophoresis, which would be used to assess identity and/or purity, requires several hours to complete. To measure vaccine titer for in-process samples, the hemagglutination assay (HA) is commonly used. In this case, HA requires a 30- to 40-min incubation period, followed by visual detection of the HA point. The other common potency assay, used for vaccine release tests, is single-radial immunodiffusion, where samples require a 24- to 48-h incubation period followed by 4 h of processing.
The HPLC-based format previously described attained a throughput of one sample per 15 min, while that for the plate-based format described in this article was 96 samples per minute and represents a 1400 times increase in throughput. The improvement is important because it allows not only more samples to be tested but also a very fast turnaround time if used as part of influenza vaccine manufacturing quality control. This can be especially important for countries that are engaged in influenza vaccine manufacturing as part of the global influenza preparedness sponsored in part by WHO. In addition to vaccine manufacturing, formaldehyde is ubiquitous in our environment (automobile exhaust and industrial by-products) and is a major component of indoor air pollution (cigarettes, foam insulation, and wooden furniture). Therefore, the ability to detect and quantify formaldehyde could be useful beyond vaccine production.
Footnotes
Acknowledgements
The authors thank the U.S. Food and Drug Administration’s Center for Biologics Evaluation and Research (CBER) and the U.S. Department of Health and Human Services’ Biomedical Advanced Research and Development Authority (BARDA) for kindly providing the virus antigen reference standard. The authors also thank Ms. Sanaa Elouafiq (former student now at Biogen Idec) for initial help with proof-of-principle studies.
Declaration of Conflicting Interests
The authors declared no potential conflicts of interest with respect to the research, authorship, and/or publication of this article.
Funding
The authors received no financial support for the research, authorship, and/or publication of this article.