
Abstract
In the present study, a series of reflectance spectra of postmortem lividity, pallor, and putrefaction-affected skin for 195 investigated cases in the course of cooling down the corpse has been collected. The reflectance spectrometric measurements were stored together with their respective metadata in a MySQL database. The latter has been managed via a scientific information repository. We propose similarity measures and a criterion of similarity that capture similar spectra recorded at corpse skin. We systematically clustered reflectance spectra from the database as well as their metadata, such as case number, age, sex, skin temperature, duration of cooling, and postmortem time, with respect to the given criterion of similarity. Altogether, more than 500 reflectance spectra have been pairwisely compared. The measures that have been used to compare a pair of reflectance curve samples include the Euclidean distance between curves and the Euclidean distance between derivatives of the functions represented by the reflectance curves at the same wavelengths in the spectral range of visible light between 380 and 750 nm. For each case, using the recorded reflectance curves and the similarity criterion, the postmortem time interval during which a characteristic change in the shape of reflectance spectrum takes place is estimated. The latter is carried out via a software package composed of Java, Python, and MatLab scripts that query the MySQL database. We show that in legal medicine, matching and clustering of reflectance curves obtained by means of reflectance spectrometry with respect to a given criterion of similarity can be used to estimate the postmortem interval.
Introduction
The problem of curve matching and clustering (or classification) represents an important problem appearing in many fields, such as structural biology,1–4 medical imaging,5,6 pattern recognition,7–9 machine learning,10,11 computer vision, 11 information retrieval, 12 research on automated text categorization of foreign language texts, 13 and ontology science. 14 Clustering is the process of grouping a set of objects into classes of similar objects and assigning dissimilar objects to different clusters. The definition of a criterion for object similarity varies from one clustering problem to another, but in most cases, the concept of comparing objects is based on the distance between the objects, for example, on the Euclidean distance or the Fréchet distance.15–17
In the framework of an interdisciplinary project, our study of clustering reflectance spectra was initially motivated by the ambition to estimate the postmortem interval. During reflectance spectrometry, the material is irradiated with a white light source of a known intensity spectrum, and the intensity of the reflected light is measured for each wavelength on the interval (380, 750 nm). The acquisition and management of reflectance spectra are performed by Scientific Information Repository (SIR),18,19 which acts as a research platform for the analysis of reflectance spectra.
The spectral reflectance reveals a lot of subtle information about the microstructure of the material, such as the concentration of light-absorbing substances (e.g., Hb, Hb – O2, melanin) or the size distribution of light-scattering structures (e.g., mitochondria, collagen fibers). In the postmortem progression, the concentration of light scatterers and light absorbers and, accordingly, the shape of the reflectance spectrum undergo a change due to postmortem tissue breakdown. The light-scattering components are represented as peaks and light-absorbing substances appear as dips in the reflectance spectrum. Therefore, we analyze the evolution of the reflectance spectra for each case and determine the postmortem time interval during which a characteristic change in the shape of the reflectance spectrum takes place. For this purpose, we propose the application of pairwise matching of reflectance curves and their clustering with respect to a given criterion of similarity. The measures that we use to compare two reflectance curve samples include the Euclidean distance between two curves and the Euclidean distance between derivatives of the functions represented by the reflectance curves at the same wavelengths in the spectral range of visible light between 380 and 750 nm. In addition, we calculate a covariance matrix and its largest eigenvalue. We systematically cluster the reflectance spectra from the database as well as their metadata with respect to the given criterion of similarity. Furthermore, for each reflectance curve pattern, a nearest curve is identified from the database. Altogether, more than 500 reflectance spectra have been pairwisely compared.
Materials and Methods
Study Population
By means of reflectance spectrometry, postmortem putrefaction-affected corpse skin was investigated over 5 years in 195 Caucasians brought to the Institute of Legal Medicine of the Freiburg University shortly after death. The ambient temperature of the storage room was 4 °C to 6 °C. The study included 122 males aged 15 to 93 years (mean [SD], 56.6 [20.6]; median, 61) and 73 females aged 9 to 97 years (mean [SD], 67.0 [20.8]; median, 73).
Reflectance Spectrometry
Reflectance spectrometry20,21 is a noninvasive technique for differential diagnosis as well as for fundamental research in different domains of biomedical science. It is the most important method for analyzing skin in vivo, 22 determining optical properties of turbid media, 23 detecting the influence of probe pressure on human skin, 24 and determining the age of traumatic injuries 25 and bruises, 26 as well as the early diagnosis of some diseases. 27 In legal and forensic medicine, it helps to estimate the cooling process and to confirm that the discoloration of livor mortis due to cooling is caused by reoxygenation of hemoglobin28–30 or to model the dynamics of the hemoglobin reoxygenation process in postmortem human skin. 31
Measurements were performed with the diode array spectrophotometer MCS 400 (Carl-Zeiss-Jena GmbH, Jena, Germany) and a halogen bulb as a light source (standard illuminant D65). The spectral resolution was 0.8 nm within the wavelength range of 188 to 1018 nm. The measuring head allowed the recording of the direct surface reflection of a 5-mm-wide measurement spot. Compressed barium sulfate was used as white standard according to ISO 7724–2. Furthermore, the measurements were controlled and evaluated via the control software ASPECT+ (Carl-Zeiss-Jena GmbH, Jena, Germany) running on a personal computer. Reflectance values were saved in the range of 350 to 750 nm. Altogether, 532 reflectance spectrometry measurements were carried out on putrefaction-affected corpse skin located on the right lower abdomen. The skin temperature was determined using a thermometer pressed against the uncovered skin of the right thigh. Measurements were collected at intervals ranging from 6 to 24 h, at a constant ambient temperature of 4 to 6 °C. Further parameters recorded were case number, age, sex, body mass index, skin temperature, duration of cooling, postmortem time, death time, cause of death, location of death, and so on. All data were anonymized by case numbers. The reflectance spectrometric measurements were stored in a database (MySQL) as ASCII data files consisting of two columns: the light wavelength in nanometers and the reflectance value given in percentages. The respective metadata, including skin temperature, were saved in the MySQL database as well. The latter has been managed via a scientific information repository as described elsewhere.18,19
Transformation of Reflectance Spectra
The reflectance spectrometric measurement for each case is characterized by a reflectance spectrum
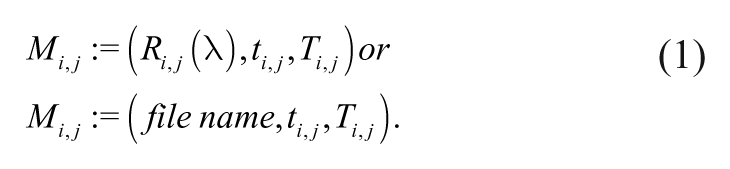
Figure 1 and Figure 2 visualize the original reflectance curves and the transformed curves recorded at 47.5 h and 50.12 h postmortem and at skin temperatures 8.9 °C and 10.1 °C, respectively, belonging to two exemplary cases.
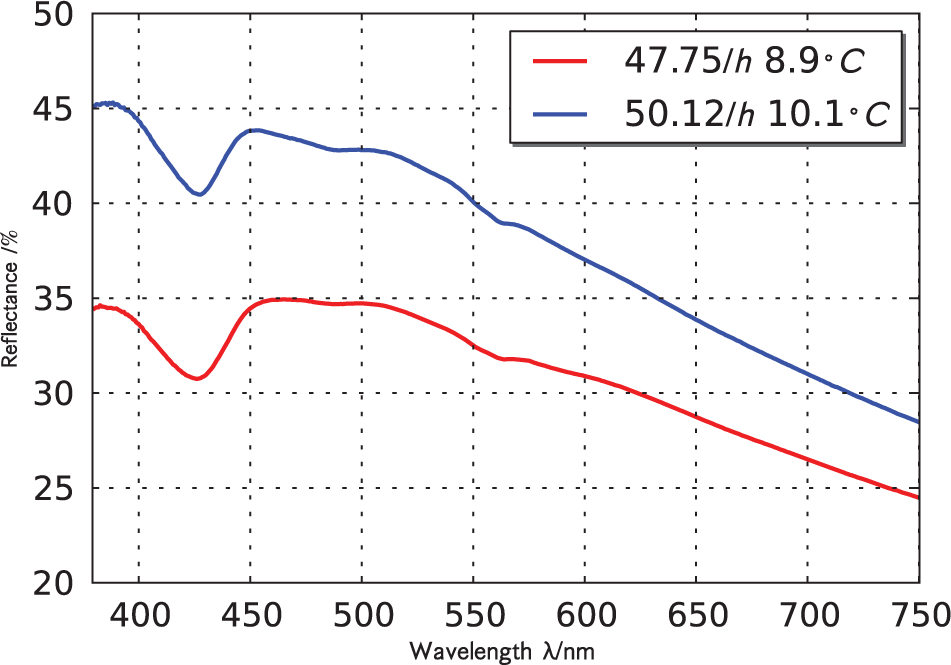
The graph visualizes the original reflectance curves for two cases recorded at 57.5 h (red curve) and 50.12 h (blue curve) postmortem and at skin temperatures of 8.9 °C and 10.1 °C, respectively.
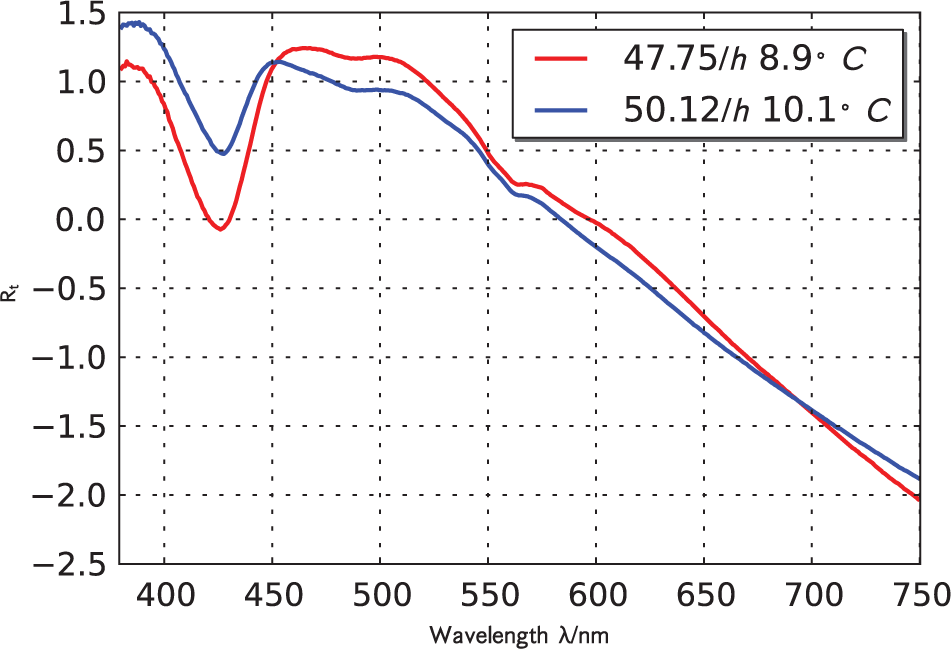
The graph visualizes the transformed reflectance curves
Measures of Similarity
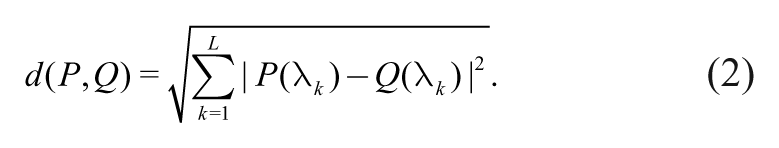
Since reflectance spectra represent the optical and physical properties of the tissue, we investigate the chronological evolution of the reflectance spectra for each case and observe the postmortem time interval during which chronological changes of the shape of reflectance spectra occur, such as appearing and disappearing new maxima and minima in the whole visible light wavelength range of 380 to 750 nm. In other words, we aim to detect the specific time point (critical postmortem time) during which a reflectance curve sample appears that does not match the group of previous curves that form a cluster. With this consideration in mind, for every pair of reflectance curves from the database, we compute the Euclidean distance between pairs of curves and their derivatives as the similarity measure for clustering. The Euclidean distance between a pair of curves
Let
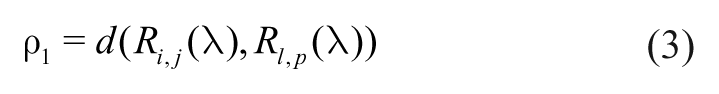
represent the Euclidean distance (2) between a pair of spectra defining a quantitative degree of how far apart two curves,
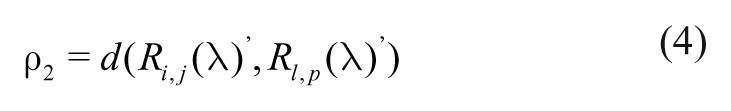
represent the Euclidean distance between the derivatives of the functions represented by the reflectance curves, revealing intervals of the functions with increasing and decreasing values in the wavelength range of 380 to 750 nm. In addition, we consider the covariance matrix of a pair of curves similar to principal component analysis (PCA). 32 In other studies,9,33 the authors use a covariance matrix for detecting different volumes of clusters. In a covariance matrix, the variances are represented on the diagonal while the covariances reside above and below the diagonal. The covariance indicates how two variables vary in dependence on each other. Furthermore, we calculate for each covariance matrix the largest eigenvalue λmax whose eigenvector is associated with the direction along which the data have the maximum variance.
Definition of Similarity for a Pair of Curves
Definition
A pair of curves
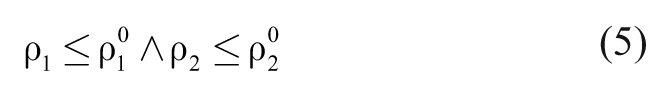
is fulfilled, where the thresholds
In this case, we say that the respective measurements are similar as well:
The measures of similarity for the pair of reflectance curves displayed in Figure 2 take the values ρ1=4.83, ρ2=0.2, λmax=1.98.
Classification of Reflectance Spectra with Respect to a Criterion of Similarity
Now, we monitor the reflectance spectra from the database and compare the curves pairwisely by the calculation measures (3) and (4). The calculated values of ρ1, ρ2, and λmax for each pair of curves are stored in the database via the Electronic Laboratory Notebook.18,19 Altogether, N(N-1)/2 comparisons were performed (N = 532). Having calculated these measures of curve similarity, the following question arises: can we capture one similar group (cluster) of reflectance spectra for a given pattern curve (represented by a single reflectance spectrum from the database) with respect to the given criterion of similarity as in (5)? To obtain this information, we iteratively look over all pairs of curves from the database (one of them being the pattern curve) and cluster all those reflectance spectra that satisfy the criterion of similarity (5) with respect to the given thresholds
These reflectance curves, as well as the associated measurements that belong to the same cluster, are called members of the cluster. In (7), we call the reflectance spectrum of a measurement
We note that the members of the cluster are similar among themselves with respect to the criterion (5). We call a spectrum not belonging to a cluster an outlier. If one of the members of a cluster is dissimilar to some reflectance curve, then the remaining members are dissimilar to this curve as well.
Examples of similarity classes
Figure 3
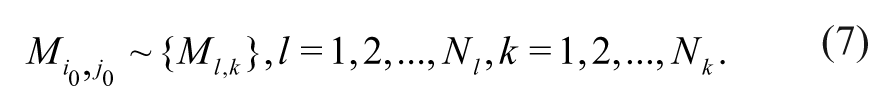
displays a similarity class of curves for a given reflectance curve (pattern curve) that is defined by the measurement {05239005,80.35h, 6.2°C}.This cluster contains 27 members and the thresholds
The plot demonstrates a class of similarity of reflectance curves collected on putrefaction-affected skin, Nclass = 17. A given pattern curve (magenta curve) is defined by the measurement {05239005,80.35h,6.2°C}, and the thresholds for fulfillment of the similarity criterion take the values
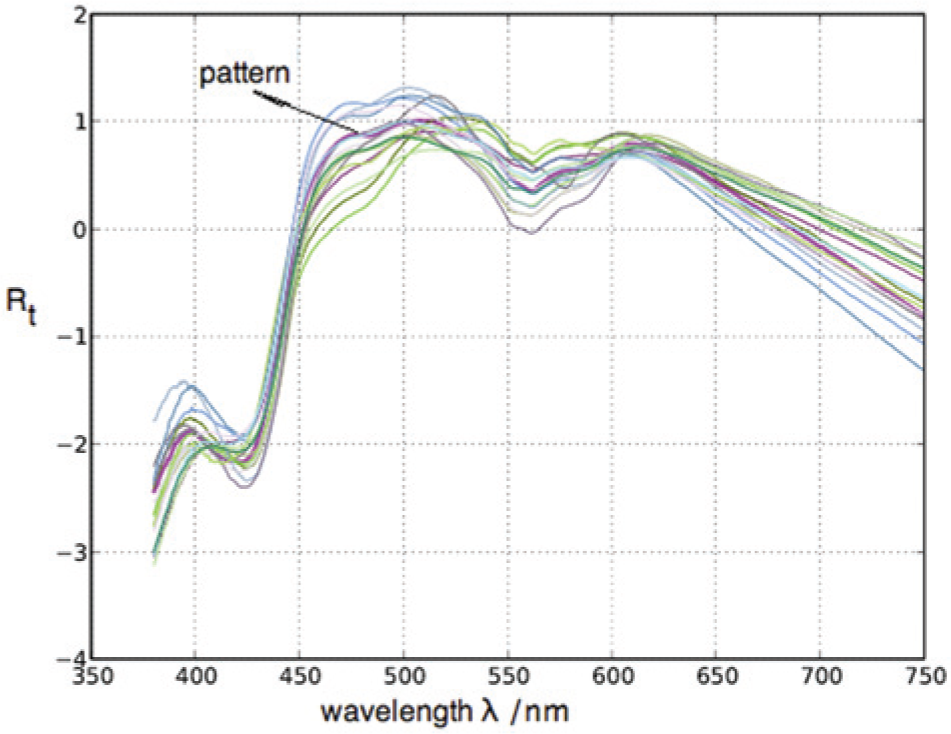
The graph plots a class of similarity of reflectance spectra measured on putrefaction-affected skin, Nclass = 27. The given pattern curve (not indicated) corresponds to the measurement {05002002,21.07h,none}. The thresholds for fulfillment of the similarity criterion take the values
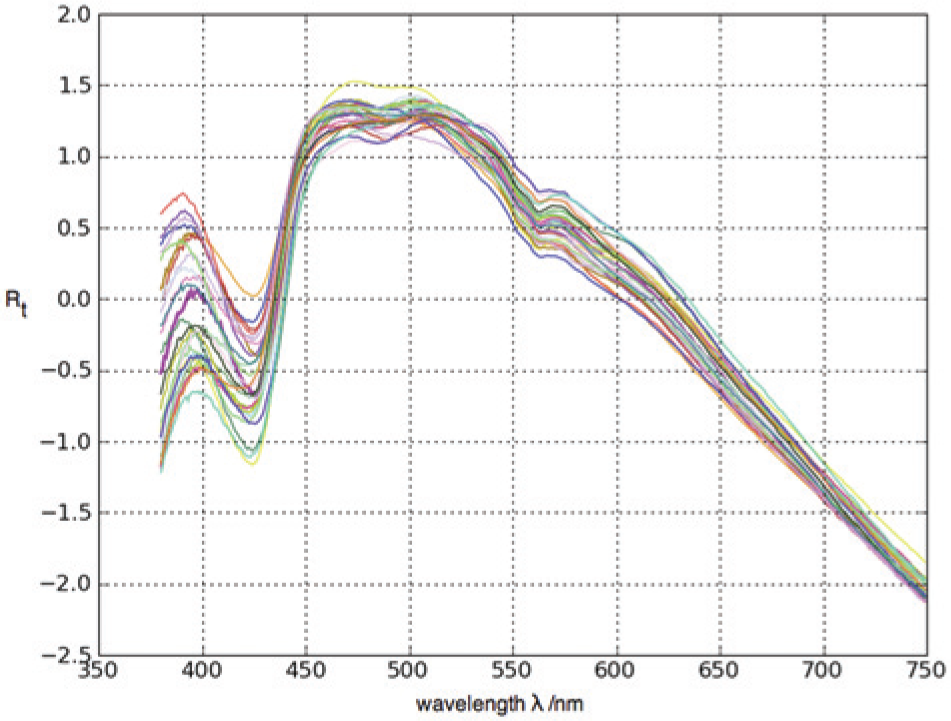
The plot visualizes a class of similarity of reflectance spectra collected on postmortem lividity, Nclass = 27. The given pattern curve (not indicated) corresponds to the measurement {04325001,226.35h,none}. The thresholds for fulfillment of the similarity criterion take the values
Examples of similar curves
In addition, for each case i0, a most similar (nearest) pair of measurements is computed as follows. The series of Ki0 reflectance spectra collected from case i0 are removed from the data set, and each reflectance curve Ri0,j, j = 1,2, …, Ki0 is pairwisely compared with the remaining N − Ki0 (N = 532) reflectance spectra. The computed values of ρ1, ρ2 as well as the largest eigenvalues of the covariance matrix are stored in the database. Thereafter, a pair of measurements
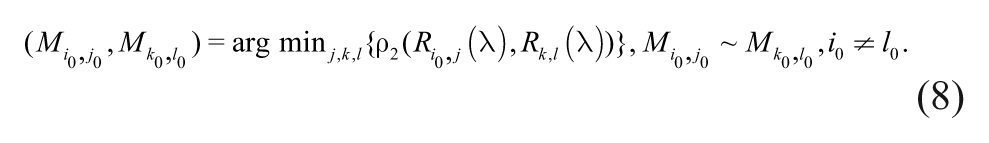
Figure 6 displays a most similar pair of reflectance curves for the pattern case 05406 and for the matched case 08553: {05406002,15.43,17.7°C}~{08553002,17.75,12.5°C}. The measures take the following values: ρ1 = 1.84, ρ2 = 0.192, and λmax = 2.0.
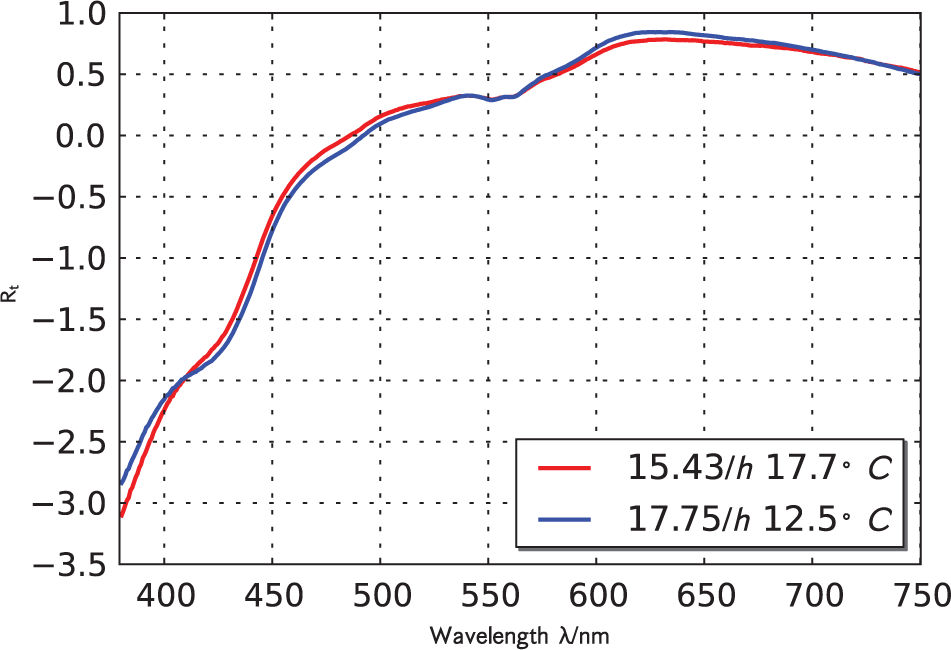
The graph plots the most similar pair of reflectance curves, belonging to different cases, collected on putrefaction-affected skin for the pattern case 05406, taken from a 40-year-old man, and for the matched case 08553, taken from a 43-year-old man. After applying (8), the most similar pair of measurements are {0546002,15.43h, 17.7°C} (red curve) and {08553002,17.75,12.5°C} (blue curve). The similarity measures take the following values: ρ1 = 1.55, ρ2 = 1.57, and λmax = 2.0 .
Results
For each case, we observe the recorded measurements on putrefaction-affected skin. As mentioned above, each ith case has Ki measurements. From 195 cases, we take into account 120 cases whose error of time of death did not exceed 3 h and have more than one measurement: Ki > 1. From these 120 cases, a total of 420 spectra were collected. Now, we analyze the evolution of the reflectance spectra for each of these cases in the visible range of light and determine the postmortem time interval during which a characteristic change in the reflectance spectrum shape takes place. For each ith case under consideration, we extract Ki reflectance spectra from the database and test according to the above-described procedure whether this group of spectra forms a cluster with respect to the given criterion of similarity (5). If all recorded reflectance spectra for the case under consideration form a cluster, then there was no qualitative change in the shape of the reflectance spectrum in the observed postmortem time interval. If by pairwise comparison of reflectance spectra, one reflectance curve (we call it an outlier) is detected that is dissimilar to other curves, then we can determine the interval of postmortem time in which the qualitative change of the spectrum occurs. The mean value between the measured postmortem time of the outlier and the postmortem time of the chronologically nearest reflectance spectrum from the cluster is taken as the specific time point. We call this specific postmortem time point the critical postmortem time and denote it with t*. A mean value of the skin temperatures associated with the respective reflectance curves is called critical temperature T*. Having performed this procedure, the reflectance spectra of 57 cases revealed the critical postmortem time t* = 68.23 ± 29.7 [h] and the critical temperature T* = 8.9 ± 2.2[°C] with the earliest transition being observed at 6.8 h and the latest transition at 191 h postmortem. Figure 7 displays the distribution of the critical postmortem time. When omitting the outlier value at 191 h, the data follow a normal distribution (Shapiro-Wilk normality test, p = 0.79). The reflectance spectra of the remaining 63 cases formed clusters without any outliers during the observed postmortem time interval. The lack of transition in the reflectance curve shape in these cases can be explained by the notion that under ambient temperatures between 4 °C and 6 °C, skin processes that are responsible for the changes in the reflectance spectra proceed more slowly than under higher temperatures for the same postmortem interval. Thus, the observation time might have been too short to detect any change in curve shape.
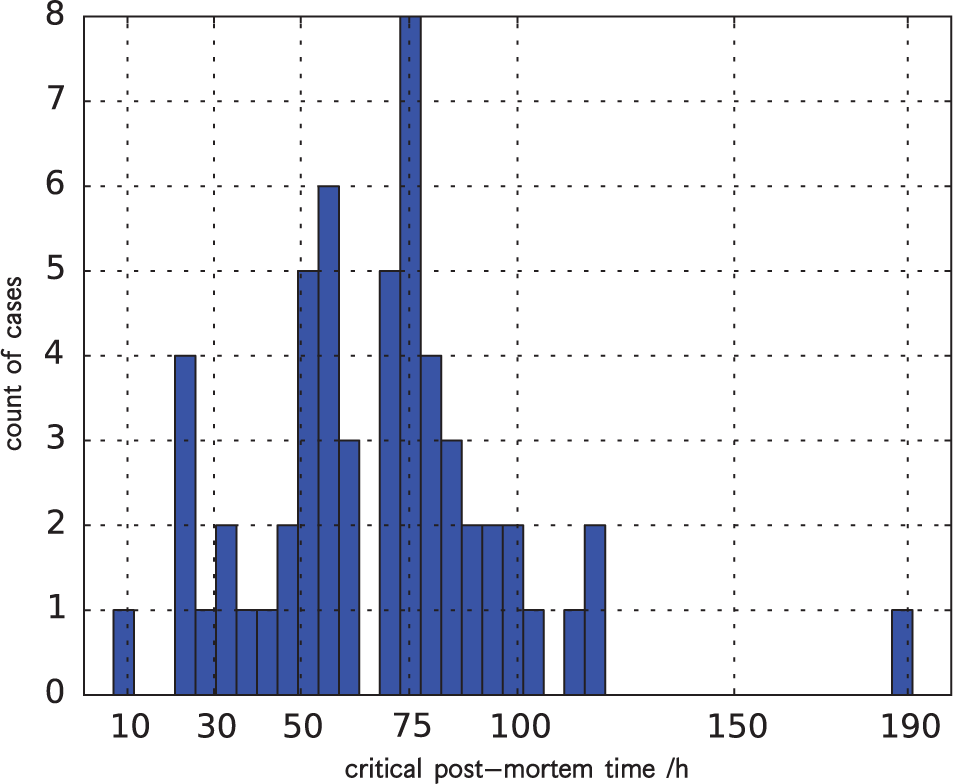
The histogram demonstrates the distribution of the critical postmortem time. Its mean value is calculated to t* = 68.2 ± 29.7 [h] and the respective critical temperature to T* = 8.9 ± 2.2[°C] at the ambient temperature of 4 °C to 6 °C.
In the next subsections, we consider two examples clarifying the procedure of curve clustering to localize the critical postmortem time.
Example 1
An example of putrefaction-affected skin taken from an 81-year-old Caucasian male (multiple trauma) is described in the following. A series of 10 reflectance spectra recorded at different skin temperatures in the course of cooling down the corpse is shown in Figure 8 . We specify the measurements of this case according to (1) as follows:
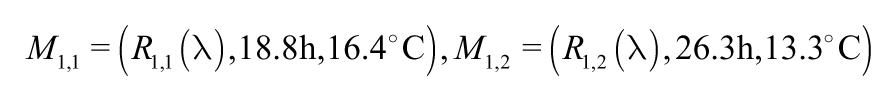
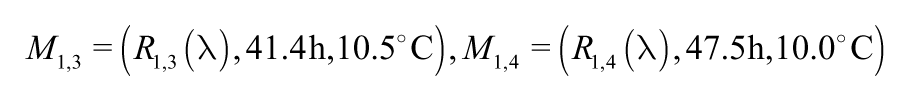
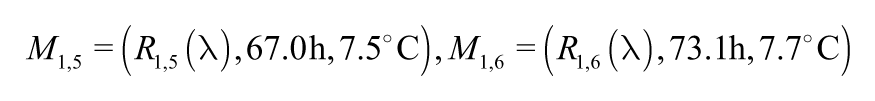
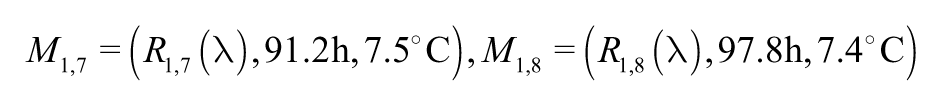
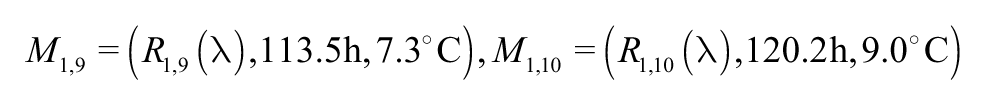
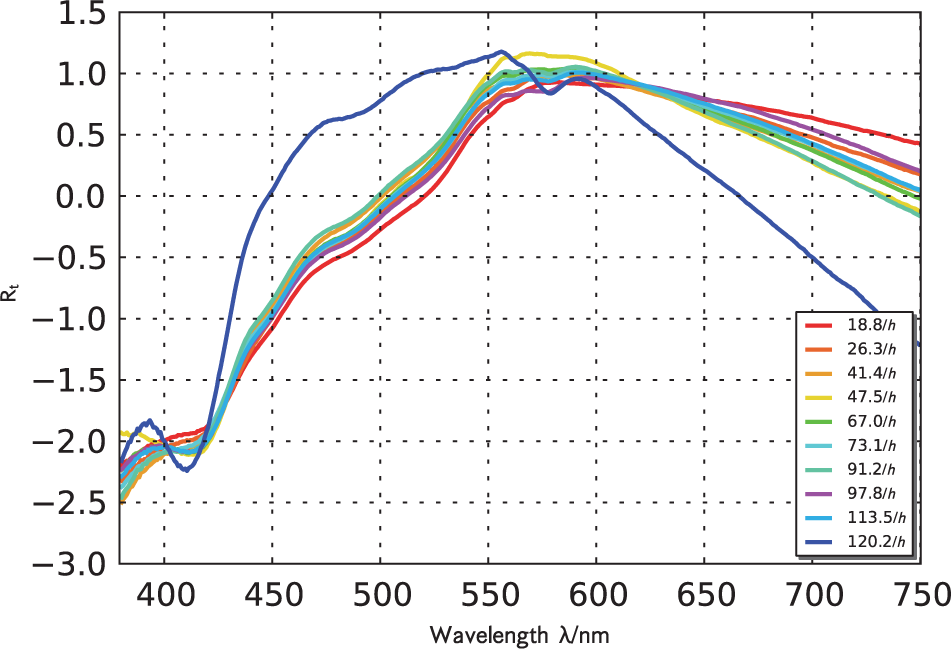
Time series of reflectance spectra for example 1 discussed in the text, taken from a 81-year-old Caucasian male (multiple trauma), documenting the time-dependent changing of spectrum shape. A series of 10 reflectance spectra measured on putrefaction-affected skin at different postmortem times in the course of cooling down the corpse is shown. The reflectance spectra recorded in the postmortem time interval of 18.8 to 113.5 h compose a cluster with thresholds
We pairwisely compared these 10 reflectance spectra computing the measures ρ1, ρ2 as well as λmax and tested the criterion of similarity (5) with the given threshold values
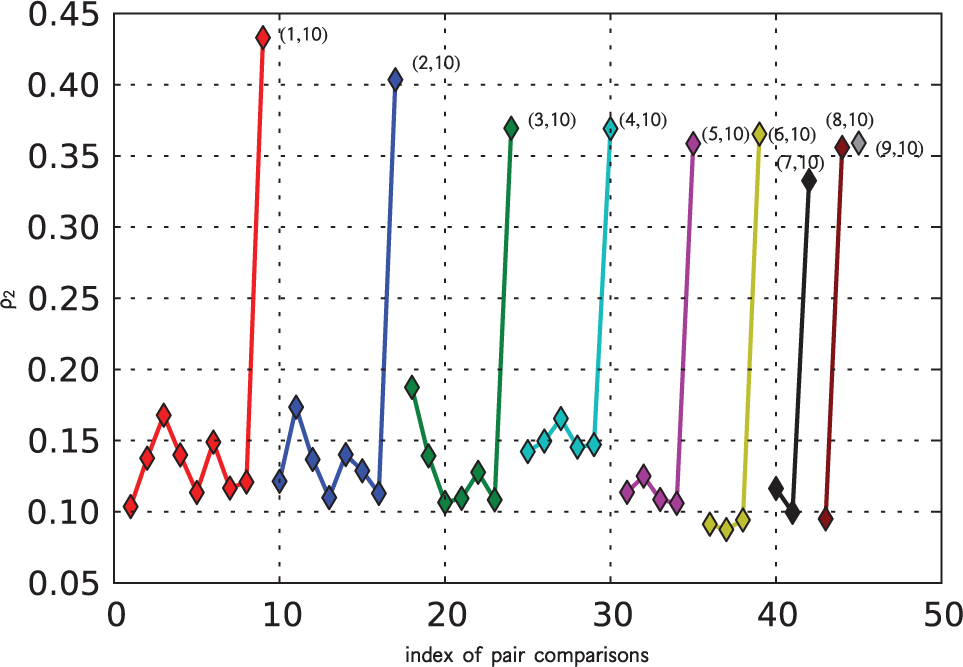
The diagram plots the measure ρ2 for pairwise comparisons of reflectance curves for the same case as shown in Figure 8 . Altogether, 45 comparisons were performed. The pairwise comparisons of the reflectance spectrum of the first measurement with the other nine spectra are marked by red symbols, the comparisons of the second spectrum with the remaining eight are marked by blue symbols, the comparisons of the third spectrum with the remaining seven are marked by green symbols, and so on. The measure ρ2 for the members of the cluster takes the values of 0.1 to 0.187, whereas the respective values for the outlier vary from 0.33 to 0.44. The parentheses (i, 10), i = 1,2,. . .,9, denote the data point of the outlier by a pair of the ith measurement and the index of the outlier.
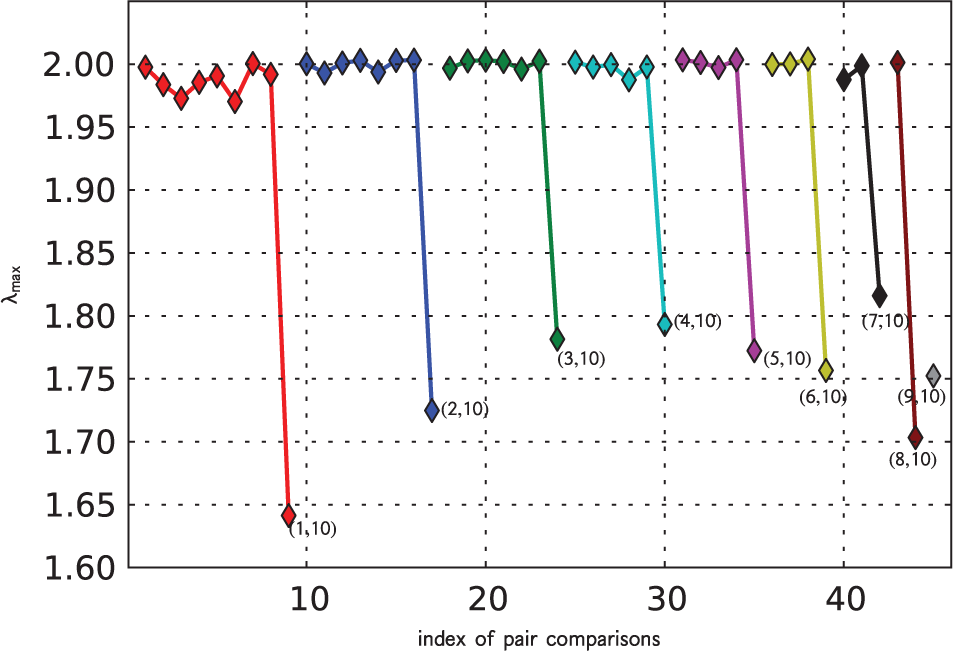
The diagram plots the largest eigenvalues of a covariance matrix of pairs of reflectance curves for example 1 (see Fig. 8 ). The values of λmax computed for the members of the cluster vary from 1.97 to 2.00, while the respective values for the outlier R1,10 take values less than 1.82. The parentheses (i, 10), i = 1,2,. . ., 9, denote the data point of the outlier by a pair of the ith measurement and the index of the outlier.
Example 2
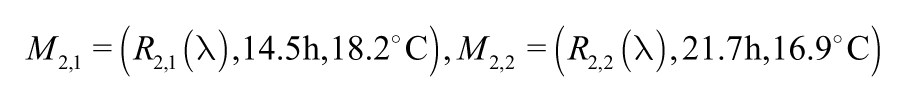
A series of six reflectance curves of putrefaction-affected skin of a 65-year-old man with measurements recorded between 14.5 and 95.9 h postmortem is shown in Figure 11 . We denote the measurements of this case as follows:
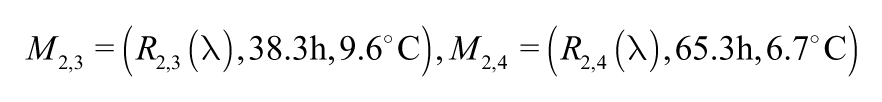
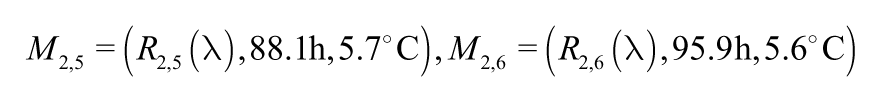
Time series of reflectance spectra for example 2 discussed in the text, taken from a 65-year-old man, documenting the time-dependent changing of spectrum shape. A series of 10 reflectance spectra measured on putrefaction-affected skin at different postmortem times in the course of cooling down the corpse is shown. The reflectance spectra recorded in the postmortem time interval from 14.5 to 95.9 h compose a cluster with thresholds
The reflectance spectra compose two clusters with the given thresholds
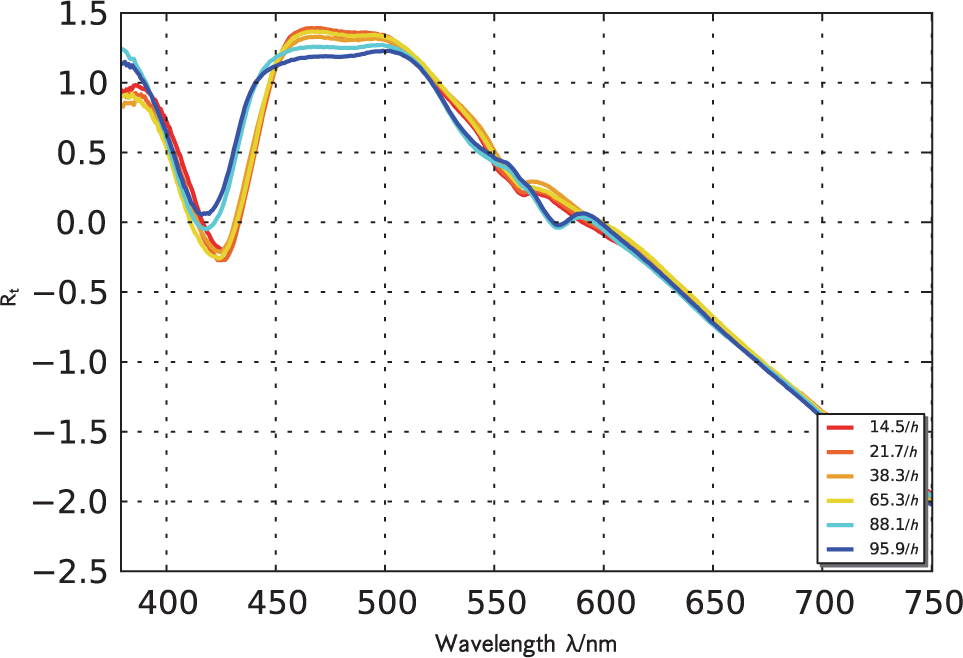
The diagram plots the measure ρ2 for pairwise comparisons of reflectance curves for example 2 (see Fig. 11 ). Altogether, 15 comparisons were performed. The pairwise comparisons of the reflectance spectrum of the first measurement with the other five spectra are marked by red symbols, the comparisons of the second spectrum with the remaining four are marked by blue symbols, the comparisons of the third spectrum with the remaining three spectra are marked by green symbols, and so on. The measure ρ2 for the members of the first cluster takes values of 0.14 to 0.165, and the values of λmax are equal to 2.00 (not shown), whereas the respective values of ρ2 for the two outliers vary from 0.27 to 0.33 and λmax <1.994 (not shown). The latter two reflectance spectra compose the second cluster (magenta symbol) with values of ρ2 = 0.128 ρ1 = 0.96, and λmax = 2.00. In parentheses, the chronological measurement indices of the corresponding pairs of curves are indicated.
In conclusion, in this study, we propose similarity measures and a criterion of similarity that capture similar spectra collected on corpse skin. We show that in legal medicine, matching and clustering of reflectance curves obtained by means of reflectance spectrometry with respect to a given criterion of similarity can be used to estimate the postmortem interval, by uncovering a critical postmortem time point during which a characteristic change in reflectance curve shape takes place. Altogether, 532 measurements as well as their metadata have been pairwisely compared and clustered with respect to the given similarity criterion. Attempting to cluster reflectance spectra according to metadata parameters such as age, body mass index, cause of death, and so on did not yield any identifiable clusters. However, by clustering with respect to spectrum shape, we found that for 57 of 120 investigated cases, the critical postmortem time had an average value t* = 68.2 ± 29.5 [h], and the respective critical temperature was T* = 8.9 ± 2.2[°C] when the ambient temperature was 4 °C to 6 °C. Concerning the ambient temperature, it is important to note that under refrigeration at 4 °C, the reflectance spectra of the skin undergo the described change in shape slower than under higher temperatures. Therefore, it is a subject of ongoing research to further sophisticate the measurements with regard to diverse environmental conditions. Because of manual recording of data, 532 measurements represent a small database and therefore are not yet sufficient for statistical significance. Nevertheless, in future, we will investigate this phenomenon with a larger data set of reflectance spectra. Future data acquisition will be performed using a robotic system. This allows the collection of larger amounts of data than in the present study. We conclude that the presented results emphasize the importance of the application of clustering to reflectance measurements. We expect that further improvements of the measuring procedure as well as of the criterion of similarity and perhaps of the measures of similarity will establish new research methods for life sciences and convenient examination methods for clinical practice. This is of certain relevance because the approach of analyzing reflectance spectra of human skin with the help of clustering can potentially be applied for the diagnosis of skin cancer and in different domains of health care.
Footnotes
Acknowledgements
We thank Katharina Schulz for a part of the performed measurements and Dimitri Belenki for critical remarks on the manuscript.
Declaration of Conflicting Interests
The authors declared no potential conflicts of interest with respect to the research, authorship, and/or publication of this article.
Funding
The authors disclosed receipt of the following financial support for the research, authorship, and/or publication of this article: This study has been supported by Deutsche Forschungsgemeinschaft (German Research Council), file number Bo 1923/2-1.