
Abstract
Angiogenesis is the biological process of generating new capillary blood vessels. It is a fundamental component of a number of normal (reproduction and wound healing) and pathological processes (diabetic retinopathy, rheumatoid arthritis, tumor growth, and metastasis). In vitro angiogenesis assays provide a platform for evaluating the effects of pro- or antiangiogenic compounds. One of the most informative assays is the endothelial cells capillary tube formation assay performed on a biological matrix. This assay is based on quantification of the stimulatory and inhibitory effects of various agents, which is estimated through the measurement of the pseudo-tubules network length. This standard measurement is usually carried out manually by trained operators but requires time, attention, and dedication to achieve a reasonable degree of accuracy. Moreover, the screening is operator dependent. In this article, we propose an automated procedure to evaluate the pseudo-tubule network lengths. We propose a series of image analysis procedures developed using a freely available image analysis software library. More than 800 images from 12 experiments were analyzed automatically and manually, and their results were compared to improve and validate the proposed image analysis procedure. The resulting image analysis software is currently running on a dedicated server, with comparable accuracy to manual measurements. Using this new automated procedure, we are able to treat 540 images, or three complete assays per hour.
Introduction
Angiogenesis, the formation of new capillaries from preexisting blood vessels, is a crucial component of embryonic vascular development and differentiation, wound healing, and organ regeneration. 1 It also contributes to the progression of pathologies that depend on neovascularization, including tumor growth, ischemic ocular disease, and rheumatoid arthritis. 1 Angiogenesis assays provide a platform for evaluating the efficacy of pro- and antiangiogenic compounds. Endothelial cells are the main cells involved in the angiogenic process. In this context, several basic in vitro tests have been developed for the objective assessment of angiogenic response, which include endothelial cell proliferation, migration, and survival. 2
A more complex assay to evaluate endothelial cell activity is the ability of these cells to produce pseudo-capillarylike structures (defined as pseudo-tubules). 3 This is the test that we have automated. Endothelial cells are able to form pseudo-tubules spontaneously on a biological matrix. In this context, we have developed an endothelial cell pseudo-tubules formation assay on a matrix composed of Matrigel and collagen. 4 The use of this matrix can typically result in endothelial cell pseudo-tubule formation within 24 h in the presence of proangiogenic factors such as fibroblast growth factors (FGFs) and allows evaluation of the activity of anti- or proangiogenic compounds with a good accuracy and reproducibility. We had already developed a semiautomated protocol to quantify the overall length of the network of pseudo-tubules relatively easily. A Morpho Expert (Explora-nova) macro was developed in this way. Operators manually draw line segments on images of pseudo-tubules, and the macro simply computes the overall Euclidean length of the network on a per-image basis. Nonetheless, the final analysis of this assay is still time-consuming and labor intensive: about 2 min per image under optimum conditions. Complete assay analyses using this macro take about 2 h with an experienced operator, which limits the number of assays that can be assessed in a given day. Moreover, this procedure may also be sensitive to human subjectivity. The need to develop dedicated software arose from the high relevance of this test for screening of new molecules implicated with angiogenesis.
Materials and Methods
All experiments followed the same basic protocol: growth factor–reduced Matrigel (BD Biosciences, Franklin Lakes, NJ) was diluted in collagen (1/6 v/v) and kept on ice. Sixty microliters of this solution was added to each well of 96-well culture slides precoated with type I rat tail collagen and left at 37 °C for 1 h. A human umbilical vein endothelial cell (HUVEC) suspension was seeded into the Matrigel/collagen gel for 24 h at 37 °C with the growth factors or compounds to be evaluated. For each experiment, in addition to the in-house compounds being evaluated, two control conditions were always included: a control group in which HUVEC had no stimulation and a positive control in which HUVEC were stimulated with proangiogenic growth factors such as fibroblast growth factor 2 (FGF2) or vascular endothelial growth factor.
In the end, wells were automatically imaged using a camera (DXM120) coupled to a NIKON TE2000-E inverted microscope using a 4× objective and a ProScanII Motorized Stage.
The shape of the Matrigel matrix meniscus under illumination resulted in an unavoidable asymmetrical and image-dependent halo that prevented using a simple threshold to segment the network (see Fig. 1 ). Because of the variability of shadows (both in luminosity and size), we evaluated different filters such as path openings, 5 attribute filters, 6 or top hat. 7 We selected the top-hat filter as it gave us the fastest and most homogeneous results.
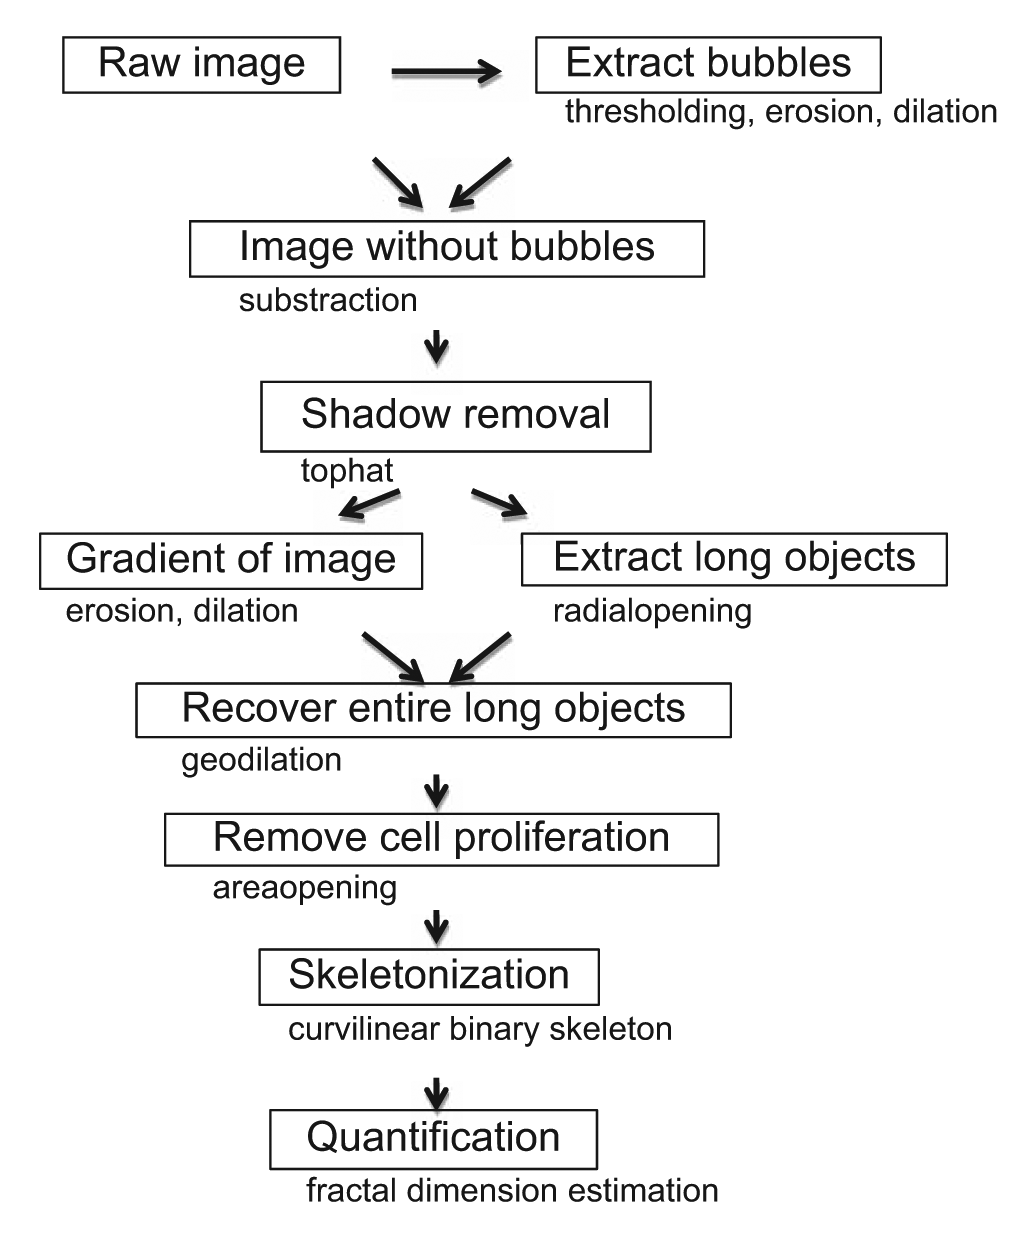
Flow chart of the procedure with main operations.
In addition, only some of the features of the image of endothelial cells should be considered for computing the relevant length of the network.
Because of the geometrical nature of the image elements under study, we chose to use mathematical morphology methodologies. 7 Some key elements for this choice were expertise, software availability, and strong links with geometry, stereology, and topology.
Validation of the Biological Conditions
This assay is particularly sensitive to environmental conditions, and a correct sequence of steps must be observed during assay preparation for results to be meaningful. This is independent of whether the analysis is done manually or automatically.
To validate the experiments, technicians visually controlled whether tube formation occurred. We expected the network length to increase when endothelial cells were stimulated by proangiogenic compounds in comparison with control. For descriptive purposes, fold changes (F) between control and positive groups were calculated from manual and automatic measurements for each experiment.
Statistical Analysis
For a number of years, manual measurements have been used to assess network lengths. It is desirable that we obtain the same measurements with the automated procedure.
First, manual and automatic measurement distributions were superimposed to check for overlapping and similar distribution shapes. Then, boxplots were used to describe these distributions more precisely.
As indicators of the strength of a linear relationship between two independent variables, Pearson’s correlation coefficients between manual and automatic measurements were calculated. These coefficients were calculated in all experimental conditions. Analyses were performed using the SAS v9.2 software package.
Image Analysis Software
The image analysis procedures use the PINK library developed at ESIEE (http://www.pinkhq.com). This library includes many useful mathematical morphology and discrete geometry algorithms and is freely available. We mostly use the morphological filtering, segmentation, and skeletonization components of the library. Statistical analysis is performed in the open statistical language R and Microsoft Excel. Open-source components were chosen for easy deployment, affordability, and scalability with computer performance.
Image Analysis Procedures
Angiogenesis assay images look superficially easy to segment and analyze. In fact, trained operators select only a subset of the visible network corresponding to correct endothelial cell physiology features. Many visible elements are discarded and not counted in the final overall length quantification.
A large part of the development consisted in mutual information exchange between image operators and developers to translate human analysis into working and consistent algorithms. We present here the algorithm with the best overall characteristics summarized in the flow chart in Figure 1 .
We can distinguish five stages of image analysis (see Fig. 2 ): (1) elimination of artifacts such as bubbles and shadows, (2) segmentation of the overall tubule network, (3) elimination of cell clumps, (4) isolated cells, and (5) final quantification performed by summing the length of all tubules (5).
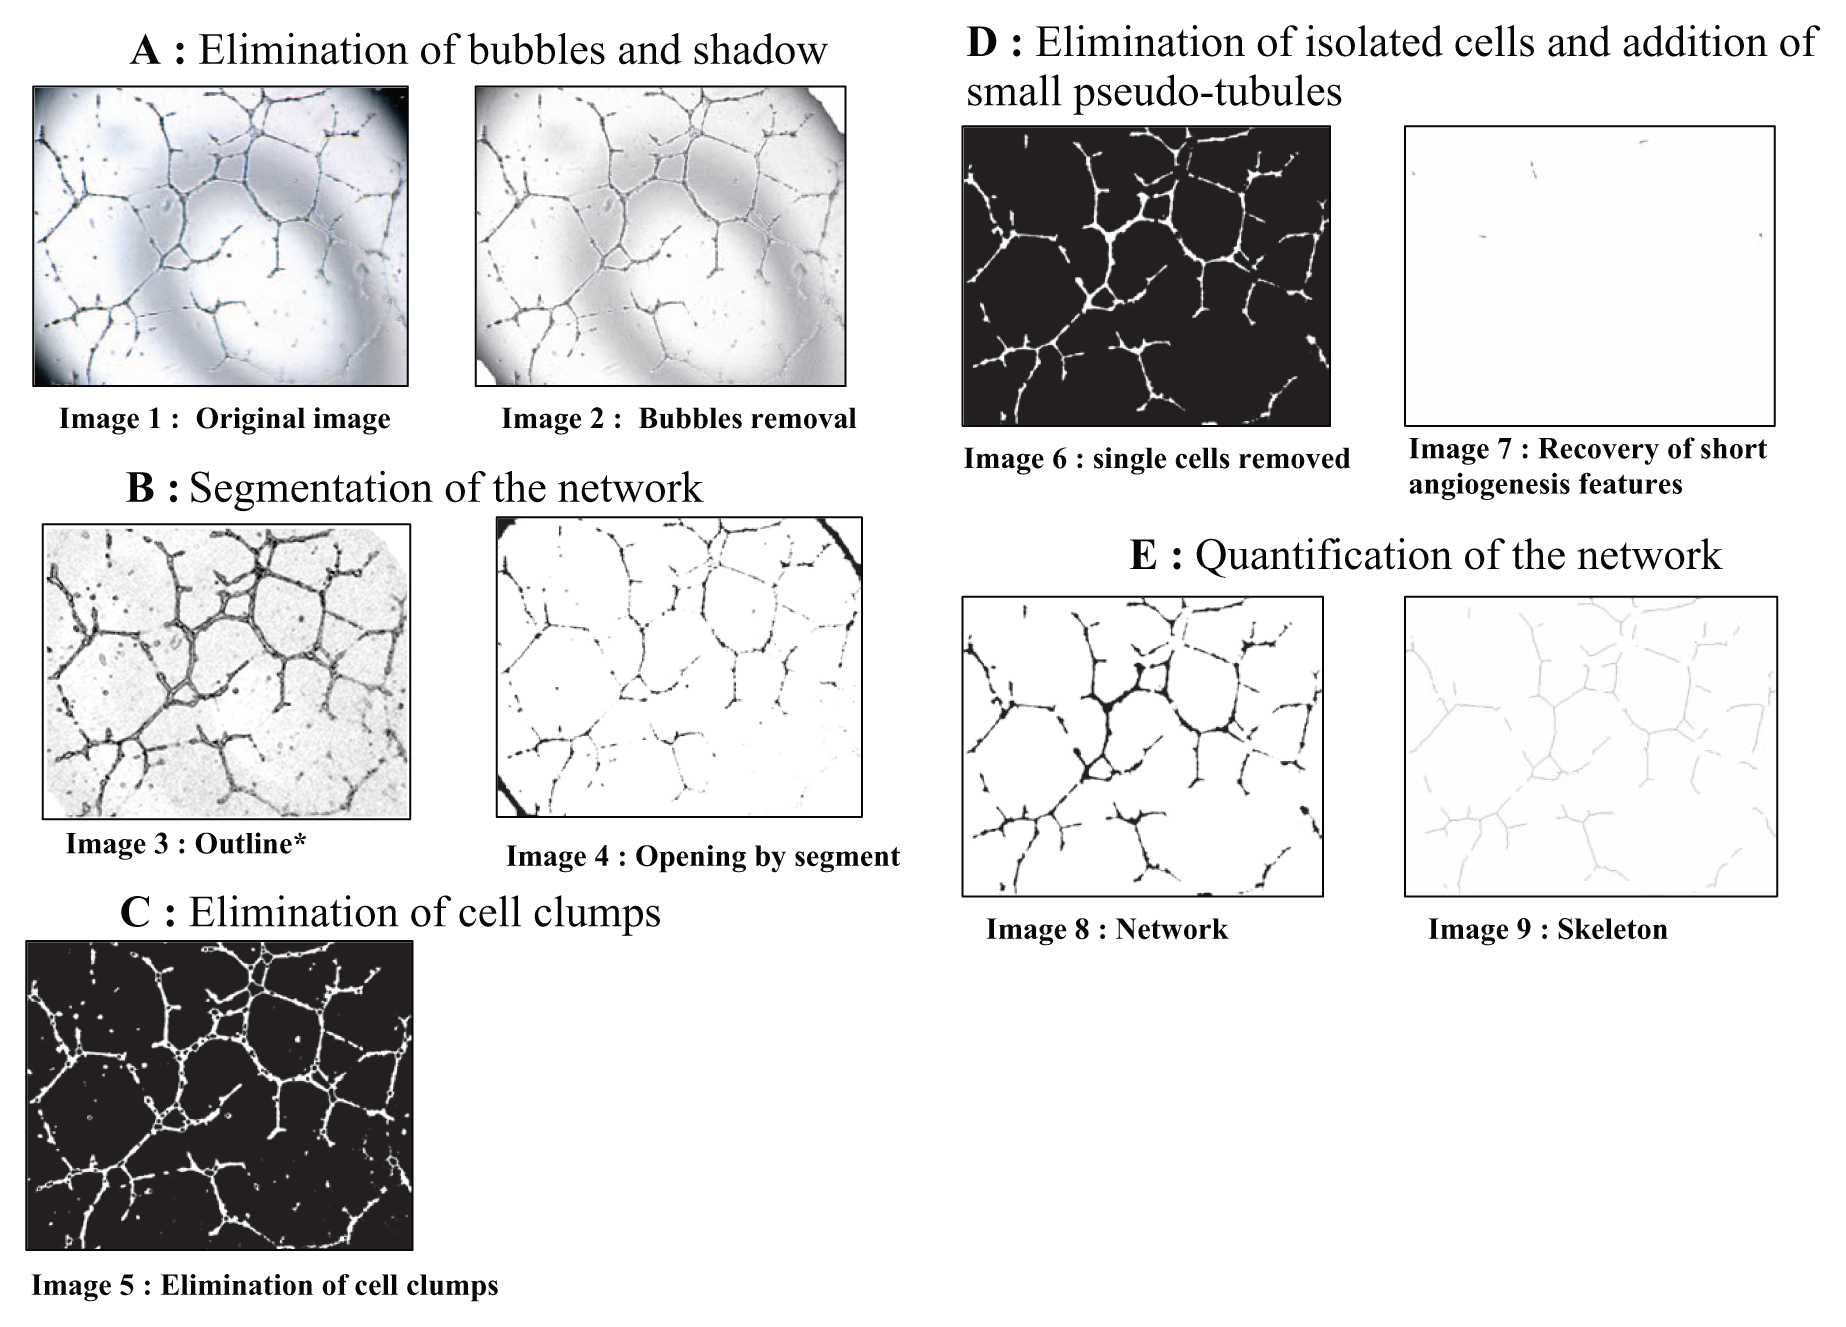
Basic image-processing steps. Scale of images: 1 pixel = 2.319561 µm. *Contrasted and inverted for a better visualization.
Elimination of Bubbles and Shading Correction
Shadows due to the acquisition procedure and the geometry of the 96-well plate were eliminated through an automated thresholding procedure 8 followed by an erosion (structuring element [SE] disc of radius 27 pixels) to eliminate small noise and then a dilation (SE: disc of radius 57 pixels) to correct for artifact underestimation. 9 All structuring element discs were specified as Euclidien discs for better isotropy. The results are marked as the area where no measurement should occur.
Segmentation of the Network
An auto-threshold (Otsu method) on the previously filtered image results in a binary image. Pseudo-pipes are small membrane segments. To eliminate small noise and preserve linear structure, we used a series of small linear SE spanning most orientations to detect linear features to serve as markers for reconstruction (length of 15 pixels, length width of 9 pixels, and an angle of 30° between each opening). 10
The choice of SE was a compromise to preserve pseudo-pipes and eliminate noise. This result yields a good mask for a morphological reconstruction into the morphological gradient of the original image (dilate(I) – erode(I)). In this way, all segments retain their original shape. 11
Elimination of Cell Clumps
Clump cells are cell agglomerates that did not participate in the angiogenesis process. To eliminate these clump cells from the final quantification, we subtracted the opening by a disc of radius 21 pixels and then dilated the resulting so-called top hat by a disc of radius 15 pixels.
Elimination of Isolated Cells and Preservation of Short Angiogenesis
At the given magnification, isolated cells have an average area of less than 500 pixels 2 . An eight-connected area opening with a parameter of 500 pixel 2 eliminates these single cells. 12 However, this procedure may eliminate some relevant short tubular features. A union of openings with line segments at different angles (length 30 pixels, step angle 5°) allows us to retain the short angiogenesis segments, which are added back to the main network image.
Quantification of the Network
We measure the network length by computing the area of the curvilinear skeleton of the segmentation obtained at step 4 via fractal dimension estimation. 13 Even though the lengths of individual skeleton branches are not well estimated by this procedure, the overall average well correlates between automatic and manual measurement.
Results
We analyzed manually and automatically 839 images from 12 experiments.
Fold Changes
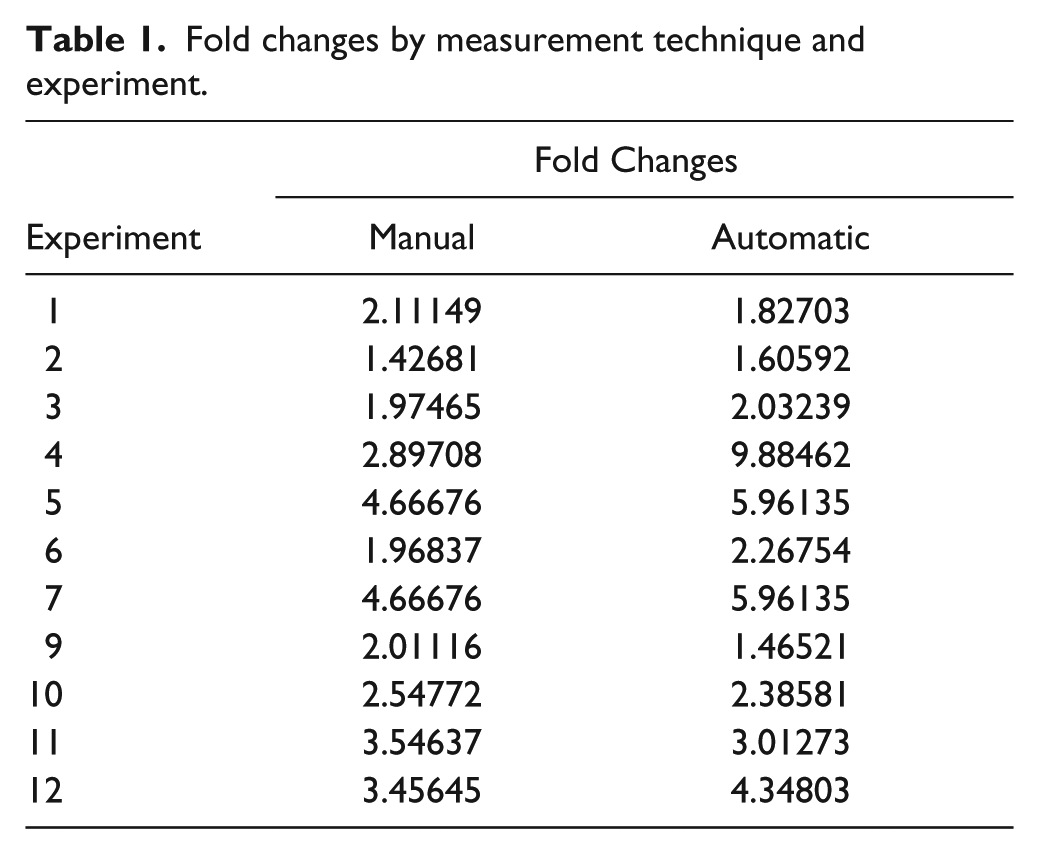
Fold changes between positive (in the presence of proangiogenic factor) and negative control (in the absence of proangiogenic factor) were compared between manual and automatic measurement ( Table 1 ). A good correlation between fold changes measured after manual quantification and fold changes measured by automated analysis is obtained. Moreover, the magnitude of angiogenesis induction by growth factor treatment is sufficient to allow us to use these experimental conditions and this quantification method to evaluate the effect of antiangiogenic drugs.
Fold changes by measurement technique and experiment.
Graphical Investigations
We observed that the range of the measurements is slightly higher with the automated technique ( Fig. 3 ): the manual method relies on straight line segments drawn by the operators, meaning that the lengths of slightly curved features could be underestimated. Nevertheless, the distributions of the network length measured manually and automatically are well superimposed and present the same asymmetric shape. Interestingly, if we compare manual and automatic measurement, a clear linear relationship appears ( Fig. 4 ).
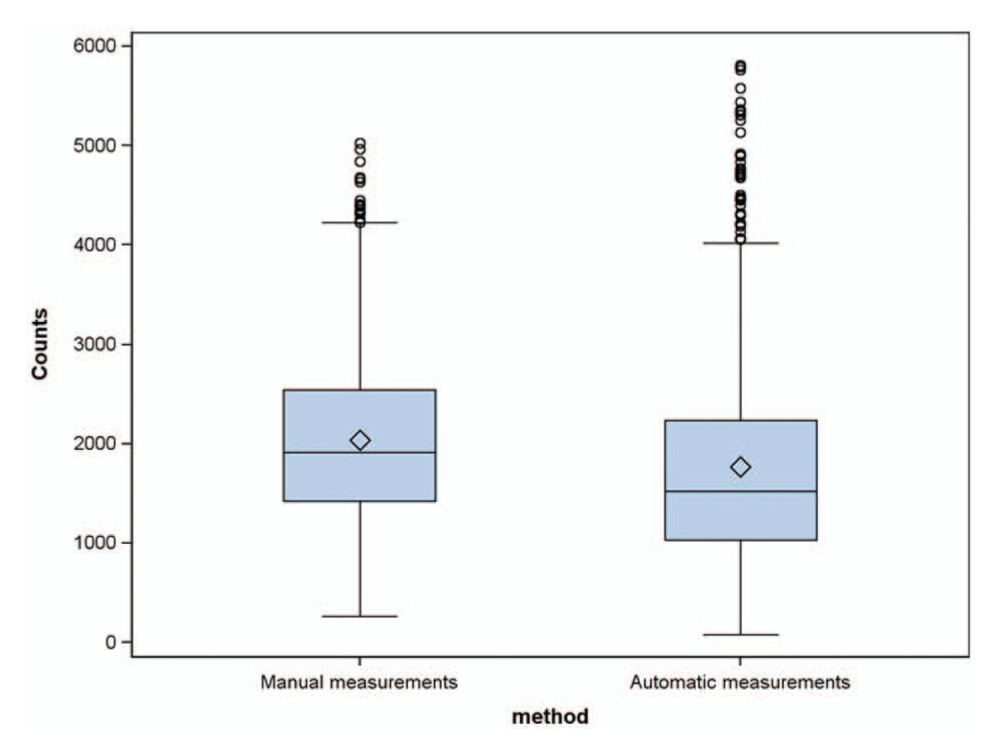
Boxplots of network lengths by measurement technique.
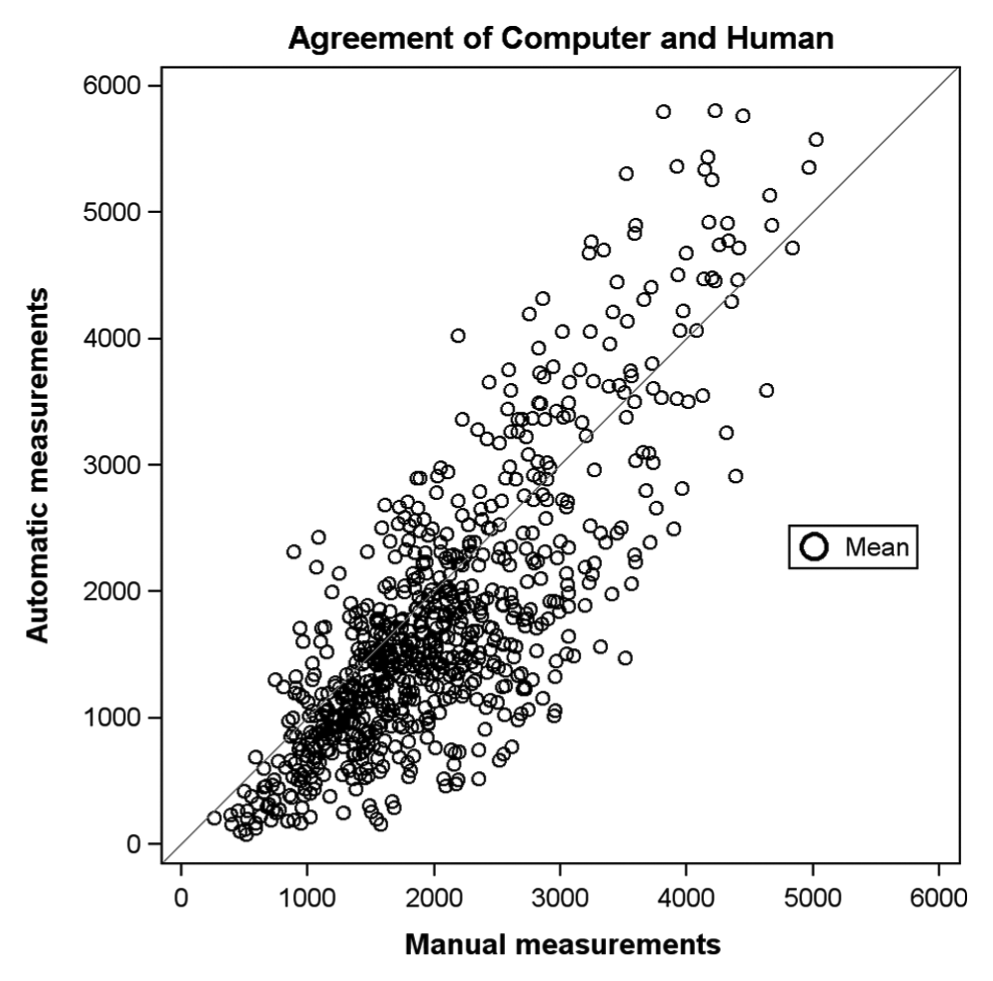
Scatter plot of network lengths.
Coefficient of Correlation
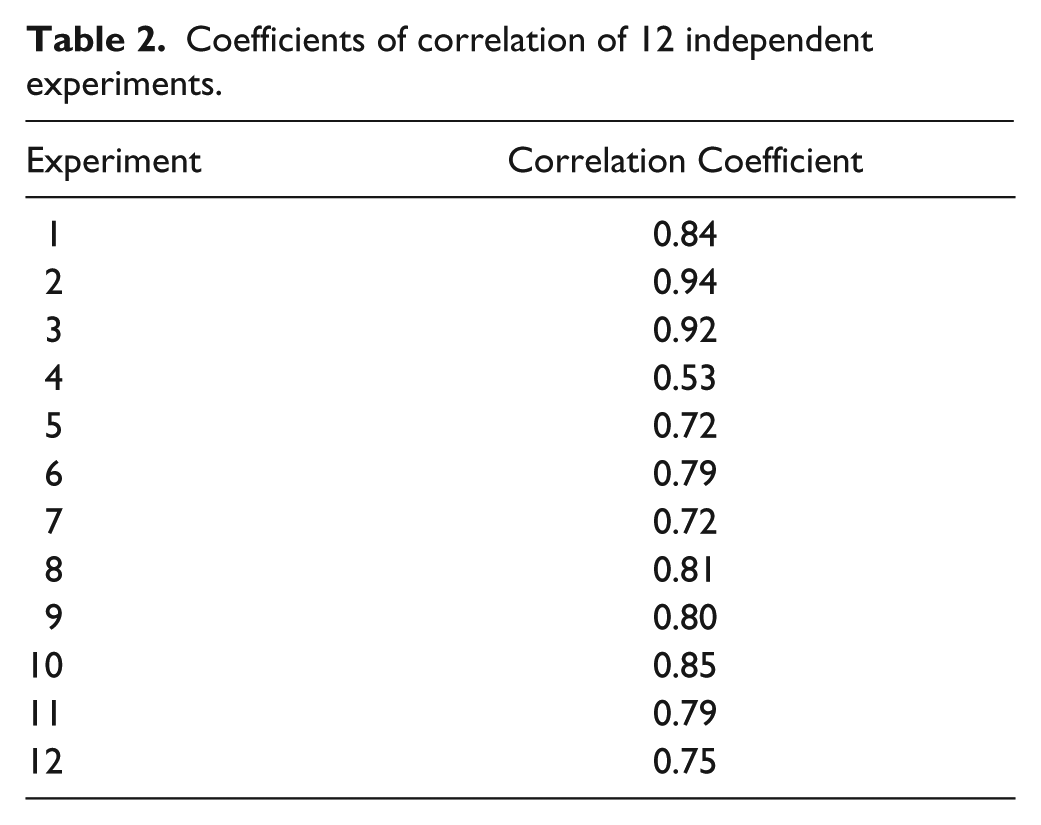
To compare manual and automated analysis, we computed Pearson’s coefficients of correlation of the 12 independent experiments ( Table 2 ). The coefficients of correlation lie between 0.72 and 0.94, except for experiment 4, which has a coefficient of 0.53. We observed that for experiment 4, pictures were out of focus, explaining this poor coefficient of correlation between manual and automatic counting.
Coefficients of correlation of 12 independent experiments.
Conclusion
The automated image analysis procedure does not measure exactly the same network features than a human operator, and as a result, direct measured length comparison is not possible. However, the results obtained show a good correlation between manual and automated measurements. The software is now used routinely by our operators and has been parallelized so each image can be run independently on a separate CPU on a Linux cluster. A postprocessing script collects the results obtained by each operator and calculates overall statistics. This workflow permits analysis of 180 images in 20 min, which corresponds to a speed increase factor of 6×, in comparison to manual analysis. Moreover, this workflow improved reliability, intraindividual reproducibility, and interindividual variations. This software allows us to perform a phenotypic screening test to evaluate pro- or antiangiogenic chemical compounds or monoclonal antibodies.
Footnotes
Acknowledgements
We thank reviewers for their thoughtful review of our manuscript, and Noelle Boussac for her contribution in statistical analysis.
Declaration of Conflicting Interests
The authors declared no potential conflicts of interest with respect to the research, authorship, and/or publication of this article.
Funding
The authors received no financial support for the research, authorship, and/or publication of this article.