
Abstract
Techniques to separate cells are widely applied in immunology. The technique to separate a specific antigen on a microfluidic platform involves the use of a shear horizontal surface-acoustic-wave (SH-SAW) sensor. With specific antibodies conjugated onto the surface of the SH-SAW sensors, this technique can serve to identify specific cells in bodily fluids. Jurkat cells, used as a target in this work, provide a model of cells in small abundance (1:1000) for isolation and purification with the ultimate goal of targeting even more dilute cells. T cells were separated from a mixed-cell medium on a chip (Jurkat cells/K562 cells, 1/1000). A novel microchamber was developed to capture cells during the purification, which required a large biosample. Cell detection was demonstrated through the performance of genetic identification on the chip.
Keywords
Introduction
Cellular immune sensors serve as detection devices capable of sensing the binding of target cells to a specific antibody by coupling the immunochemical reaction to the surface of a transducer.1–6 Observing the population of targeted cells with specific markers has become necessary in disease diagnosis and the development of vaccines. 7 Because the concentration of specific targeted cells is small in the prophase (1 to 103 cells/mL), microfluidic devices have attracted considerable attention for the detection of targeted cells and analysis of cancer cells. This analysis is typically conducted by enriching a cell culture, staining with fluorescent dyes, cell counting with a flow cytometer, 8 using spectrometric techniques, separating, and cell sorting,9–11 but this process is expensive with respect to labor as well as tedious, generally requiring 4 to 7 days to yield concrete results. Various methods based on micro/nano technology are being developed for the rapid detection and targeting of rare cells. Based on an immunoadhesion device, microarray and immobilized probes are used to capture specific cells in research on the cellular immune response. Antigen-specific cells are captured on individual spots (MHC complexes) in an array, for which the cell capture at each spot depends on the specificity of a target cell. 12
Various methods to detect cells have been proposed and demonstrated, including light absorbance and scattering imaging, electric detection, electrochemical detection, and gravimetric methods involving piezoelectric immunosensors. 13 Of the latter, quartz-crystal microbalance and surface-acoustic-wave (SAW) sensors are the two most common transducers. Electrochemical sensors commonly contain several electrodes, including some for sensing, counting, and reference. Piezoelectric SAW sensors operate by measuring a shift in resonant frequency, which can be correlated with small changes of mass at the quartz surface. The input and output of interdigital transducers (IDT) are comblike metal electrodes, which serve as structures to transform energy on the surface of a selected substrate. When an AC voltage is applied to the input of an IDT, it induces a dynamic strain in the substrate, so as to launch surface waves along the top of the substrate. The induced surface waves propagate throughout the active sensing region and are then received and transformed into electric signals by the output of the IDT. The variation of the magnitude and phase shift of the AC electric signals between the input and output of the IDT allows detection of the change of mass in the active sensing region. Because the frequency readout from the SAW sensors can be acquired rapidly, it is possible to observe surface mass loading in real time using a SAW immunosensor. An advantage of such a SAW immunosensor is that it is sensitive to a variation of mass on the surface of the transducer during the immunochemical reaction without any labels, and the sensitivity increases with the operating frequency. The operational frequency of SAW sensors can be designed to be as great as 1 GHz, and SAW sensors are expected to be more sensitive to molecular interactions on the surface of the transducer. SAW sensors applied in fluids have two adjustable options for the electric insulation: one is a protective layer such as SiO2 to isolate the water, which is in direct contact with the sensor,14,15 and the other is to use a substrate of another material having a large relative permittivity (ϵ).
Here we present an innovative concept of a microincubator for antigen-specific cells, with rapid purification of targeted cells on shear horizontal surface-acoustic-wave (SH-SAW) sensors and the detection of targeted cells. A Rayleigh wave generally suffers from a large decay of energy; for that reason, SH-SAW is used for detection in the liquid phase because of the decreased energy decay. An SH-SAW device fabricated with a Y36°-X LiTaO3 (ϵ = 47) substrate was therefore selected.16,17 The targeted cells can be isolated and purified from body fluids by using cellular immune SAW sensors in the proposed microfluidic system ( Fig. 1 ). With this approach, the deletion of targeted cells can be rapidly analyzed within a decreased period.
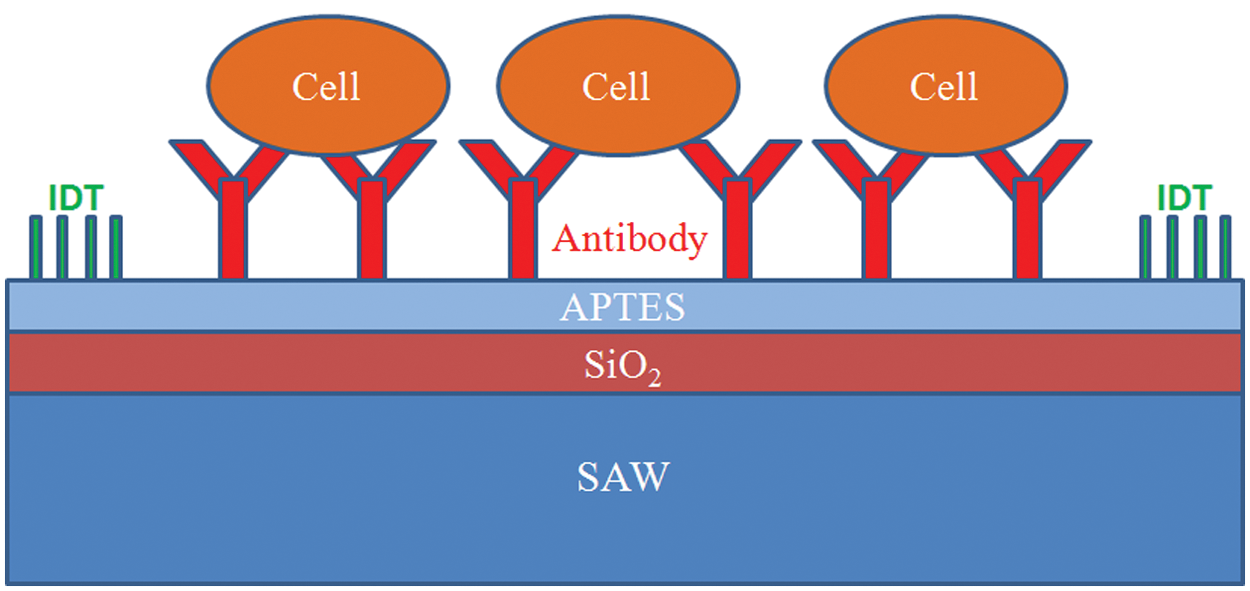
Schematic diagram of the basic configuration of the surface-acoustic-wave immunosensor.
Materials and Methods
SAW Theory
SAW sensors exhibit diverse applications in chemical and biochemical sensors. The sensors have great potential because of their advantages of small size, small cost, great sensitivity, and rapid response. 18 The basic principle of a SAW sensor is that the material comprises a piezoelectric crystal or film with a constant frequency in the range MHz to GHz that exhibits a decreased frequency when molecules are adsorbed directly on the surface of the piezoelectric substrate or film coated with a thin film of polymer and a biosubstrate. The variation of oscillating frequency is proportional to the mass of foreign molecules deposited on the crystal surface and the center frequency of the piezoelectric crystal. Research into the use of SAW devices has been spurred by their extremely great sensitivity. For instance, SAW devices at a frequency >100 MHz are capable of detecting the presence of foreign mass 10−10 g on their surfaces. The frequency shift of a SAW delay-line oscillator can be assumed to be governed with the following equation 1 for an acoustically thin, perfectly elastic, thin film, derived using perturbation theory19,20:

in which k1 and k2 are parameters of the piezoelectric material, f0 is the center frequency of the SAW device (Hz), m is the mass of foreign molecules deposited on the crystal surface, and A is the sensing area of the thin film of polymer and biosubstrate.
Chip Fabrication
IDT have been widely used for excitation of an electric signal and detection of SAW. Each period of an IDT consists of multiple strips periodically aligned and connected to the bus-bars. Various center frequencies and phase responses, according to the design of the IDT, can be measured with a network analyzer. The electric characteristics of an IDT are determined by the finger geometry during the period, the number of finger pairs, and the substrate material. For simplicity, this velocity equation 2 is used to set the center frequency of the SAW device:

in which is the velocity of the surface wave for the chosen substrate, f is the center frequency of the designed SAW device, and λ is the wavelength of the surface wave. The wavelength of the surface wave is a function of the spacing between the fingers and the width of the fingers. The spacing of an IDT of single-electrode type is determined to be a quarter wavelength (λ/4), which provides the required definition for photolithography. The IDT comprise 50 finger pairs with an acoustic aperture W = 2.074 mm and a periodicity λ = 34 µm, which corresponds to a SAW frequency approximately 121.3 MHz in aqueous solution ( Fig. 2a ). Dual-delay lines were employed with a gold-metallized delay path between the input and output of the IDT to eliminate acoustoelectric interaction with analytes in the liquid phase (RPMI1640 culture medium) on the sensing surface. The guided SH-SAW devices were fabricated on lithium tantalate (LiTaO3, 36° rotated, Y-cut, X-propagating) piezoelectric substrates with Au/Cr metallization (thickness 150 nm/20 nm) with a standard lift-off photolithographic process ( Fig. 2b ). An SiO2 layer (thickness 4.0 µm) was then deposited with plasma-enhanced chemical-vapor deposition on both the IDT and the sensing area. The effect of this layer is to convert the SH-SAW into a guided SH-SAW, to increase the coupling coefficient, and to provide electric passivation of the IDT. The SiO2 waveguide layer also decreases the temperature dependence of the resonant frequency. The SiO2 waveguide used in these devices is readily functionalized with collagen.
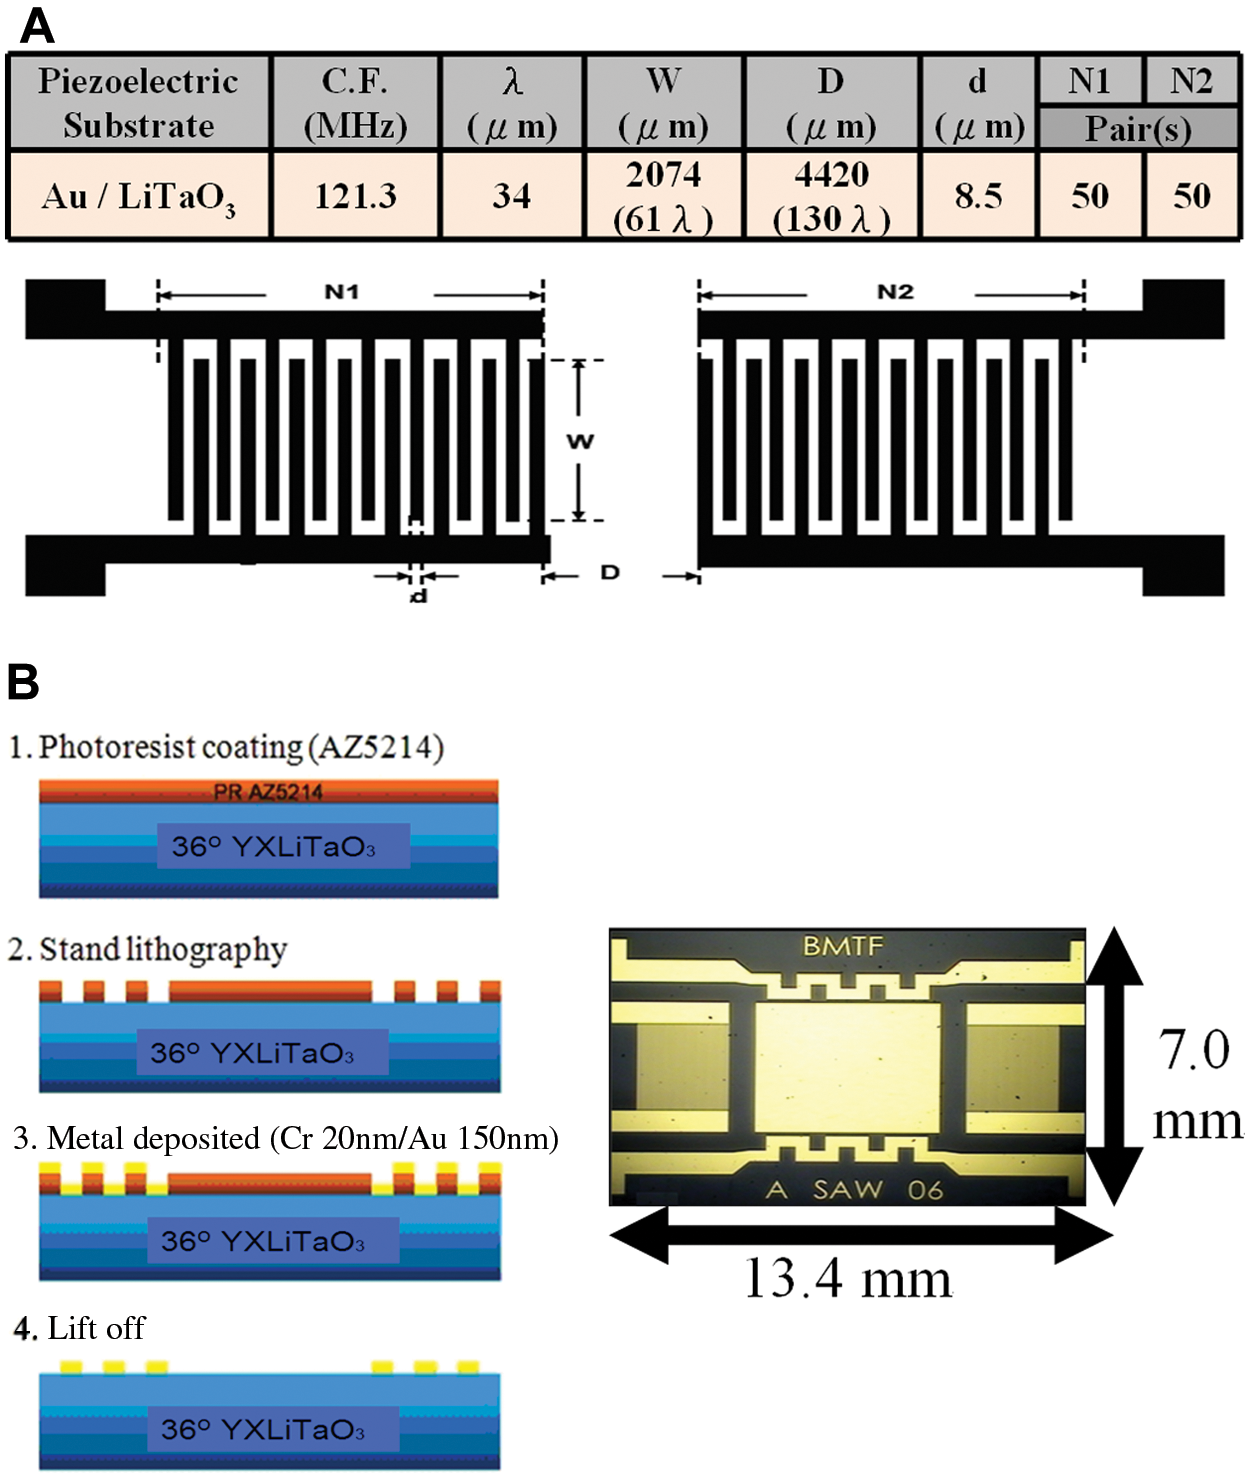
Parameters of the surface-acoustic-wave sensor and photolithography process. (
Polymethylmethacrylate Mold for SAW Sensor
For successful use of a SAW device in the liquid phase, a fluidic cell has been designed whereby a liquid microchamber (volume 18 µL) was placed over the sensing area to contain solutions and to ensure insulation of the IDT. A liquid microchamber was chosen among various materials for its biocompatibility and mainly for its nature, as it, unlike polydimethylsiloxane or polymethylmethacrylate (PMMA), does not stick to the sensing area. A PMMA sill including inlets and outlets was then added. To localize the sample liquid to the sensing area of the guided SH-SAW device, the PMMA mold ( Fig. 3a ) with a liquid microchamber was manufactured to surround the PCB of the SAW device ( Fig. 3b ).
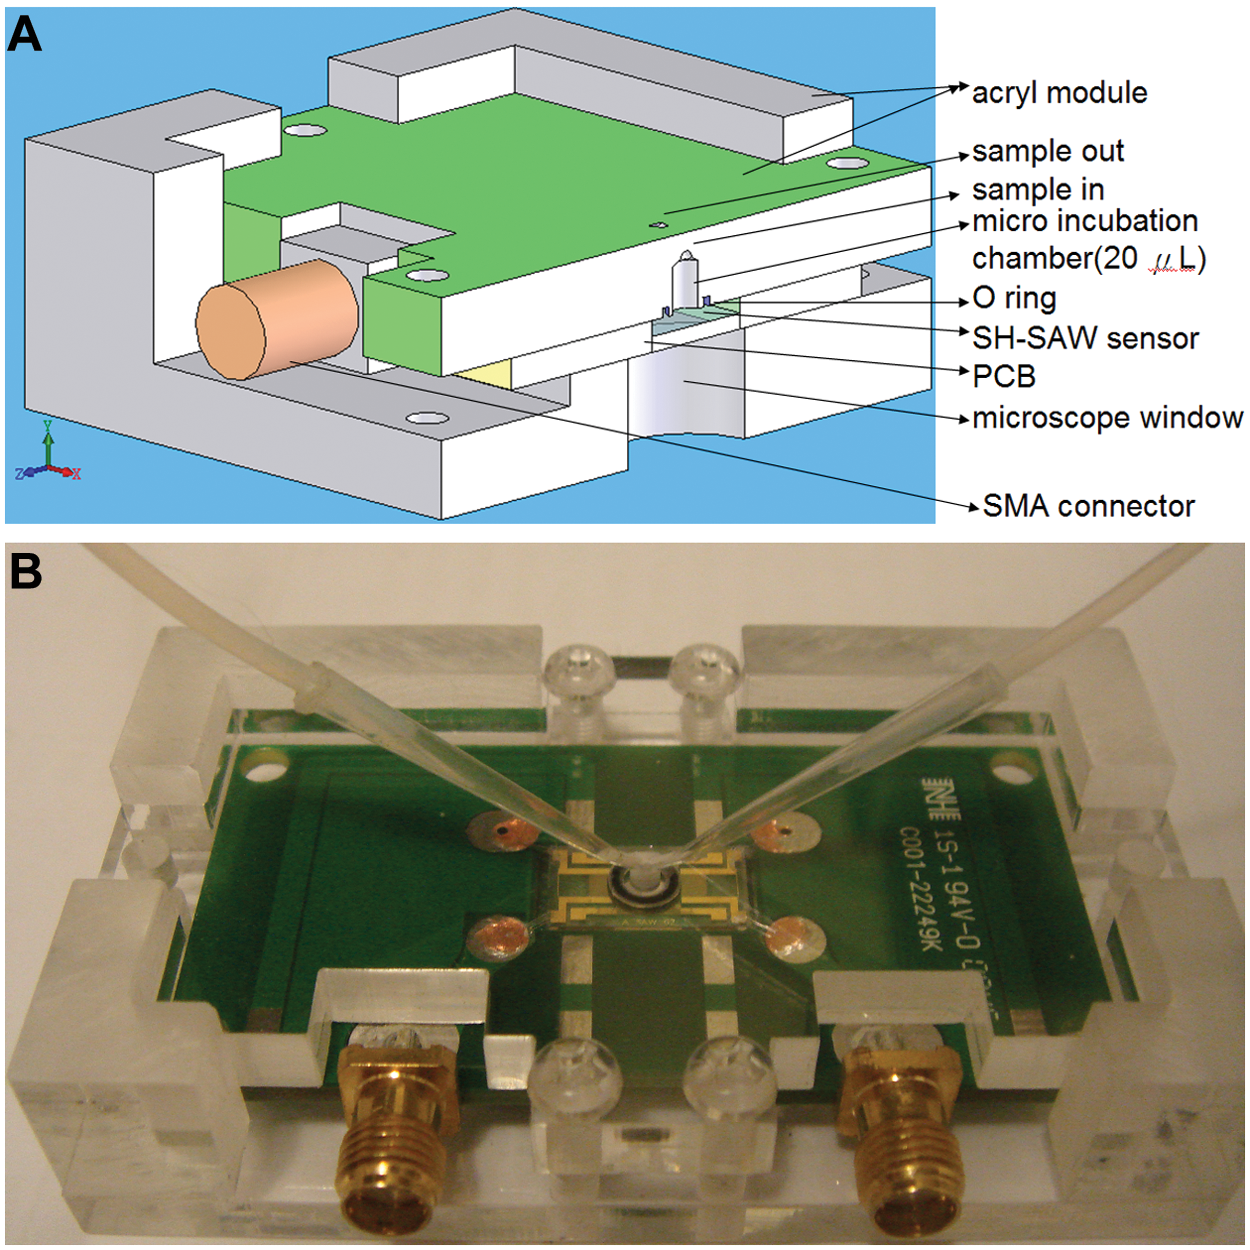
Schematic illustration of shear horizontal surface-acoustic-wave (SH-SAW) sensors and the detection system. (
Measurement Setup
The measurement system shown in Figure 4 comprised an SH-SAW sensor with a liquid microchamber, a frequency counter (Agilent 53131A), a computer for data logging, a power supply, a humidified incubator, and a peristaltic pump (Eyela MP-1000). The sensor response, as indicated by the frequency shift, was measured with a frequency counter. To cancel the fluctuations of temperature and pressure, a dual SAW configuration was used in which the SAW immunoassay sensors are two independent oscillator-circuit paths. The measured parameter was the frequency shift of the sensing line relative to the reference. An oscillator-circuit generator delivered a frequency signal; the output signal was then injected into a comparator to estimate the variations of its frequency shift.
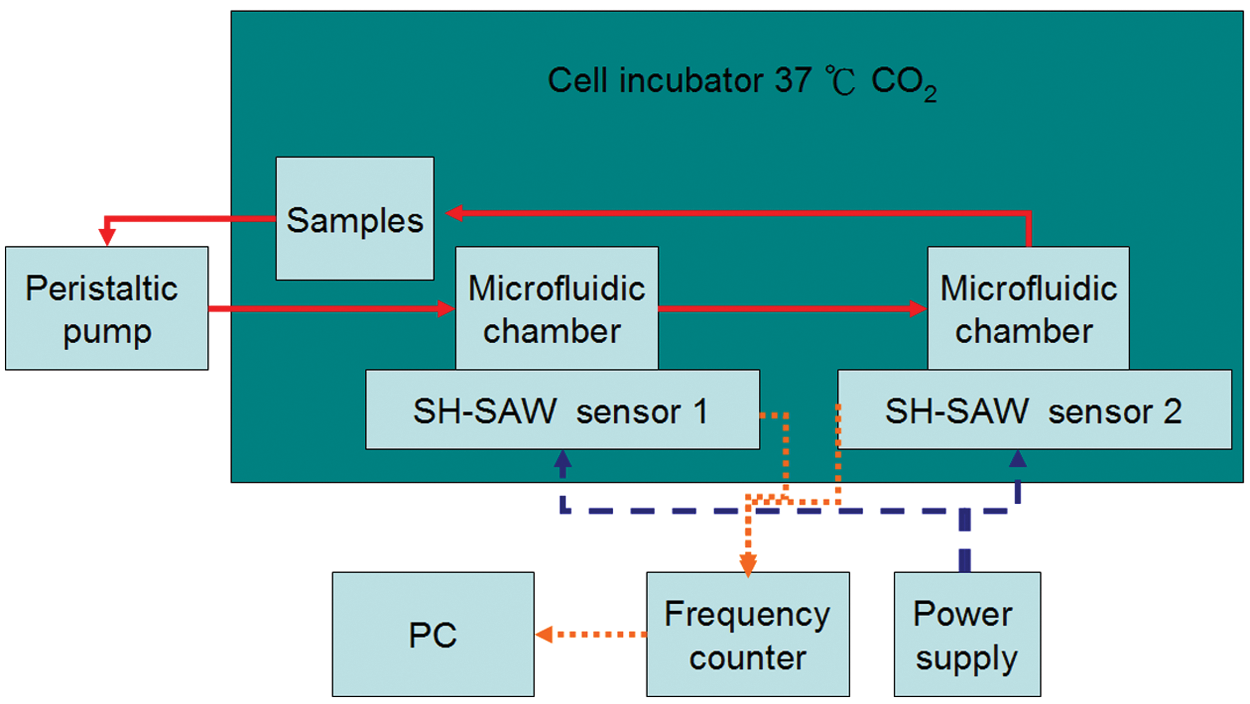
Schematic illustration of the experiment for purification and detection of specific cells.
Self-Assembled Monolayer Formation and Immobilization Antibody
The SH-SAW sensor was exposed to a dioxygen plasma at a rate 40 mL/min of air flow to form hydroxyl (-OH) groups on the surface. Experiments were driven using a peristaltic pump. To introduce amino groups, the SAW was silanized for 30 min in a saturated atmosphere of toluene by coating with 3-aminopropyltriethoxysilane (APTES, 1%) in toluene before being washed in toluene. The sensor was finally baked at 110 °C for 10 min. The amine-functionalized SH-SAW sensor was immersed in phosphate-buffered saline (pH 7.4) for 10 min at 23 °C; CD3 antibody solution (100 mg/mL) was pumped into the liquid microchamber. The surface was washed in water (milli Q) after exposure for 4 h. Both channels were blocked for 1 h in a moist atmosphere with bovine serum albumin (BSA; 5 mg/mL in 0.9% saline) before being washed in water (milli Q). BSA served as a blocking agent as it binds to silicon dioxide.
Culture of Jurkat Cell and K562 Cell
Jurkat cell and K562 cell were grown in RPMI1640 (Sigma-Aldrich, St. Louis, MO) supplemented with fetal bovine serum (FBS, 10%; Gibco, Carlsbad, CA) and antibiotics (penicillin 100 U/mL, streptomycin 100 g/mL; Gibco) at 37 °C in a CO2 (5%) humidified incubator. Because of their highly lipophilic nature, CM-TMR (red) and CM-FDA (green) carbocyanine dyes were applied for cellular labeling in the aqueous culture media; Jurkat cells were labeled red and K562 cells green. Experiments were driven with a peristaltic pump to ensure the continuous flow of fluids at a rate of 150 µL/min, and samples were circulated.
Results
SH-SAW Sensor
After the devices were fabricated, their electrical characteristics were measured with a network analyzer (HP 8714C). To diminish the energy loss, the impedance was matched between the sensor and the instrument. The center frequency of the SAW sensor was 122.5 MHz, the insertion loss was approximately −40.53 dB, the sidelobe rejection was 30 dB, and the Q-value was about 50 to 60 ( Fig. 5 ).
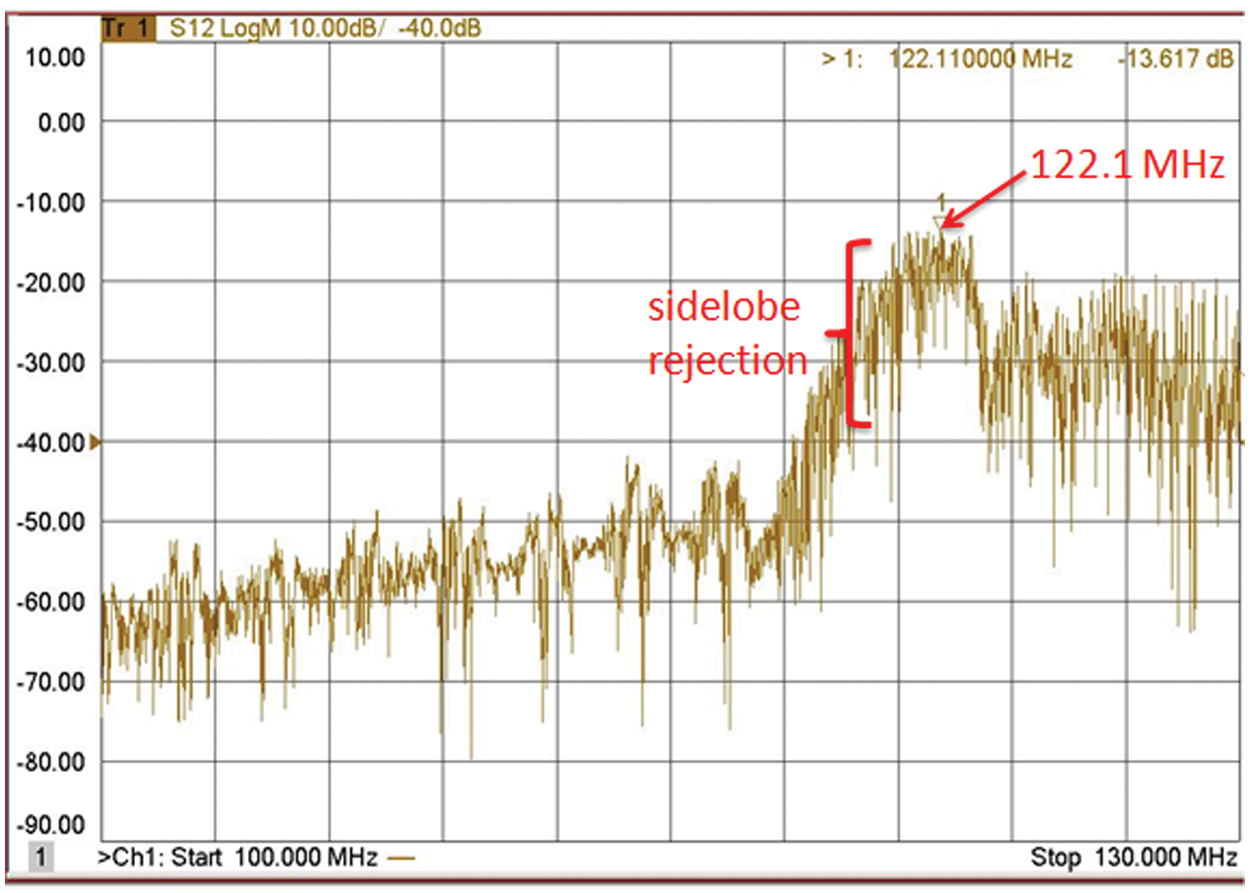
Frequency response of surface-acoustic-wave device using a network analyzer.
APTES Self-Assembled Monolayer
To compare the experimental patterns of contact angles obtained with a goniometer, we used each surface of SiO2 and ATPES to measure the contact angles; for each surface, prepared water (milli Q) served as the solvent. According to the image in Figure 6a , the contact angles varied. The SiO2 waveguide in these devices is readily functionalized with APTES SAM. The APTES-coated films exhibited higher contact angles than the SiO2 film did ( Fig. 6 ).
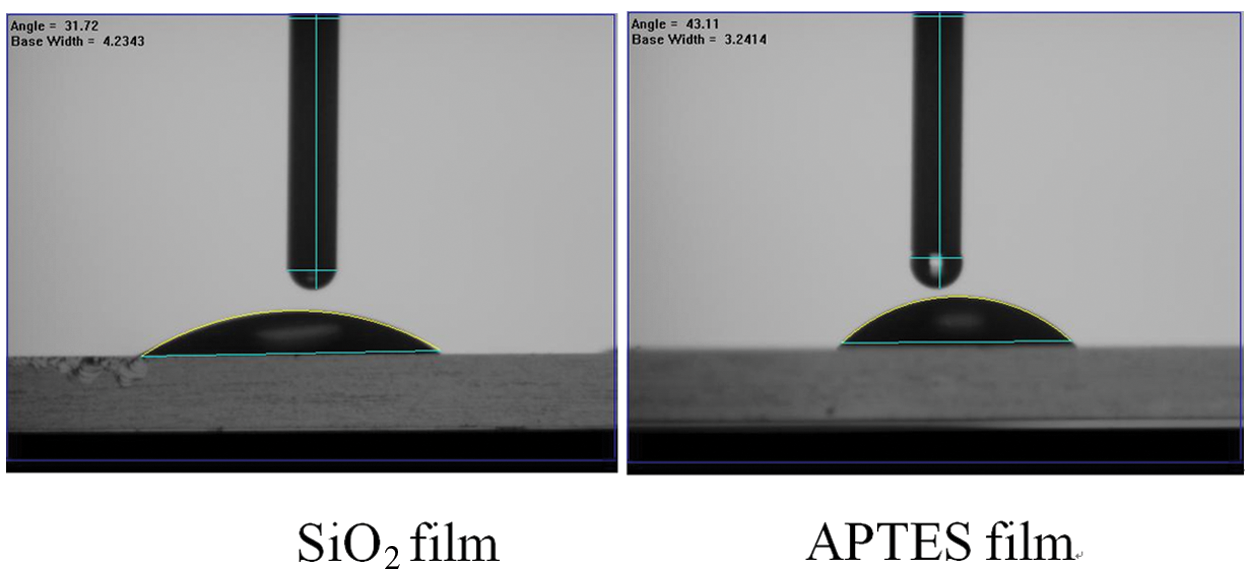
Contact angles of a water drop on a SiO2 film and an APTES film.
Antibody-Antigen Selective Recognition by SH-SAW Sensor
Jurkat cells (cell marker, CD3) were grown in RPMI1640 supplemented with FBS (10%, 37 °C) in a CO2 (5%) humidified incubator. Because of their highly lipophilic nature, CM-TMR (red) and CM-FDA (green) carbocyanine dyes were used for cellular labeling in aqueous culture media; Jurkat cells were labeled red, and K562 cells were labeled green. The cell isolation and purification targeted Jurkat cells as a model for rare cells (1:1000, 106 cells/mL), with the ultimate goal of targeting even more dilute cells. T cells were separated on the chip from the mixed-cell medium (Jurkat cells/K562 cells, 1/1000). Figure 7 demonstrates that most fluorescence spots captured by stained cells on the CD3 antibody were clearly identified as Jurkat cells.
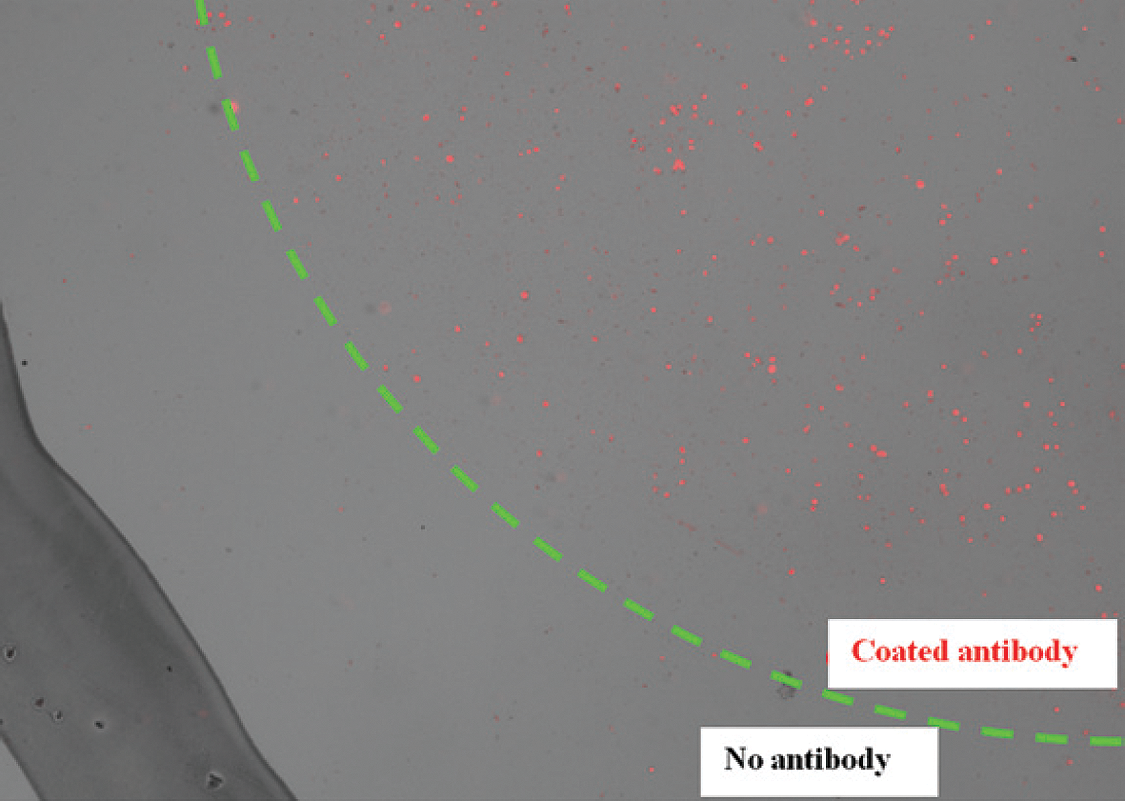
Fluorescence images of captured cells from the mixed-cell suspension; Jurkat cells (upper-right region within dash line area) and K562 cells (lower-left region outside dash line).
A conventional approach for immunoassay is to bind the antibody to the substrate and then detect the antigen by specific binding. In initial experiments using a silanized SAW, a CD3 antibody was coated onto one channel of the SAW; both channels were then blocked and exposed to a mixed-cell medium (Jurkat cells/K562 cells, 1/1000) at a concentration of 106 cells/mL. A peristaltic pump drove experiments to ensure continuous flow of fluids, and samples were circulated. There was an initial frequency on the dual SAW channel, to which response frequencies were generally stable after 10 min. The estimated noise for typical measurements of the difference frequency was 50 Hz. When the frequencies of the dual SAW channel were stable, the mixed-cell media were infused into the liquid microchambers in order. In all experiments, the electric and mechanical characteristics of the sensors vary according to the absorptive capacity of the active sensing region, resulting in a frequency shift. In the liquid microchamber, the frequency response following antibodies captured target cells onto the sensor surface.
A typical response for the ratio of the difference frequency during the addition of target cells is shown in Figure 8 . In this experiment, the control sensor (no antibody) was constant following stabilization. Cell capture is a complicated mechanism involving varied processes. Three steps were involved in testing the captured cells.
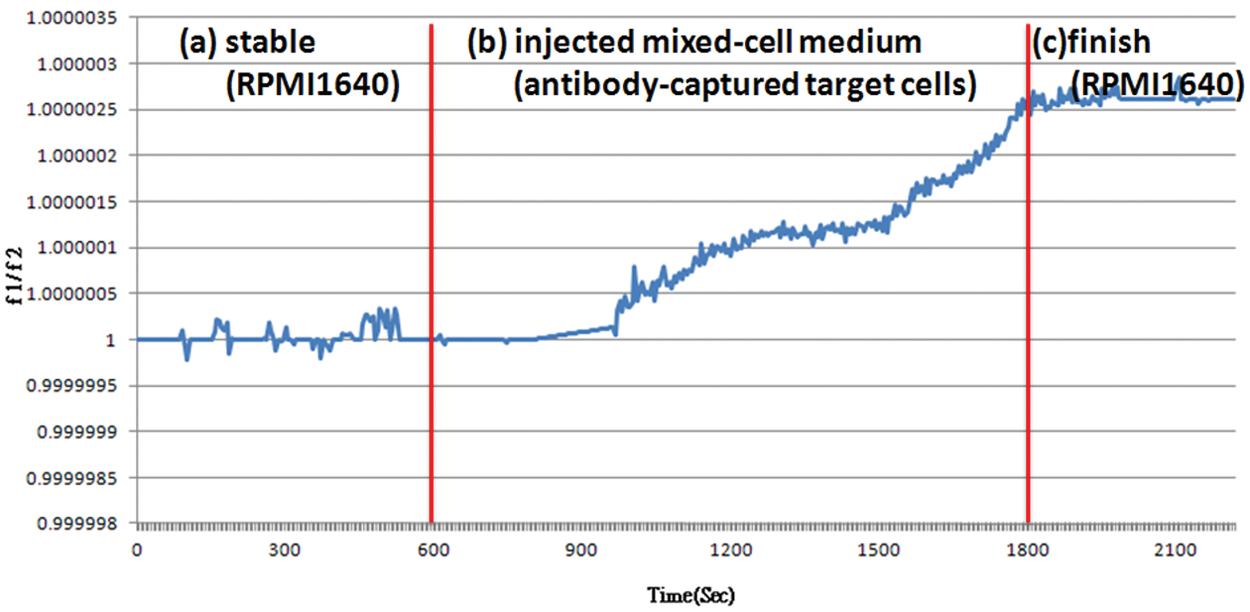
Ratio of frequency shifts’ (Δf1/Δf2, no antibody or antibody-coated) detection of Jurkat cells. (
In general, cells were captured within 10 to 15 min. The frequency gradually decreased after the cells were captured. The initial frequency, marked f0, was measured. The frequency (fi) of the chip after immunoassay was then measured. The frequency shifts (Δf = f0 – fi ) differed between no antibody (Δf1) and CD3-coated antibody (Δf2) of sensors. The frequency shift of the CD3-coated antibody (Δf2) decreased; the ratio of the frequency shifts (Δf1/Δf2) was greater than 1. It increased because the mass of the captured Jurkat cells increased. The frequency shift Δf2 of the chip after immunoassay was 280 Hz, and the ratio Δf1/Δf2 of the frequency shifts was 1.0000028.
Conclusion
We applied a network analyzer to measure the frequency and insertion loss of fabricated SAW devices on PCB at −40 dB, 121.3 MHz. An SiO2 layer (thickness 4.0 µm) was used on both the IDT and the sensing area. The SiO2 waveguide used in these devices is readily functionalized with APTES SAM. The APTES-coated films exhibited larger contact angles than the SiO2 film did. To prevent liquid immersion from the IDT (highly conducting aqueous solutions) due to flow through the cell, a rubber seal was pressed against the surface of the sensor. This action ensured that the liquid was in contact with only the sensitive area between the IDT. Antibodies were coated onto silanized SAW surfaces, and the frequency response following antibodies captured by the target cells was measured. The greatest sensitivity of detection, 103 cells/mL, was achieved with a silanized SAW when Jurkat cells were delivered into liquid microchambers in liquid (1 mL). In this experiment, we detected the target cells by coating them onto the surface of the SAW followed by binding to a specific antibody. Jurkat cells and K562 cells served as a model to demonstrate that cells of two types were detectable with a SAW sensor in 15 min. With appropriate antibodies, the SAW can detect target cells of interest. Δf2 decreased, and the ratio Δf1/Δf2 of frequency shifts was greater than 1. The frequency shift of the chip after immunoassay was 280 Hz, and the ratio of the frequency shifts was 1.0000028. This limit of detection is superior to that achieved with the conventional method (antibody applied first). We believe that this improvement is related to strong absorption of the Jurkat cells on the SAW surface. Of two possible applications for this technology, one is for a measurement in real time of systems that are clean and that can be detected quickly, and the other would involve forgoing the rapidity to produce a sensor that has an enrichment step but detects organisms in a range of concern from an originally smaller level of contamination.
Footnotes
Acknowledgements
The authors thank the fabrication support from Professor Fangang Tseng’s group, National Tsing Hua University, Taiwan.
Declaration of Conflicting Interests
The authors declared no potential conflicts of interest with respect to the research, authorship, and/or publication of this article.
Funding
The authors received funding support for the research from the National Science Council, Taiwan, NSC 100-2220-E-007-008 and NSC 100 2218-E-007-004.