
Abstract
Study Design
Retrospective observational study.
Objective
To investigate the effects of body mass index (BMI), age, and sex on the occurrence of hip and vertebral fractures in the South Korean population.
Methods
We enrolled participants who underwent routine health screenings conducted by the Korean National Health Insurance Service in 2009 and followed up from 2010 to 2018. Cox proportional analyses assessed the hazard ratios for hip and vertebral fractures compared to individuals with a normal BMI.
Results
A total of 2,515,078 individuals were included in this analysis, the mean age was 53.8 years, and 50.1% were men. Low BMI emerged as a risk factor for both hip and vertebral fractures, with a stronger association observed for hip fractures (P < 0.01). Hip fracture incidence decreased with increasing BMI in all patients. However, compared to the normal BMI group, the incidence of vertebral fractures in patients under 65 years was 10.4%, 12.8%, and 24.1% higher in the underweight, obese I, and obese II groups, respectively (P < 0.001) and that of women, 4.4%, 4.1%, 9%, and 13.4% higher in the underweight, overweight, obese I, and obese II groups, respectively (P < 0.001).
Conclusions
Our findings showed that regardless of sex and age, higher BMI consistently correlates with a lower risk of hip fractures. However, elevated BMI may increase the risk of vertebral fractures in women and those under 65 years. This study underscores the complexity of the relationship between BMI and fracture risks, highlighting the necessity for specific guidelines to mitigate fracture risks across diverse populations.
Keywords
Introduction
Hip and vertebral fractures significantly impact the quality of life in older adults. 1 Various risk factors, including age, sex, smoking, excessive alcohol consumption, low bone mineral density, family history, lack of physical activity, low calcium and vitamin D diet, and prolonged corticosteroid use have been identified as influencing the occurrence of fragility fractures.2-5
Low body weight often accompanies sarcopenia and osteoporosis, increasing the risk of fragile fractures.6-8 However, the effect of being overweight on fracture occurrence remains controversial.9-12 Research has shown that individuals with higher body weights had a lower risk of fractures due to the protective effect of increased mechanical loading on bones.6,9,10 In contrast, a recent meta-analysis study has suggested that compared with non-obese postmenopausal women, obese postmenopausal women had an 18% increased risk for all fractures, a 15.4% increased risk for vertebral fractures, whereas a 42.5% reduced risk for pelvic fractures, respectively, showing different effects depending on the body region. 13
Body mass index (BMI) is one of the useful predictors of fragile fractures; however, it has limitations such as classifying individuals with relatively high muscle mass as having a higher BMI.14,15 While being underweight is generally associated with an increased risk of fractures, it remains unclear if this holds regardless of age and sex or varies depending on the specific fracture site. Understanding the relationship between BMI and hip and vertebral fractures is crucial for developing personalized medicine to minimize the risk of fractures. Therefore, this study aimed to evaluate the regional association between BMI and hip and vertebral fractures in men and women using a nationwide population-based database in South Korea. We hypothesized that BMI, reflecting age and sex, would have varying effects on hip and vertebral fractures.
Materials and Methods
This study was approved by the Institutional Review Board of Korea University Ansan Hospital (approval number: K2021-2601-001) and the National Health Insurance Service (NHIS) review board. Given that the data analysis was conducted retrospectively using de-identified data obtained from the NHIS database in Korea, the need for informed consent was waived. All research procedures were conducted in compliance with relevant regulations and guidelines, and the study adhered to the principles outlined in the Declaration of Helsinki. 16
A nationwide population-based analysis was conducted using data from the NHIS database in South Korea. The NHIS covers nearly the entire South Korean population, with approximately 99% of the population enrolled in the mandatory national health insurance system. Also, the NHIS conducts regular health examinations every 1-2 years for adults over 40 years of age or workers over 20 years of age including self-reported questionnaires that capture information such as physical measurements, alcohol intake, smoking status, and medical history. These data were verified through physician interviews. Additionally, laboratory data, including complete blood count, electrolytes, serum glucose, liver and kidney function tests, and thyroid function tests, were collected after a minimum of an 8-hour fasting period. The NHIS claims database contains comprehensive health information on over 50,000,000 Koreans, including data on diagnoses, complications, demographic characteristics, prescription medications, health care services, and in- and outpatient costs according to the International Classification of Diseases, 10th Revision (ICD-10). Since 2015, the NHIS has made this retrospective cohort database available to all researchers whose research protocols have been approved by an official review committee. All data within the database were anonymized, regularly collected, and subjected to quality control.
The inclusion criteria were adults aged over 40 years who underwent health examinations in 2009. Exclusion criteria encompassed individuals with multiple traumas or without baseline characteristic data, those with a history of fractures before registration, or those who experienced a fracture within 1 year. Multiple traumas were defined as individuals who simultaneously had an S code that was not registered in the definition of event. BMI was calculated by dividing weight (kg) by height squared (m2). The included participants were categorized into five groups based on the adult Asian classification of obesity by the World Health Organization: underweight (BMI < 18.5), normal weight (18.5 ≤ BMI < 22.99), overweight (23 < BMI ≤ 24.99), obese I (25 ≤ BMI < 30), and obesity II (30 ≤ BMI). 17
Definition of Event
ICD-10 codes and hospitalization records from the NHIS database were extracted to identify and register all fracture cases. Fractures were defined using specific ICD-10 codes as follows: vertebral fractures (S12.0, S12.1, S12.2, S22.0, S22.1, S32.0, M48.4, and M48.5), hip fractures (S72.0, S72.1, and S72.2), upper arm fractures (S42.0, S42.2, and S42.3), forearm fractures (S52.5, and S52.6), and lower extremity fractures (S82.3, S82.5, and S82.6). A fracture diagnosis was established if an individual had either one hospitalization or two or more outpatient visits within 1 year, with the corresponding ICD-10 code confirmed through a review of NHIS medical records spanning from January 1, 2010, to December 31, 2018. Participants who passed away during the follow-up period were censored at the time of death.
Definition of Covariates
Participants were categorized based on smoking status into non-smokers, ex-smokers, or current smokers, and according to alcohol consumption as non-drinkers, mild drinkers (man ≤8 drinks, woman≤4 drinks, 1 drink = 14g alcohol) or heavy drinkers (man>8 drinks, woman>4 drinks). Diabetes mellitus, hypertension, and dyslipidemia were determined by blood sugar levels exceeding 126 mg/dL, a mean blood pressure ≥140/90 mmHg, and total cholesterol levels ≥240 mg/dL, respectively. Additionally, individuals who were prescribed antidiabetic (E11 – E14), antihypertensive medications (I10 – I13 or I15), or antihyperlipidemic medications (E78) more than once a year were classified accordingly. Chronic kidney disease was defined as an estimated glomerular filtration rate below 60 mL/min/1.73 m2. The definition of comorbidities used in this analysis was validated based on previously published studies.8,12
Statistical Analysis
Statistical analyses were performed using the chi-square test for categorical variables and analysis of variance for continuous variables. The incidence of fracture rate was calculated by dividing the number of fractures per 1000 person-years by the total number of fractures. Cox regression analysis was utilized to calculate the 95% confidence intervals and hazard ratios for fractures were calculated based on BMI. Sensitivity tests were conducted using hierarchical models with varying levels of demographic and socioeconomic factors and comorbidities, reflecting potential covariates influencing the risk of fracture. In Model 1, no covariate adjustments were made, whereas in Model 2, adjustments were made for age and sex. Model 3 was further adjusted for factors such as alcohol consumption, smoking status, low income, and regular exercise. Lastly, Model 4 represented a fully adjusted model incorporating comorbidities such as diabetes, hypertension, dyslipidemia, and chronic kidney disease. The cumulative fracture incidence rates were compared between groups using the Kaplan-Meier method. Hazard ratios for fractures in various subgroups were determined using Cox proportional hazards regression, with critical P-values for interaction assessed. Stratified subgroup analyses were conducted based on age and sex.
Results
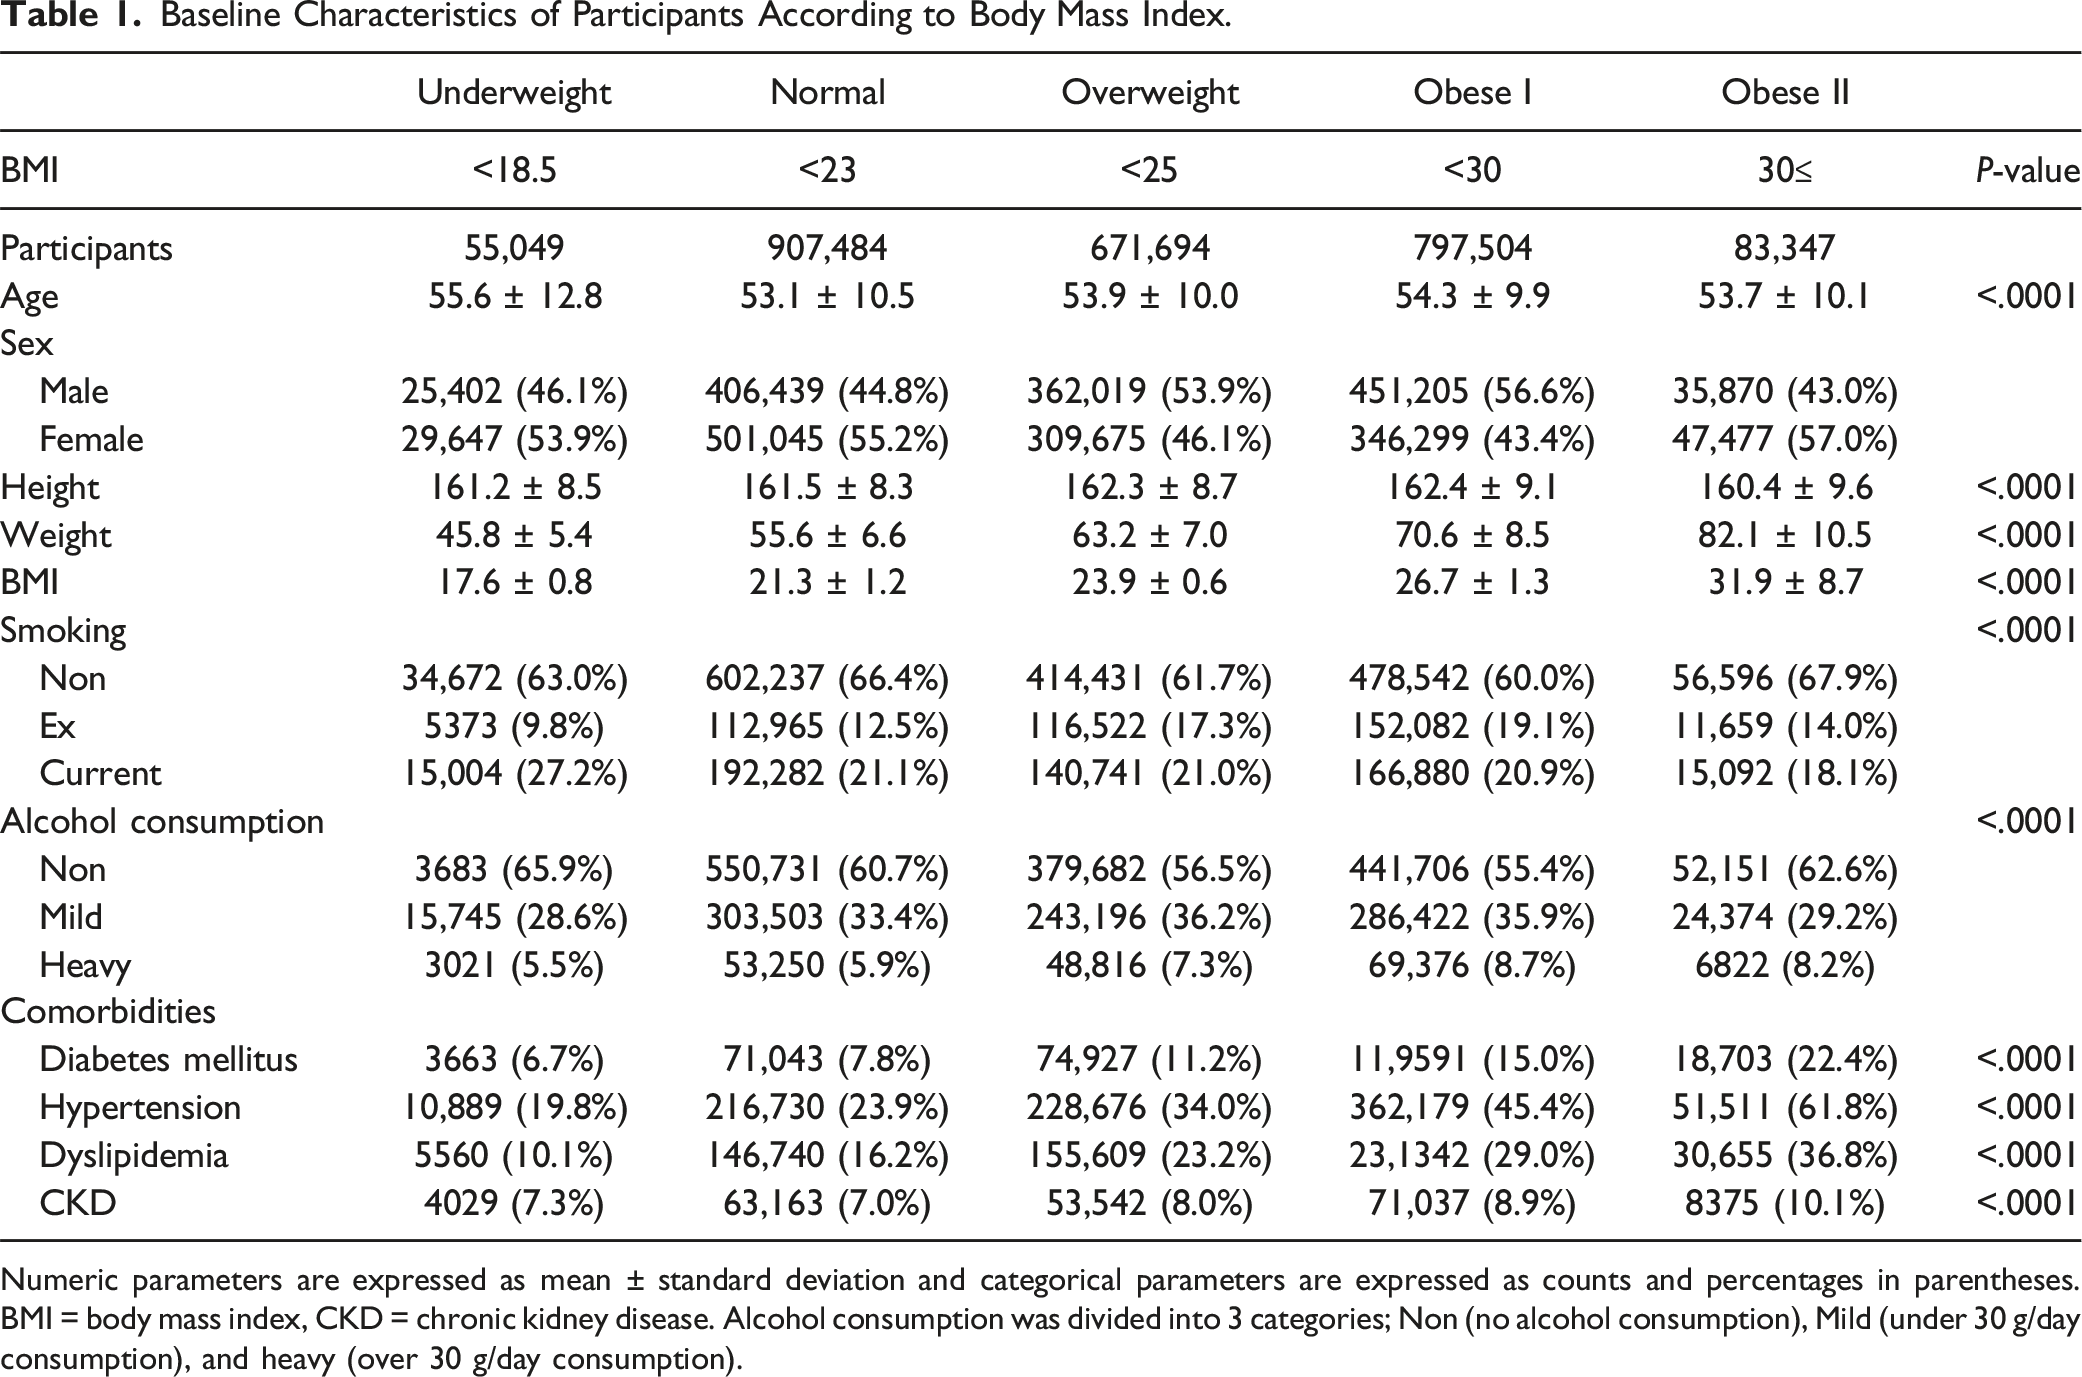
This study comprised 4,200,037 participants, representing 40% of those randomly selected for general health examinations in 2009. Among these, 1,338,019 participants under the age of 40 and 102,612 with missing baseline characteristics or covariates were excluded. Additionally, 244,328 individuals were excluded due to wash-out data, defined as experiencing a fracture within 1 year of the index year. Ultimately, 2,515,078 participants (with a male-to-female ratio of 50.9:49.1) were included in the final analysis (Figure 1). Table 1 presents the characteristics of the participants. The mean age was 53.8 years, with men accounting for 50.1%, and the average BMI was 24.0. Specifically, 2.2% (55,049) of patients were classified as underweight, 36% (907,484) as having a normal BMI, 26.7% (671,694) as overweight, 31.7% (797,504) as obese I, and 3.3% (83,347) as obese II (Table 1). Over the follow-up period, the overall incidence rates for vertebral and hip fractures were calculated as 27.12 and 7.18 per 1000 participants, respectively. Flowchart illustrating the inclusion and exclusion criteria for the study population. Baseline Characteristics of Participants According to Body Mass Index. Numeric parameters are expressed as mean ± standard deviation and categorical parameters are expressed as counts and percentages in parentheses. BMI = body mass index, CKD = chronic kidney disease. Alcohol consumption was divided into 3 categories; Non (no alcohol consumption), Mild (under 30 g/day consumption), and heavy (over 30 g/day consumption).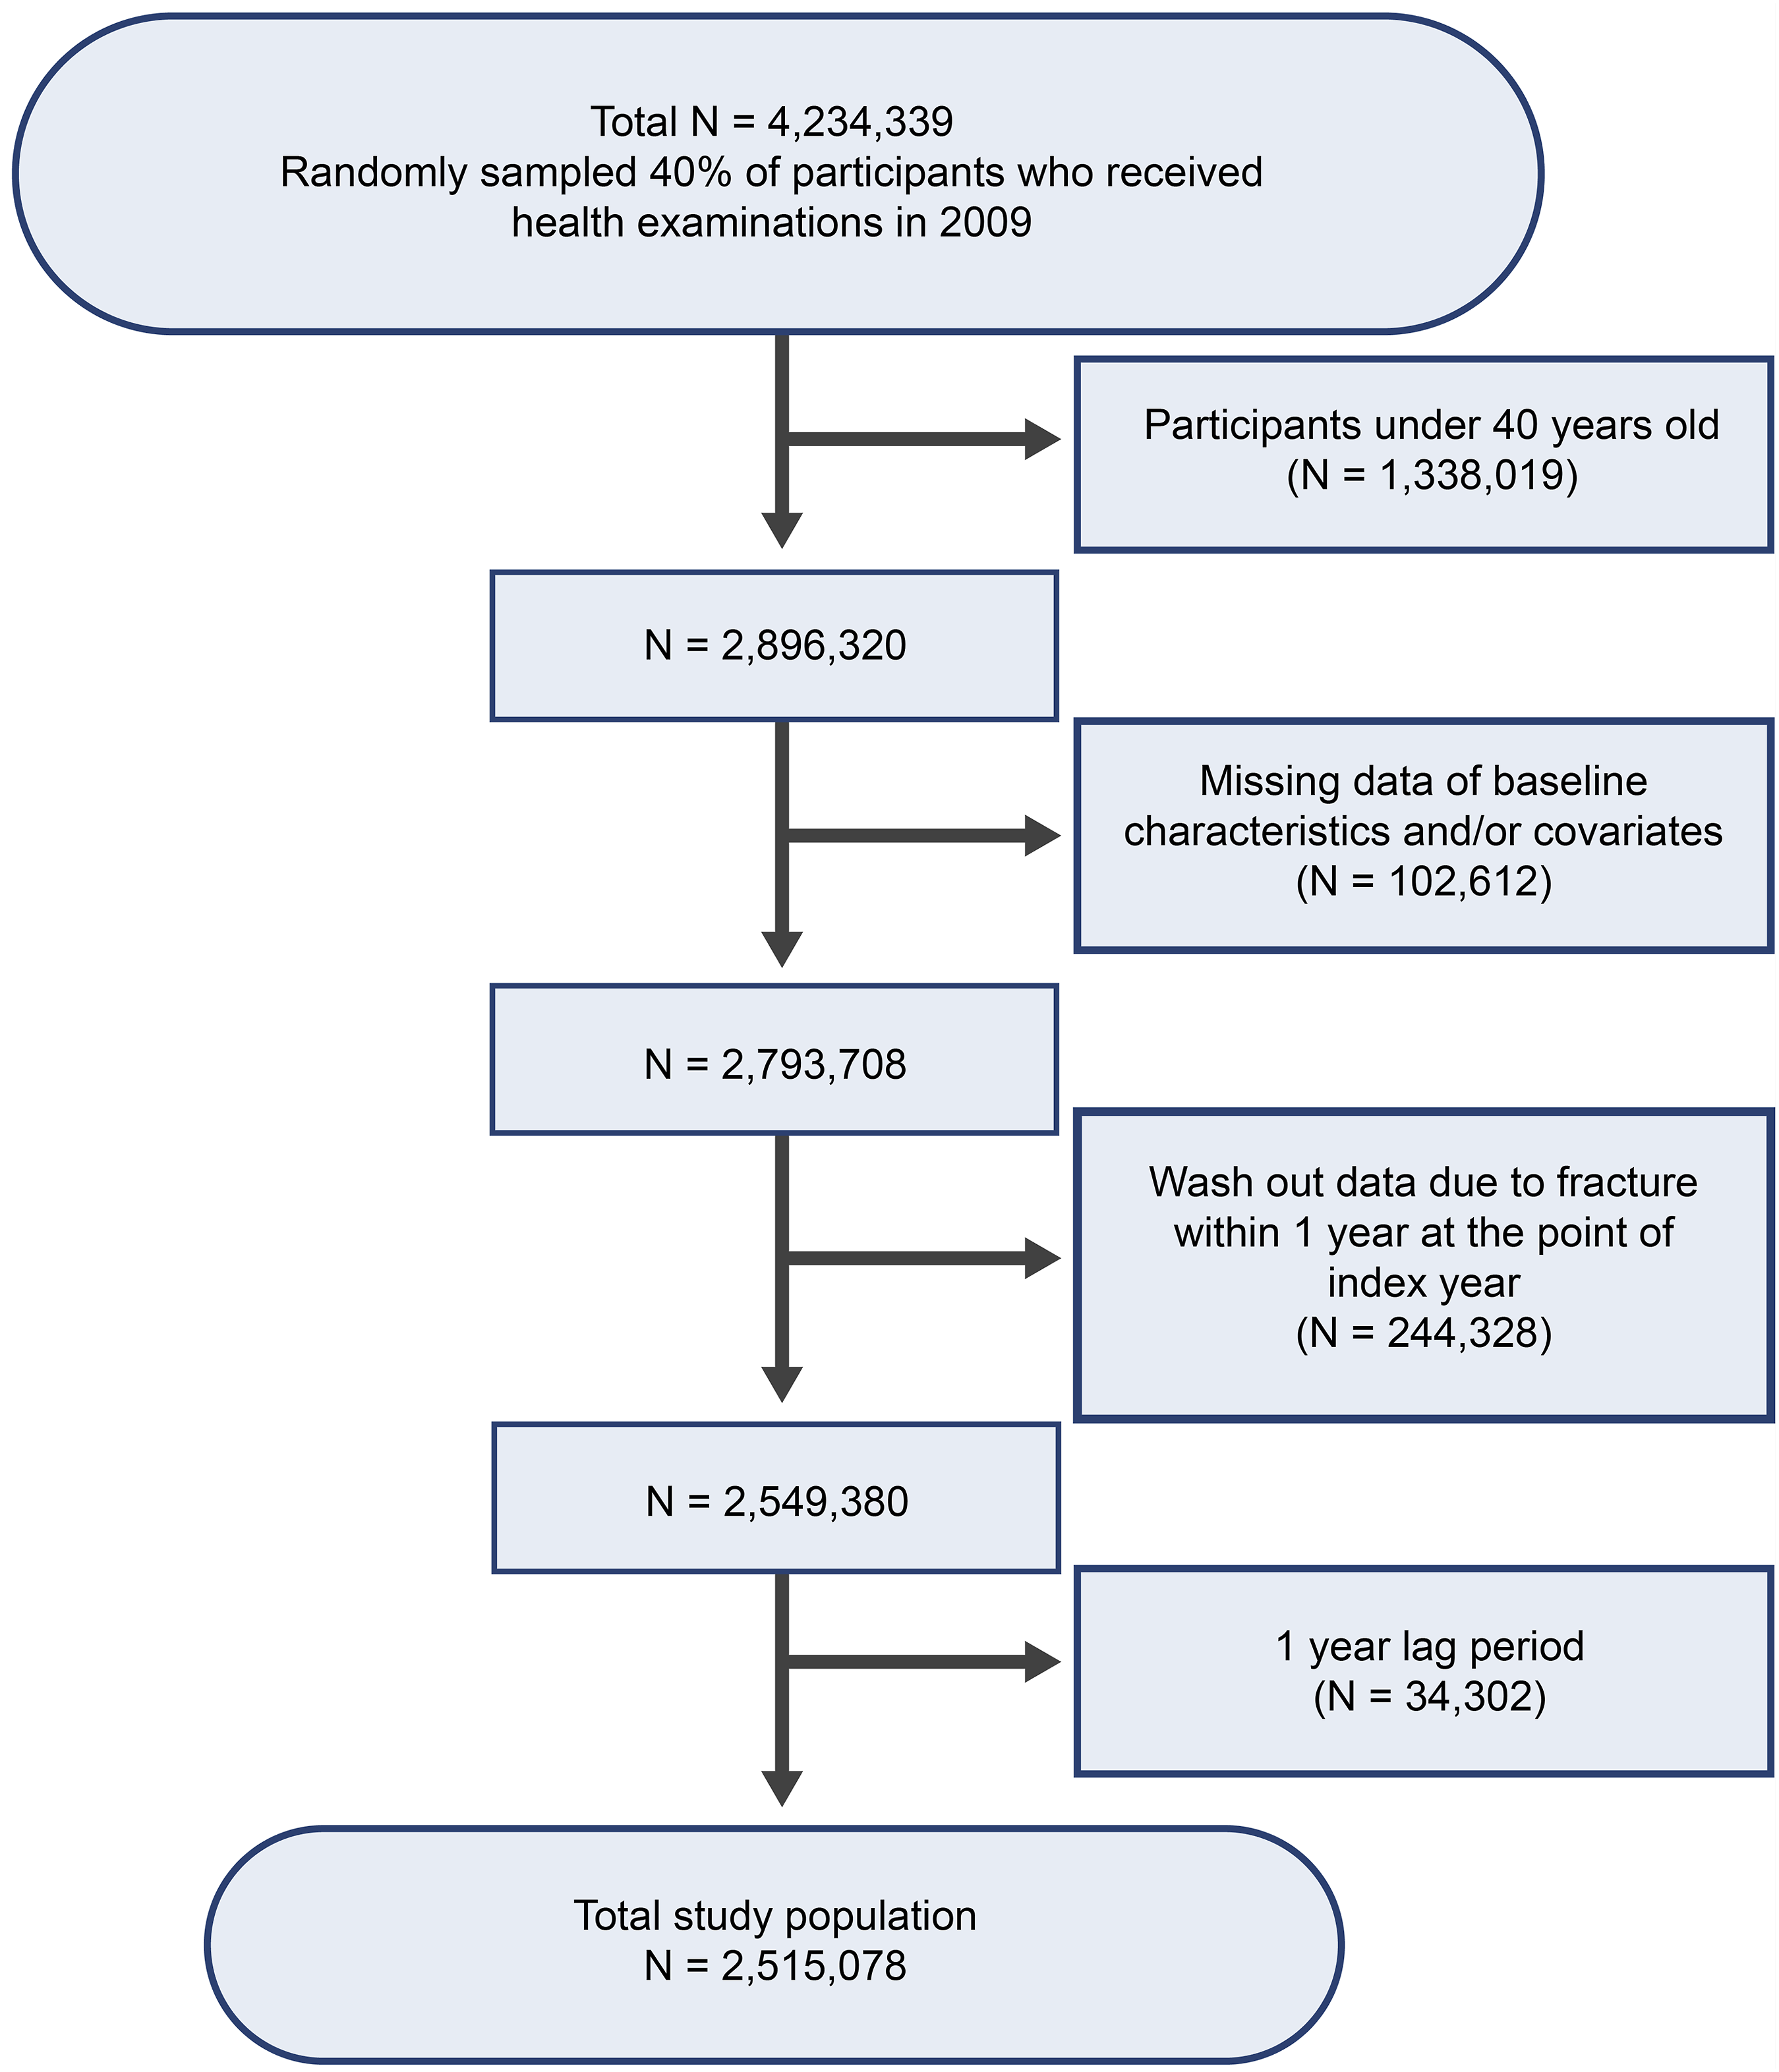
In Model 4, which accounted for all confounding factors, distinct patterns in fracture incidence emerged between the hip and vertebral fractures. While overall fractures tended to decrease with increasing BMI, vertebral fractures exhibited the lower incidence among those classified as normal and overweight, with higher incidences observed both the underweight and obese I and II groups (Figure 2, Table 2, P < 0.001). Kaplan–Meier survival curves depicting vertebral and hip fractures based on body mass index (BMI). A low BMI was associated with a higher risk of overall fractures in a model adjusted for all comorbidities. The relative risk of fracture was notably higher for hip fractures compared to vertebral fractures. The Risk of Overall, Vertebral, and Hip Fracture According to Body Mass Index Using Cox Regression Analysis. BMI represents body mass index; IR, incidence rate; HR, hazard ratio; 95% CI, 95% confidence interval. Incidence rate is defined as incidence rate per 1000 person-year. Model 1 was non-adjusted; Model 2 was adjusted by age, and sex; Model 3 was adjusted by age, sex, and other environmental factors such as smoke, alcohol consumption, physical activity, household income; Model 4 was fully adjusted by age, sex, other environmental factors (smoke, alcohol consumption, physical activity, household income), and comorbidities (diabetes, hypertension, dyslipidemia, chronic kidney disease).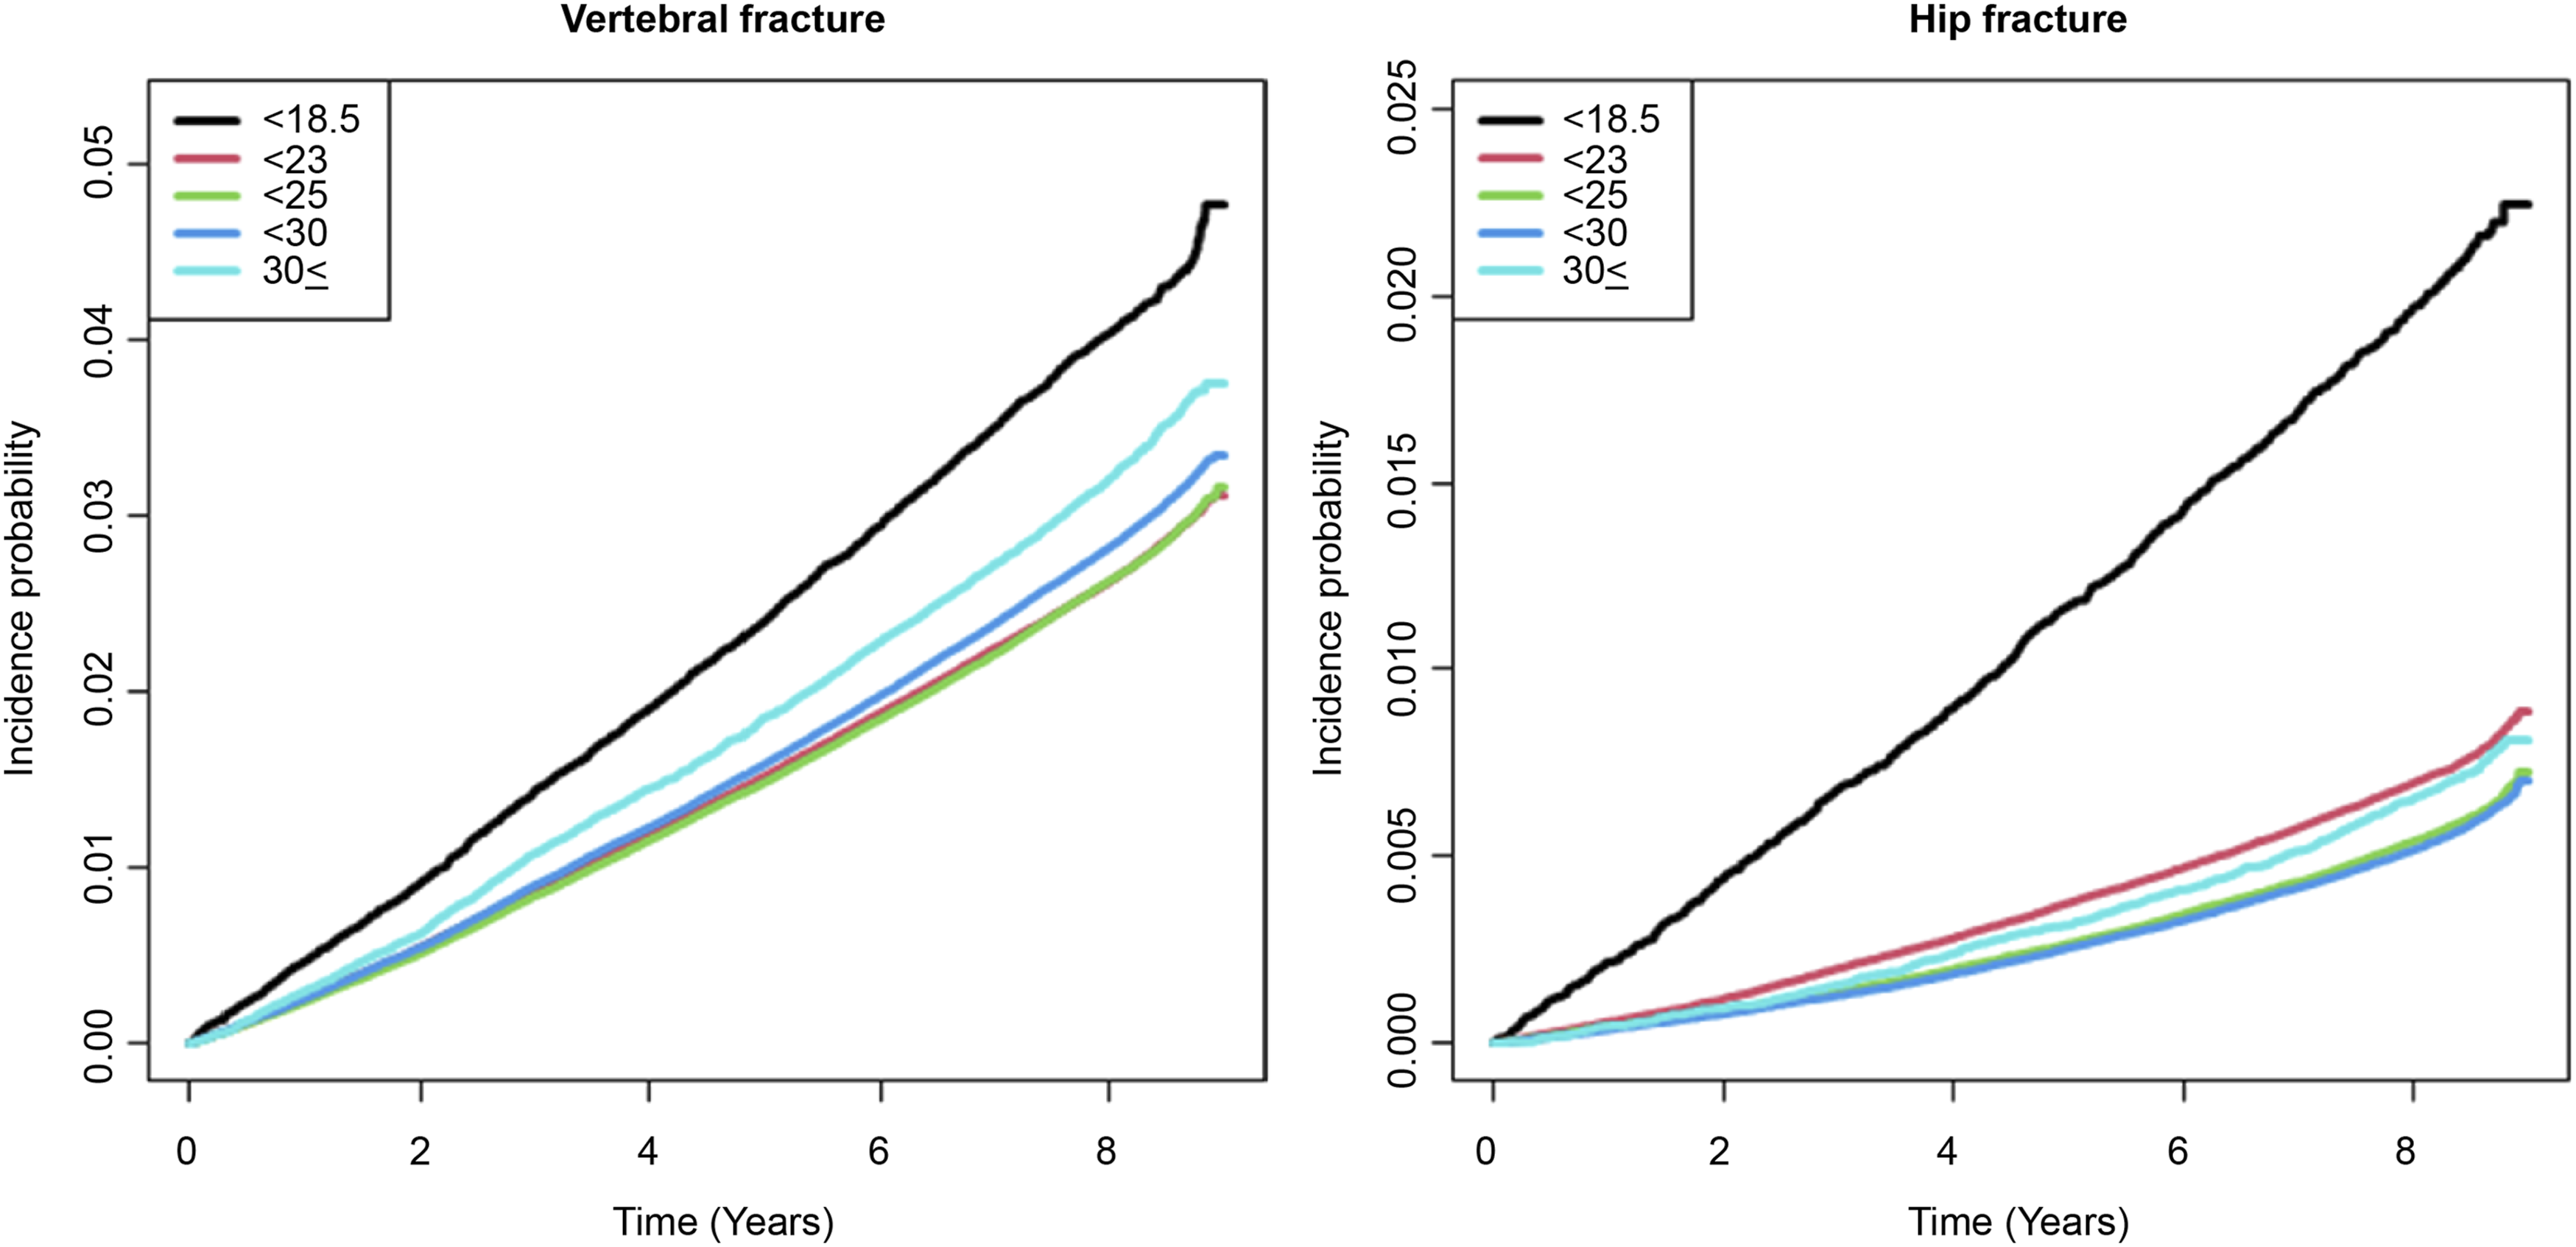
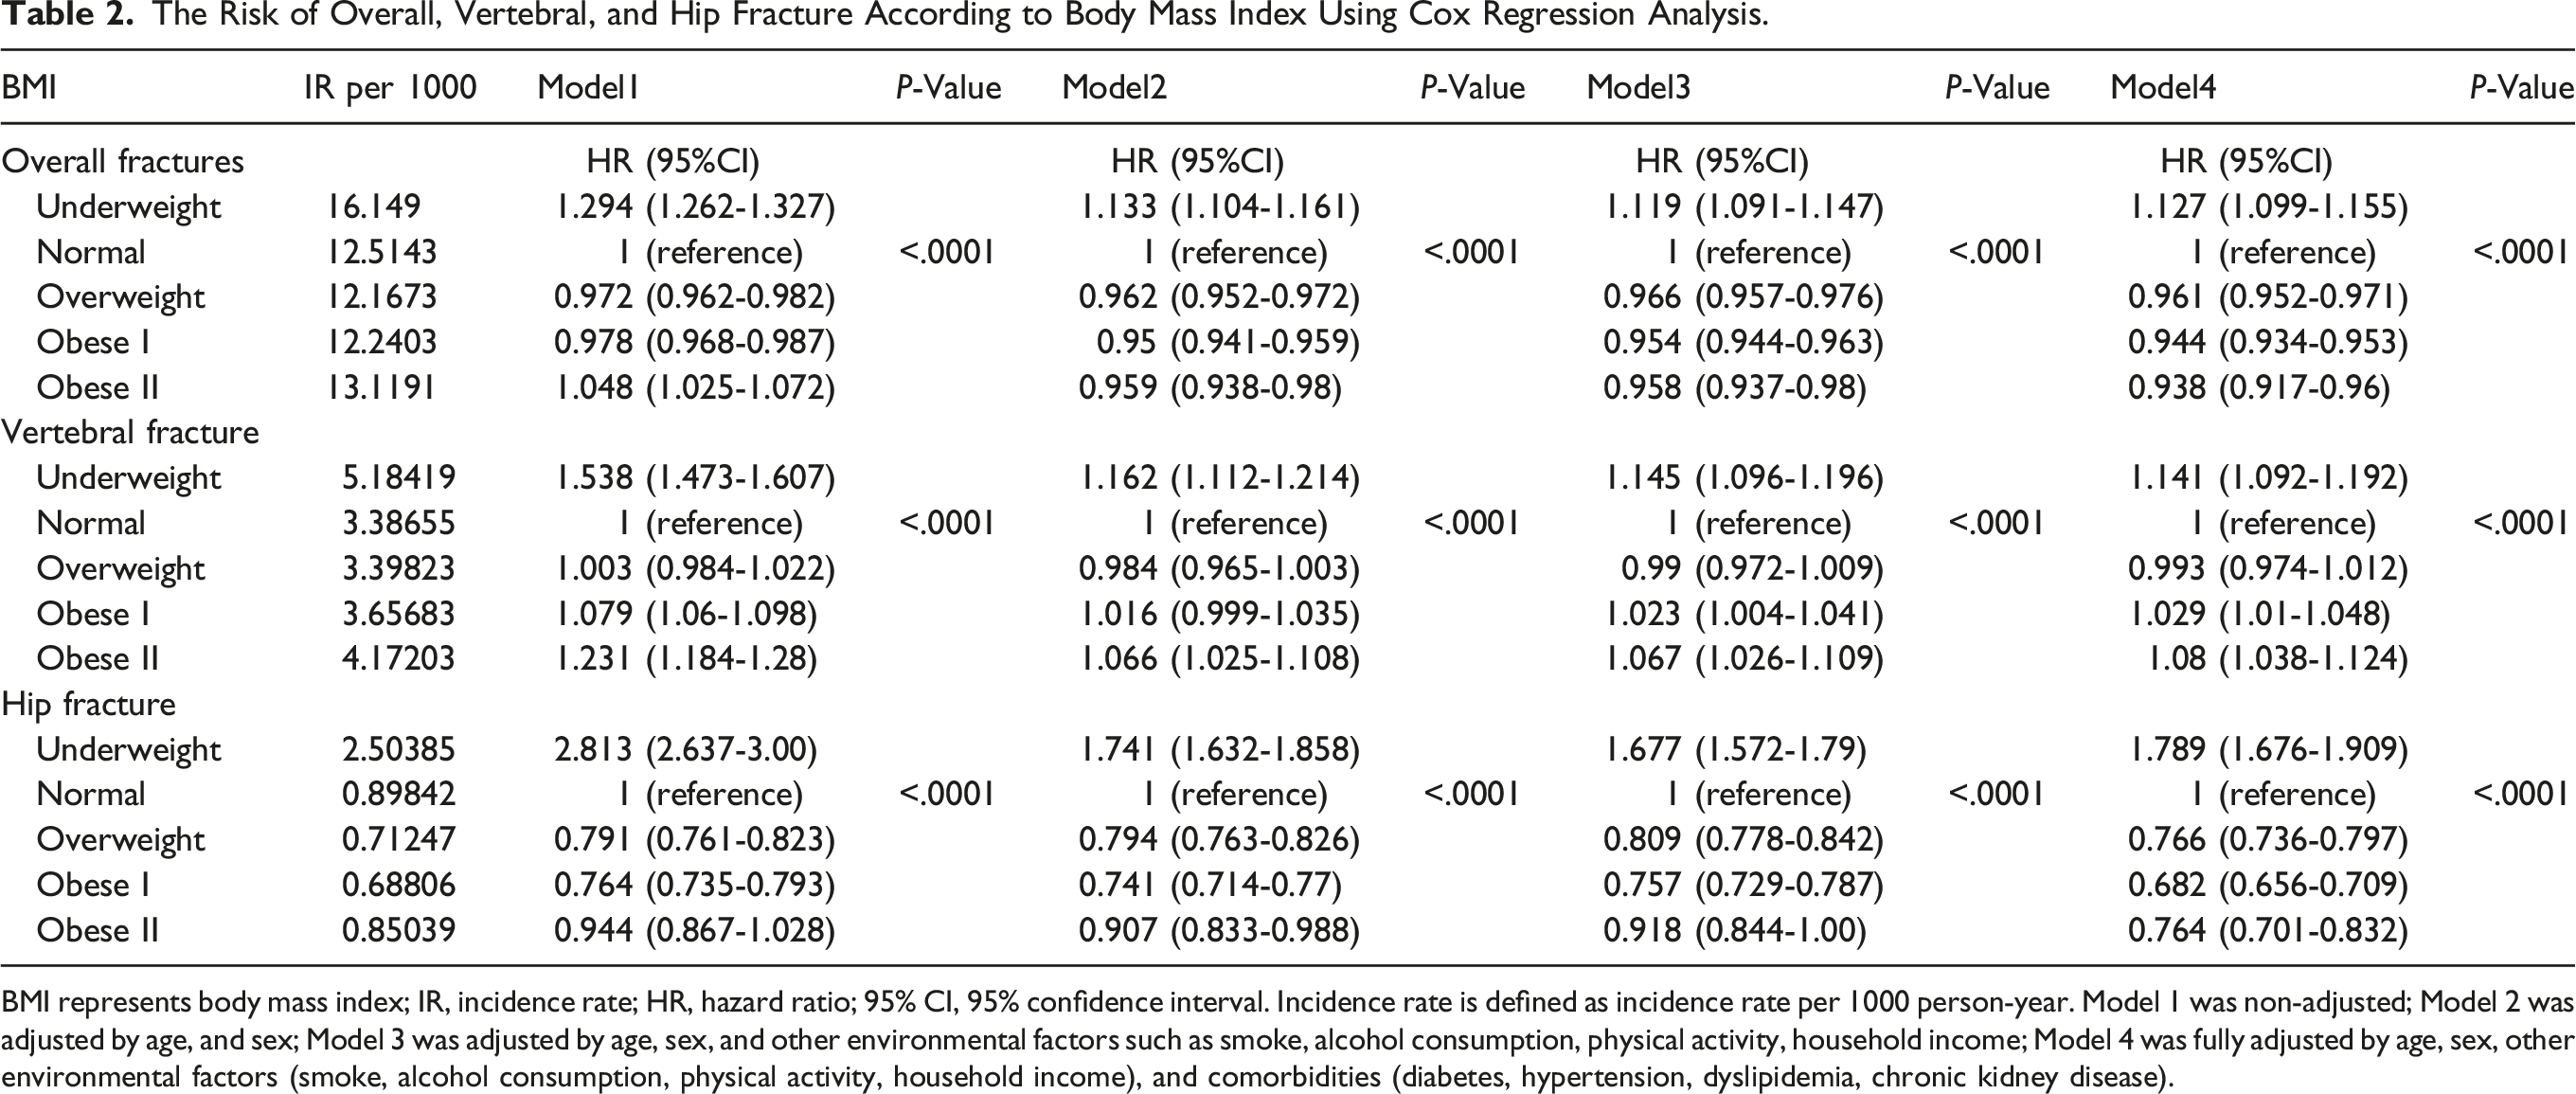
Compared to individuals with a normal BMI, the incidence of overall fractures was 12.7% higher in the underweight group and 3.9%, 5.6%, and 6.2% lower in the overweight, obese I, and obese II groups, respectively (P < 0.001). The incidence of hip fractures was 78.9% higher in the underweight group compared to those with a normal BMI, while it was 23.4%, 31.8%, and 23.6% lower in the overweight, obese I, and obese II groups, respectively (P < 0.001). However, there were no significant differences in the incidence of vertebral fractures between individuals with a normal BMI and those who were overweight; the incidence rates were 14.1%, 2.9%, and 8% higher in the underweight, obese I, and obese II groups, respectively (P < 0.001).
Subgroup Analysis-Vertebral Fracture
Subgroup Analysis of the Vertebral Fracture Risk According to Body Mass Index Using Cox Regression Analysis.
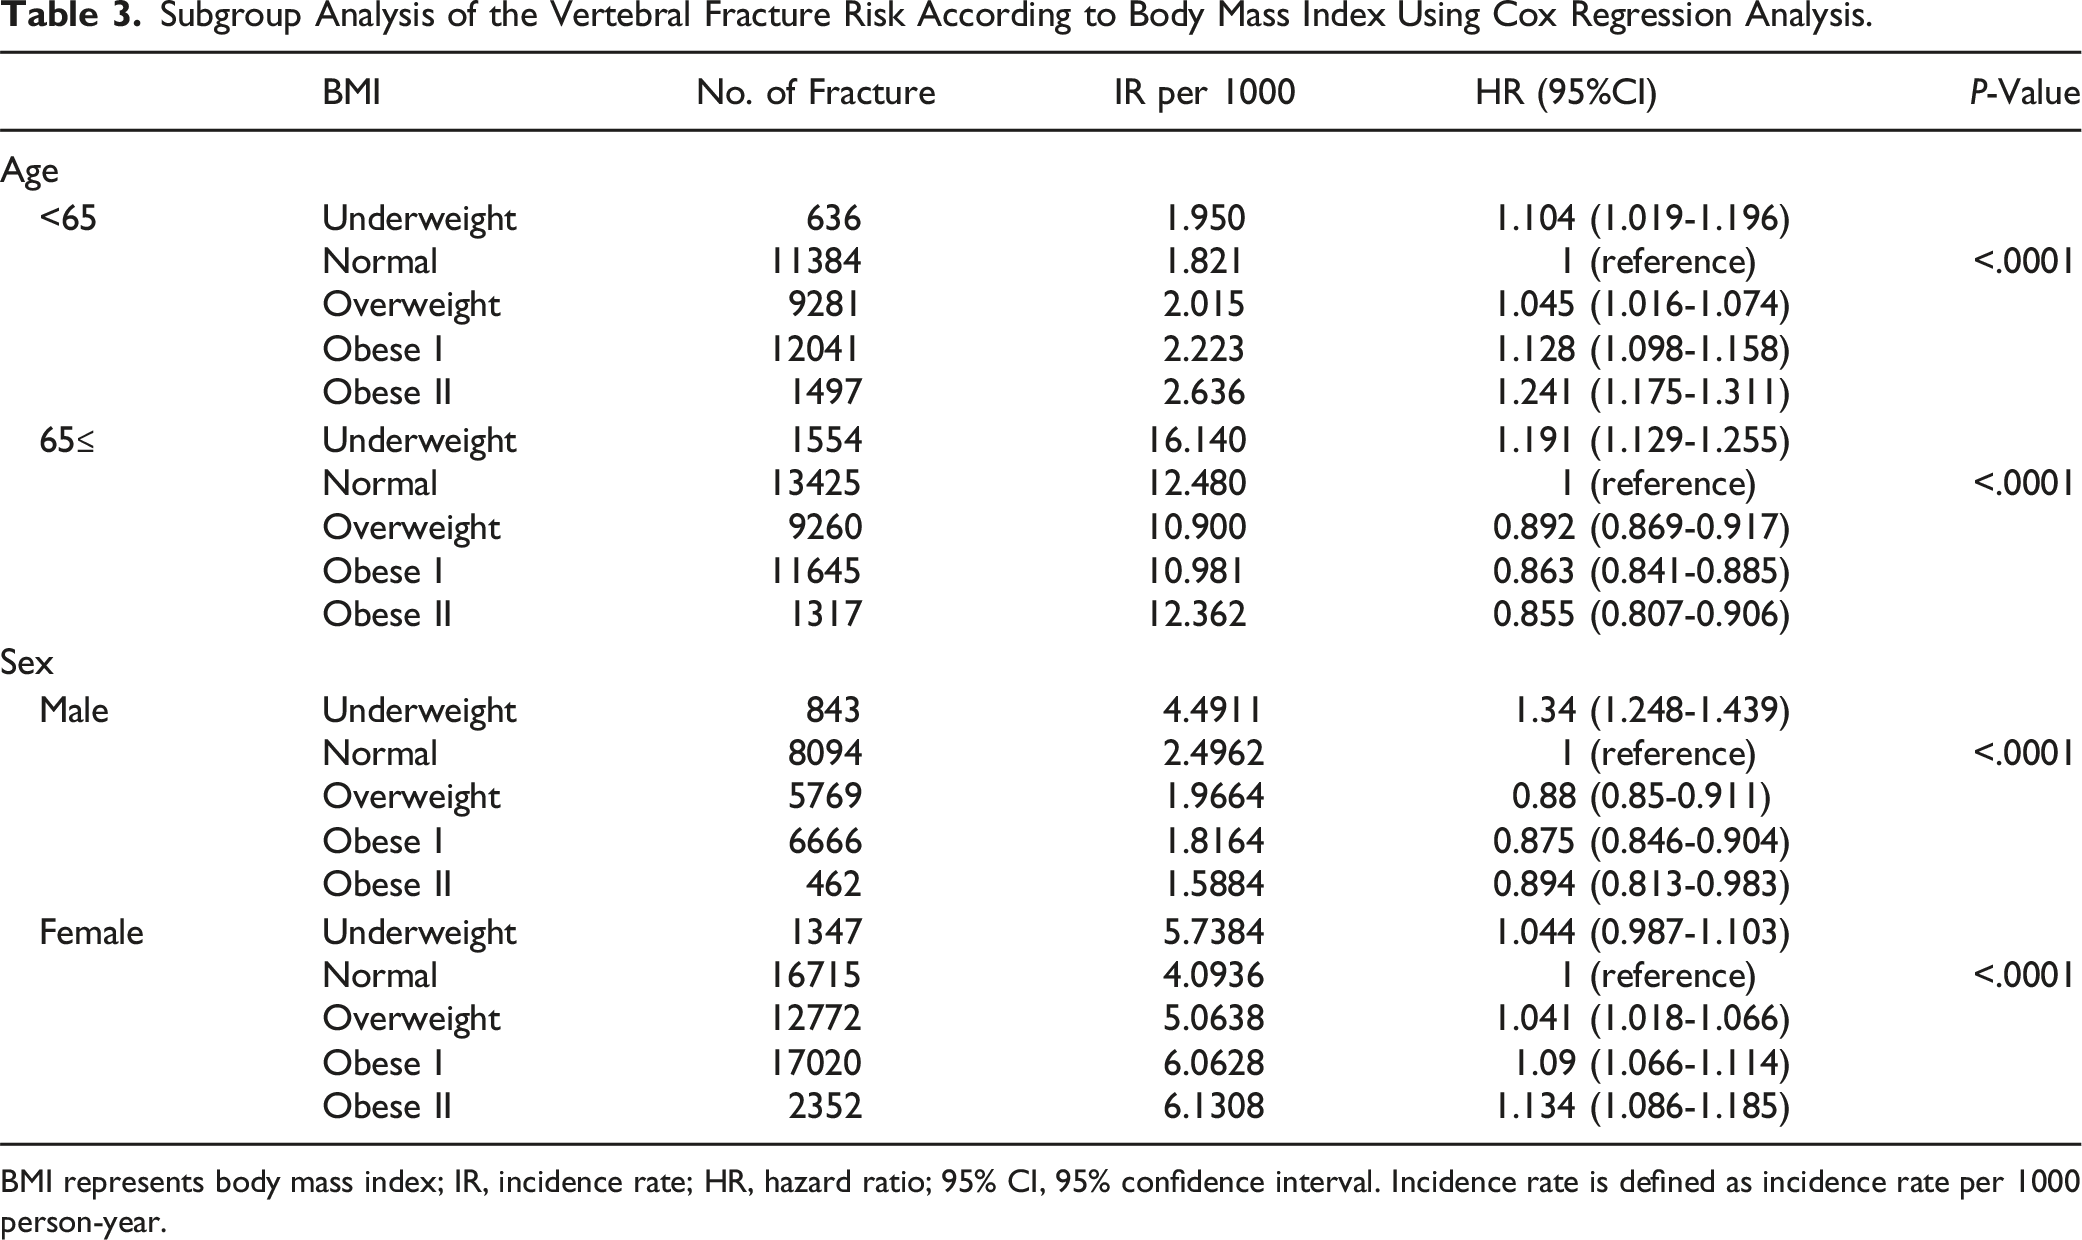
BMI represents body mass index; IR, incidence rate; HR, hazard ratio; 95% CI, 95% confidence interval. Incidence rate is defined as incidence rate per 1000 person-year.
However, among patients under 65 years of age or women, the incidence of vertebral fractures was lowest in the normal BMI and overweight groups, while it increased in both the low and high BMI groups (P < 0.001, Table 3). Compared to the normal BMI group, the incidence of vertebral fractures in patients under 65 years was 10.4%, 12.8%, and 24.1% higher in the underweight, obese I, and obese II groups, respectively (P < 0.001). In women, the incidence rates were 4.4%, 4.1%, 9%, and 13.4% higher in the underweight, overweight, obese I, and obese II groups, respectively (P < 0.001).
Subgroup Analysis-Hip Fracture
Subgroup Analysis of the Hip Fracture Risk According to Body Mass Index Using Cox Regression Analysis.
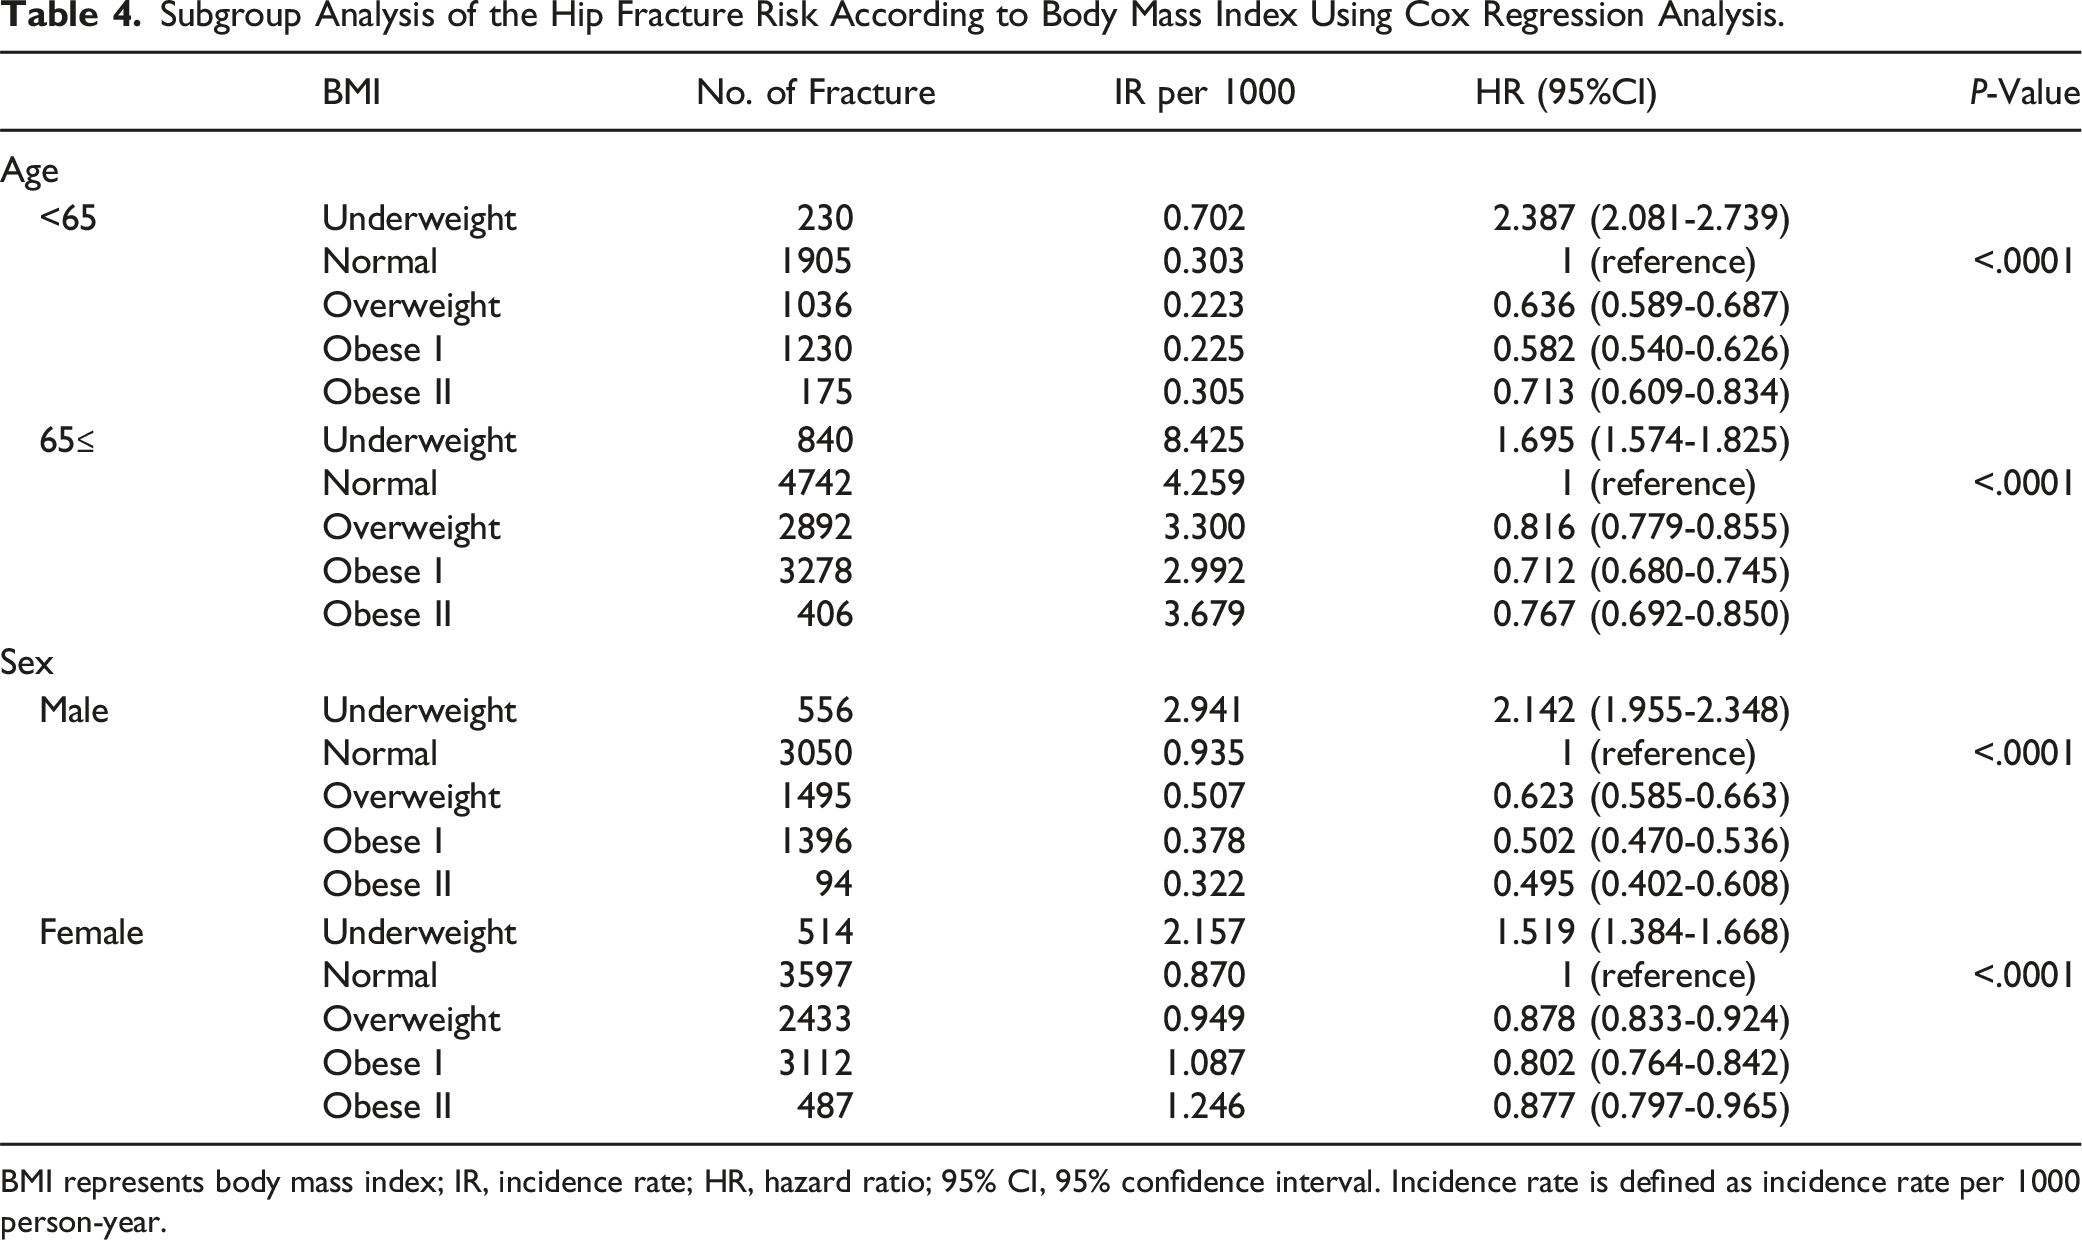
BMI represents body mass index; IR, incidence rate; HR, hazard ratio; 95% CI, 95% confidence interval. Incidence rate is defined as incidence rate per 1000 person-year.
Discussion
Several studies have highlighted that being underweight is a risk factor for the development of fractures.2,4,7,10,18,19 However, the effect of being overweight on fracture occurrence in specific regions remains controversial. 20 A meta-analysis of a large, globally recruited cohort indicated that lower BMI was associated with increased fracture risks across genders, with risk ratios per unit higher BMI as low as 0.98 for any fracture, 0.97 for osteoporotic fractures, and 0.93 for hip fractures. 19 Conversely, in another population-based study focusing on older men, higher BMI correlated with reduced risks of hip, spine, pelvis, and wrist/forearm fractures but increased risks of multiple rib fractures compared to normal or underweight men. 6 Also, recent meta-analysis reported that obese women had a 42.5% lower risk for pelvic fractures, however, a 15.4% higher risk for vertebral fractures, suggesting that BMI may show different fracture risks depending on the site. 13
In this study, a low BMI was associated with a higher risk of overall fractures after adjusting for all comorbidities. The risk of hip fractures was notably higher than that of vertebral fractures, with a stronger link between low BMI and hip fracture incidence observed regardless of age and sex. However, the relationship between BMI and vertebral fractures exhibited heterogeneity at a certain age group and gender. Especially, vertebral fractures had the lowest incidence in the normal BMI and overweight groups but showed higher incidences in both low and high BMI groups among women and individuals under 65 years old in this study. This suggests that although higher BMI had a linear protective effect against hip fractures, the relationship between BMI and vertebral fractures was not linear. Thus, high BMI might be a protective factor against fractures in old age, but it could also be a risk factor for vertebral fractures, especially among women and those under 65 years old.
According to Wolf’s law, increased load on a specific lesion prompts bone remodeling over time, enhancing its strength to resist the load. 21 Therefore, an increase in BMI results in increased load such as the hip joint, potentially leading to increased bone density in the femoral neck and head. However, the heterogeneous association between high BMI and vertebral fractures also warrants another consideration such as unique sagittal alignment and compensatory mechanisms. 22
The thoracolumbar junction is the most affected site for vertebral compression fractures.3,23,24 As spinal degenerative changes progress, the center of gravity of the trunk shifts forward due to increased thoracic kyphosis and decreased lumbar lordosis and sagittal realignment should compensate for this anterior gravity shifting.25-27 Representative compensations for spinal realignment include increased hip extension, knee flexion, and posterior pelvic tilt.28,29 Previous studies indicate that patients with obesity have limited pelvic compensatory mechanisms and exhibit global sagittal imbalance, characterized by a greater increase in the sagittal vertical axis.22,30,31 Consequently, patients with obesity experience higher compressive forces transmitted to the thoracolumbar region due to global sagittal imbalance, increasing the likelihood of vertebral fractures.
Interestingly, we observed a tendency for increased fracture incidence at higher BMI only in women and individuals under 65 years of age, while the incidence of vertebral fractures decreased with increasing BMI in men and individuals over 65 years. This finding that a high BMI has a protective effect against vertebral fractures in older individuals suggests that maintaining muscle strength is crucial for fracture prevention. To our knowledge, this study is the first to report the possibility of high BMI increasing the incidence of vertebral fractures in specific sex and age groups. However, since this is a cross-sectional study, proving causality is challenging, and further analysis is necessary to explore the relationship between BMI’s effect on sagittal alignment and the increased incidence of vertebral fractures.
Hip fractures exhibited a high incidence at low BMI and a lower incidence as BMI increased. Considering that BMI tends to be higher in individuals with greater muscle mass, this implies that muscle strength plays a significant role in hip fracture occurrence, with sarcopenia potentially being a risk factor for fractures. Additionally, in women, postmenopausal osteoporosis may have a comparable impact on sarcopenia. 1 Further analyses with higher levels of evidence than observational studies are needed to confirm this hypothesis.
This study was conducted on a South Korean population and utilized the Asian classification of BMI, wherein the thresholds for overweight and obesity are set at 23.0 and 25.0, respectively. 17 In contrast, the European classification, which aligns with the WHO Global Standard, defines overweight and obesity at BMI thresholds of 25.0 and 30.0, respectively. 32 This distinction is based on the observation that Asians generally exhibit higher body fat percentages and an increased risk of obesity-related health conditions, such as diabetes and cardiovascular diseases, at lower BMI levels compared to Europeans. While the WHO Global Standard for overweight and obesity is primarily established based on non-Asian populations, the authors suggest that the differential impact of BMI on spinal and hip fractures observed in this study may be generalizable across populations. However, this assumption requires confirmation through a rigorously designed prospective longitudinal study.
This study has several limitations. First, as a retrospective study, it relied on the NHIS database, which was primarily designed for reimbursement purposes and may not have included comprehensive ICD-10 diagnosis codes. Second, although the database recorded whether a bone mineral density test was performed, specific T-score values were not stored, making detailed analysis impossible. Third, due to the vast amount of data on osteoporosis-related medications, such information was not incorporated into the initial study design. Consequently, the impact of BMI on hip and vertebral fractures could not be analyzed separately in patients with osteopenia or osteoporosis. Fourth, to exclude individuals with hip and vertebral fractures caused by high-energy trauma, those with S codes other than the operational definition simultaneously registered were excluded, however, there remains a possibility that not all high-energy trauma cases were eliminated. Fifth, as an observational study, causal relationships between factors such as fracture site, age, and gender could not be established. Lastly, classifying the entire cohort into BMI groups may not fully account for individuals with low fat and high muscle mass, who might be categorized as overweight or obese.
Conclusion
Being underweight poses a risk for both hip and vertebral fractures in the general population. However, the effects of age and weight on these fractures were found to be heterogeneous. High BMI demonstrated a protective effect against hip fractures across all models reflecting sex and age. However, high BMI did not show a similar protective effect against vertebral fractures in individuals under 65 years of age and in women. These findings suggest that maintaining an appropriate BMI tailored to age and sex can play a crucial role in fracture prevention, particularly in older patients.
Footnotes
Declaration of conflicting interests
The author(s) declared no potential conflicts of interest with respect to the research, authorship, and/or publication of this article.
Funding
The author(s) disclosed receipt of the following financial support for the research, authorship, and/or publication of this article: This work was supported by the research fund of Hanyang University (HY-202100000001141).