
Abstract
Study Design
Cross-sectional rater agreement.
Objectives
This study assessed whether inter- and intra-rater agreement for the AO spine-DGOU Osteoporotic Fracture (OF) Classification system differs between classifications based on computed tomography (CT) or radiography.
Methods
Radiography and CT were retrieved for 64 consecutive patients with a single osteoporotic vertebral fracture (OVF) treated at our institution having both imaging modalities performed on the same date. Four spine surgeons independently classified the fractures twice 1 week apart after training on 10 cases. Classifications were based on radiography and CT separately. Crude (%) and Fleiss’ Kappa (k) agreements were calculated for radiography and CT, respectively, and for intrarater agreement between radiography and CT within each rater. The proportion of cases with complete agreement among raters (concordant cases) was compared between radiography and CT using McNemar’s test. Fracture-type distribution differences were analyzed using McNemar’s test as well.
Results
Intra-rater agreement ranged 75%–81% (k = 0.49-0.64) for radiography and 64%–77% (k = 0.42-0.63) for CT. Inter-rater agreement was 56% (k = 0.49) with radiography and 50% (k = 0.51) with CT. No significant difference in the proportion of concordant cases was found between imaging modalities (P = 0.37). Fractures were classified as higher-order OF types with CT (P < 0.001).
Conclusions
We found moderate to substantial reliability of the OF system for radiography and CT. Using CT over radiography for classification did not increase the rater agreement. However, fractures are likely to be categorized as a higher-order OF type when the classification is based on CT compared to radiography.
Keywords
Introduction
The “Osteoporotic Fractures” Working Group from the Spine Section of the German Society of Orthopaedics and Trauma (DGOU) presented the Osteoporotic Fracture (OF) Classification system in 2014.1-3 The clinical utility of any classification system depends primarily on the level of agreement among clinicians.
The OF system was developed based on all available radiological imaging modalities: Radiography, computed tomography (CT), and magnetic resonance imaging (MRI). The developers have reported substantial interrater agreement between 6 raters, 1 and the following independent studies have reported good and moderate interrater agreement among 6 raters, respectively.4,5 Not all imaging modalities are performed as part of the initial routine assessment of osteoporotic vertebral fractures (OVF) in all institutions, including ours. CT is performed in about 3 out of 4 patients, and MRI only follows specific indications, such as neurological deficits or suspicion of posterior ligament complex (PLC) injury.
In this clinical setting, it is important to understand how reproducible the classification is when imaging modalities are limited. A previous investigation assessed the reproducibility of the OF classification based on radiography and MRI with and without CT and found better reproducibility with all 3 modalities compared to radiography and MRI alone. However, the authors deemed the difference not important. 4 To our knowledge, the rater agreement has not been reported separately for radiography or CT.
This study aims to assess the inter- and intra-rater agreement of the OF system using either radiography or CT imaging and evaluate whether classifications using CT significantly improve agreement compared to classification using radiography. Finally, the distribution of fracture types will be compared between the 2 imaging modalities. 6
Methods
We designed a cross-sectional rater agreement study approved by the Danish National Committee on Health Research Ethics (ref. 2400029) and our institutional review board (REG-162-2023). The manuscript has been prepared following the Guidelines for Reporting Reliability and Agreement Studies (GRRAS). 7 Initial radiographs and CT scans were collected from a consecutive cohort of patients aged 50 or older diagnosed with an osteoporotic vertebral fracture (OVF). Patients were identified from electronic health records at the Department of Orthopedic Surgery, Zealand University Hospital, Denmark, between December 2021 and March. Inclusion criteria were age ≥50 years, thoracolumbar vertebral fracture. Exclusion criteria included trauma other than a fall from standing height, fracture related to malignancy, more than 1 vertebral fracture, CT unavailable or the interval between CT and radiography exceeding 24 hours.
Digital Imaging and Communications in Medicine (DICOM) format imaging was retrieved from the Picture Archiving and Communication System (PACS) without patient identifiers. Raters used Santesoft DICOM viewer Lite®, which allowed them to review all sagittal cuts of the CT scans.
Raters were introduced to an OF system reference paper 3 and trained using ten sets of radiographs and CTs. Each rater assessed the cases independently, and then the cases were discussed among all 4 raters. These cases were not included in the data analysis.
The raters were 4 spine surgeons, including 2 consultant orthopaedic surgeons having 10 and 14 years of specialist experience (Rater 1 and 3), 1 senior registrar orthopaedic surgeon (Rater 4) with 4 years of experience and 1 consultant neurosurgeon with 18 years of experience (Rater 2). Only the neurosurgeon had prior experience with the OF classification. On 2 evaluations, at least 1 week apart, each rater independently assessed the radiographs and CTs separately and randomly. Images were assigned unique keys to prevent communication or comparison within and between raters. Only 4 categories (OF2-5) were used, as OF1, per definition, is not detectable on plain radiographs or CT. During the second evaluation, the cases were presented in a different order with new unique keys, and thus, raters remained blinded to previous assessments. Classifications of OF fracture types were recorded in Microsoft® Excel®. The schematic presentation of the OF classification system was made readily available for raters during evaluations. 2
Statistics and Sample Size
The desired agreement was Fleiss’s kappa (k) >0.8, corresponding to an “almost perfect” agreement according to the criteria by Landis and Koch, 8 k: <0.00 = poor, 0.00-0.20 = slight, 0.21-0.40 = fair, 0.41-0.60 = moderate, 0.61-0.80 = substantial and 0.81-1.00 = almost perfect agreement. 3
Sample size estimation using the R package “KappaSize” corresponding to the approach by Rotondi et al yielded 52 patients. 9 The sample size was calculated with the following syntax: CI4Cats (kappa0 = 0.9, kappaL = 0.8, kappaU = 0.99, props = c (0.26, 0.45, 0.28, 0.01), raters = 4, alpha = 0.05). The expected distribution of fracture classifications was extracted from the online video presentation of the classification at the Arbeitsgemeinschaft für Osteosynthesefragen (AO) Website. 10 As the prevalence was uncertain, we increased the sample size to 70 and an additional 10 cases for training.
The statistical analyses were performed using the “irr” package in R (R Core Team, 2024). 11 A Language and Environment for Statistical Computing. Foundation for Statistical Computing, Vienna, Austria). Age is presented using median and interquartile range (IQR), and Fleiss Kappa (k) is presented with a 95% confidence interval (95%CI). Inter- and intrarater agreement were calculated separately for radiography and CT as unadjusted crude agreement (%) and Fleiss’ Kappa coefficients.
To evaluate intrarater agreement using different image modalities, crude (%) and Fleiss’ Kappa coefficients were calculated for each rater using assessments of radiographs and CT. Interrater agreement between image modalities was assessed by comparing the proportion of agreement between all 4 raters (concordant cases) for radiography and CT. The statistical significance was tested using McNemar’s test without correction for continuity for paired categorical observations. The difference in distributions of fracture types between radiography and CT assessments was also tested using McNemar’s test. P < 0.05 was considered statistically significant.
Results
We retrospectively screened 390 patients to include 80 patients. A total of 310 patients were excluded based on the predefined exclusion criteria. Six cases were excluded after the first evaluation due to indistinct fractures on radiography or multiple fractures missed at the initial screening (Figure 1). This left 64 patients for the second evaluation and final analyses. The median age was 75 years (IQR: 66-79), and 48% were female. Flowchart of patient selection and exclusion criteria for the study.
Inter- and Intrarater Agreement for Radiography
Interrater Agreement for Radiography Assessment.
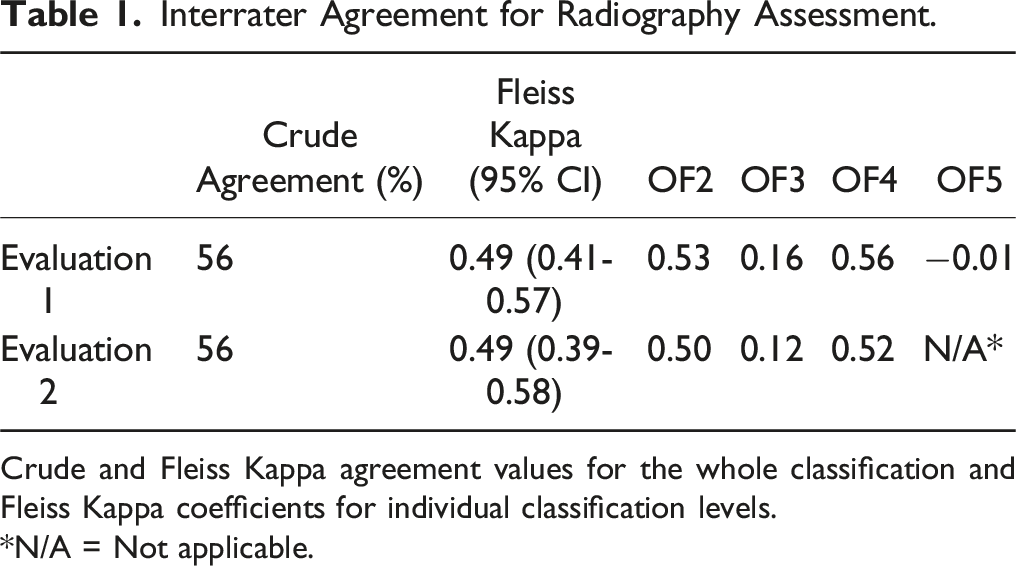
Crude and Fleiss Kappa agreement values for the whole classification and Fleiss Kappa coefficients for individual classification levels.
*N/A = Not applicable.
Intrarater Agreement for Radiography Assessment.
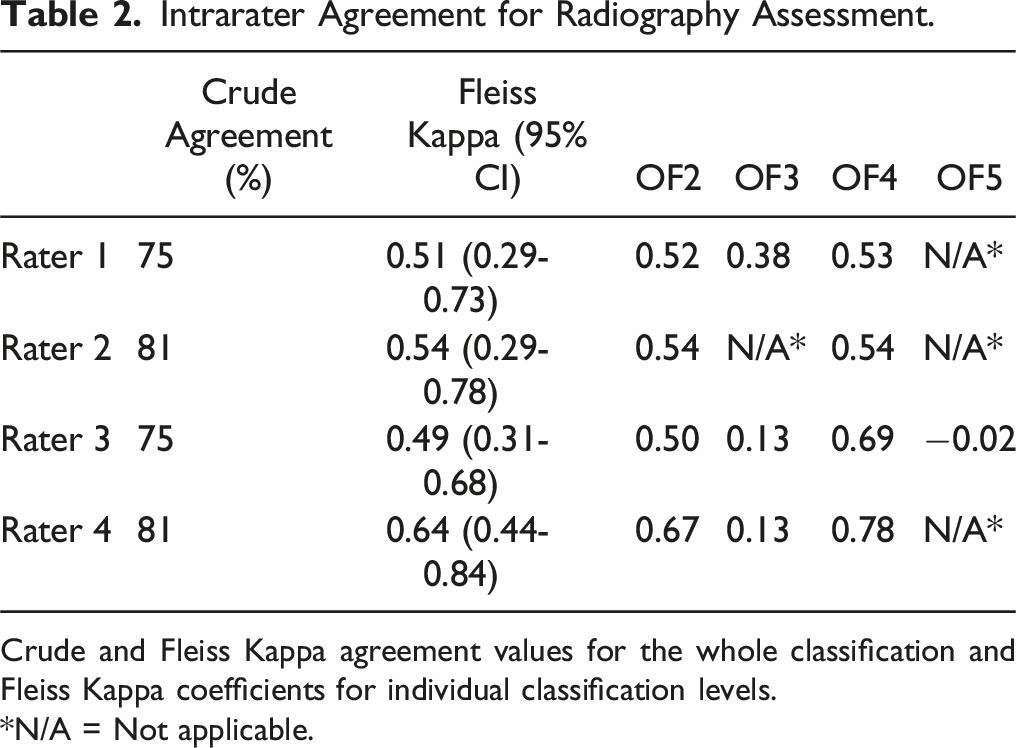
Crude and Fleiss Kappa agreement values for the whole classification and Fleiss Kappa coefficients for individual classification levels.
*N/A = Not applicable.
Inter- and Intrarater Agreement for CT Assessments
Interrater Agreement for CT Assessment.
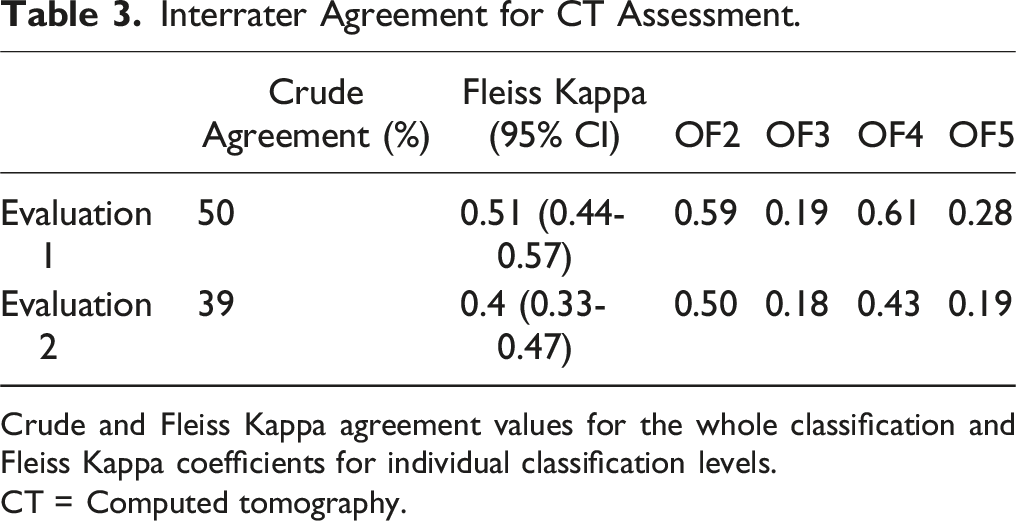
Crude and Fleiss Kappa agreement values for the whole classification and Fleiss Kappa coefficients for individual classification levels.
CT = Computed tomography.
Intrarater Agreement for CT Assessment.
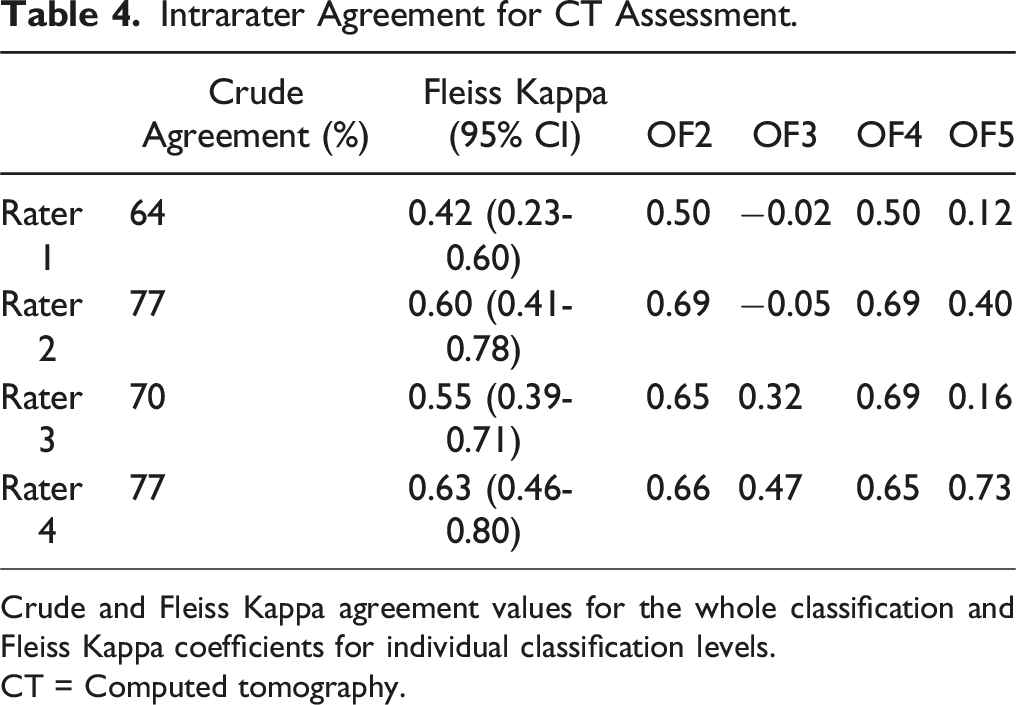
Crude and Fleiss Kappa agreement values for the whole classification and Fleiss Kappa coefficients for individual classification levels.
CT = Computed tomography.
Inter and Intrarater Agreement Between Radiography and CT Assessments
Intra-Rater Agreement for Radiography and CT at First Evaluation.
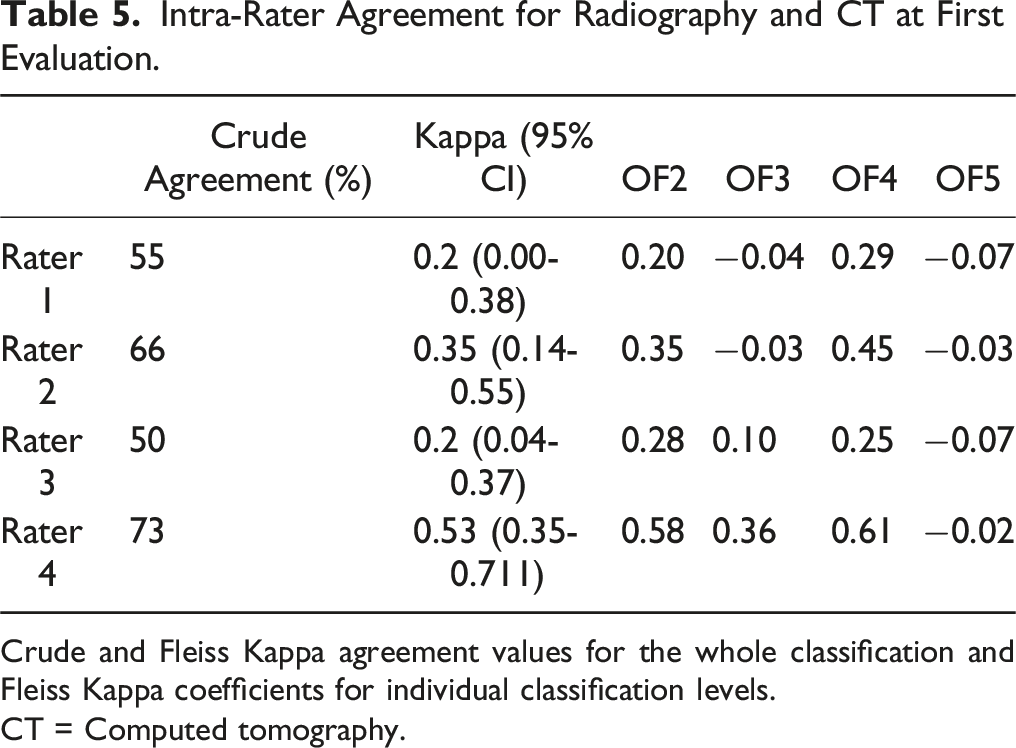
Crude and Fleiss Kappa agreement values for the whole classification and Fleiss Kappa coefficients for individual classification levels.
CT = Computed tomography.
Intra-Rater Agreement for Radiography and CT at Second Evaluation.
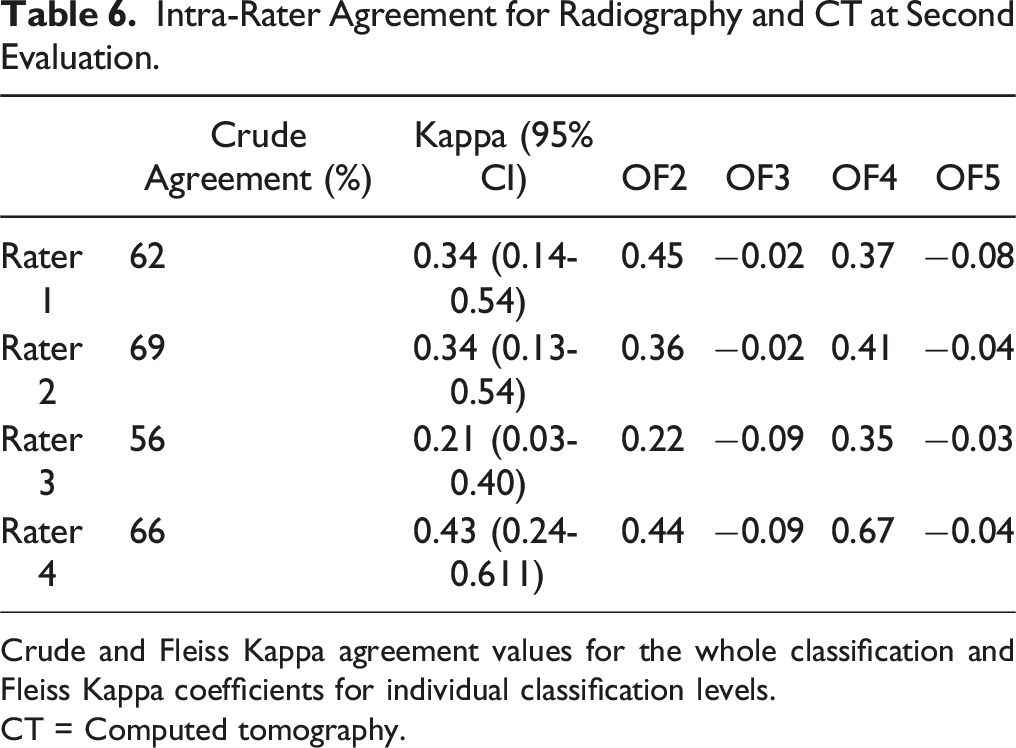
Crude and Fleiss Kappa agreement values for the whole classification and Fleiss Kappa coefficients for individual classification levels.
CT = Computed tomography.
Intrarater agreement ranged from slight to moderate across raters.
Distribution of Fracture Types for Radiography and CT Assessments
We observed a statistically significant difference in fracture-type distributions between the 2 imaging modalities. Classifications based on CT produced consistently higher order OF fracture types, P < 0.001 Figure 2. Frequency of OF fracture classifications by imaging modality (CT vs. radiography). Data shown as percentage across all ratings.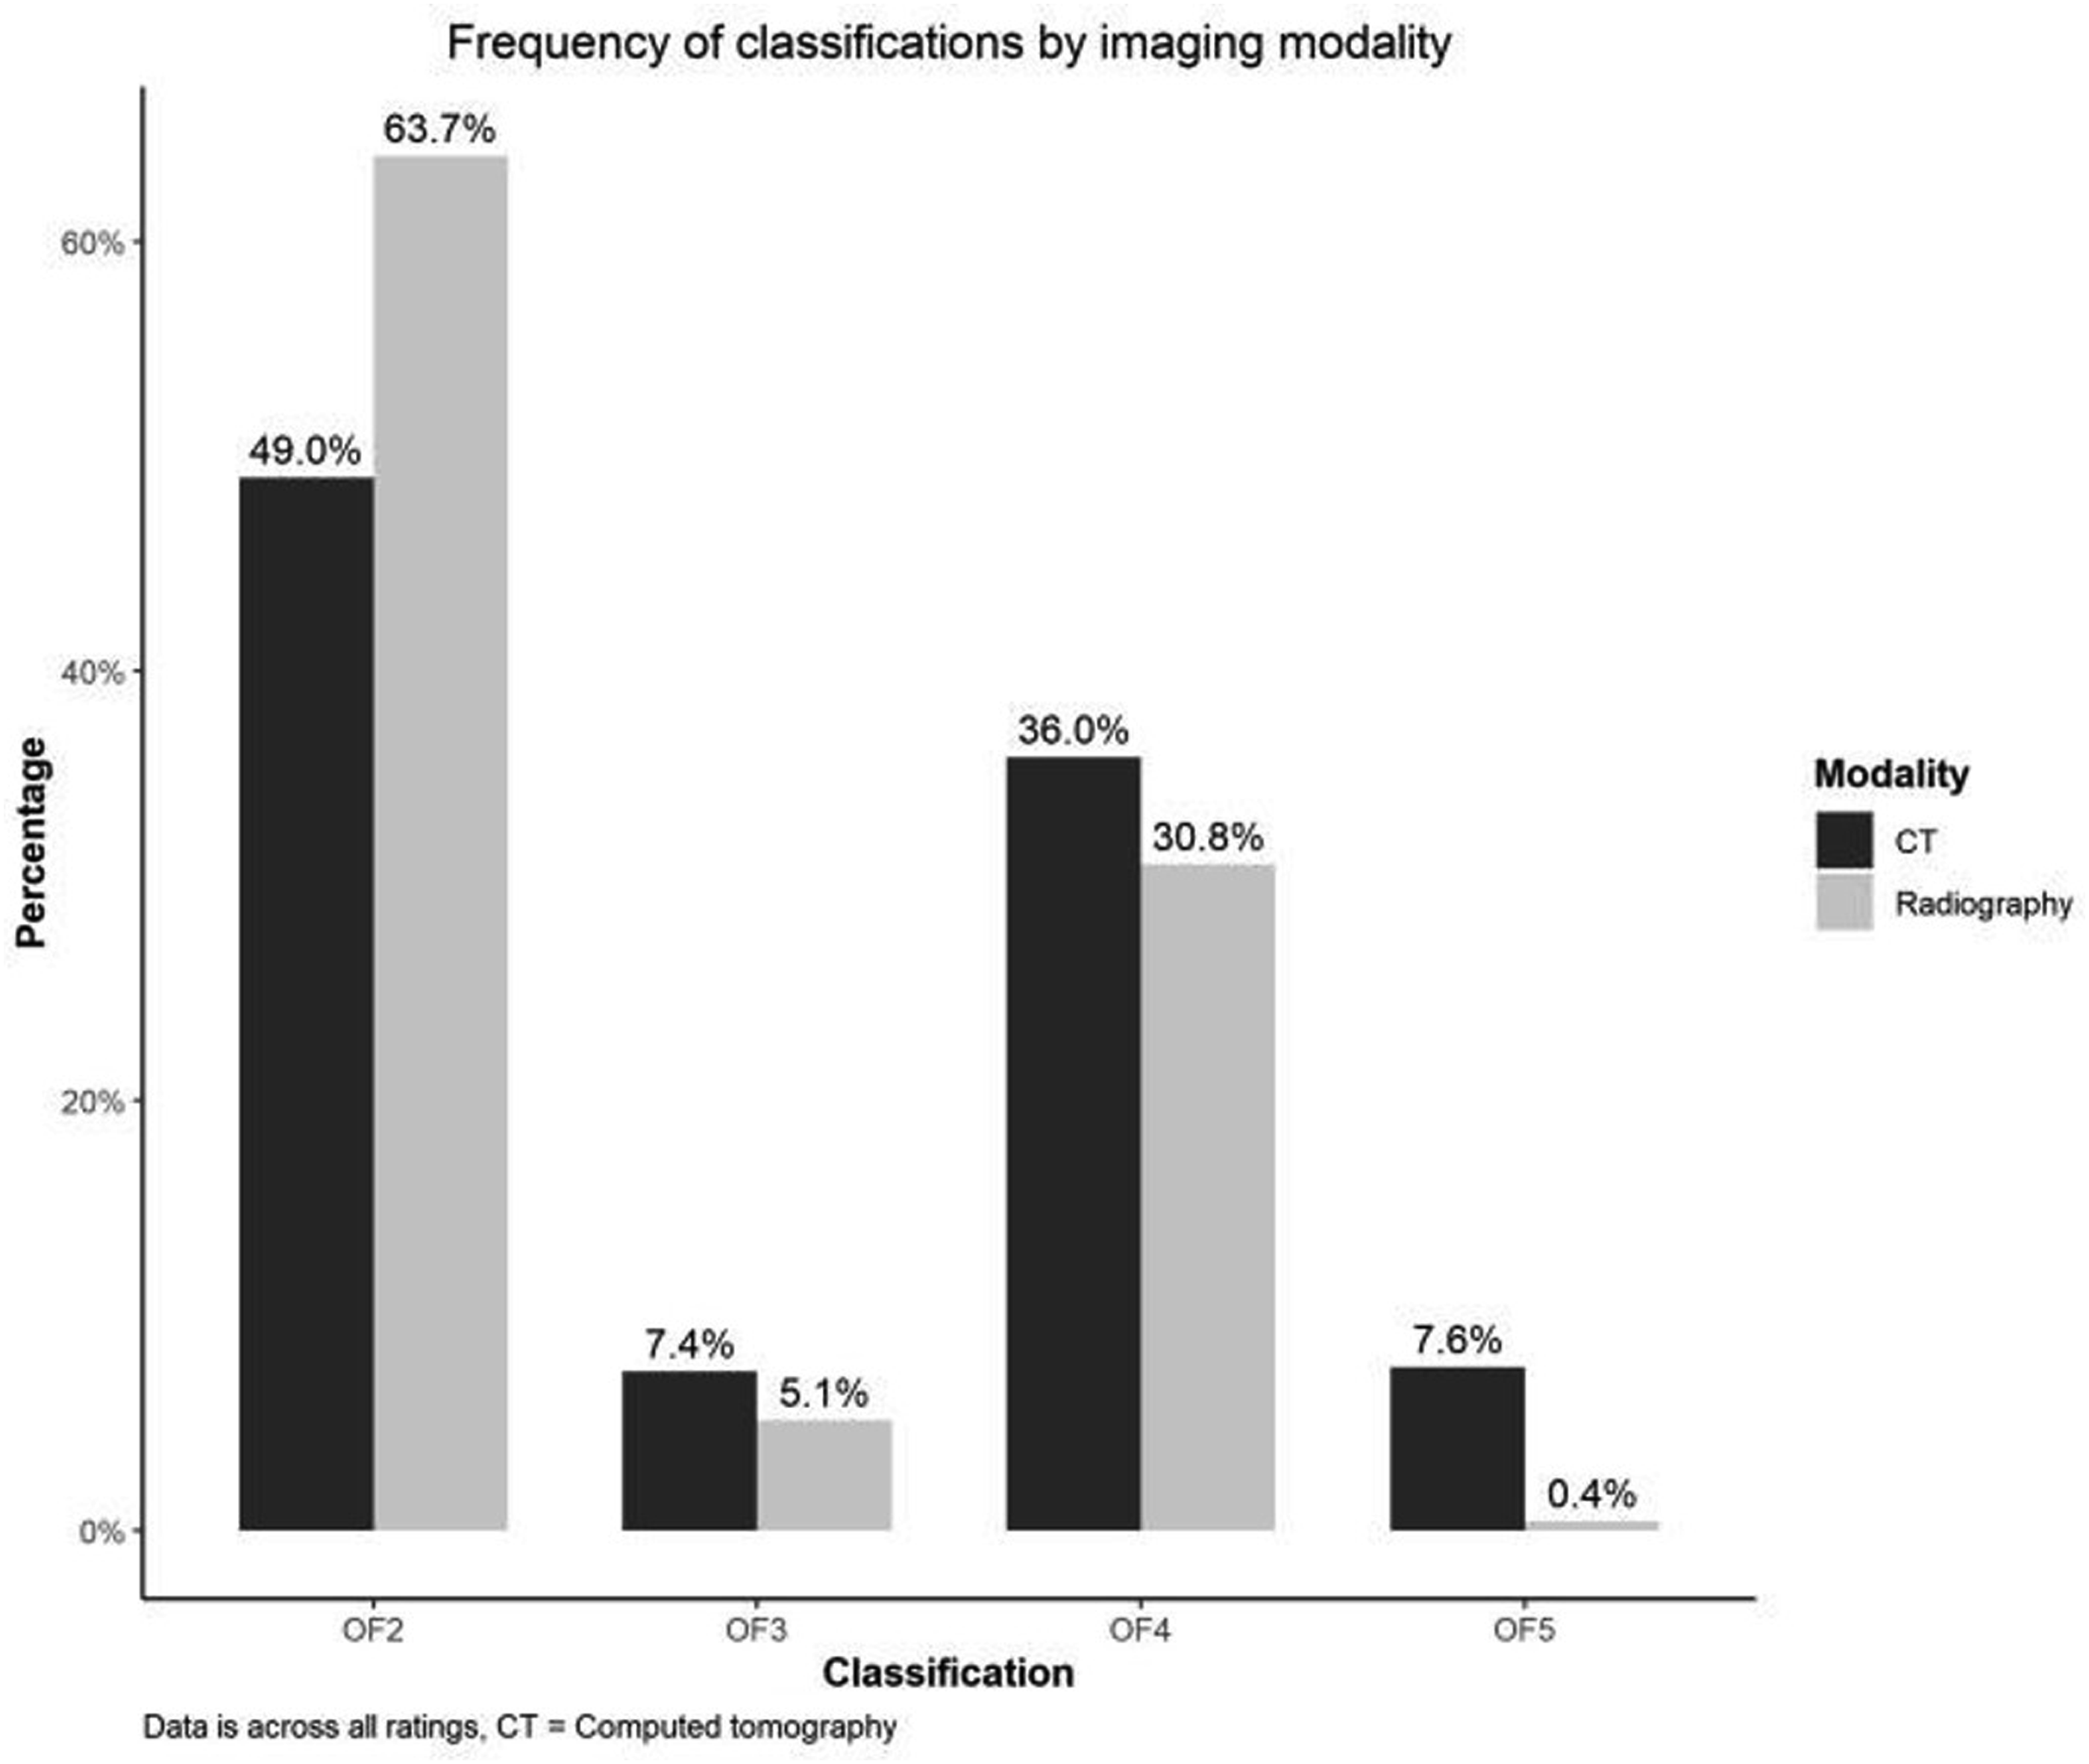
This was most notable for OF5, classified almost 20 times more often on CT vs radiography.
Discussion
In this study, 64 cases of OVF were evaluated twice by 4 spine surgeons. We found moderate interrater and moderate to substantial intrarater agreement of the OF system using either radiography or CT for the classification. The rater agreement did not differ significantly between classifications based on CT and radiography, respectively. However, the distribution was skewed statistically significant toward higher-order OF fracture types for CT- compared to radiography-based classifications. Only 2 previous study has investigated the influence of image modality and found an unimportant better agreement for classifications based on radiography, MRI, and CT compared to radiography and MRI.4,6 The influence on fracture type distribution was not reported.
The rater agreement estimates from the current study add to previous reports for the OF classification.2,4-6 However, there are several differences between the studies. Previous studies report agreement estimates based on the availability of radiography, CT, and MRI, for which the classification was developed. 3 Our purpose was to evaluate the classification using only radiography or CT, and thus, OF1 was omitted, leaving only 4 categories. Reducing the number of categories could inflate the Kappa coefficient by decreasing the potential for disagreement. 12 It was beyond the scope of this work to assess the difference in agreement with and without MRI. We used 4 raters since Increasing the number of raters from 4 to 6 only improves the precision of the estimates to a low degree. 9 Previous studies present weighted Kappa, which is generally preferred for ordinal scales. However, weighted kappa can produce higher coefficients than unweighted Kappa if most disagreements are of a single category. 12 The heat map presented by Schönrogge et al. confirms this pattern for differences in using the OF system. 4 The OF system is offered as ordinal, with higher-order fracture types associated with more morphologic changes. However, the prognostic value for increasing OF types regarding clinical outcomes has not yet been shown to be ordinal. For these 2 reasons, we chose to present unweighted Kappa coefficients.
The 2 studies by Schönrogge et al 4 and Schnake et al2,6 presenting good and substantial interrater agreement and substantial intrarater agreement 4 used raters already familiar with the OF classification system. In contrast, only moderate interrater agreement and fair to substantial intrarater agreement were found by Quinteros et al. and the current study, where raters were only trained for the study. 5 At least for junior raters, a learning effect has also been demonstrated. 5 These findings suggest that agreement is expected to increase with use. In the current study, only Rater 2 had prior clinical experience with the OF Classification (3 years), and it did not seem to influence the results as neither crude agreement nor kappa coefficients for intrarater agreement were consistently better or worse for Rater 2 (Table 2-6).
In line with other studies, we found worse agreement for OF3 and OF5 fracture types,4,5 indicating a potential differentiation problem. In our study, the agreement for these types was poor to slight. They were also the 2 least frequent fracture types classified even with CT (7.4% OF3 and 7.6% OF5), which contrasts with the distributions reported by Quinteros et al (27% OF3, 14% OF5) 5 and presented online by the developers. 10 Several reasons could explain these differences. First and foremost, the classification system is based on the availability of radiography, CT, and MRI. In our study, fractures were classified using either radiography or CT alone to represent the usual clinical setting at our institution. Including MRI in the assessment might have resulted in a different distribution of fracture types, especially more type 5 fractures, as these include injuries to the posterior ligamentous complex (PLC). MRI is considered the superior imaging modality to detect PLC injuries. 13 The differentiation between OF type 2 and 3 fractures, however, is based on whether the involvement of the posterior wall is minor or distinct (>1/5), 3 which is more easily determined on multiple cross-sectional images in CT than flat 2D radiography. As CT is generally considered superior to MRI for identifying and characterizing cortical fractures, 13 MRI is not expected to increase this distinction of posterior wall involvement. Three fracture types constitute the OF type 4 fractures: complete burst fractures (both endplates and posterior wall), pincer-type (both endplates), and vertebral body collapse, which is not described in more detail in the reference paper. 3 The burst and pincer-type depend on the detection of cortical and endplate involvement. Thus, as delineated for the posterior wall involvement, we would not expect the inclusion of MRI to significantly increase the detection OF type 4 fractures or the distinction between OF types 3 and 4.
Secondly, among fractures with distinct posterior wall involvement, what distinguishes concomitant height loss in an OF 3 fracture from a vertebral body collapse in an OF 4 fracture needs to be more well-defined. Also, anterior height loss is not mentioned as a discriminative factor for the OF classification, but as the order of fracture types implies more severe patterns, fractures with considerable anterior height loss could be interpreted as higher-order fracture types such as OF type 3 or even 4 (vertebral body collapse). In the schematic representation of the OF fracture types in the reference paper, anterior height loss could be interpreted as influential in the differentiation between OF types 2, 3, and 4. However, it is different from what is stated in the text. 3 Thus, is our opinion that the description of the OF classification and schematic presentation allows a subjective interpretation of posterior wall involvement, definition of vertebral body collapse, and influence of anterior height loss, which can cause inter study differences in the raters’ collective evaluation.
Thirdly, the patient sample could be different between studies. We included imaging from the first patient encounter with an acute fracture. Quinteros et al. 5 specify the inclusion of fractures <4 weeks, while the age of fractures is not specified for the 2 remaining reports.2,4 As the fracture morphology may progress over time, the age of the fracture could influence fracture type distribution. Also, more than half the sample in our study was male, which contrasts, at least, with Schönrogge et al., 4 who included only women. Sex distribution is not reported in the remaining studies.2,5
We found higher order categories of the OF classification using CT vs radiography, but as long as we do not know if the increased complexity detected on CT adds value in predicting patient outcomes, it is difficult to assess the implication of this finding.
The strengths of the current study are the blinding of raters and the use of imaging software without patient identifiers, which mimics the system clinicians usually use. Also, reporting crude (absolute) agreement (%) is essential for clinicians who want to know if their classification will agree with their colleagues. In contrast, a Kappa coefficient relates to relative agreement by accounting for chance. The latter is less valuable when considering individual patient care. 14 We found that all 4 raters only agreed on the classification in about half the cases. In comparison, the developers of the OF classification system have reported that in 75% of cases, at least 4 out of 6 raters agreed. 2 We also found that raters agreed with themselves in about 2/3 to 3/4 cases. The crude agreement estimates must be considered when evaluating the utility of the classification in deciding between treatment options.
The OF classification is part of a scoring system intended to stratify patients to either surgical or non-surgical treatment. 15 The score can range from −3 to 16, and the threshold for recommended surgical treatment is >6 points. The classification is given the most weight with 2 points for every increase in OF fracture type; thus, the classification alone can account for 10 points. Most other factors in the score account for −1 to 1 point, while fracture related neurological deficit add 2 points and health status can account for zero to −2 points. Because of the differentiation problem, especially regarding OF3, readjustment of the OF classification has been suggested, 4 and the question has been raised whether the classification meets the standards to be used in the clinical management of OVF. 5 We have highlighted some of the issues with interpreting the OF classification above.
This study’s limitations include the very low frequency of OF3 and OF5 cases, which makes it challenging to interpret the agreement for these categories. We also had to exclude cases after the first evaluation, which may introduce bias if more difficult than easy cases were excluded and reduced the number of available cases for analyses. Additionally, the 1-week interval between evaluations may not have been sufficient to eliminate memory bias, potentially affecting intrarater agreement. Cases were presented in random order to mitigate the effect. Furthermore, 107 patients were excluded due to the lack of CT, and it cannot be ruled out that CT was primarily performed for more challenging cases. This could have introduced bias in both distribution of fracture types and impacted the agreement rates.
Conclusion
We found moderate interrater and moderate to substantial intrarater agreement for the OF classification system applied to CT and radiography, respectively. All raters agreed in about 50% of the cases, and individual raters agreed with themselves in 64%–75%. The agreement was not better for CT than for radiography classifications, but CT classification resulted in statistically significant higher order OF fracture types. The agreement was poor for OF3 and OF5 fracture types, which confirms the differentiation concern raised in previous reports.
Footnotes
Acknowledgments
We would like to express our gratitude to Dariush Nikouvadad Radi and Paul Christian Coumine Riis for providing classifications for analysis.
Declaration of Conflicting Interests
The author(s) declared no potential conflicts of interest with respect to the research, authorship, and/or publication of this article.
Funding
The author(s) received no financial support for the research, authorship, and/or publication of this article.