
Abstract
Study Design
Retrospective case serie.
Objectives
Assess the correlation between pedicle screw (PS) position of the first instrumented vertebra (FIV) with proximal adjacent segment degeneration (ASD) development or progression.
Methods
Patients ≥55 years who have undergone lumbar fusion with a minimum 2-year follow-up were included. Radiographic PS position was assessed by the angle between the first PS and the upper vertebral endplate (VE) and by the PS tip-VE distance. Radiographic parameters of ASD included: disc height, disc angle, and vertebral listhesis. ASD magnetic resonance imaging (MRI) parameters included: disc degeneration and lumbar stenosis. ROC curve analysis was performed to identify the best cut-off points in correlation with lumbar stenosis.
Results
Forty-eight patients were included with an average follow-up of 6 years. All 48 included patients developed some degree of ASD whether on radiographic or MRI parameters. PS tip-VE distance and PS-VE angle were both positively correlated with: (1) Delta (Δ) lumbar stenosis; (2) Δ Disc degeneration; and (3) Δ Disc height. ROC curve analysis correlating PS tip-VE distance and PS-VE angle with an increase in the canal stenosis severity ≥2° resulted in a cut-off point of 36% and 9.5°, respectively.
Conclusions
The cranial orientation (PS-VE angle) of the pedicle screw in the first instrumented vertebra, along with a shorter pedicle screw tip-vertebral endplate distance (PS tip-VE), positively correlated with ASD progression at an average 6-year follow-up. Protective values against lumbar stenosis were identified as a PS tip-VE distance ≥36% of the first instrumented vertebra height and a PS-VE angle ≤9.5° relative to the upper vertebral endplate.
Introduction
Adjacent segment degeneration (ASD) is still a frequent consequence in medium- and long-term follow-up after lumbar fusions. 1 Its incidence ranges from 5% to 49%. 2 ASD is defined as the pathological process associated with the degeneration of the disc adjacent to a fused area, without clinical manifestations. It must be differentiated from adjacent segment disease, which represents the appearance of radiological changes with accompanying symptoms and presents a lower incidence (from 2% to 14%).3-9 Both entities may occur in proximal or distal segments to the fusion, although the vast majority occur at the proximal segment. 10 The creation of rigid segments in the spine leads to excessive stress and premature degeneration of adjacent levels, as demonstrated in vitro. 11 In this regard, evidence shows that around 13% of lumbar fusions may require additional intervention due to the development of ASD within an average follow-up time of 43 months. 12
Several variables have been identified as risk factors for ASD development and progression after lumbar fusion, such as age, body mass index (BMI), fusion length (number of vertebrae fused), adjacent facet violation during the procedure, preexisting degeneration, sagittal imbalance, and facet tropism.13,14 However, the evidence discussing the relevance of pedicle screw (PS) position within the first instrumented vertebral (FIV) remains scarce. 15
The primary objective of this study is to corroborate the hypothesis that the orientation and position of PS relative to the superior vertebral endplate (VE) of the FIV has an impact on the development or progression of proximal ASD in patients over 55 years old after lumbar fusion. Secondarily, we aimed to establish cut-off points of the analyzed variables that may determine a security zone for the PS position.
Methods
After approval from our Institutional Review Board (IRB 00010328, protocol #7384), a retrospective analysis of a consecutive series of patients who underwent lumbar fusion between May 2013 and May 2021 was conducted. This study was deemed exempt from needing informed consent.
Inclusion Criteria
• Patients ≥55 years old. • Undergoing posterior lumbar instrumented fusion (L2-S1/L3-S1/L2-L5/L3-L5) with or without TLIF (Transforaminal Lumbar Interbody Fusion). • Complete and adequate pre- and postoperative radiographic assessment, including standing lateral lumbar X-rays, long cassette full spine X-rays and lumbar magnetic resonance imaging (MRI). • A minimum 2-year follow-up.
Exclusion Criteria
• Patients <55 years old. • Patients who developed pseudoarthrosis, instrumentation loosening or surgical site infection. • Patients with < 2-year follow-up. • Patients with images that did not meet inclusion criteria. • All patients with intraoperative complications that could alter outcome variables (such as pedicle fracture, injury to adjacent facet joint, or hook fixation). • Patients with previous surgeries.
Pre-operative demographic data, including gender, age, BMI, ASA score, and the modified 5-item Frailty Index (mFI-5), were collected.16,17 The mFI-5 includes 5 clinical variables - congestive heart failure (CHF), diabetes (DM), chronic obstructive pulmonary disease (COPD) or pneumonia, hypertension (HTN), and the degree of functional dependence.
Imaging assessment included the parameters describing the position of PS in the FIV: (1) the PS-VE angle (the average angle between each of the pedicle screws and the upper vertebral endplate) (Figure 1A); and (2) the PS tip-VE distance (average distance from the tip of each screw to the upper VE, expressed as a percentage of the FIV height) on immediate postoperative standing lateral lumbar X-rays (Figure 1B). (A) Lateral lumbosacral X-ray after L2-S1 posterior fusion L2-S1 showing the measurement of the PS-VE angle (15.08° in this case), obtained as the average angle between the screw of the FIV and the upper vertebral endplate. (B) Lateral lumbar-sacral X-ray showing the PS-tip distance (2.75 mm in this case), calculated as the average distance from the tip of the screw to the upper endplate and then measured in terms of a percentage of the height of the FIV (34.92 mm in this case for a % of 2.75 mm × 100 %/34.92 mm = 7.88%).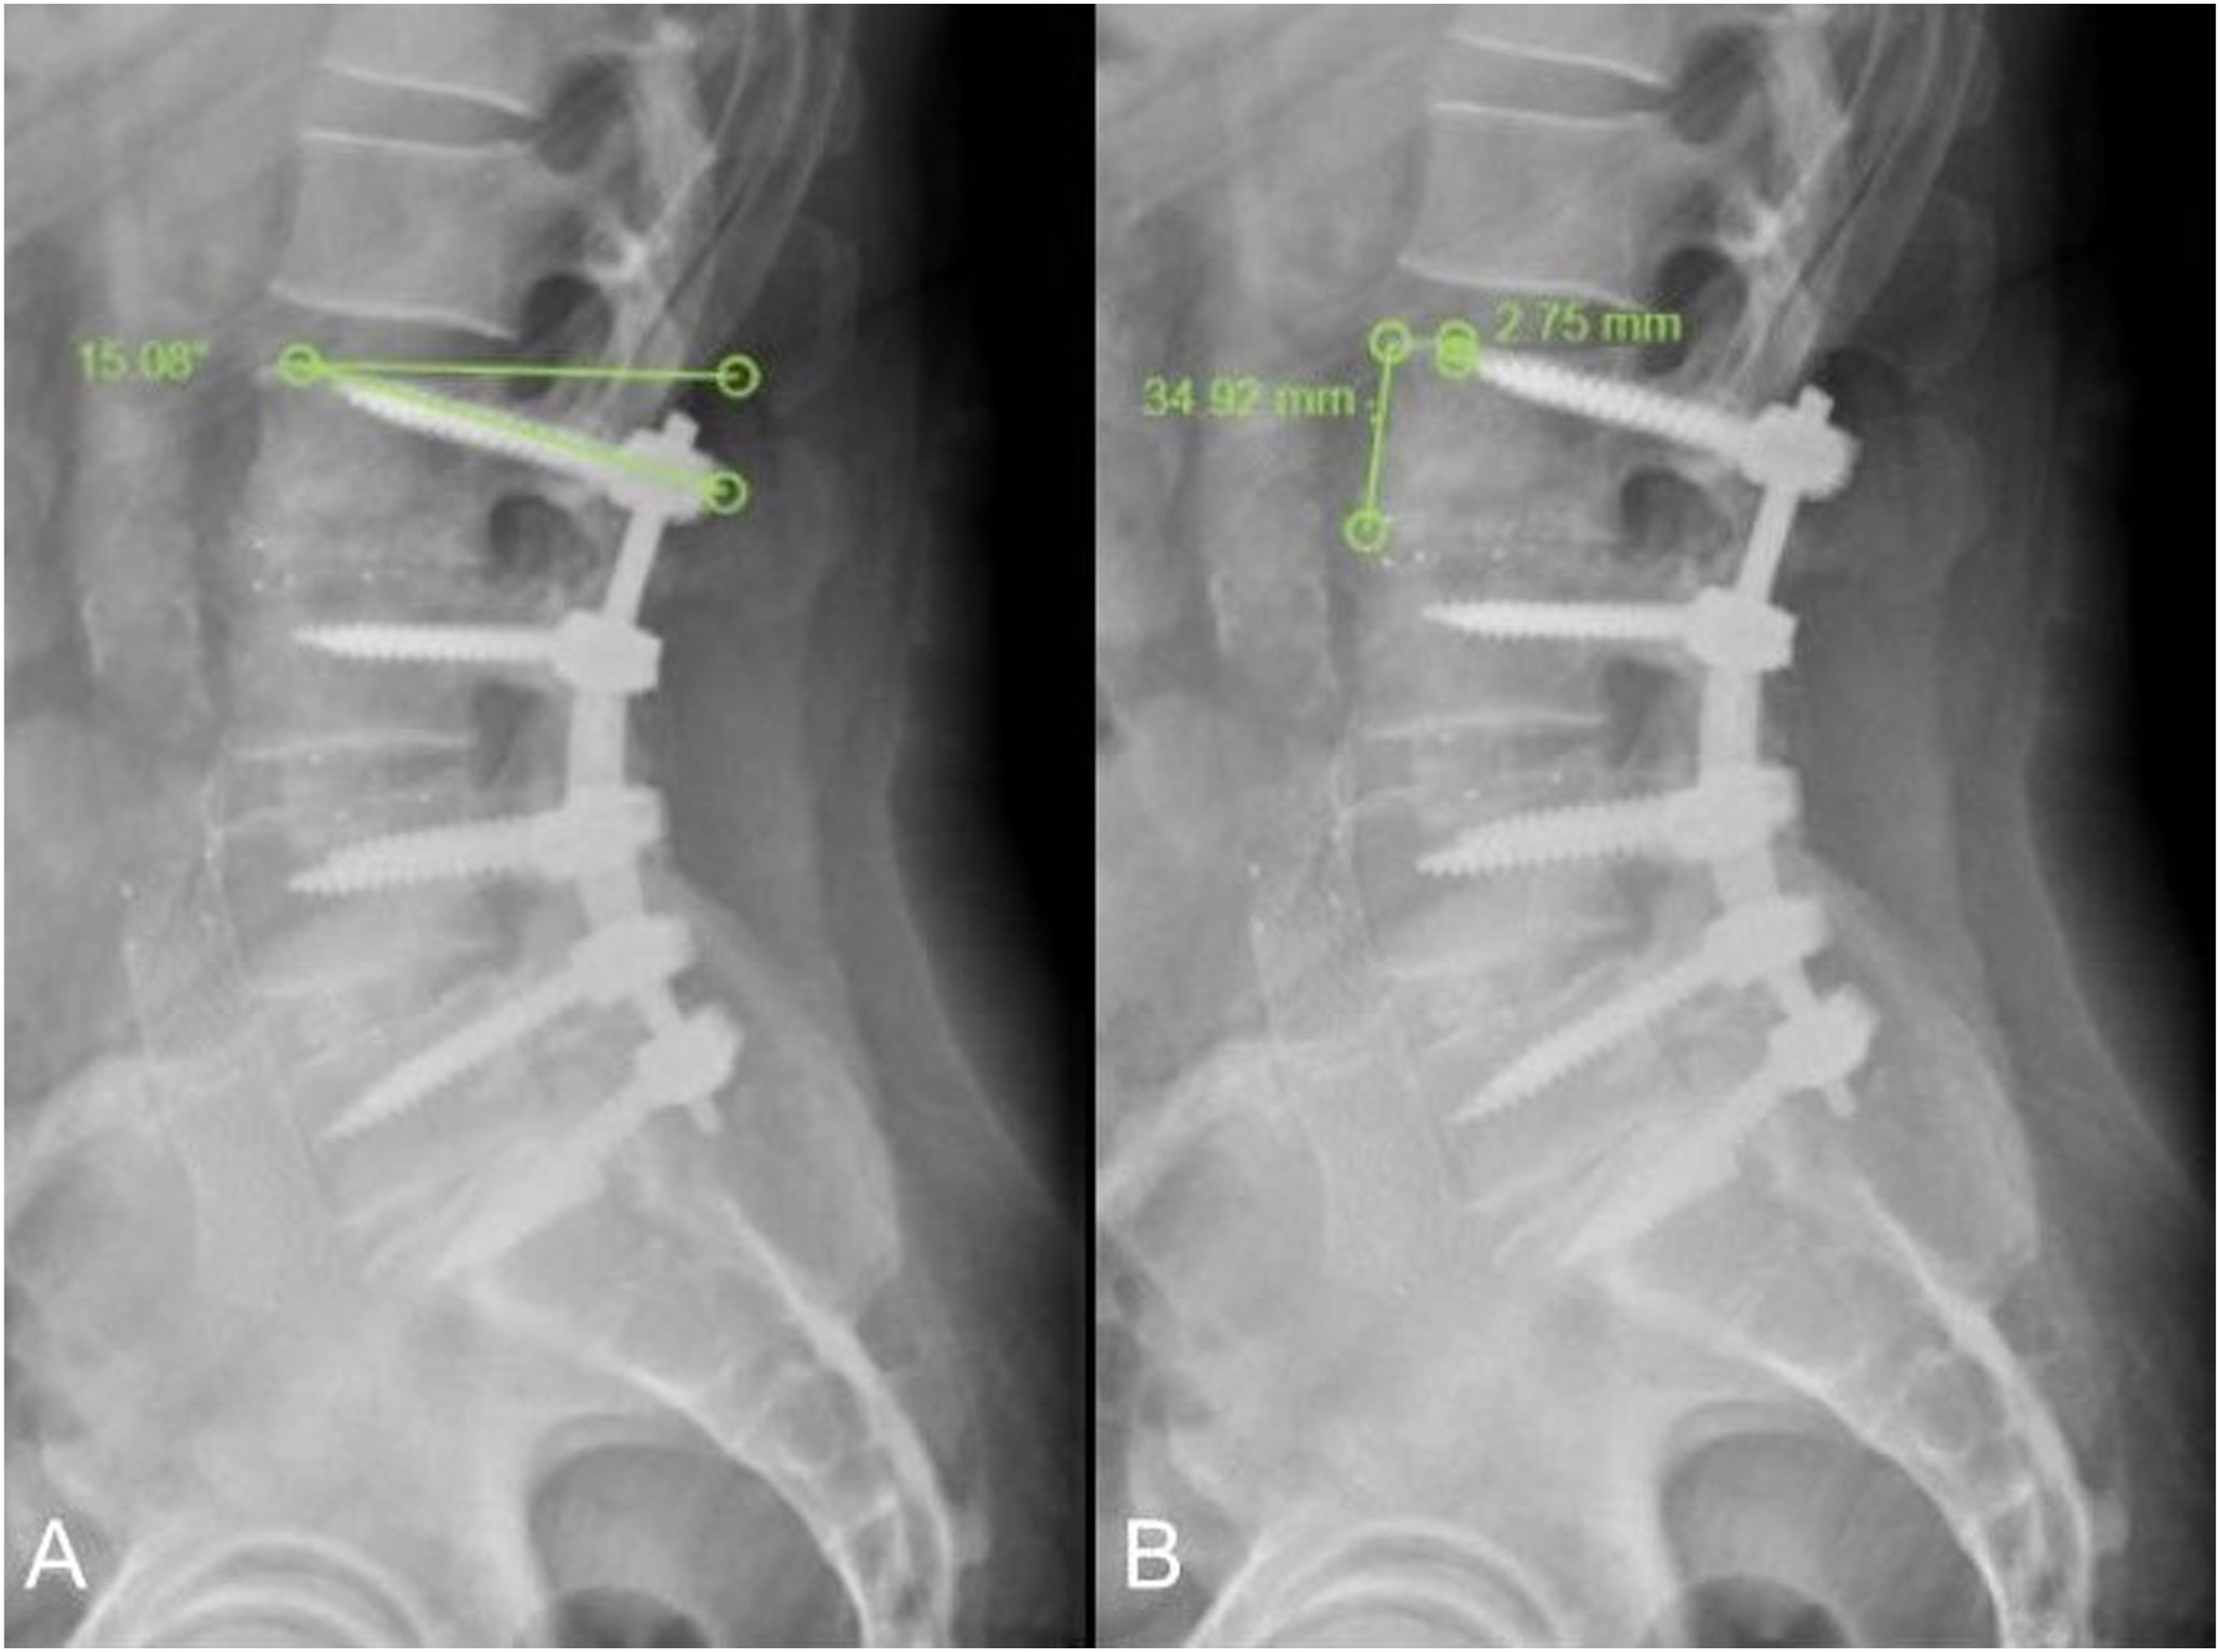
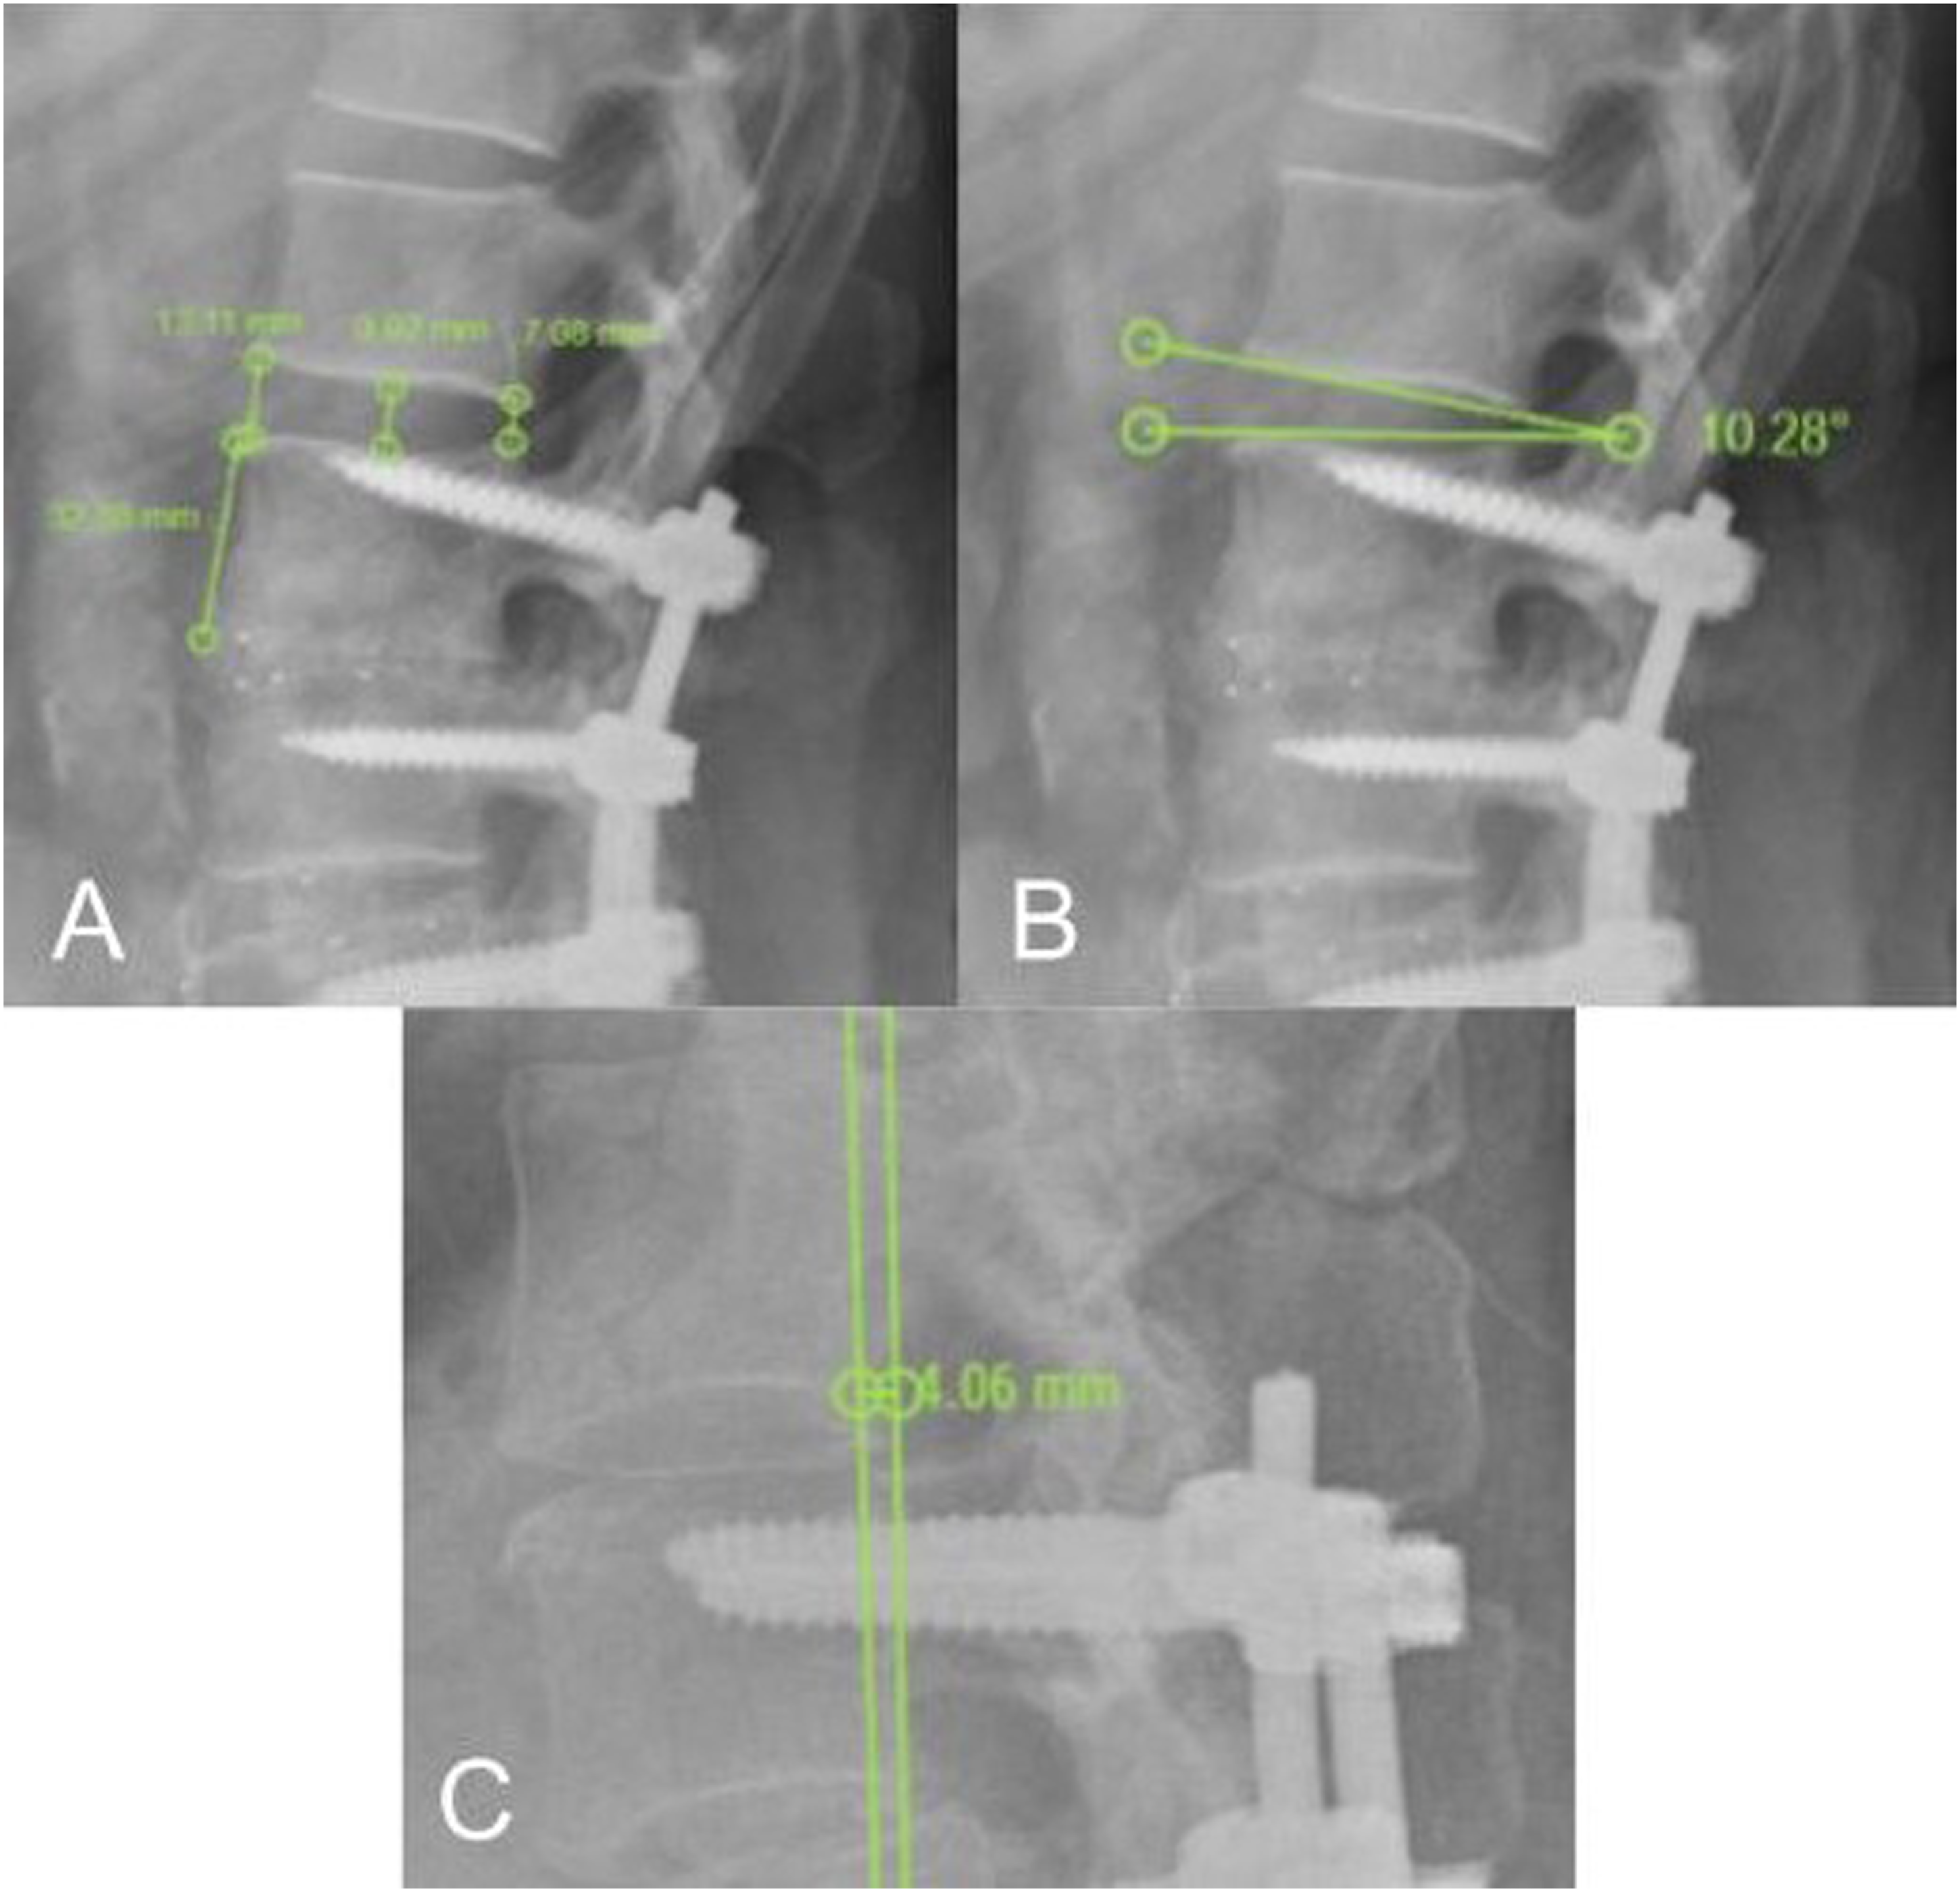
The development or progression of ASD was evaluated using radiographic and MRI parameters. Radiographic parameters included: • Proximal disc height according to Nakashima et al. (average of the sum of intervertebral disc heights at 3 points on lateral X-rays, expressed as a percentage of the FIV height) (Figure 2A).
18
• Proximal disc angle (angle between 2 lines connecting both endplates, positive if lordotic, negative if kyphotic) (Figure 2B). • Vertebral listhesis (displacement distance of the upper vertebra relative to the FIV, expressed as a percentage, positive for anterolisthesis and negative for retrolisthesis) (Figure 2C). These measurements were performed on standing lateral lumbar X-rays at a minimum of 2-year follow-up using Surgimap® software. (A) Lateral lumbosacral X-ray focused on the proximal area of posterior fusion L2-S1 with the measurement of proximal disc height, calculated as the average sum of the heights at 3 disc segments, expressed as a percentage of the FIV height. Example: (13.11 mm + 9.92 mm + 7.08 mm)/3 = 10.04 mm; (10.04 mm * 100%) / 32.88 mm = 30.53%. (B) Lateral lumbosacral X-ray showing how the proximal disc angle was measured, as the angle between 2 lines connecting both endplates (10.28° in this case). (C) Lateral lumbosacral X-ray showing how the vertebral listhesis was measured, calculated as the magnitude of displacement of the upper vertebra relative to the FIV (4.06 mm in this case), expressed as a percentage of the upper VE length.
MRI parameters describing ASD development or progression were:
Surgical Treatment
All surgeries were performed by 1 of the 3 senior spine surgeons at our center (CS, MG, and MP). Patients were scheduled for routine follow-up at 15 days, 45 days, 3 months, 1 year, 2 years, and every 2 years there-after.
Reliability
Before performing formal radiographic measurements, a training session was conducted, including the visualization of 10 X-rays and 10 MRIs from cases not included in the study cohort. Following this training, twenty cases were randomly selected for the measurement of PS-VE angle, PS tip-VE distance, proximal disc height, proximal disc angle, vertebral listhesis, Pfirrmann score, and Lee classification.
Statistical Analysis of Data
Continuous variables were expressed as means and standard deviations, or medians and interquartile ranges, depending on whether they had a normal distribution. Categorical variables were reported as frequencies and percentages. Categorical variables were compared using the Chi-square test and Fisher’s exact test. Continuous variables were compared using the t test when data were normally distributed and the Wilcoxon test when the distribution was not normal. Linear regression models were also used to evaluate the association between continuous variables. To visualize this relationship, a Locally Weighted Regression (LOWESS) graph was created. Variables were considered statistically significant with a P-value <0.05. The analysis was performed using Stata v15.0 software (STATA Corporation, California) and Surgimap software (Nemaris, Inc product). To evaluate the best cut-off points for the accuracy of canal stenosis using the PS-VE angle and PS tip-VE distance variables, Receiver Operating Characteristic (ROC) curve analysis was performed using the Youden index (maximizing sensitivity and specificity).
Results
After inclusion and exclusion criteria application, 48 patients aged ≥55 years old were included in the study (Figure 3). Average cohort age was 66 ± 8.4 years old (55 - 87 years), average BMI was 26.4 ± 7.6 Kg/m2 (18.1 - 38.3) and female sex was predominant (34/48, 70.8%). The mean clinical follow-up was 5.5 ± 2.3 years (2 - 10 years). Mean radiographic follow-up with X-rays and MRI was 6.6 ± 2.4 years (2 - 10 years) and 6.2 ± 2.2 years (2 - 8 years), respectively. Flowchart of study cohort selection.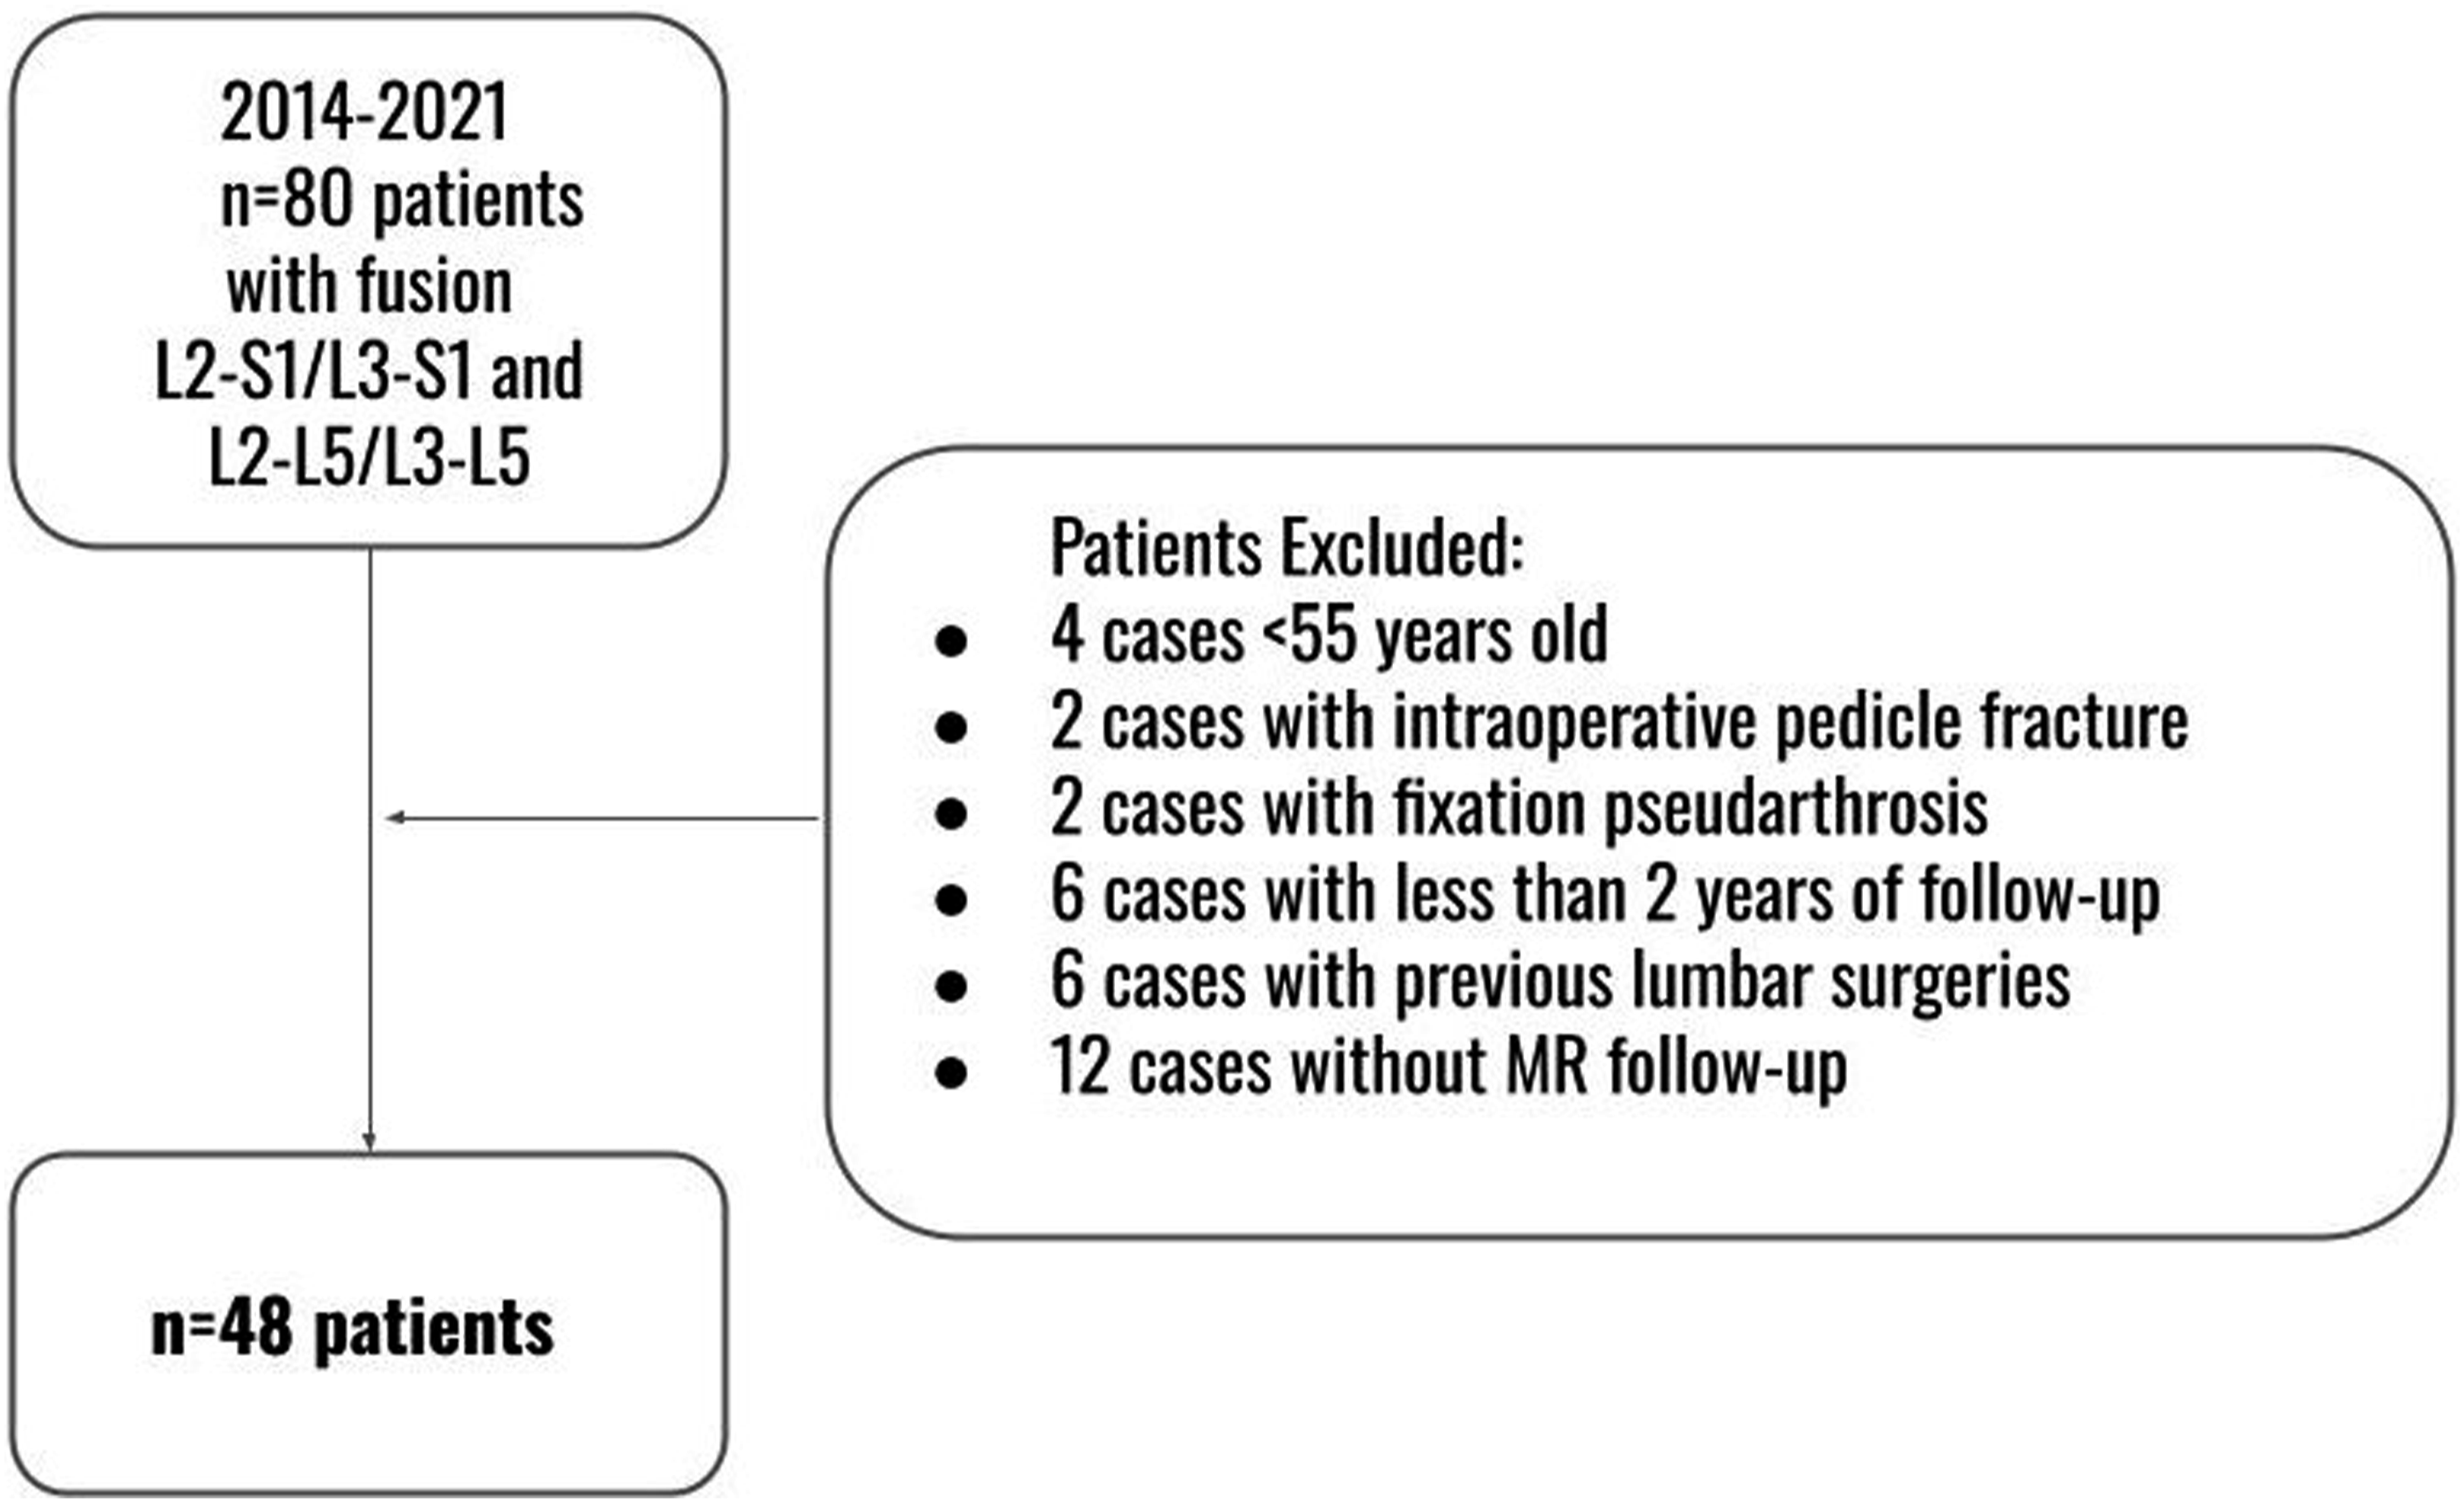
Demographic parameters.
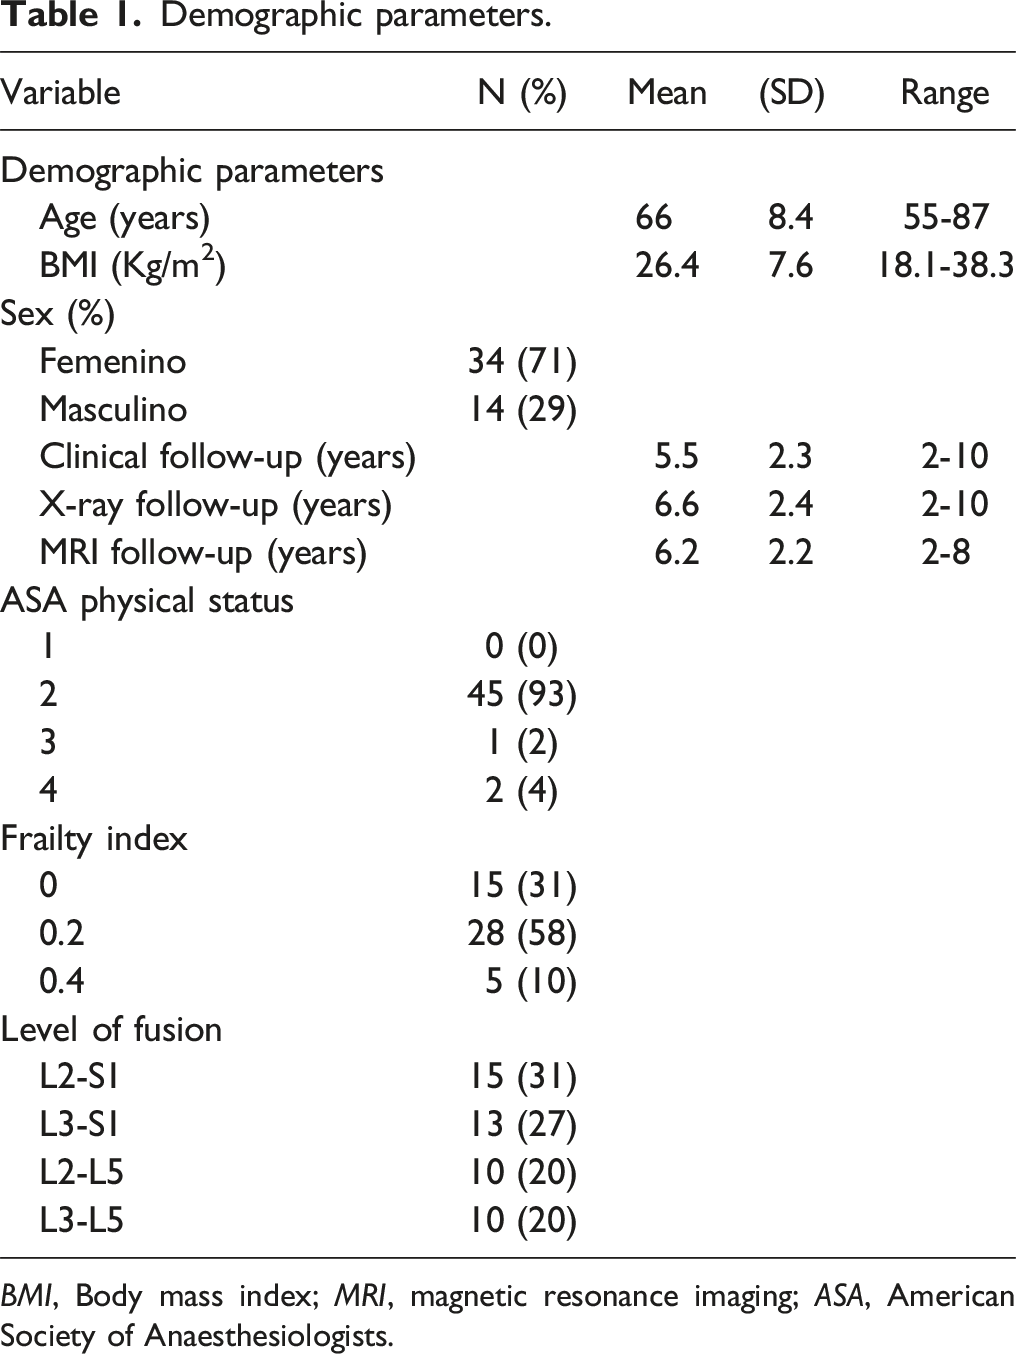
BMI, Body mass index; MRI, magnetic resonance imaging; ASA, American Society of Anaesthesiologists.
Regarding the parameters related to the PS position, the average PS-VE angle of the FIV was 8.6° ± 3.9° (1.5° - 22°) and the average PS tip-VE distance was 31.8% ± 14.6% (6.2% - 60.3%).
Pre- and post-operative imaging parameters measurements.
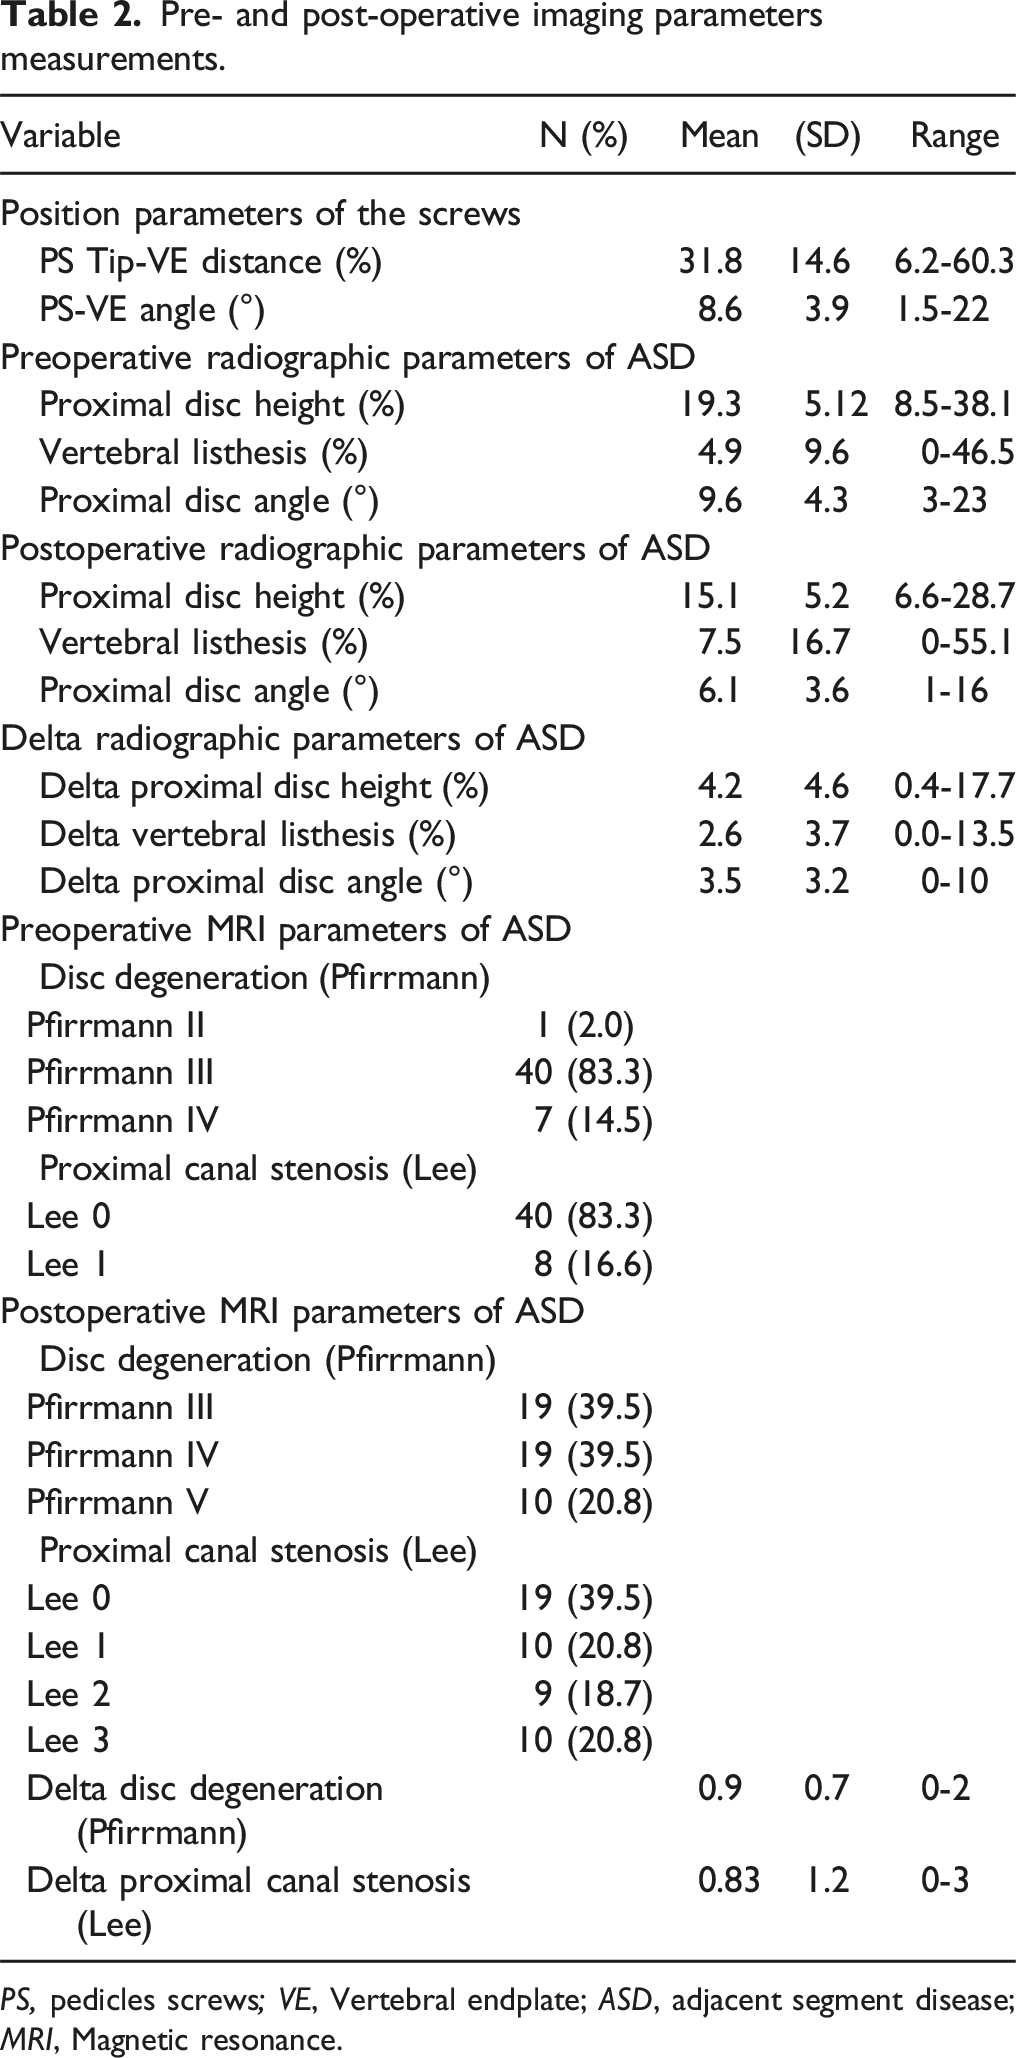
PS, pedicles screws; VE, Vertebral endplate; ASD, adjacent segment disease; MRI, Magnetic resonance.
The correlation analysis between PS tip-VE distance and ASD radiographic parameters were as follows. The correlation analysis of PS tip-VE distance and the radiographic parameters of ASD found no statistically significant correlation concerning vertebral listhesis with a coefficient of −0.23 (P = 0.65, 95% CI −1.3 to 0.8) nor with proximal disc angle with a coefficient of 1.5 (P = 0.07, 95% CI −3 to 0.1) (Figure 4A and B). However, there was a positive correlation with the proximal disc height (P = 0.0001, 95% CI −2.4 to −1) (Figure 4C). For each 1.7% decrease in PS tip-VE distance, there was a 1% decrease in the average proximal disc height. (A) LOWESS graph displaying the association between the PS tip-VE distance and vertebral listhesis, indicating no statistically significant correlation. (B) LOWESS graph displaying the association between the PS tip-VE distance and the proximal disc angle, indicating no statistically significant correlation. (C) LOWESS graph illustrating the association between the PS tip-VE distance and proximal disc height, with a 1.7%/1% ratio. (D) LOWESS graph showing the association between the PS tip-VE distance and the Δ canal stenosis, with a relationship of −8.8% to 1. (E) LOWESS graph showing the association between the PS tip-VE distance and Δ Pfirrmann, with a relationship of −11% to 1.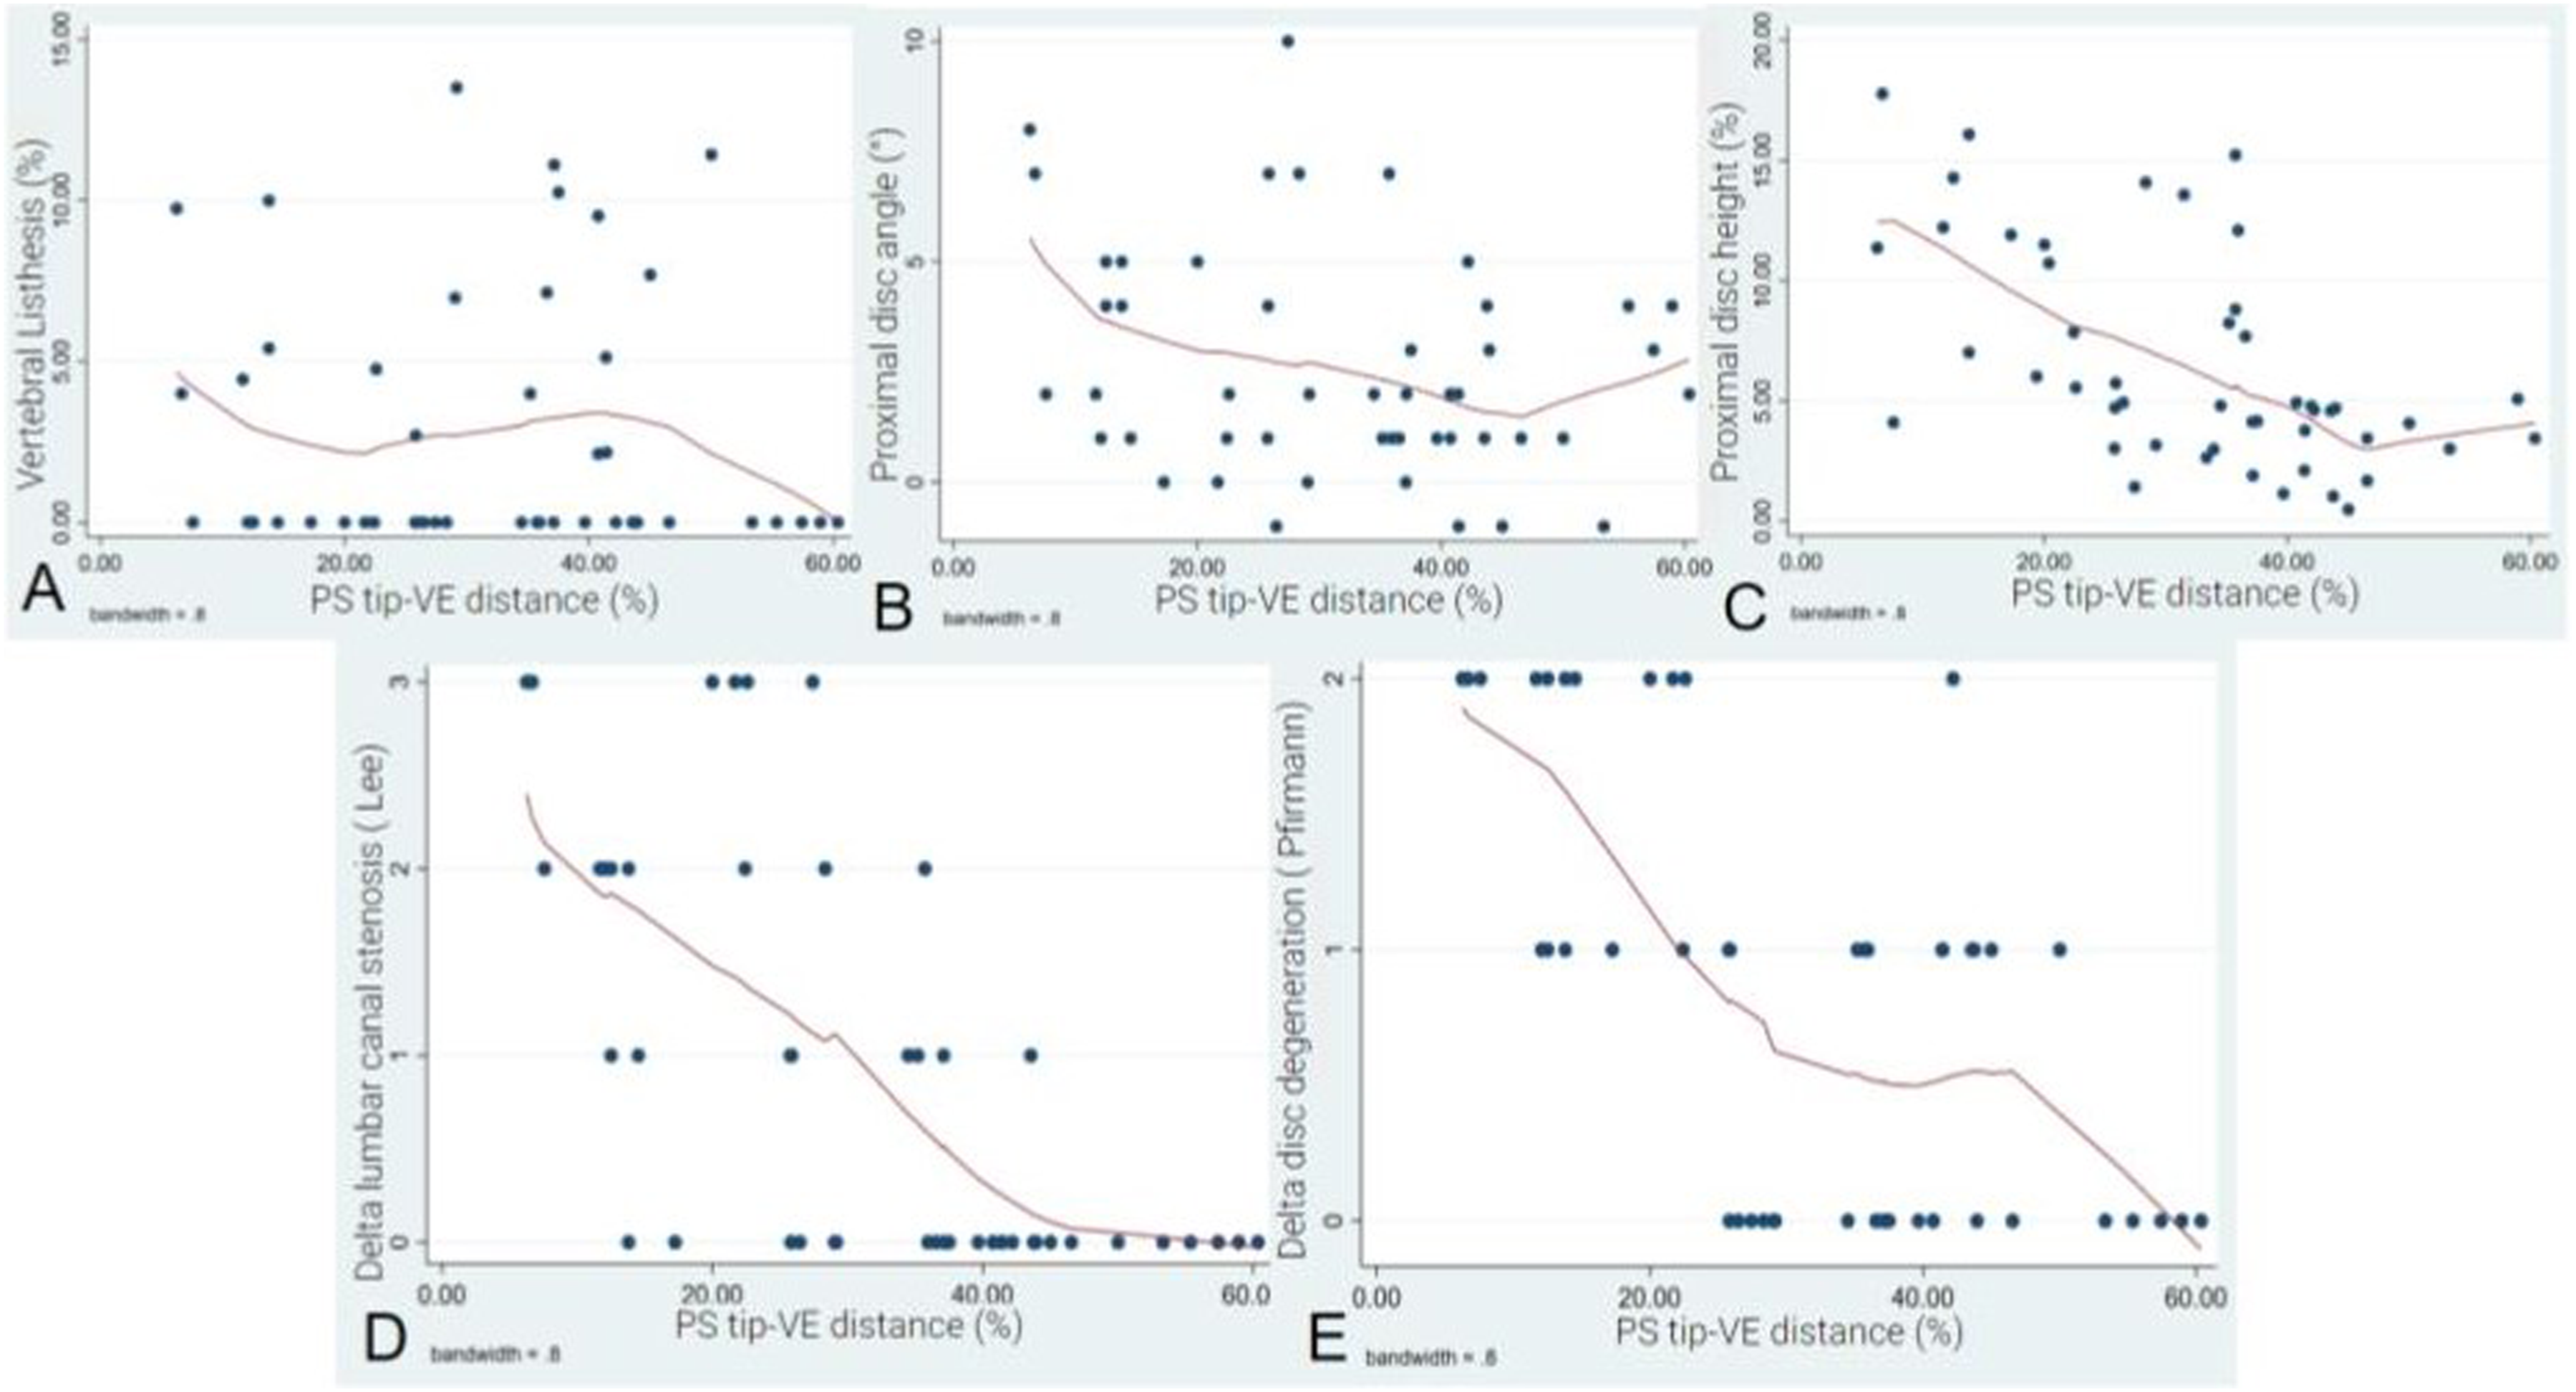
Regarding the Δ proximal lumbar canal stenosis according to Lee et al, our results demonstrate a positive correlation. As the PS tip-VE distance decreased by 8.8% relative to the FIV height, the Δ proximal lumbar canal stenosis increased by 1 point (P = 0.0001, 95% CI −11 to −5%) (Figure 4D). When analyzing the association with the Δ intervertebral disc degeneration according to Pfirrmann et al, it was observed that as the average PS tip-VE distance decreased by 11%, the Δ Pfirrmann grade worsened by 1 category (P = 0.0001, 95% CI −15 to −7) (Figure 4E).
Similarly, no statistically significant correlations were observed between PS-VE angle and vertebral listhesis with a coefficient of 0.02 (P = 0.863, 95% CI −0.3 to 0.3) (Figure 5A) nor proximal disc angle with a coefficient of 0.4 (P = 0.07, 95% CI 0.13 to −1) (Figure 5B). However, correlation regarding Δ proximal disc height showed to be positive. As the average PS-VE angle increased by 0.6% in a convergent direction towards the upper VE, the Δ disc height decreased by 1% (P = 0.0001, 95% CI 0.3 to 0.8) (Figure 5C). (A) LOWESS graph illustrating the association between the PS-VE angle and vertebral listhesis, indicating no statistically significant correlation. (B) LOWESS graph displaying the association between the PS-VE angle and proximal disc angle, indicating no statistically significant correlation. (C) LOWESS graph illustrating the association between the PS-VE angle and proximal disc height, with a 0.6%/1% ratio. (D) LOWESS graph displaying the association between the PS-VE angle and the Δ canal stenosis, with a 2.2°/1 ratio. (E) LOWESS graph illustrating the association between the PS angle and the Δ Pfirrmann grade, with a 2.3°/1 ratio.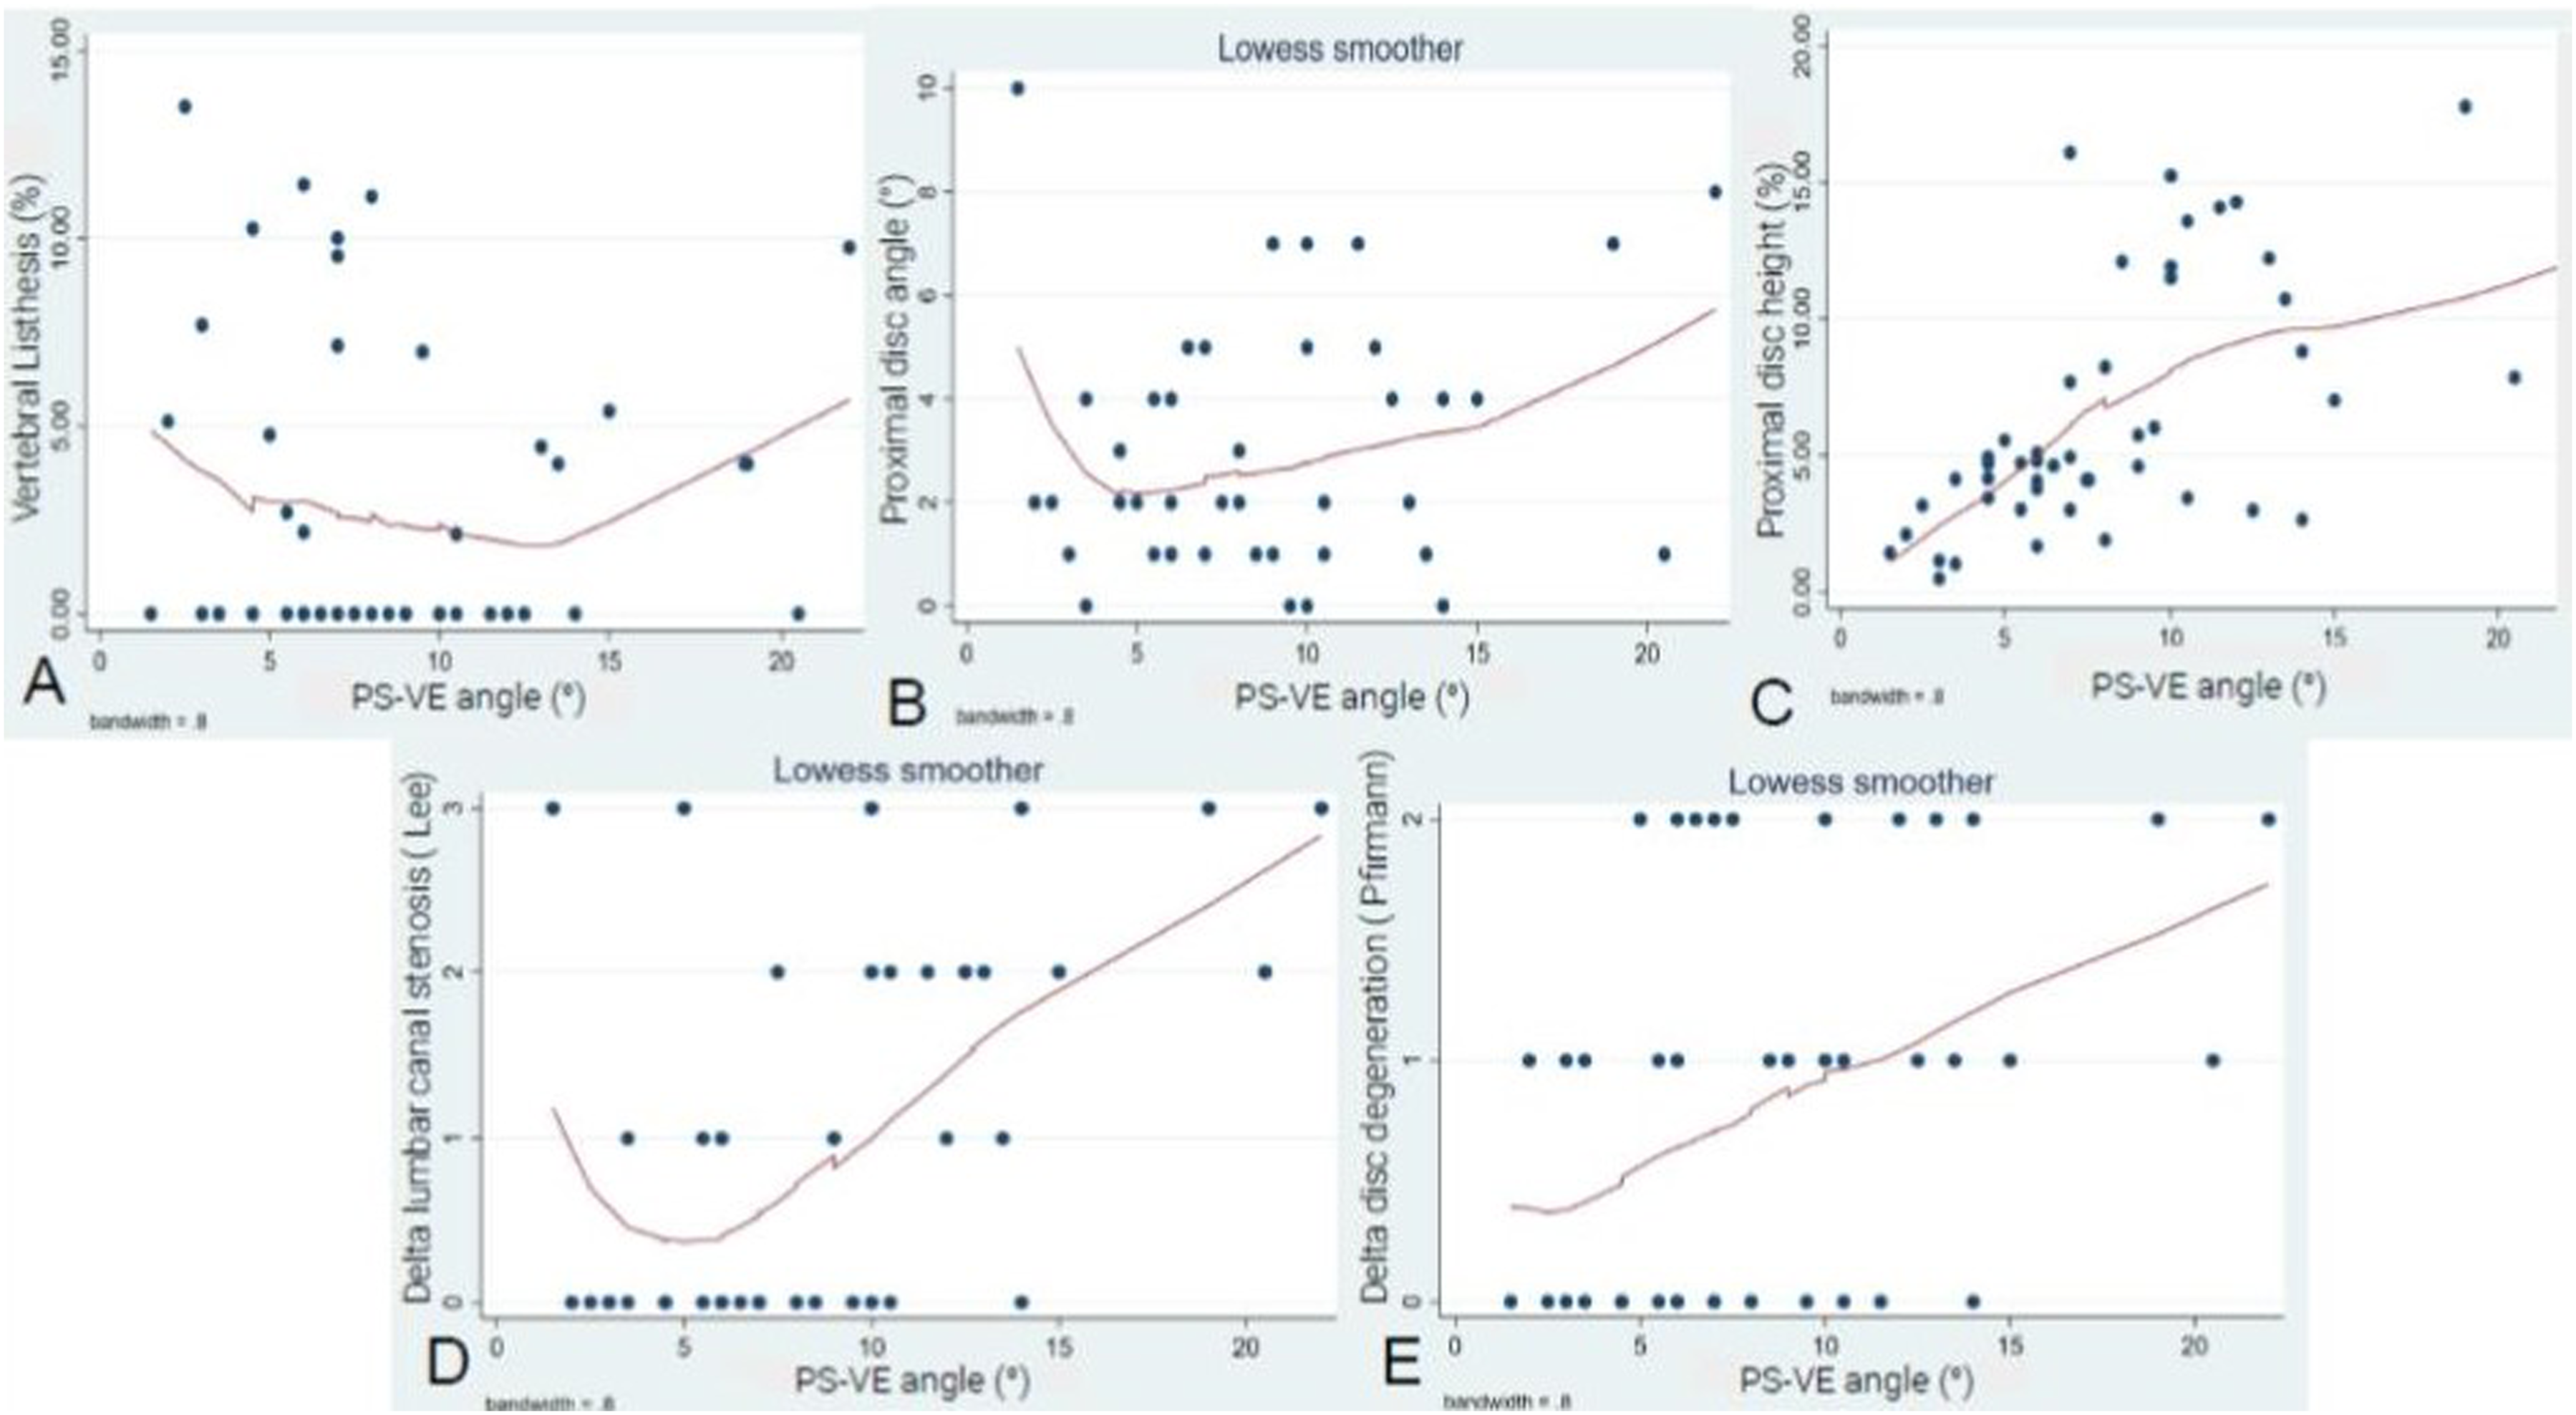
Correlation analysis between PS-VE angle and ASD parameters was positive. Regarding Δ canal stenosis, with each 2.25° increase in the angulation towards the upper VE, the degree of canal stenosis increased by 1 grade according to Lee et al (P = 0.0001, 95% CI 1.1 to 3.3) (Figure 5D). Regarding disc degeneration progression according to Pfirrmann et al, as the average PS-VE angle increased by 2.3°, the Δ Pfirrmann grade tended to rise by 1 grade (P = 0.04, 95% CI 0.7 to 3.9) (Figure 5E).
ROC curve analysis was performed matching these 2 variables (PS tip-VE distance and PS-VE angle) and a ≥2-grade increase in the canal stenosis severity according to Lee et al. The cut-off point for the PS tip-VE distance was calculated at 36% relative to the FIV height (sensitivity 58%, specificity 92%) (Figure 6A). The cut-off value for the PS-VE angle was established at 9.5° (sensitivity 85%, specificity 78%) (Figure 6B). (A) ROC curve resulting in a cutoff point of 36% for the PS tip-VE distance for an increase in canal stenosis grade ≥2° according to Lee et al. (B) ROC curve illustrates a cut-off value for the PS-VE angle of 9.5° for an increase in canal stenosis grade ≥2° according to Lee et al.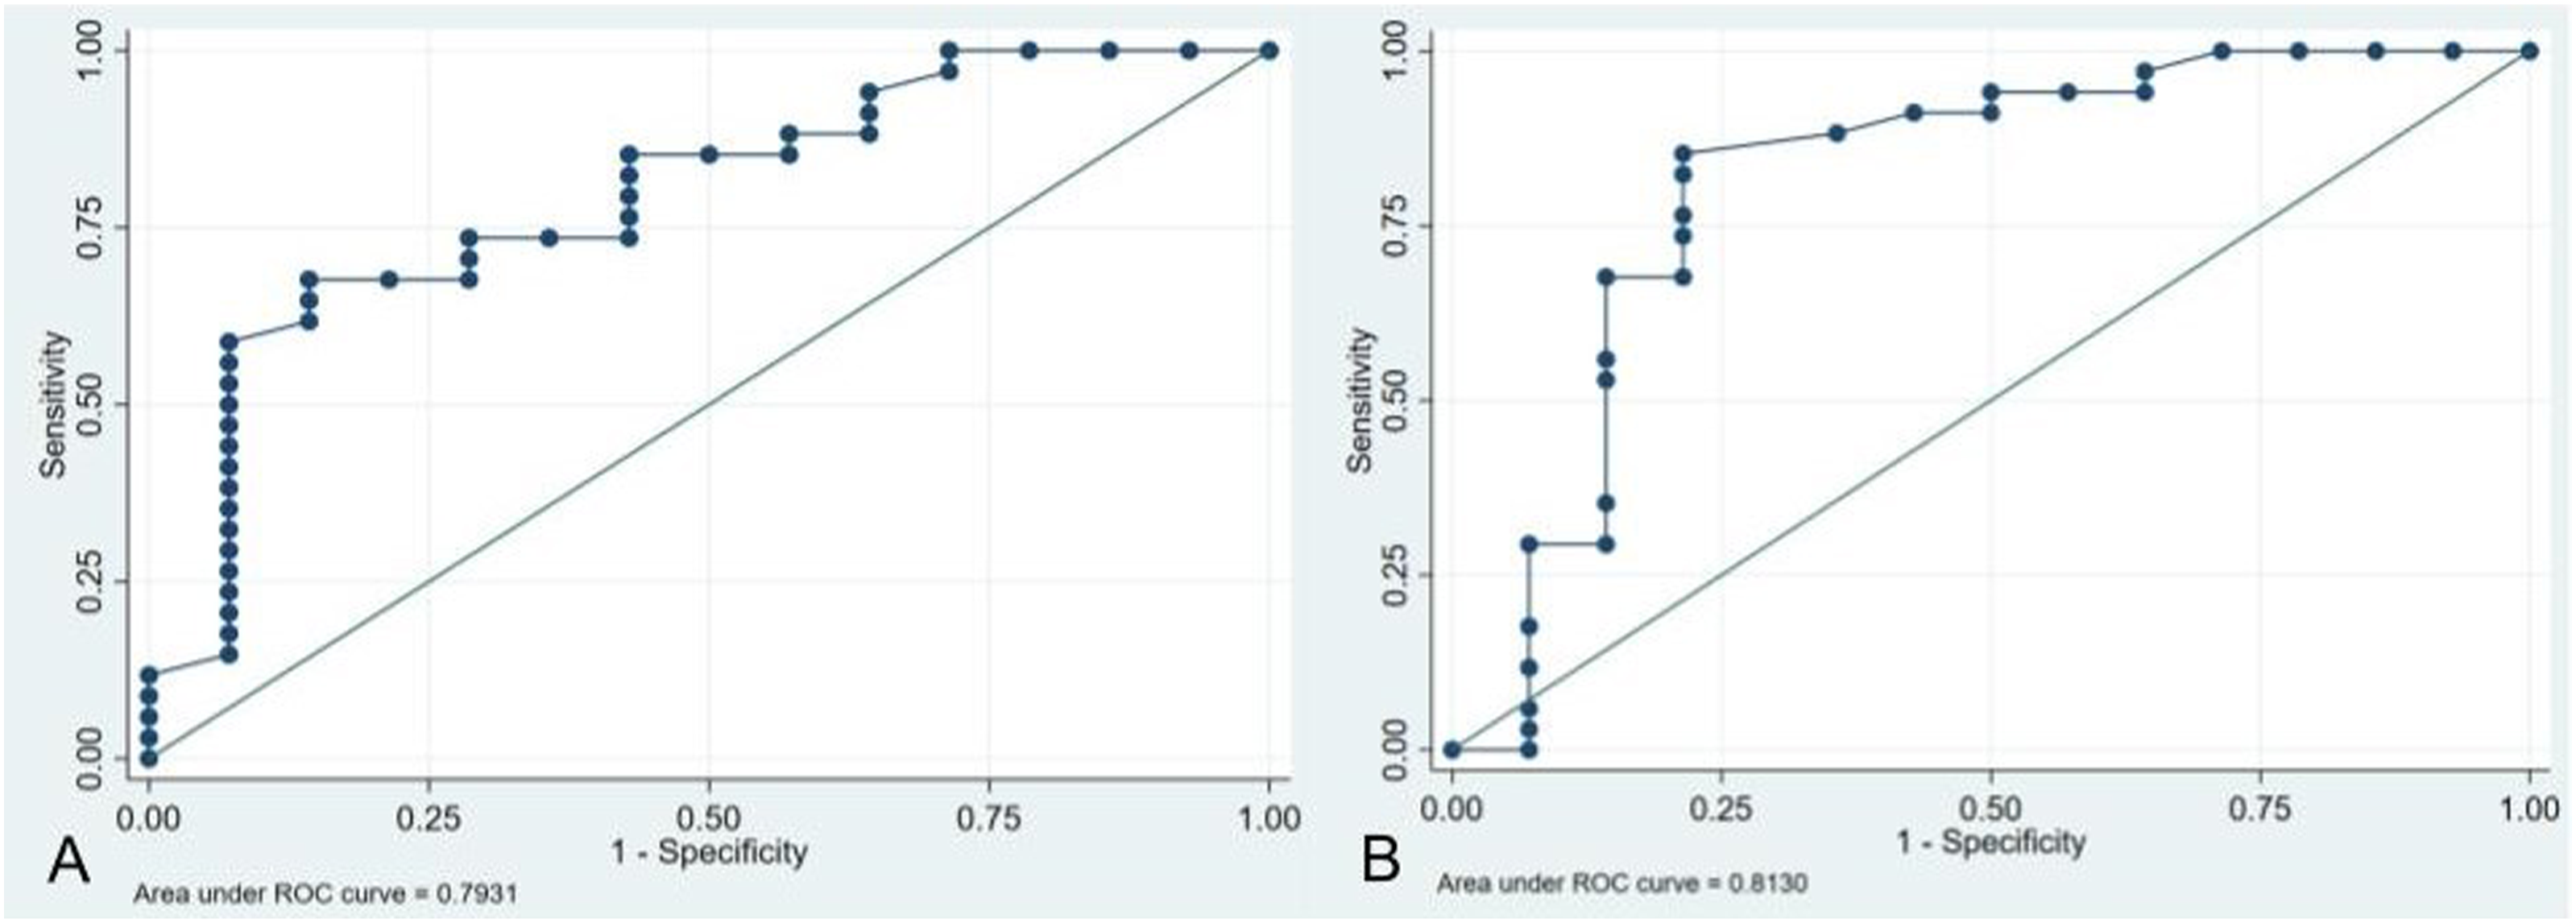
Discussion
Disc degeneration adjacent to a fused area is a frequent consequence at medium- and long-term follow-up after lumbar fusion. A significant number of these cases may require additional interventions if this degeneration becomes symptomatic. Identifying the variables that have a direct influence on ASD development or progression has been 1 of the hot topics of spine surgery in the last decades.
This study showed a positive correlation between PS position and radiological parameters consistent with ASD development or progression at an average 6-year follow-up period following instrumented lumbar spine fusion. These results are categorical, even with a small cohort of patients. On MRI we found that patients undergoing lumbar fusion in whom PS of the FIV were at a shorter distance from the PS tip to the upper VE or cranially oriented towards the upper VE were more likely to develop an increase in canal stenosis and disc degeneration at an average 6-year follow-up period. Radiological parameters, such as proximal disc height, also showed a positive strong linear correlation. However, no statistically significant correlations were found regarding post-operative proximal disc angle and vertebral listhesis. These last 2 results could be explained by the variable behaviour of these parameters in cases of ASD. For instance, ASD can become evident through compensatory retrolisthesis rather than anterolisthesis in the segment above a lumbar fusion. Similarly, not every degenerated segment tends to pinch on a standing X-ray; sometimes discs undergo hyperlordosis attempting to compensate for underlying lumbar hypolordosis.
Literature supports our findings through 2 theories. The mechanical theory explains how a cranially oriented PS angled toward the upper VE increases the force concentration at the PS tip under axial load which can lead to VE sclerosis affecting normal disc nutrition. 21 The vascular theory is based on the finding that PS close to the VE may directly disrupt and harm the nutritional vascular network responsible for disc nutrition and accelerate degenerative changes over time, leading to ASD development or progression.22,23
To our knowledge, by the time the current study was carried out, only 1 study had approached this subject. Wang et al evaluated the incidence of L3-L4 adjacent segment disease in 189 patients who underwent L4-S1 posterolateral fusion at an average 3.5-year follow-up period. 15 The authors concluded that PS with a greater cranial angle and a shorter distance from the PS tip to the upper VE were associated with more post-operative pain and a higher incidence of radiographic ASD. It is worth mentioning that the authors presented a cohort study in which the main outcome was adjacent segment disease, not degeneration. This means that patients in their cohort were symptomatic due to ASD. Our study is mainly based on imaging outcomes. However, the second step of our research will include clinical outcomes. Even though both studies include patients with a minimum 2-year follow-up, the average follow-up period of our study is longer (6.5 vs 3.5 years). The sample number is larger in the Wang et al study (169 vs 48), however, they only analyzed L4-S1 fusion cases, while we have analyzed 4 different fusion levels (L2-S1, L3-S1, L2-L5, and L3-L5), involving fusions from 2 to 4 mobile levels. This particularity increases the sample’s heterogeneity of our results. Pre-and post-operative MRI parameters (Pfirrmann and lumbar canal stenosis grade) measured in our study, were not measured in the study performed by Wang et al. As we stated previously, MRI parameters are more sensitive and specific than radiographic ones, when evaluating ASD. Finally, a main advantage of our study rests in the way we expressed our results. Wang et al expressed the PS tip-VE distance in absolute values measured in millimeters, which is not representative, not only because not every imaging service has calibrated X-rays to make these measurements, but also because an absolute value is not comparable among patients of different sizes. The current study expresses measurements as percentages of another known value specific to each patient, such as the FIV body height. This particular change in the unit of our measurements ensures the applicability of any patient. Other authors have claimed this as a more reliable measurement method. 24
This study has several limitations. First and foremost, the assessed cohort is relatively small and the retrospective nature might introduce bias through patient selection. However, strict inclusion and exclusion criteria were applied to make outcomes as valid as possible. In addition, selection bias could be present since we excluded all patients without MRI follow-up, representing a cohort of patients with theoretically good clinical evolution not requiring MRI control. Finally, ASD has a very complex definition that we are still trying to understand and specify, in which multiple variables have been described related to its development and progression including the number of fused levels, region of fusion, pre- and post-operative sagittal vertebral alignment, pre-operative proximal disc status, facet orientation and lesion during the procedure, age, sex, and BMI among others. Isolating these variables and assessing PS position from the entire spectrum of factors involved in this event is challenging. In this regard, proximal facet violation or damage during the procedure can not be properly assessed, since this information is not usually recorded in surgical procedure descriptions. Moreover, PS length, VE violation or PS reposition during surgeries are not usually recorded and it may be impossible to determine by imaging analysis.
Conclusions
The cranial orientation of the PS in the FIV and a shorter distance from the PS tip to the VE positively correlated with the progression of MR and radiological variables related to ASD. Protective values of these measurements against lumbar canal stenosis progression were calculated at a cut-off point of ≥36% for the PS tip-VE distance relative to the FIV height and ≤9.5° of PS angulation relative to the upper VE.
Footnotes
Declaration of Conflicting Interests
The author(s) declared no potential conflicts of interest with respect to the research, authorship, and/or publication of this article.
Funding
The author(s) received no financial support for the research, authorship, and/or publication of this article.