
Abstract
Study Design
Retrospective cohort study.
Objectives
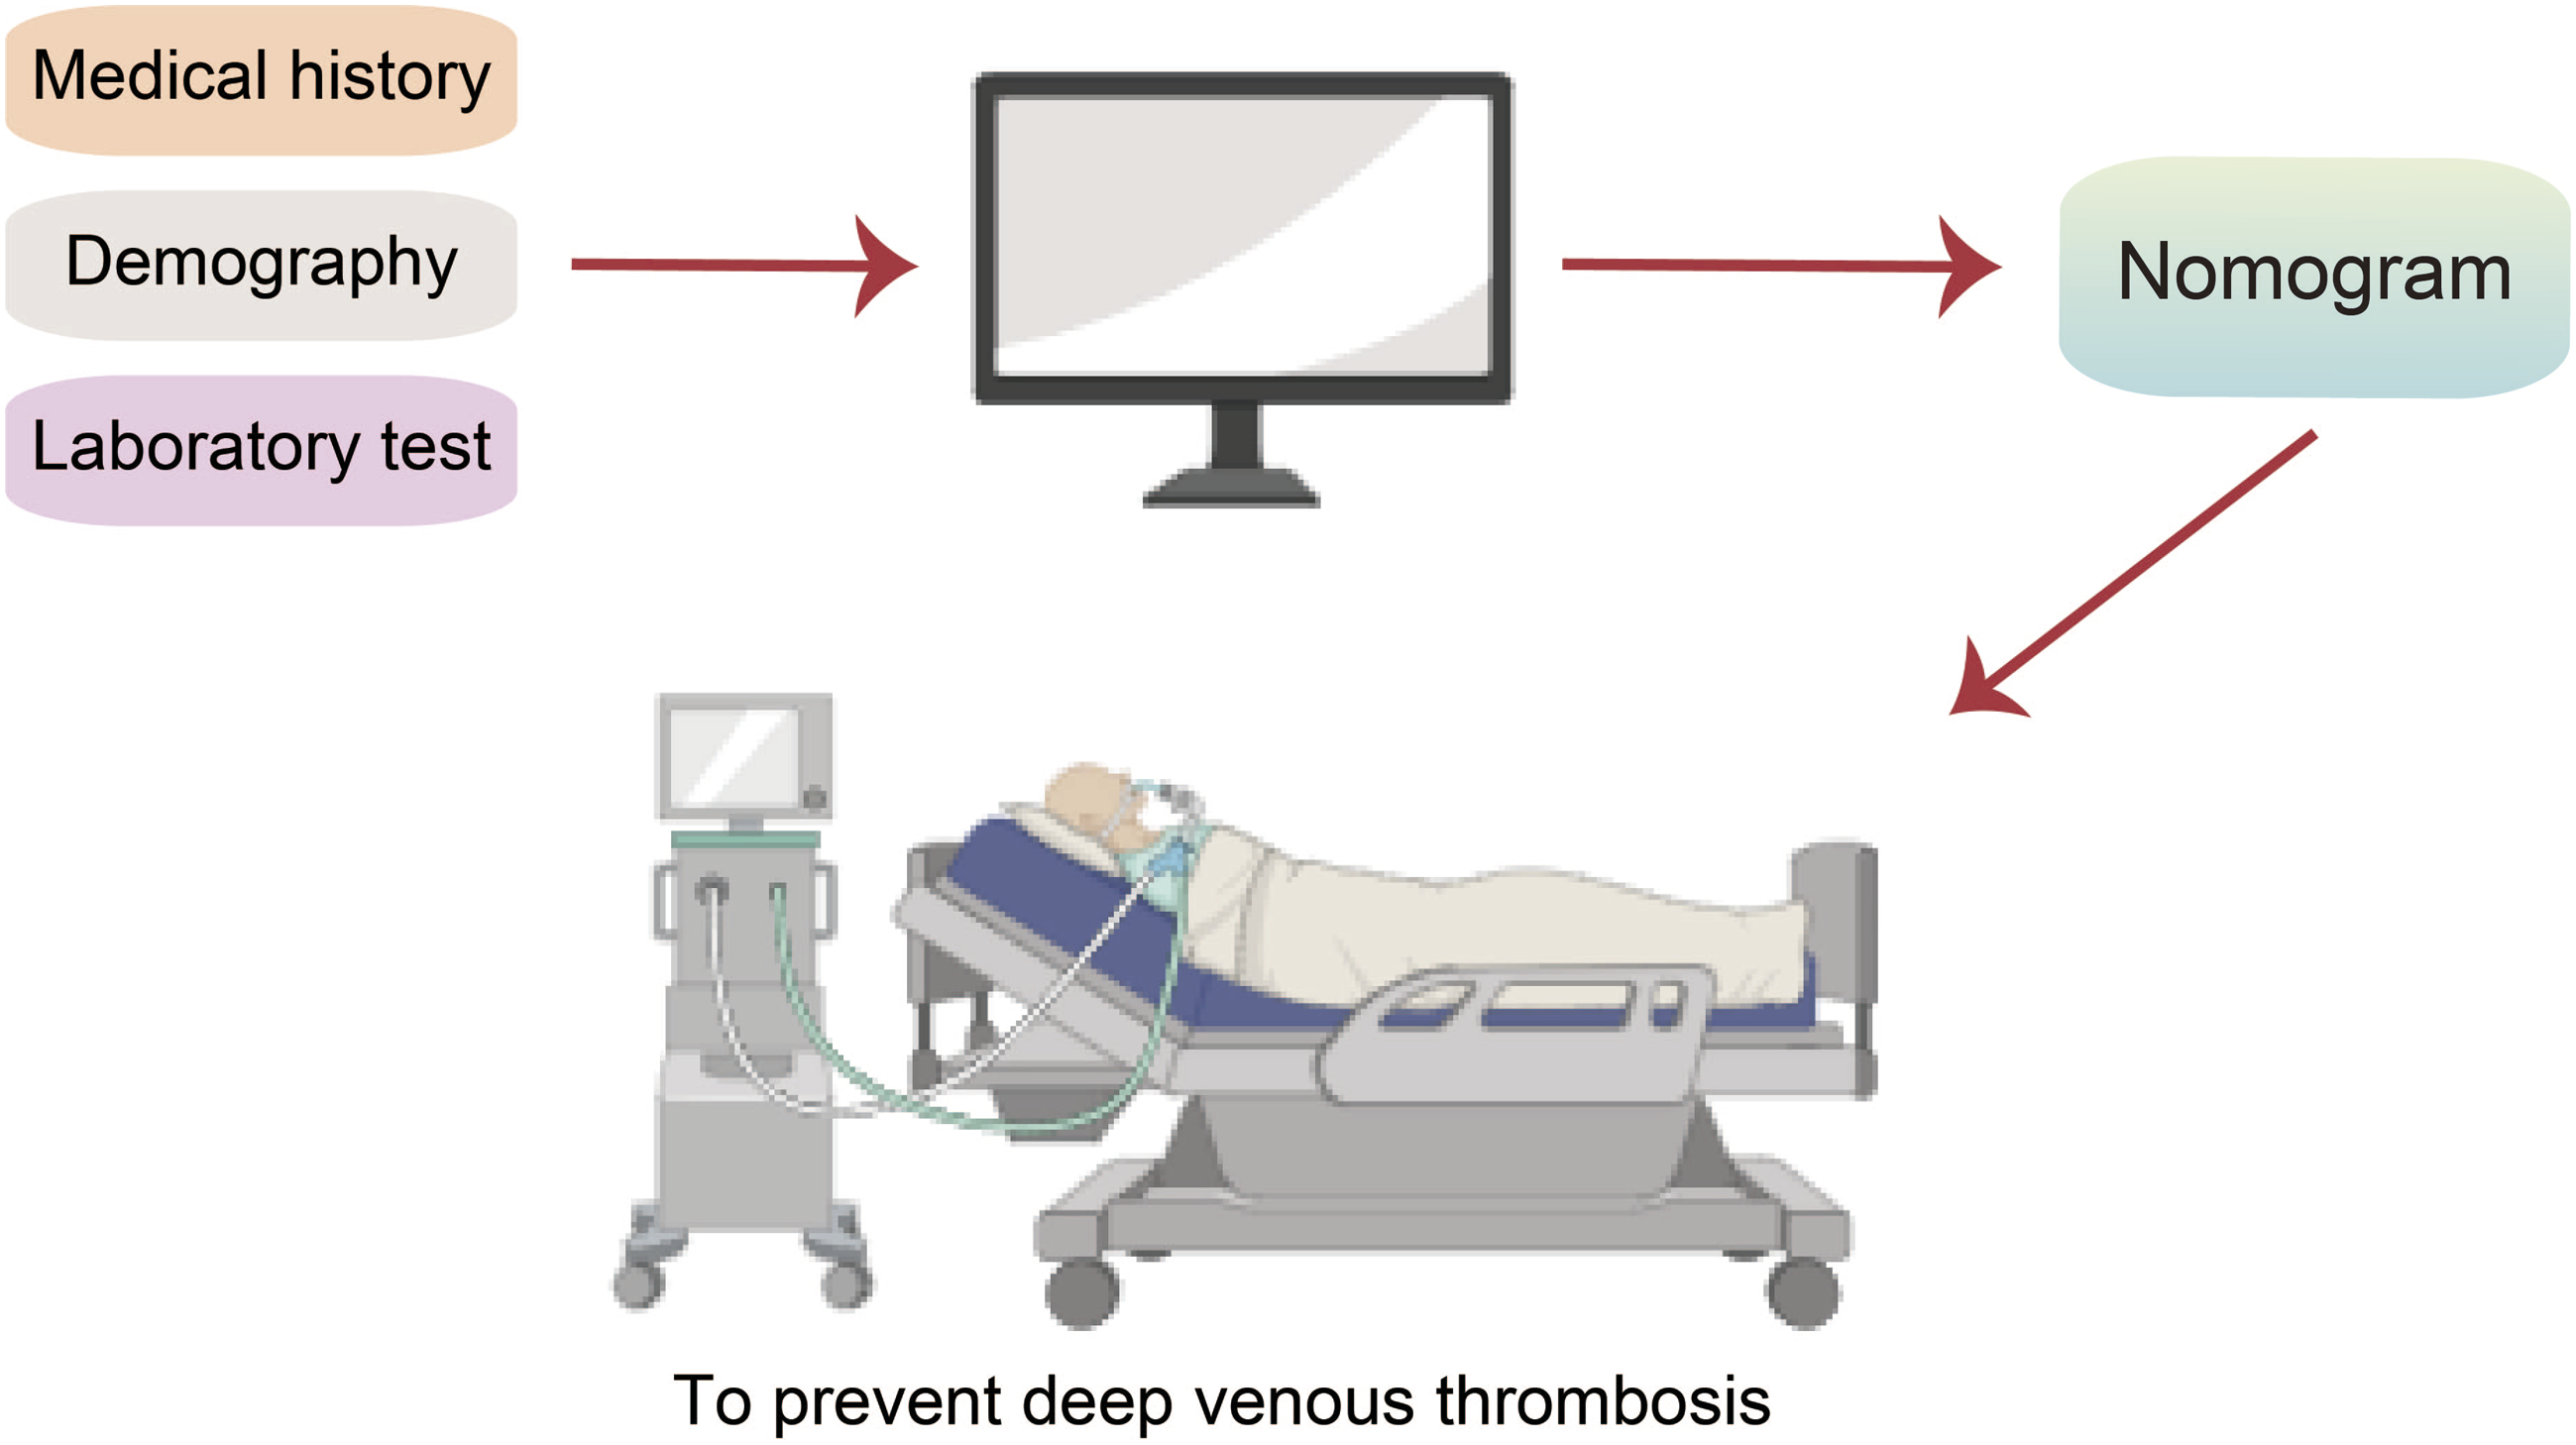
Deep venous thrombosis (DVT) is a common complication following lumbar spine surgery, which can lead to adverse consequences such as venous thromboembolism and pulmonary embolism. This study aimed to investigate whether predictors of DVT can improve clinical interventions.
Methods
The study included patients who underwent posterior lumbar fusion between 2012 and 2022. In the training cohort, stepwise logistic regression, based on the Akaike information criterion minimum, was used to identify variables for constructing the nomogram. The nomogram was evaluated and validated using calibration curves, Brier scores, receiver operating characteristic (ROC) curves, C-index, decision curve analyses (DCAs), clinical impact curves (CICs), and risk stratification analyses.
Results
A total of 9216 patients were enrolled after screening. The nomogram included seven variables: cerebrovascular disease, diabetes, body mass index, age, pedicular screw quantity, D-dimer, and hypertension. Calibration plots demonstrated favorable agreement between predicted and observed probabilities. The C-index indicated satisfactory discriminatory ability of the nomogram (0.772 for the training cohort and 0.792 for the validation cohort). Additionally, the DCA and CIC revealed that the nomogram could provide clinical benefits for patients.
Conclusions
This study successfully developed and validated a nomogram that can assess the risk of DVT following posterior lumbar fusion. The nomogram will assist surgeons in making informed clinical decisions.
Introduction
Degenerative lumbar spine disease is a prevalent orthopedic condition that presents a significant public health concern. Posterior lumbar fusion (PLF) has become a commonly utilized treatment method.1,2 Despite notable advancements in both surgical techniques and clinical experience, deep venous thrombosis (DVT) remains a frequent complication.3,4 Left untreated, DVT can lead to further complications such as venous thromboembolism, pulmonary embolism, stroke, or even sudden death. 5 Indeed, venous thromboembolism caused by DVT has now emerged as the third leading cause of death in hospital settings and is the most preventable cause of hospital mortality. 6 However, the exact incidence of DVT after spine surgery remains unclear, with reported rates ranging from 0.3% to 31%. 7 Various independent risk factors for post-surgical DVT have been reported, 8 yet no comprehensive and feasible risk identification tool has been reported to aid in clinical practice.
A nomogram is a novel tool that has emerged in recent years. It proves useful in diagnosing or predicting the onset and progression of diseases with multifactorial combinations. The key strength of nomograms lies in their ability to visually represent the risk of outcome events, making them highly applicable in clinical settings. Nomograms have found extensive usage in predicting oncological outcomes, yielding satisfactory results. 9 Notably, their value has also been recognized in non-oncological diseases like COVID-19. 10 However, to the best of our knowledge, nomograms have yet to be utilized for assess the DVT risk following PLF.
The objective of this study was to develop and validate a nomogram to aid in clinical practice. This tool would assist surgeons in identifying patients at a higher risk of DVT after PLF in a more targeted manner. By doing so, it would improve patient prognosis and reduce costs associated with complications. In summary, our goal was to proactively prevent the occurrence of DVT.
Methods and Materials
Study Design and Ethical Statement
This study is retrospective in nature. The training cohort was comprised of data from one institution, while the data from another institution formed the validation cohort.
Patients who underwent PLF for lumbar spine disease between January 1, 2012, and April 1, 2023, were included in the study. Exclusion criteria included patients with trauma, tumor, or infection; a history of DVT; patients who underwent multiple procedures during a single hospitalization; and individuals under the age of 18. Due to the collection of de-identified data, there was no risk to the participants. Consequently, formal patient consent was not required in accordance with the 1964 Declaration of Helsinki and its subsequent amendments. The research ethics committee of our institution approved this study (No. KYLL-202204-074-1).
Research Procedures
A total of 28 parameters were collected, including demographic information (sex, age, etc.), medical history, preoperative laboratory tests (blood routine, lipid levels, coagulation, liver and kidney function, etc.), and the quantity of pedicular screws. These factors were chosen based on previous studies and the clinical expertise of the investigators.11,12
The primary outcome event in the model was the development of DVT after surgery. All patients underwent a routine physical examination and ultrasound after the surgical procedure and before being discharged to confirm the presence of DVT. Moreover, all patients received physical preventive measures, such as wearing elastic stockings, both immediately after the surgery and during the postoperative period. Patients received pharmacological prophylaxis were excluded from this study.
Statistical Analysis
Categorical variables were presented as percentages of patients, while means and standard deviations were used to describe continuous variables. In the training cohort, a stepwise logistic regression analysis was conducted, utilizing the minimum Akaike information criterion (AIC), to identify variables to be included in the nomogram. 9
The nomogram was evaluated using calibration curve, Brier score, receiver operating characteristic (ROC) curve, C-index, decision curve analysis (DCA), and clinical impact curve (CIC). The Brier score, which combines calibration and discrimination, was employed as it presents an improvement over other statistical performance metrics, with smaller scores indicating better model performance.13,14 These analyses were repeated in the validation cohort.
A significance level of P < 0.001 was employed in the logistic regression to identify convincing predictors of DVT. For other analyses, a threshold of P < 0.05 was deemed statistically significant. All statistical analyses were conducted using R language and environment (version 4.3.1).
Results
Patient Characteristics
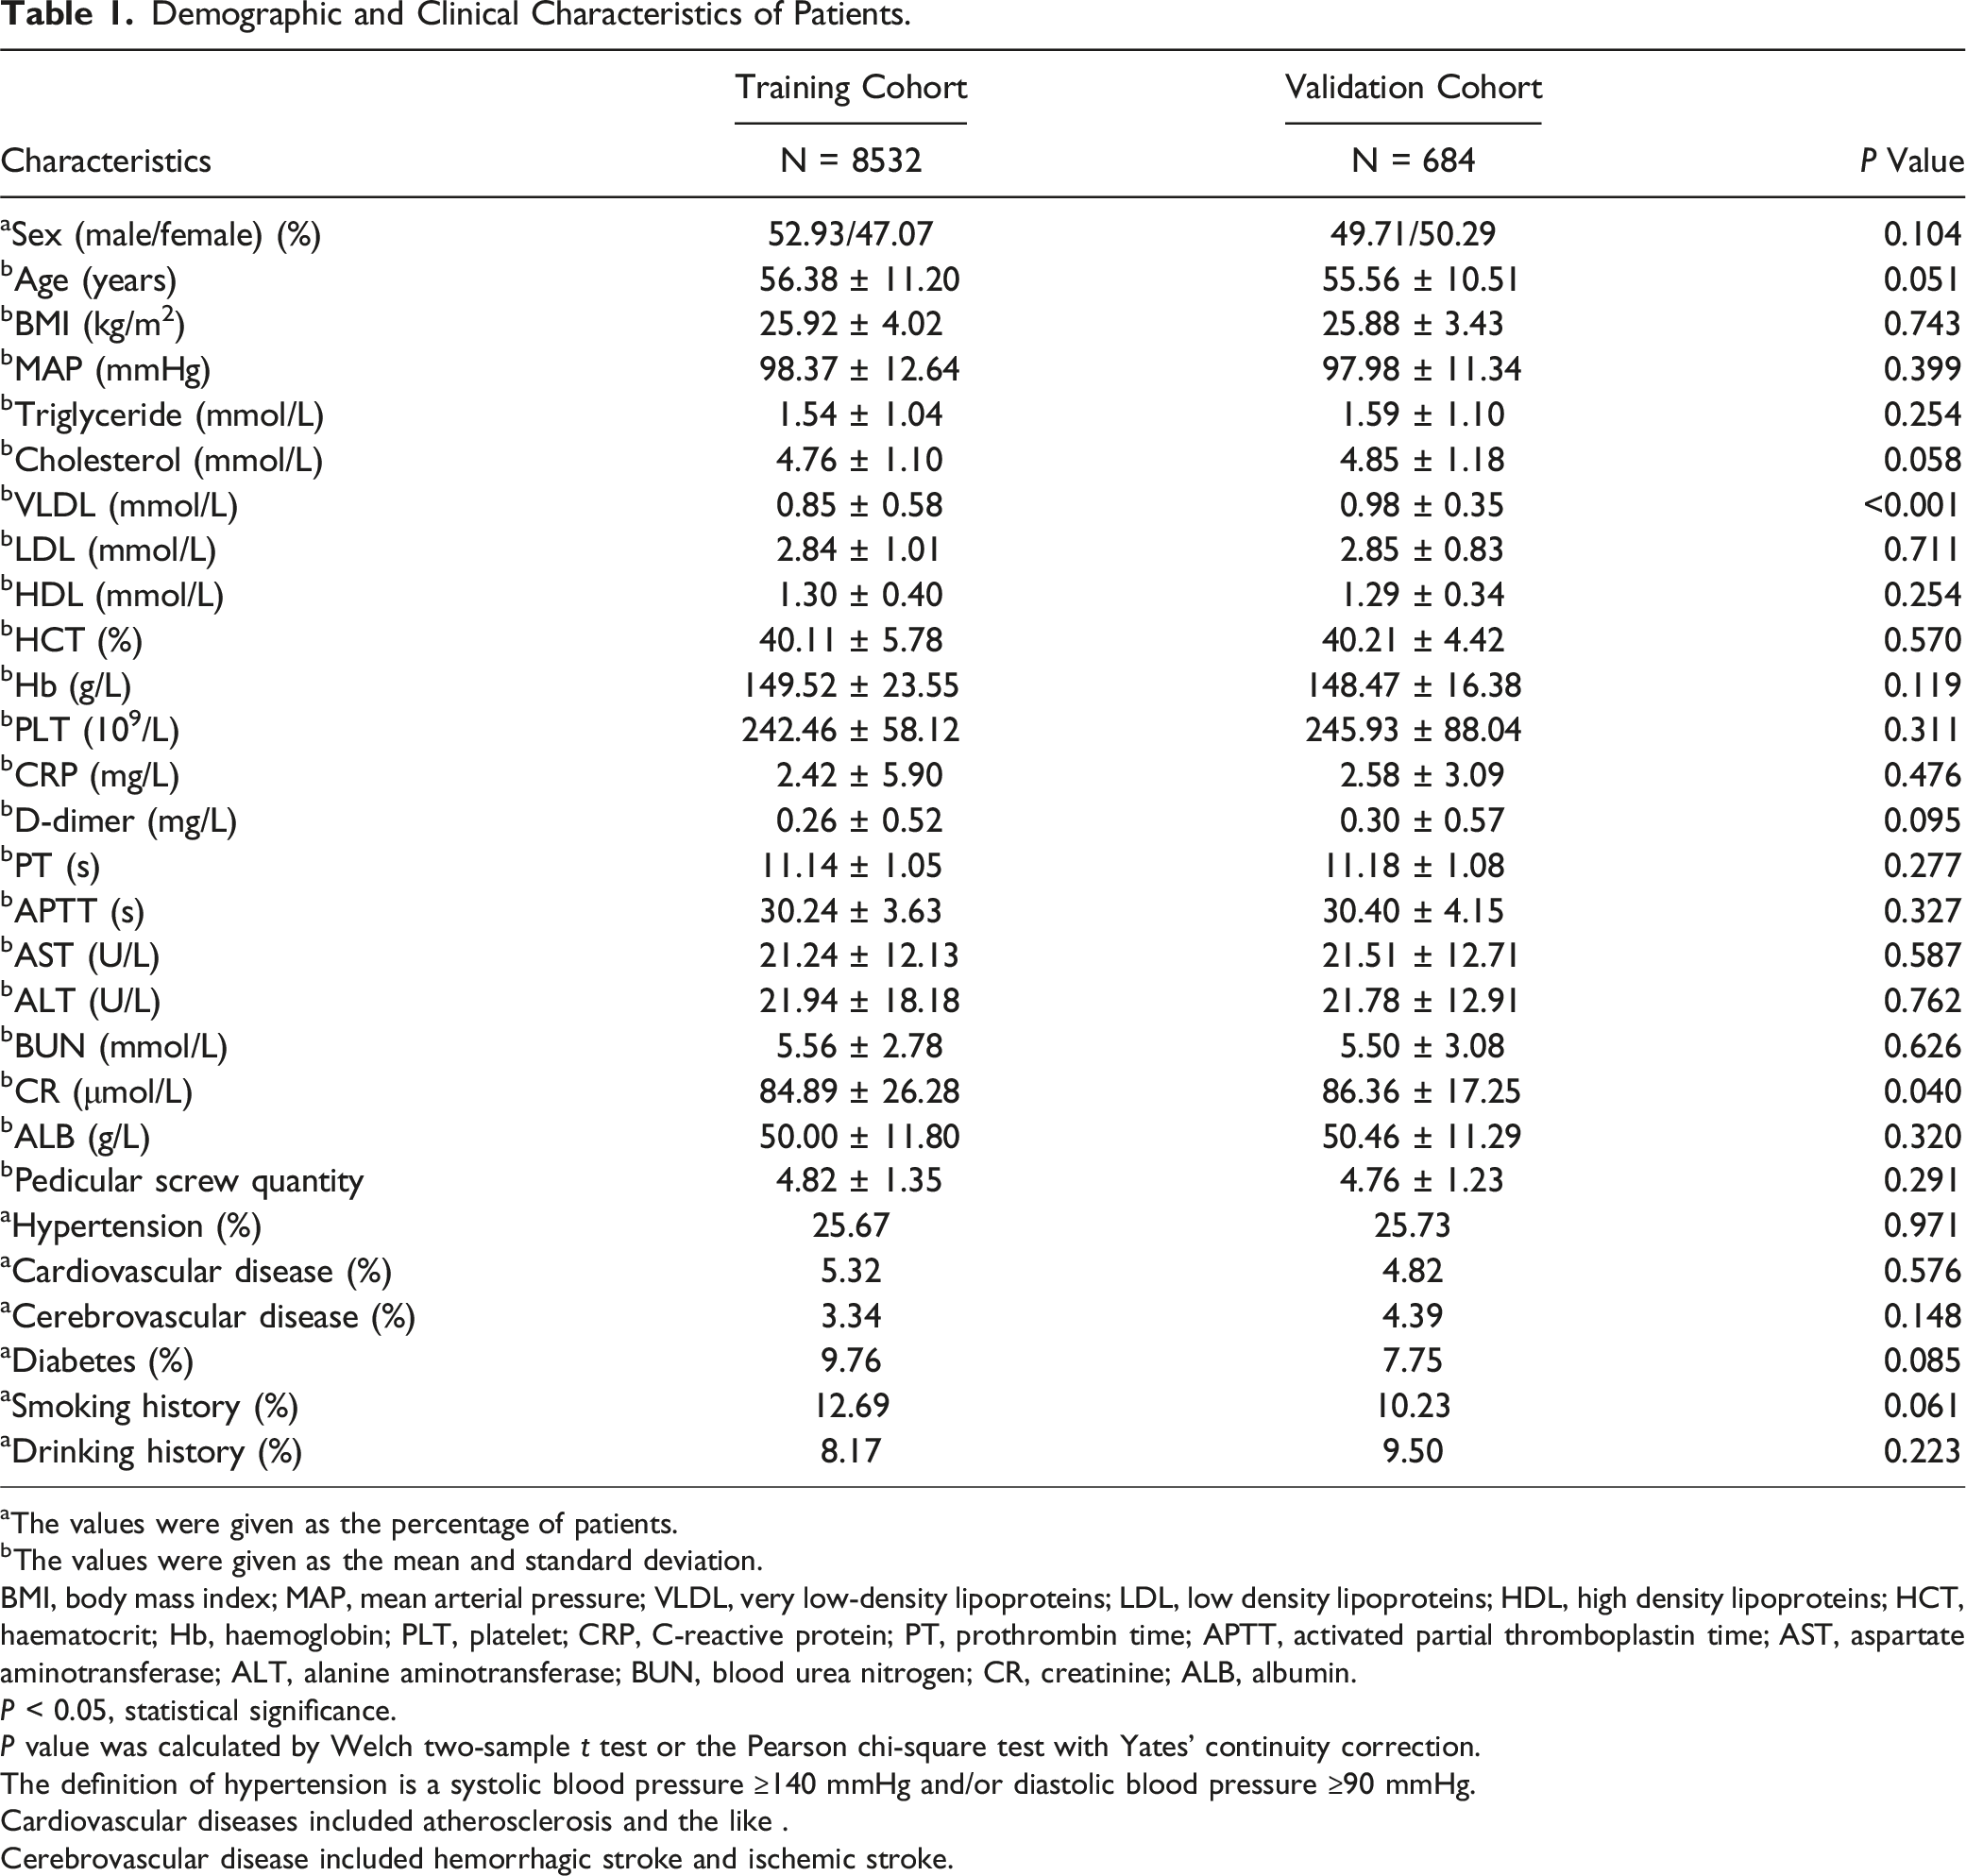
A total of 9216 patients were enrolled after screening. The development cohort consisted of 8532 patients, and the validation cohort included 684 patients (Figure 1). In the training cohort, DVT occurred in 495 patients and in the validation cohort, 65 patients. There were almost no significant differences in the demographic and clinical characteristics between the two cohorts (P > 0.05) (Table 1). Therefore, they were considered statistically equivalent. Flow diagram of study design. ROC, receiver operating characteristic; DCA, decision curve analysis; CIC, clinical impact curve. Demographic and Clinical Characteristics of Patients. aThe values were given as the percentage of patients. bThe values were given as the mean and standard deviation. BMI, body mass index; MAP, mean arterial pressure; VLDL, very low-density lipoproteins; LDL, low density lipoproteins; HDL, high density lipoproteins; HCT, haematocrit; Hb, haemoglobin; PLT, platelet; CRP, C-reactive protein; PT, prothrombin time; APTT, activated partial thromboplastin time; AST, aspartate aminotransferase; ALT, alanine aminotransferase; BUN, blood urea nitrogen; CR, creatinine; ALB, albumin. P < 0.05, statistical significance. P value was calculated by Welch two-sample t test or the Pearson chi-square test with Yates’ continuity correction. The definition of hypertension is a systolic blood pressure ≥140 mmHg and/or diastolic blood pressure ≥90 mmHg. Cardiovascular diseases included atherosclerosis and the like . Cerebrovascular disease included hemorrhagic stroke and ischemic stroke.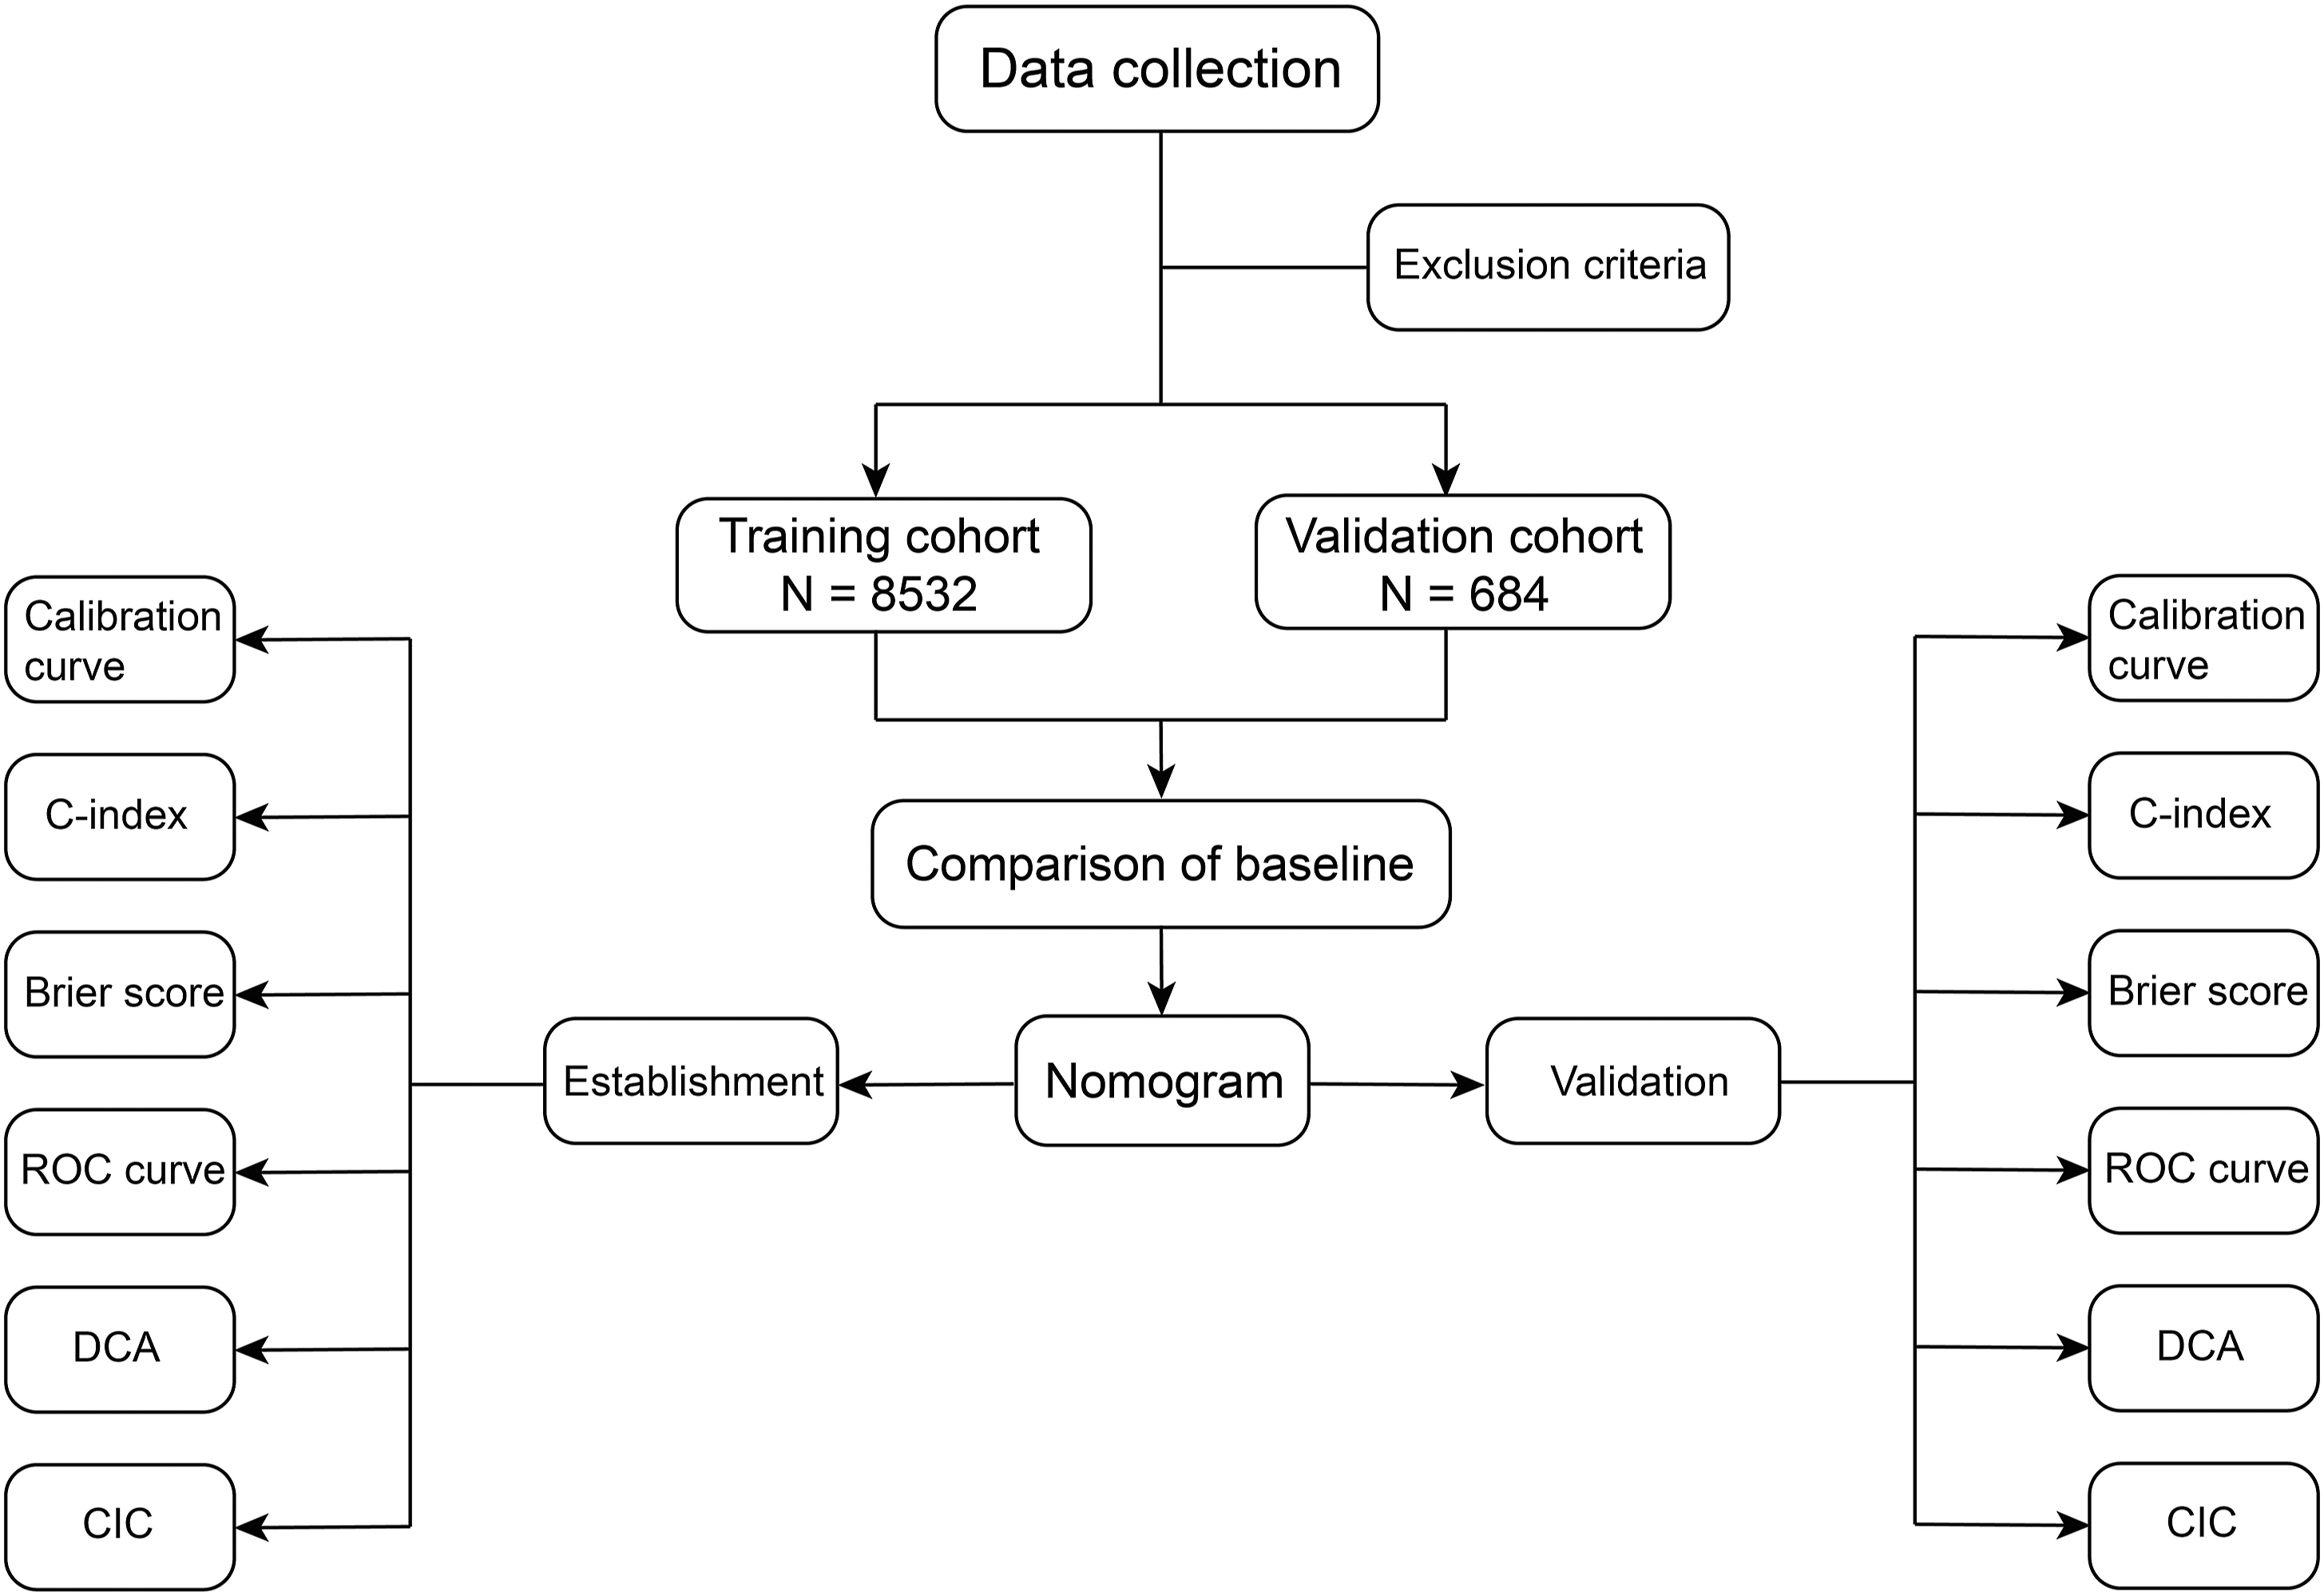
Variables Screening
The stepwise logistic regression analysis revealed that the model incorporating age, body mass index (BMI), D-dimer, aspartate aminotransferase, blood urea nitrogen, pedicular screw quantity, hypertension, cardiovascular disease, cerebrovascular disease, diabetes, and sex exhibited the significantly lowest AIC value within the training cohort.
The Predictors for the Risk of Venous Thromboembolism.
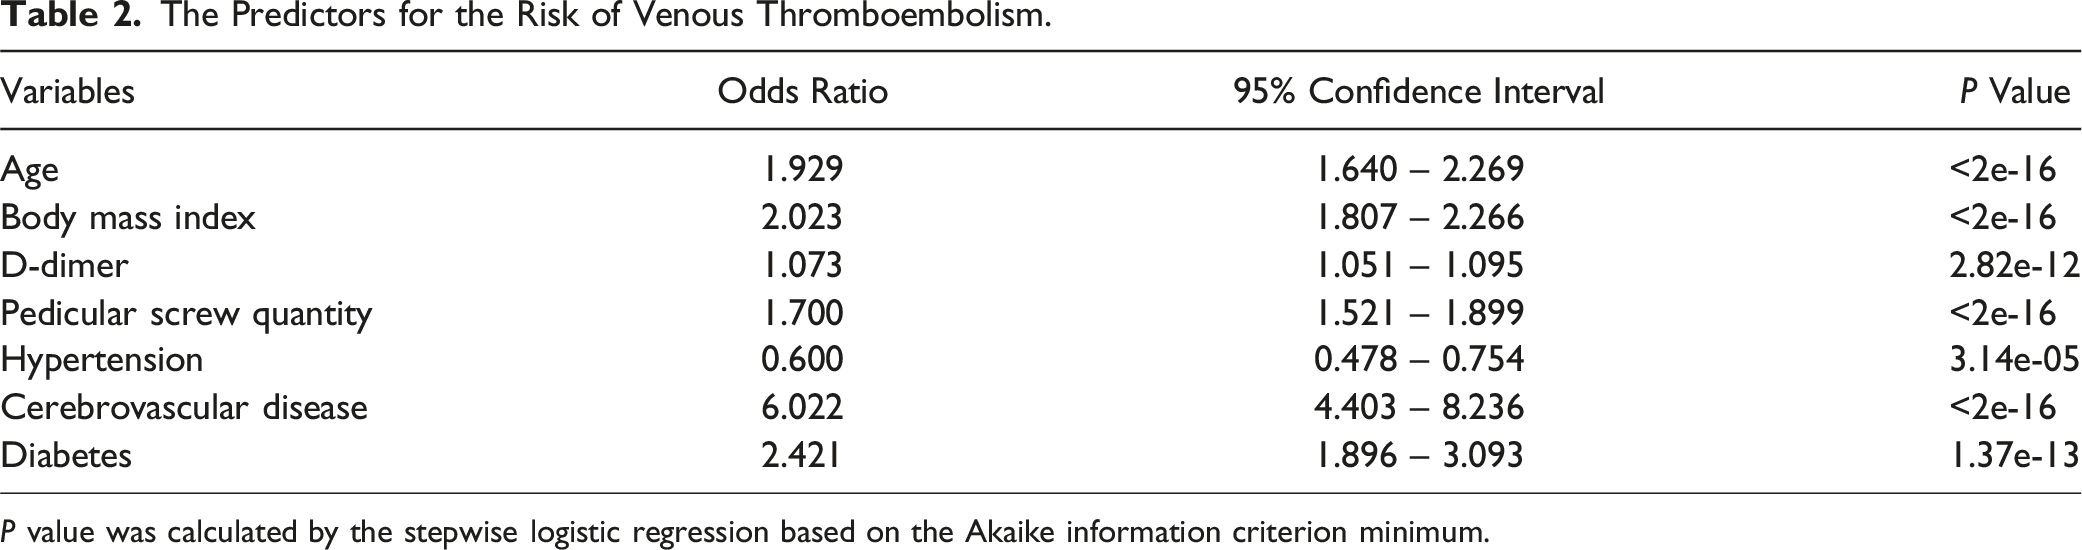
P value was calculated by the stepwise logistic regression based on the Akaike information criterion minimum.
Nomogram Construction and Validation
Based on the factors identified above, we constructed a nomogram (Figure 2). The factors ranked by the absolute value of the coefficient (Coef) along the nomogram scales were cerebrovascular disease (Coef: 1.80), diabetes (Coef: 0.88), hypertension (Coef: −0.51), D-dimer (Coef: 0.37), pedicular screw quantity (Coef: 0.27), BMI (Coef: 0.14), and age (Coef: 0.04). Subsequently, we evaluated and validated the performance of the nomogram in both the training and validation cohorts (Figure 3). Nomogram to assess the risk of venous thromboembolism. BMI, body mass index. Evaluation of the nomogram. Calibration curves, Brier score, receiver operating characteristic curves, C-index, decision curve analysis and clinical impact curves for training cohort (A - D) and validation cohort (E - H).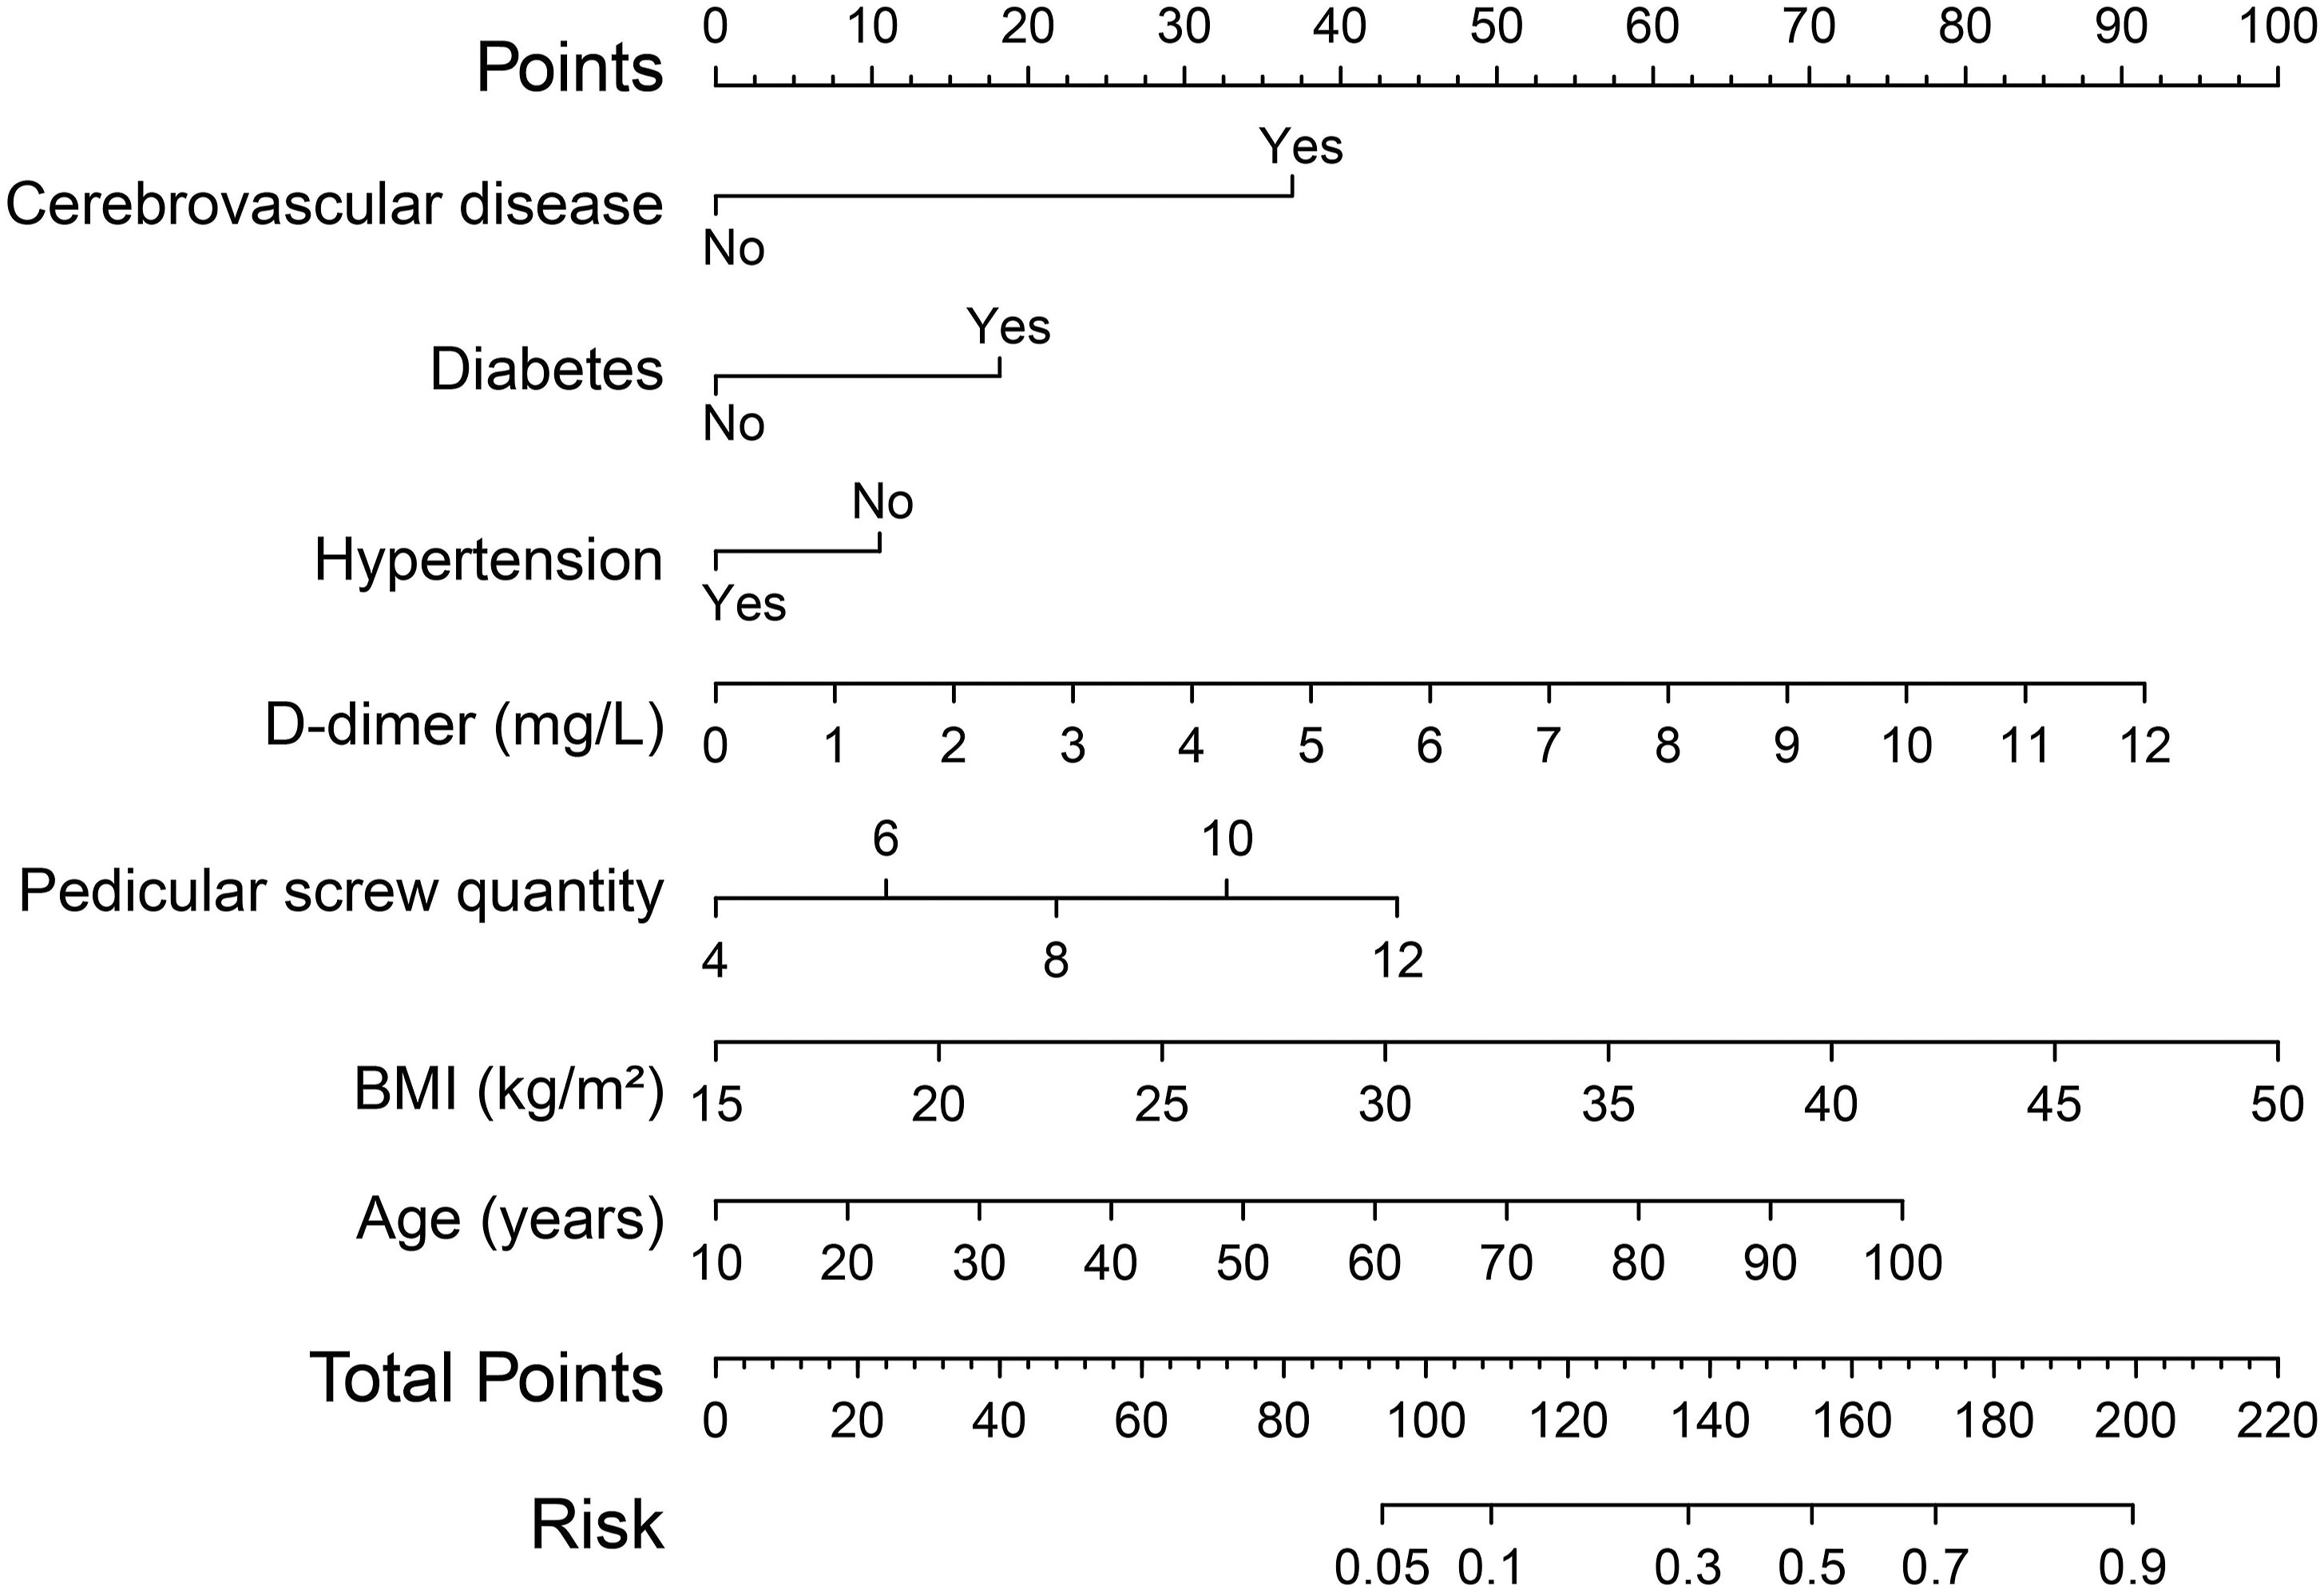
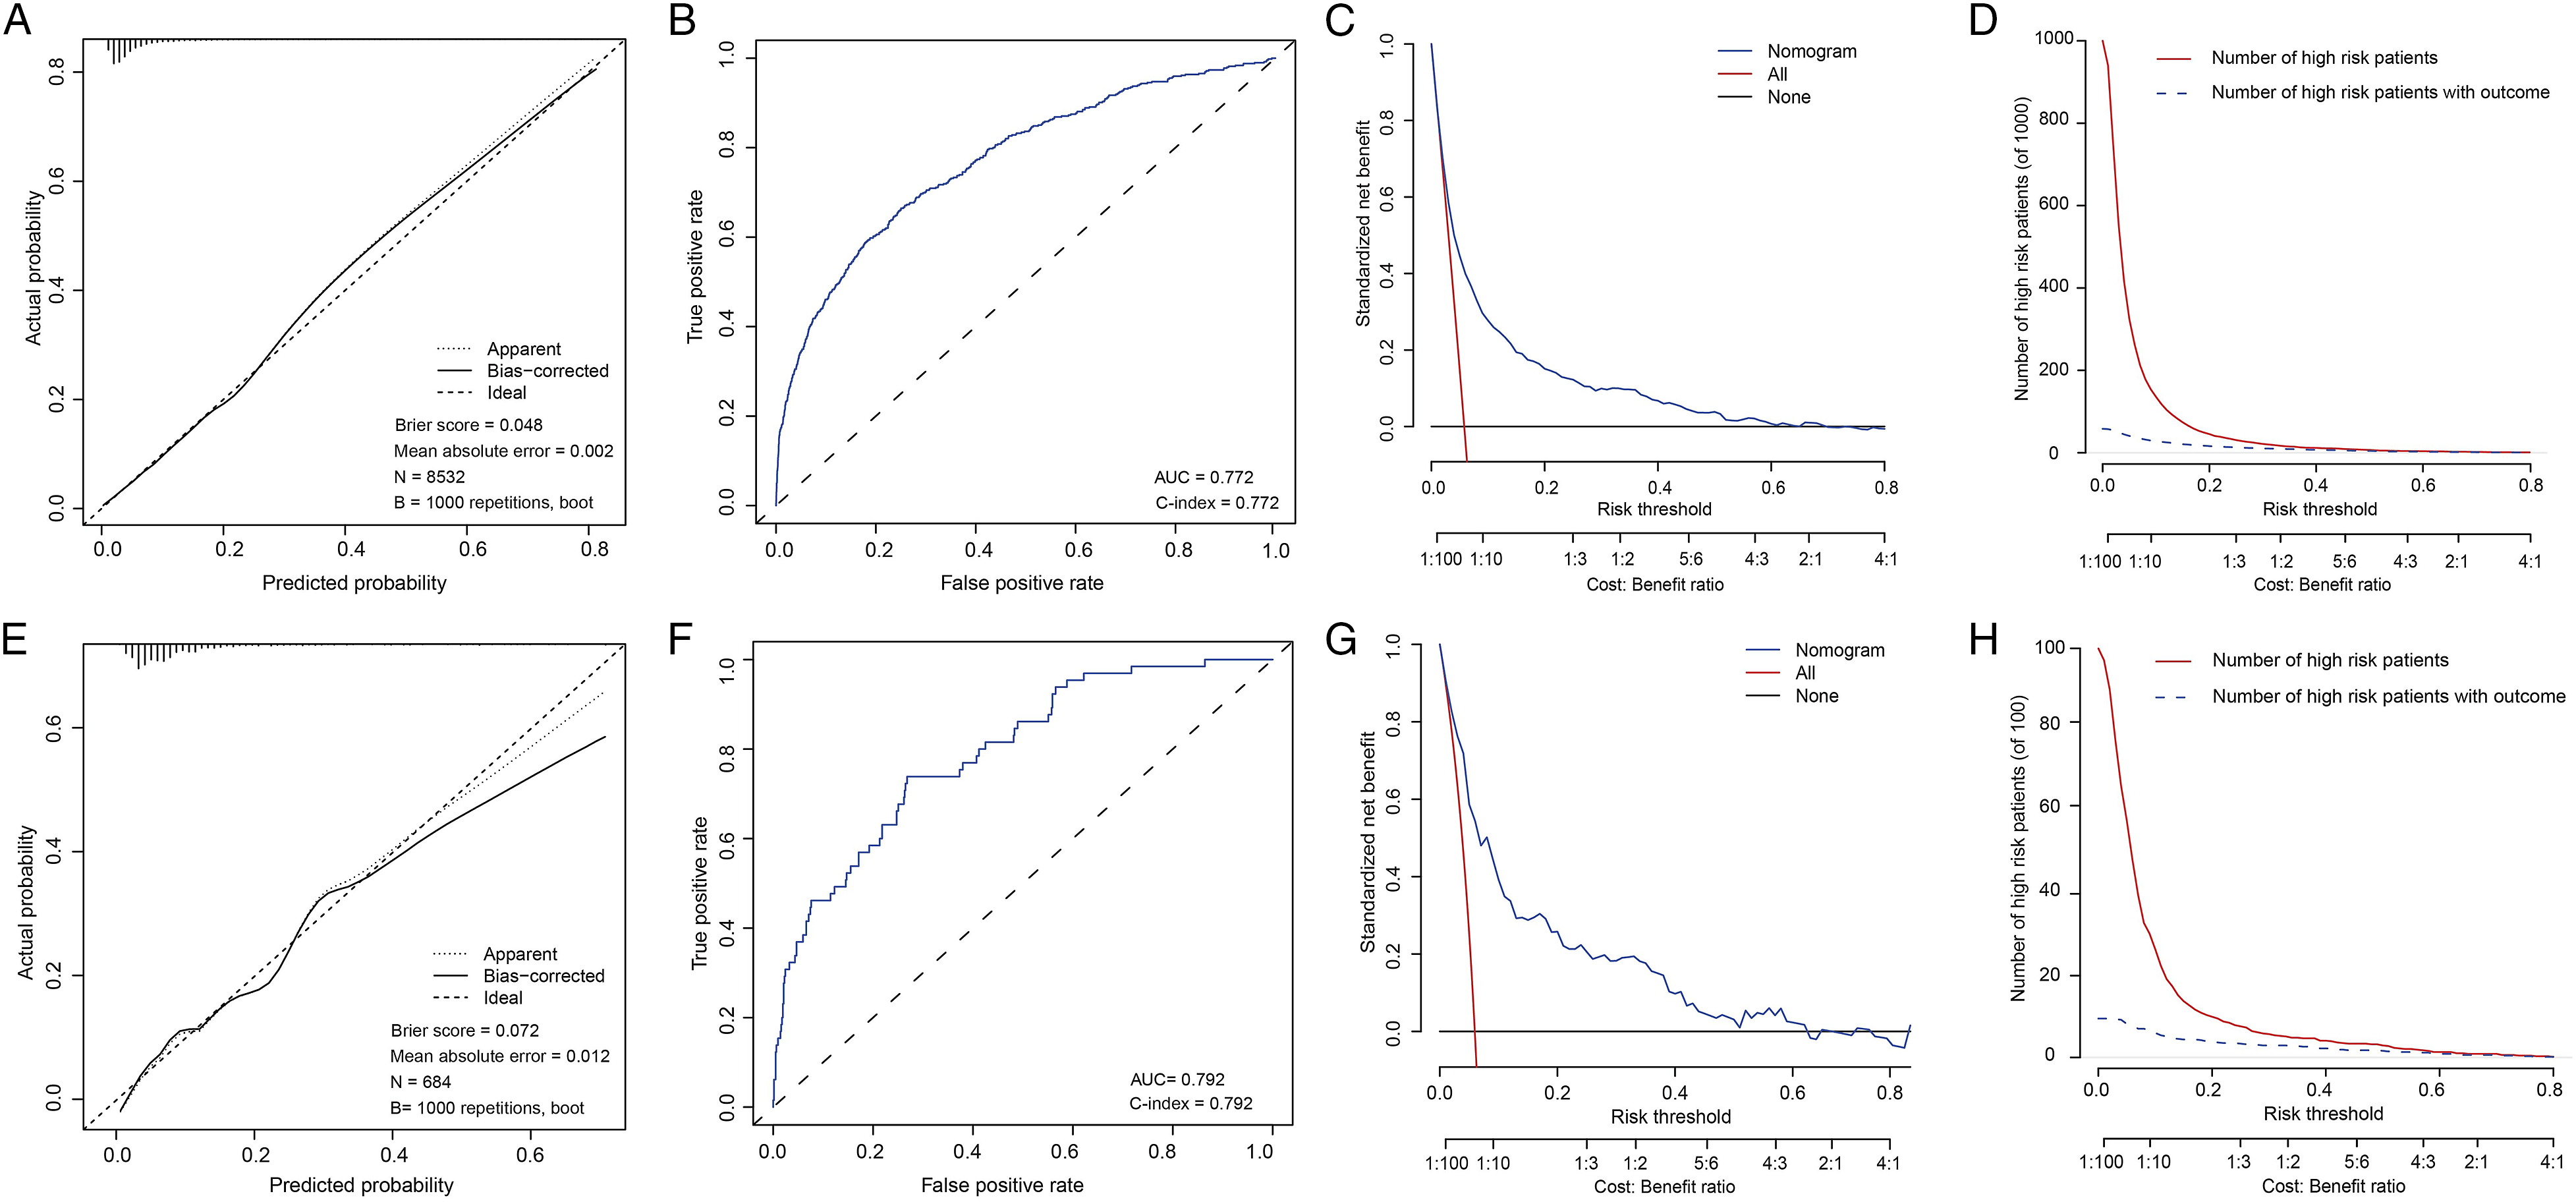
The calibration curves displayed in Figure 3A and E exhibited a high concordance between the predicted and observed onset probabilities in the training and validation cohorts. The C-index was 0.772 for the training cohort and 0.792 for the validation cohort, indicating that the nomogram effectively distinguished between patients (Figure 3B and F). The Brier scores were less than 0.1 in both the training and validation cohorts, confirming the excellent performance of the nomogram. Finally, we assessed the clinical benefits of the nomogram using DCA and CIC, which demonstrated that it provided a greater net benefit in the threshold probability and more accurately predicted DVT events (Figure 3C and D). These findings were also validated in the validation cohort (Figure 3G and H).
In conclusion, the above data demonstrate the strong accuracy and applicability of the nomogram.
Discussion
Although it is difficult to accurately calculate the probability of DVT, its occurrence often leads to significant consequences. The increased medical costs and occurrence of adverse events, such as pulmonary embolism, can significantly impact the patient’s well-being. 15 Despite numerous studies reporting the efficacy of thrombosis prevention measures, it is likely that these measures are not being fully utilized. 16 There may be a discrepancy between evidence-based recommendations and their implementation in clinical practice. There is currently a lack of reported tools specifically designed to assess the probability of DVT after PLF.
Our developed nomogram effectively addressed the aforementioned issue. Multidimensional validation demonstrated the nomogram’s excellent discriminatory and calibration capabilities. Our nomogram included seven variables, with age, BMI, and D-dimer previously established as risk factors for DVT.17-22 Consequently, our focus was directed towards the remaining four variables.
The initial finding that captured our attention is the positive correlation between the number of pedicular screws and the risk of DVT, which aligns with the observation made by Schairer et al 23 The escalated utilization of screws in surgical procedures signifies a more extensive surgical intervention, consequently disrupting the hemostatic balance. Moreover, the augmented scale of the surgical procedure correlates with prolonged postoperative immobilization, potentially exacerbating the likelihood of DVT occurrence.
In our study, diabetes has been identified as a relevant factor contributing to DVT following PLF, in line with prior studies.24,25 Guzman and colleagues conducted a retrospective study involving over 400,000 patients and found a heightened risk of DVT among individuals with diabetes after lumbar spine surgery (P < 0.001). 26 Additionally, another study demonstrated a higher susceptibility to vascular stenosis in diabetes patients, leading to unfavorable hemodynamic effects. 27 Hyperglycemia and endocrine disorders can cause systemic hormonal imbalances, and patients with diabetes showed elevated levels of circulating particles, indicating a procoagulant state. 28 Collectively, these factors likely contribute to the increased DVT risk in diabetic patients.
We observed an association between cerebrovascular disease and DVT, with a data indicating an odds ratio of 6.022. This finding underscores the substantial risk that cerebrovascular disease poses for the development of DVT. Cerebrovascular disease is currently classified into two main categories: hemorrhagic disease and ischemic disease. Regardless of the specific type of cerebrovascular disease, patients typically present with significant hemodynamic disturbances. A study by Ludvig B Rinde et al. revealed a notably elevated risk of DVT, particularly deep vein thrombosis, within 3 months of the onset of an ischemic stroke. 29 Patients suffering from ischemic stroke often exhibit heightened coagulation activity, which may account for the increased susceptibility to DVT. However, questions persist regarding the nature of this relationship, such as whether the influence of ischemic stroke on DVT risk is transient or enduring. Moreover, DVT commonly emerges as a complication following cerebral hemorrhage, with an incidence rate ranging from 2% to 9%.30,31 In summary, these findings underscore the critical importance of enhancing DVT prevention measures in surgical patients with a history of cerebrovascular disease, given the challenging consequences associated with DVT.
Our data indicated an inverse association between hypertension (odds ratio = 0.600) and DVT, suggesting a protective effect. While previous studies have reported no significant impact of hypertension on DVT risk, 32 Elizabeth J. Bell et al. discovered a link between postural hypotension and an increased risk of DVT, proposing that hypotension-induced venous stasis may contribute to this connection. 33 However, a comprehensive cohort study utilizing data from the Emerging Risk Factors Collaboration (ERFC) and UK Biobank yielded conflicting results. Elevated systolic blood pressure was found to have a negative association with DVT risk in the UK Biobank but not in the ERFC, whereas diastolic blood pressure showed no clear relationship with DVT risk in the UK Biobank but was associated with an elevated risk in the ERFC. 20 The authors did not offer a detailed explanation for these contradictory findings. Despite numerous cohort and case-control studies investigating the link between blood pressure and DVT, the evidence remains inconclusive.
Finally, since patients who have had a DVT are at higher risk and undoubtedly require more attention, we excluded this population. Therefore, the nomogram may not apply to them.
Conclusions
This study successfully developed a nomogram that can effectively assess the risk of DVT after PLF. This tool will help surgeons identify patients with relatively high risk, thereby implementing targeted thromboprophylaxis measures and promoting postoperative recovery of patients.
Footnotes
Author Contributions
Yunzhen Chen and Guangjun Jiao planned the study and supervised the analyses. Xiang li planned the study, performed the analyses, and drafted the manuscript. Jinlong Ma, Lu Xue and Limin Wang collected data and produced pictures and tables. All authors contributed to the interpretation of results and revision of the paper, and approved the final manuscript.
Declaration of Conflicting Interests
The author(s) declared no potential conflicts of interest with respect to the research, authorship, and/or publication of this article.
Funding
The author(s) received no financial support for the research, authorship, and/or publication of this article.
Ethical Statement
Data Availability Statement
The data generated during and/or analyzed during the current study are available from the corresponding author on reasonable request.