
Abstract
Study Design
Retrospective quantitative analysis study.
Objectives
Pelvic incidence has been established as central radiographic marker which determines patient-specific correction goals during surgery for adult spinal deformity. In cases with sacral doming or sacral osteotomy where the PI cannot be calculated, reliable radiographic parameters need to be established to determine surgical goals. We aim to determine multiple radiographic parameters and formulas that can be utilized when the S1 superior endplate is obscured.
Methods
Retrospective analysis was performed on 68 healthy volunteers without prior spine surgery with full-length radiographs. Pelvic incidence, sacral slope, and pelvic tilt were calculated for each patient. Additional measurements such as L4, L5, and S2 incidence, tilt, and slope were collected. A new radiographic parameter defined as the L4-Sciatic notch angle was measured. Regression analysis was performed on each value to determine its relationship with S1 based incidence, tilt, and slope.
Results
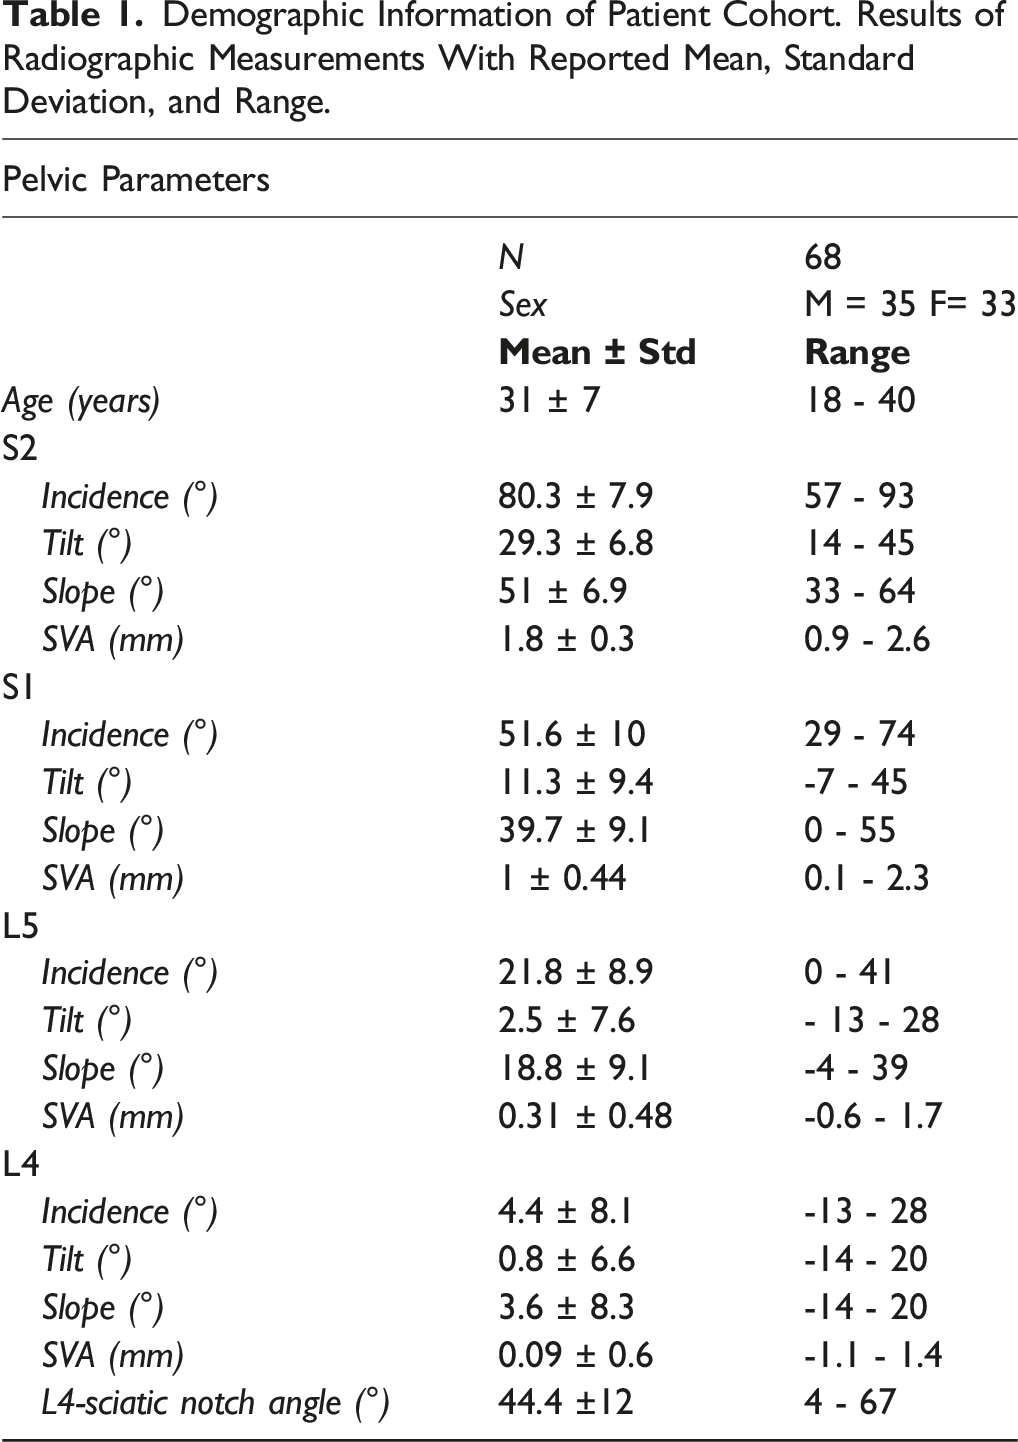
Mean values for L5 incidence, L4 incidence, and L4 sciatic notch angle were 21.8° ± 8.9, 4.4° ± 8.1, and 44.4° ± 12, respectively. The linear regression analysis produced the following formulas which can be utilized to determine deformity correction goals when pelvic incidence can be calculated pre-operatively: L5i = .65*S1i–11.4, L4i = .44*S1i-18.6, and L4SNA = −.34*S1i + 66.5. In settings where pelvic incidence cannot be calculated, the following formulas can be utilized: L5i = .66*S2i-32.3 and L4SNA = −.02*S2i2 + 1.1*S2i + 63.5. P-values for all regression analyses were <.001.
Conclusion
This study provides target radiographic alignment values that can be utilized for patients with either pre-operative altered S1 endplates or in cases with intraoperative alteration of S1 (sacral osteotomy).
Introduction
Adult spinal deformity (ASD) is a complex and heterogeneous disorder with an increasing prevalence affecting up to 68% of patients above the age of 60. 1 ASD is a broad term that includes not only patients with idiopathic deformities that began in adolescence, but also those with deformity that developed in adulthood secondary to degenerative disease, iatrogenic causes, trauma, infection, or neoplasm. ASD often is a progressive condition that leads to pathological changes in the load-bearing capacity of the spine. In most patients affected by ASD, the lumbosacral junction is affected by the deformity, which necessitates the definition of precise alignment parameters to guide surgical correction. As shown by Scheer et al 2 both overcorrecting and undercorrecting patients to age-specific sagittal vertical axis (SVA) goals was detrimental to outcome with overcorrection leading to higher rates of proximal junctional kyphosis (PJK), and undercorrection associated with worse HRQOL.
Various studies have been published guiding surgical realignment goals in this patient population; perhaps most notable was by Schwab et al 3 in 2010, suggesting the formula LL = PI ± 9° to allow surgeons to create patient-specific alignment goals. This formula was further modified with additional studies suggesting that younger patients require more aggressive correction than older patients. 4 Integral to accurate calculation of each of these important measurements is the radiographic identification of the S1 superior end plate (SEP), which is required to determine sacral slope (SS), pelvic tilt (PT), pelvic incidence (PI), and the sagittal cobb angles of the highly lordotic lumbar spine. In cases with bony destruction of the S1 SEP, either by the patient’s pathology or iatrogenic such as sacral osteotomy, a surrogate radiographic marker must be identified in order to accurately assess lumbosacral alignment.
The goal of this study is to identify reliable parameters of normal lumbosacral alignment that can be utilized in settings where the S1 SEP cannot be reliably utilized.
Methods
An IRB approved retrospective analysis was performed on 68 healthy adult individuals. Informed consent was not required as the retrospective analysis was determined to by the IRB to be an exempt protocol. Patients were identified through a search query of electronic medical records of all patients who underwent radiograph imaging of the whole spine with reportedly normal alignment. Patients with back pain, radiculopathy, myelopathy, prior spine surgery, history of degenerative spine disease or deformity were excluded. Patients with full-length free-standing lateral radiographs in the neutral position were included within the study. Surgimap (Nemaris Inc.™, MA, USA) software was used to analyze the radiographs. Patient characteristics including age and sex were recorded for each patient.
Imaging Analysis
Multiple radiographic parameters were analyzed including pelvic incidence, tilt, and sacral slope angle; initial parameters were obtained using the typical measurement locations between the pelvis and S1, followed by additional analysis using measurements obtained from the pelvis and L4, L5, and S2 (Figure 1). A new measurement, not previously defined, was obtained from the radiographs in order to assess sagittal plane deformity, termed the “L4-sciatic notch angle” (Figure 1). Another measurement that was obtained, referenced as regional sagittal vertical axis, was the distance between the midpoint of the vertebral body and a vertical line extending through the center of the acetabula (Figure 1). Measurements including pelvic incidence (PI), pelvic tilt (PT), and sacral slope (SS) angle are outlined for S1 endplate. Pelvic tilt is the angle between a vertical line drawn from the acetabulum and a line to the midpoint of the sacral superior end plate. Sacral slope is the angle formed between a horizontal line and the sacral superior end plate. Pelvic incidence is the angle formed between a line from the acetabulum to the midpoint of the sacral end plate and a line perpendicular to the sacral end plate. Regional sagittal vertical axis (rSVA) is the horizontal distance between the midpoint of the vertebral body and a vertical line drawn from the acetabulum. Each measurement was repeated for L4, L5, and S2. L4-sciatic notch angle is the angle formed by a line connecting the acetabula to the sciatic notch and the L4 superior end plate.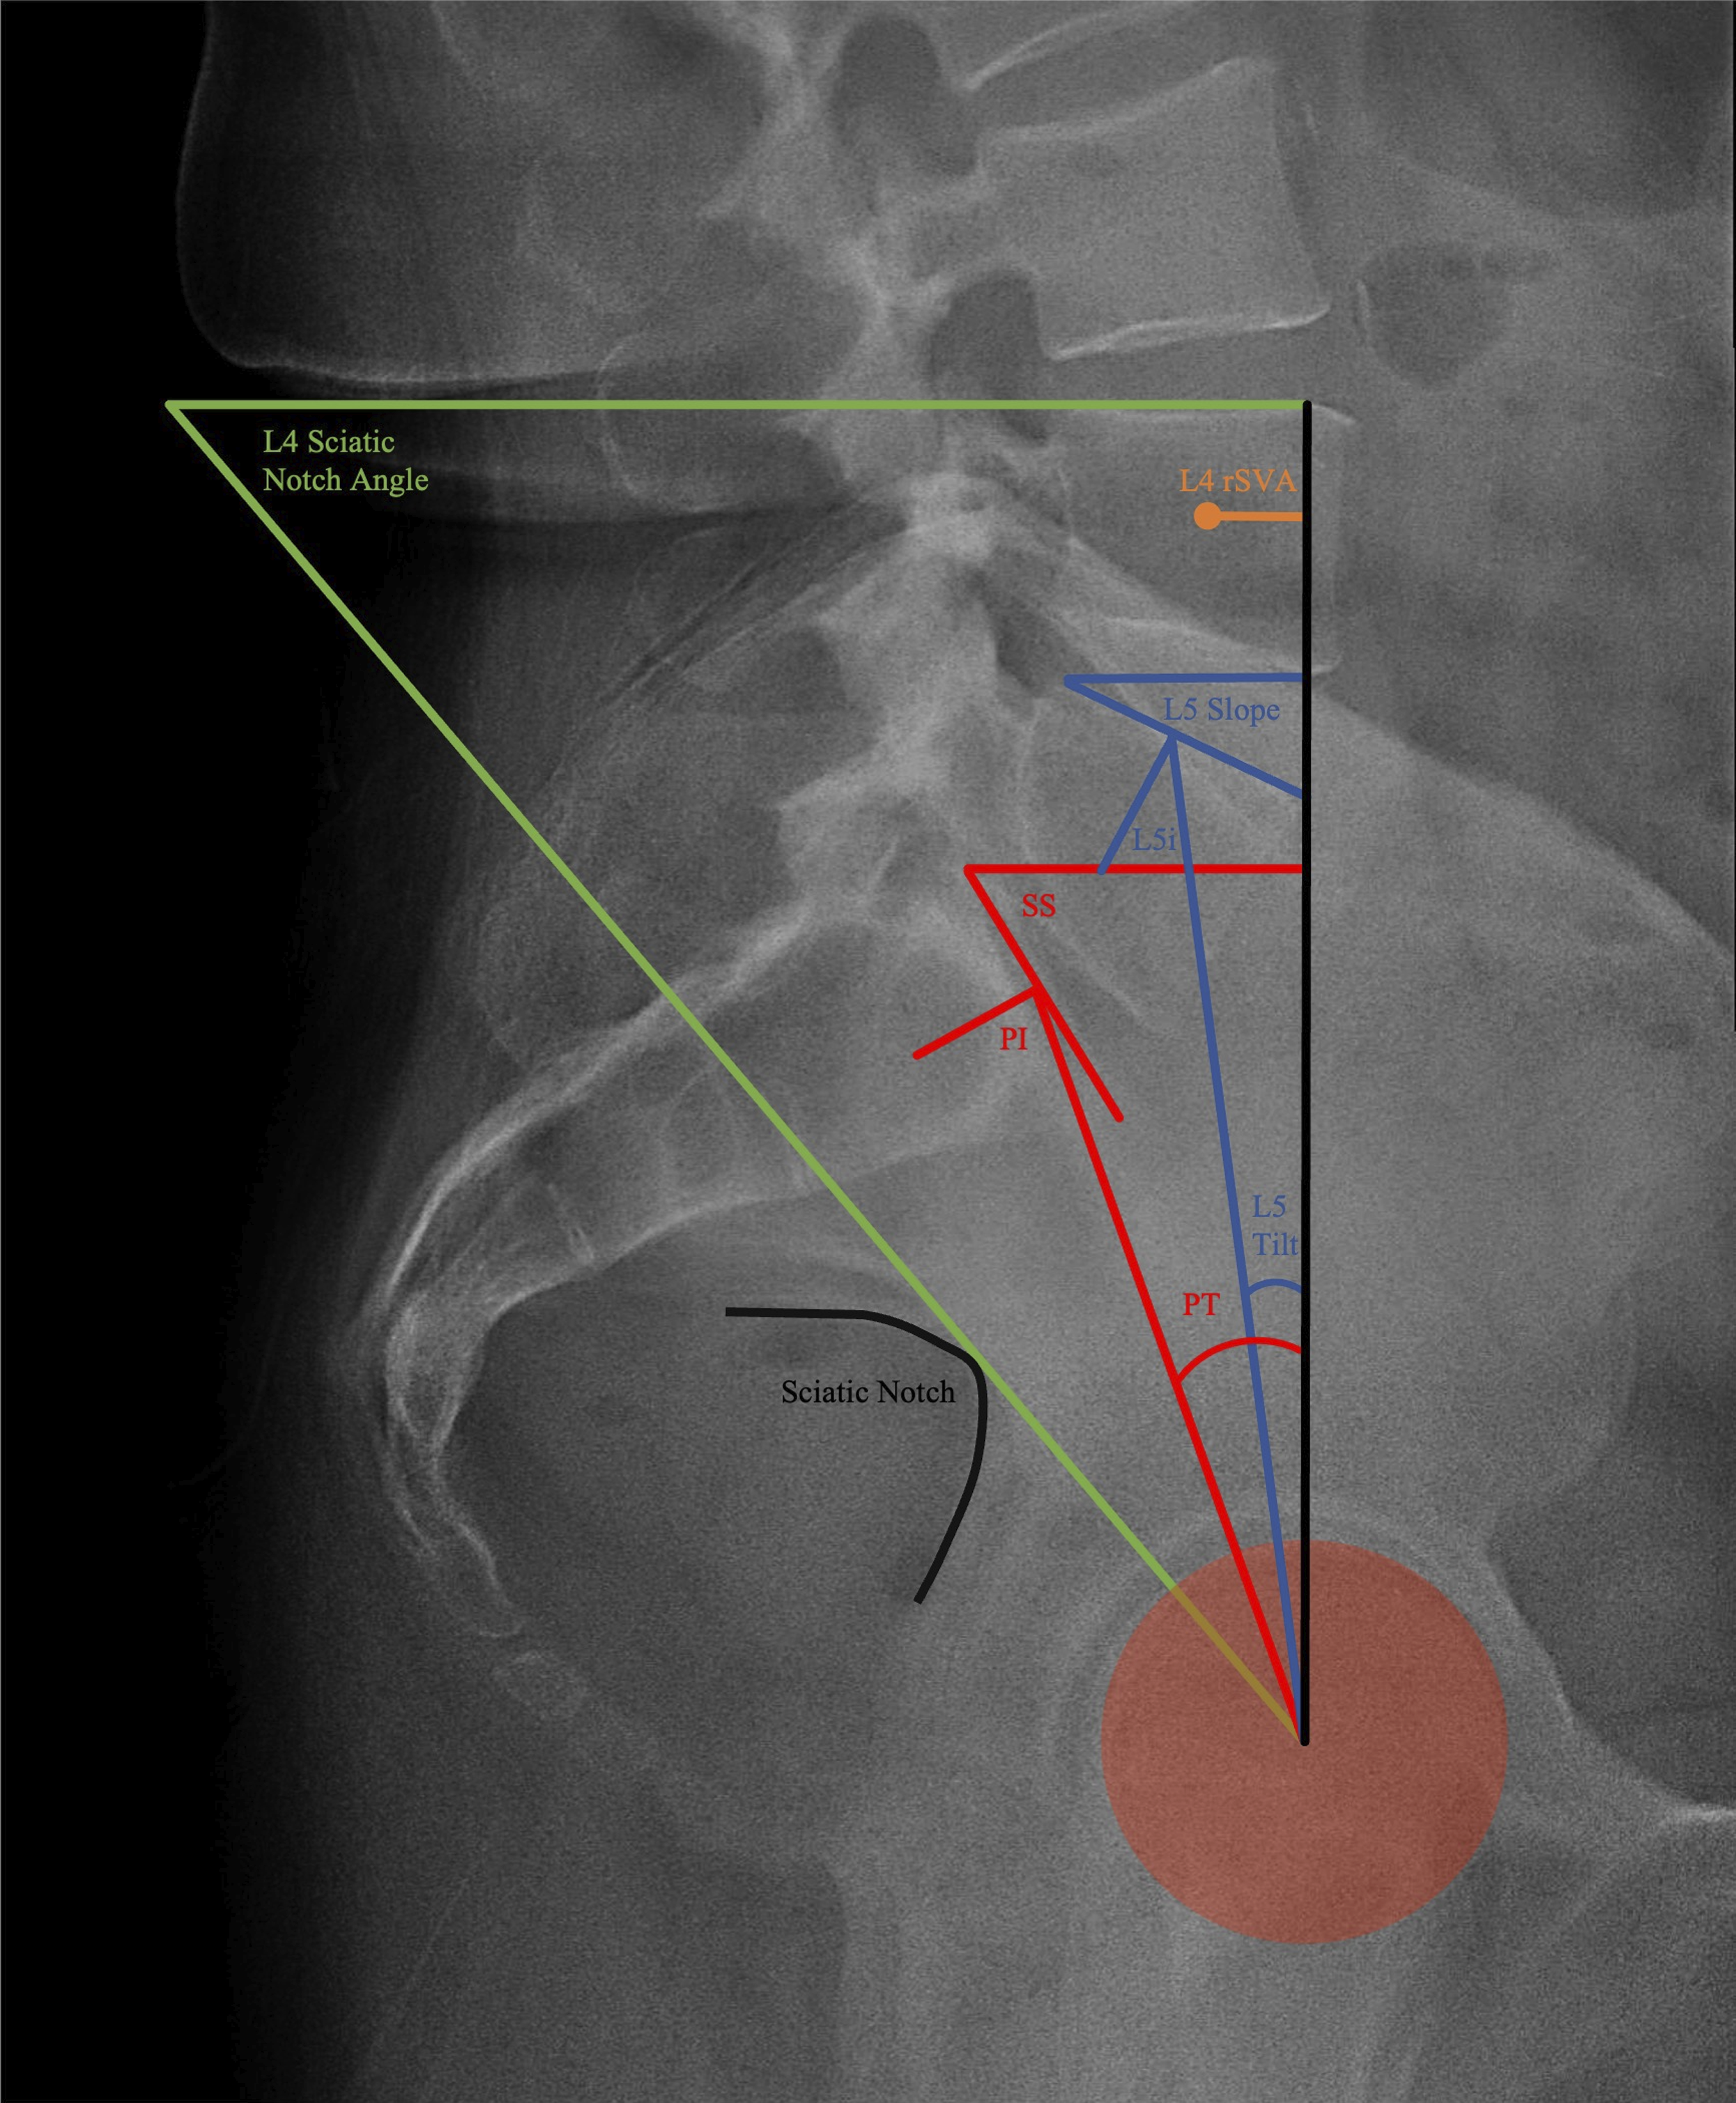
Statistical Analysis
Statistical analysis of the data was performed using Microsoft Excel Analyse-it® Package. Multiple correlation analyses were performed including linear and natural logarithmic. Regression analysis was performed with P-value <.001 considered statistically significant. Pearson correlation coefficient, R, was used to define the strength of relationship with the magnitude of correlation being considered large if R >.5, moderate if .3 < R <.5, and small if R <.3. 5 For each patient, the relationship between the typical S1 based spinopelvic parameters such as pelvic tilt, sacral slope, and pelvic incidence was compared to the same values when calculated using either L4 or L5 as the reference point. Additional analysis was performed between incidence when obtained from L5 vs S2 reference points. Data representing pelvic incidence as defined in current literature is referred to as S1i; incidence calculated with either L4, L5 or S2 as the reference point is referred to as L4i, L5i, and S2i, respectively. The data was plotted on scatter plot and a regression model was applied. The formula obtained from the regression model was then used as a predictive model to covert data obtained from either L4 or L5 interchangeably with S1 based pelvic parameters. Additional correlational analysis was performed comparing the L4-sciatic notch angle to S1 and S2 based pelvic incidence. Similar regression analysis was performed and the resultant formula was used as a predictive model.
Results
Demographic Information of Patient Cohort. Results of Radiographic Measurements With Reported Mean, Standard Deviation, and Range.
Lumbosacral Deformity Parameters
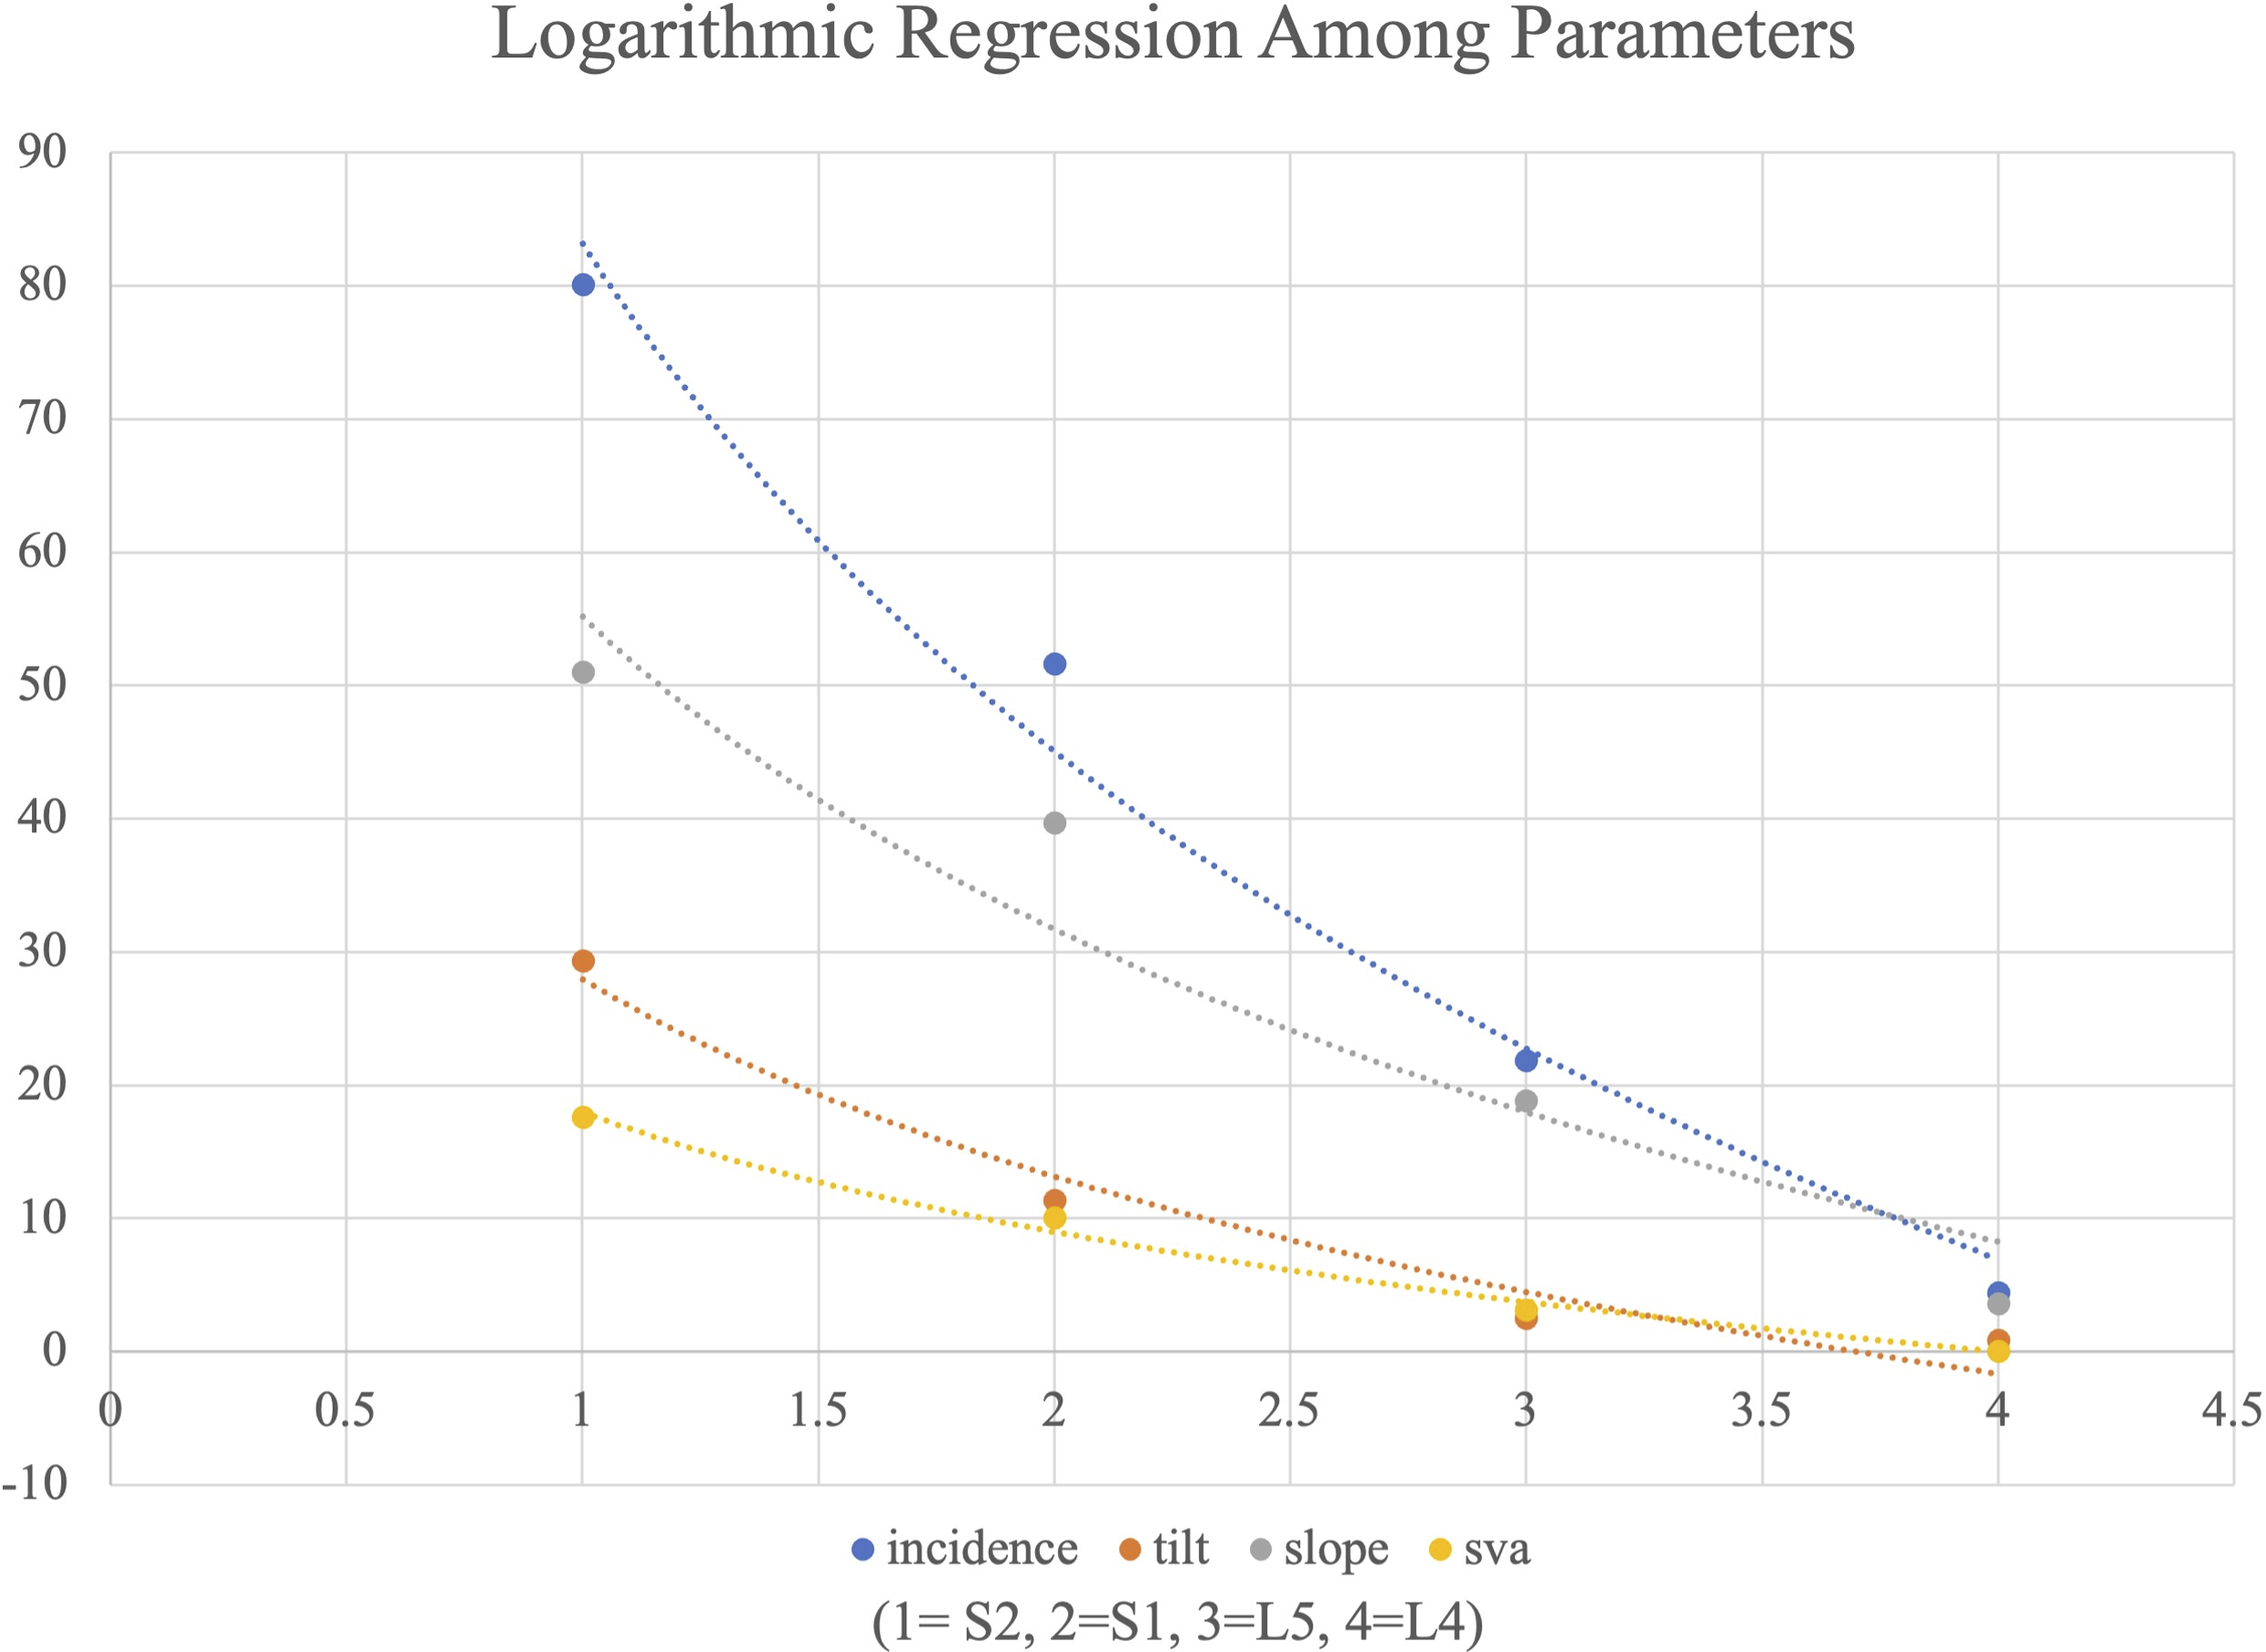
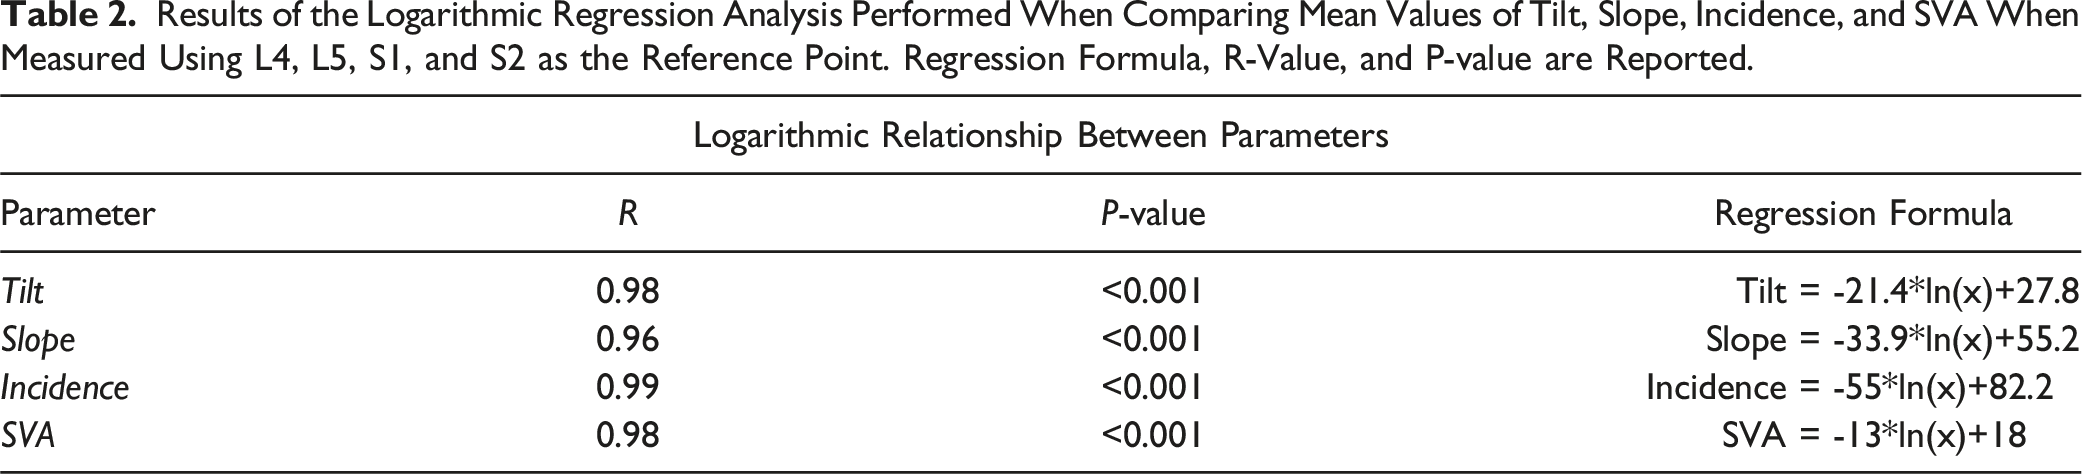
Lumbosacral deformity measures including pelvic incidence, pelvic tilt, vertebral slope, and regional sagittal vertical axis were collected for all patients utilizing L4, L5, S1, and S2 as the spinal reference point (Figure 1). Mean, standard deviation, and range is reported for all values (Table 1). The distribution of data, including median, upper and lower quartile, and range, is graphically represented in box plot (Figure 2A–D). The mean of each measurement across the 4 vertebral segments was evaluated to ascertain the trend among the measurement values. The mean data for each measurement type across the vertebral segments, L4, L5, S1, and S2, was noted to follow a natural logarithmic scale. Regression analysis with a natural logarithmic model was performed for each measurement value (Figure 3). The natural logarithmic relationship between pelvic incidence when measured between different vertebral segments was noted to have a R = .99. Similarly, the R-values for tilt, slope, and regional SVA were .98, .96, and .98 respectively. P-values for all of the natural logarithmic regression analysis was <.001 (Table 2). Box plot representing the distribution of key radiographic measurements including incidence, slope, tilt, and regional SVA for all vertebral levels. Median, upper quartile, lower quartile, minimum, and maximum are represented in each graph. The “x” value represents the mean. The data points plotted outside of the minimum or maximum whiskers are outlier datapoints. The mean values are seen to follow a logarithmic regression pattern for each measurement across the vertebral segments. Logarithmic regression analysis of the mean values for each deformity measurement (incidence, tilt, slope, and regional SVA) when calculated from S2, S1, L5, and L4. X-axis: 1 = S2, 2 = S1, 3 = L5, 4 = L4. Results of the Logarithmic Regression Analysis Performed When Comparing Mean Values of Tilt, Slope, Incidence, and SVA When Measured Using L4, L5, S1, and S2 as the Reference Point. Regression Formula, R-Value, and P-value are Reported.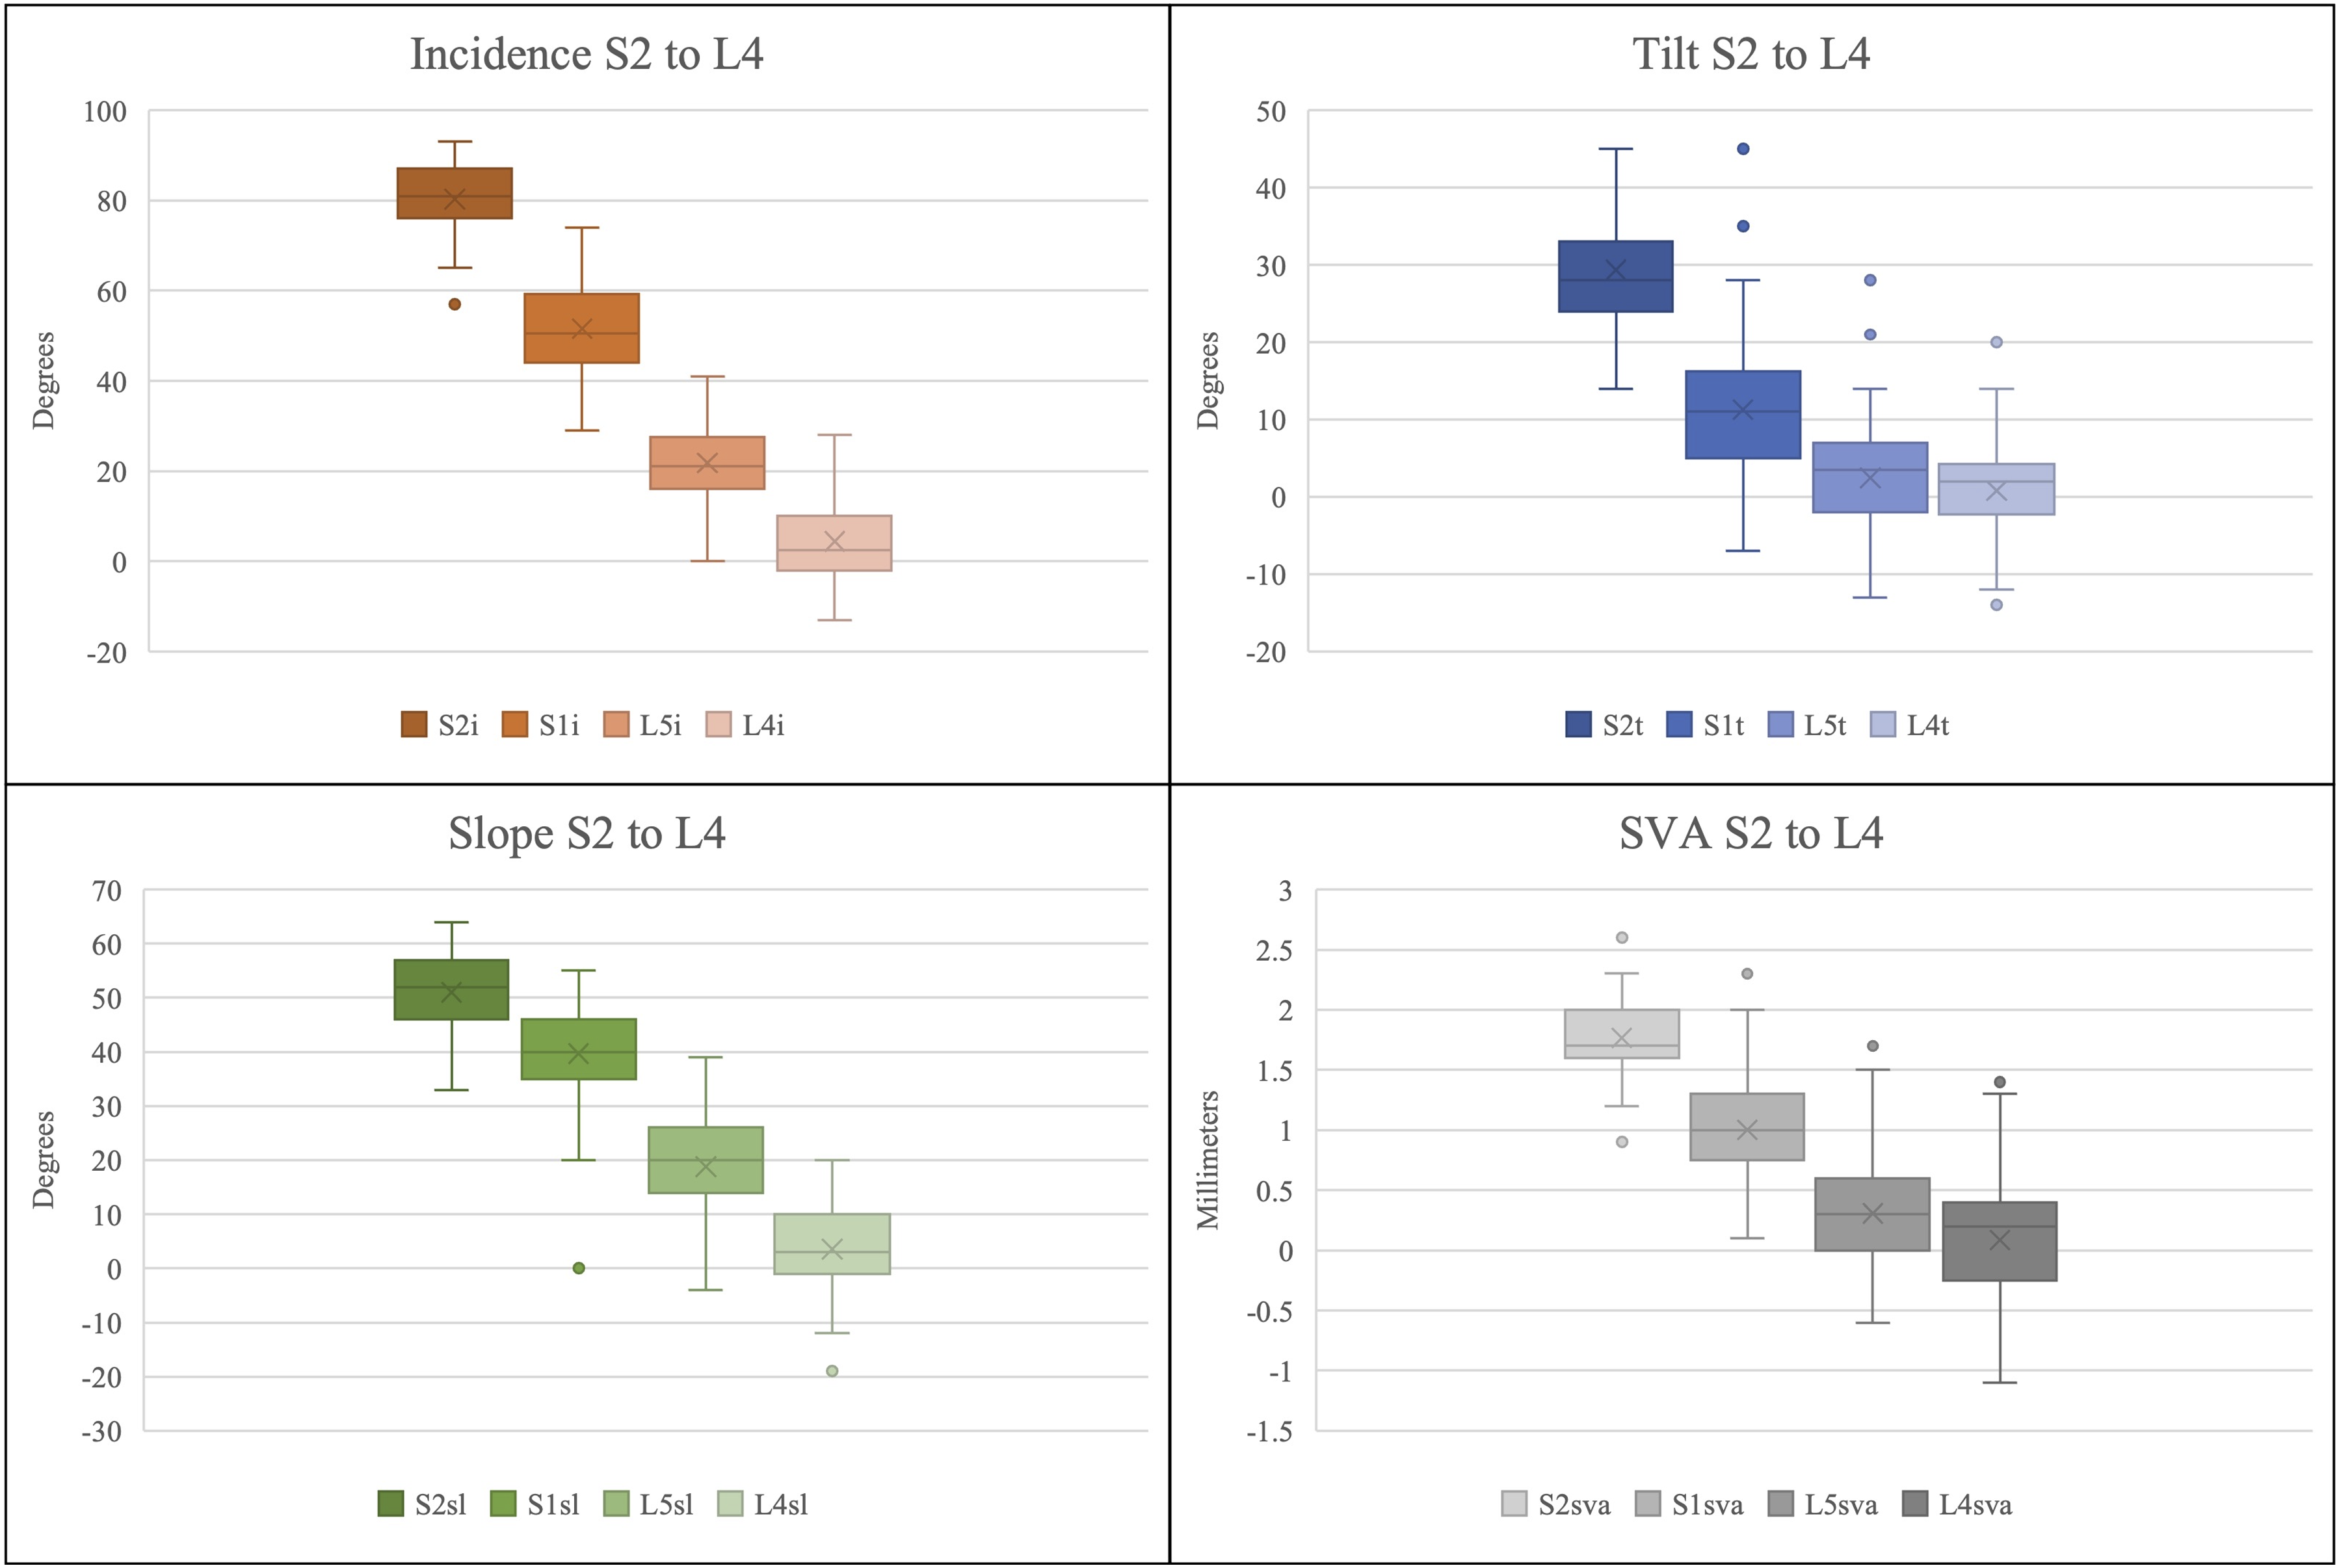
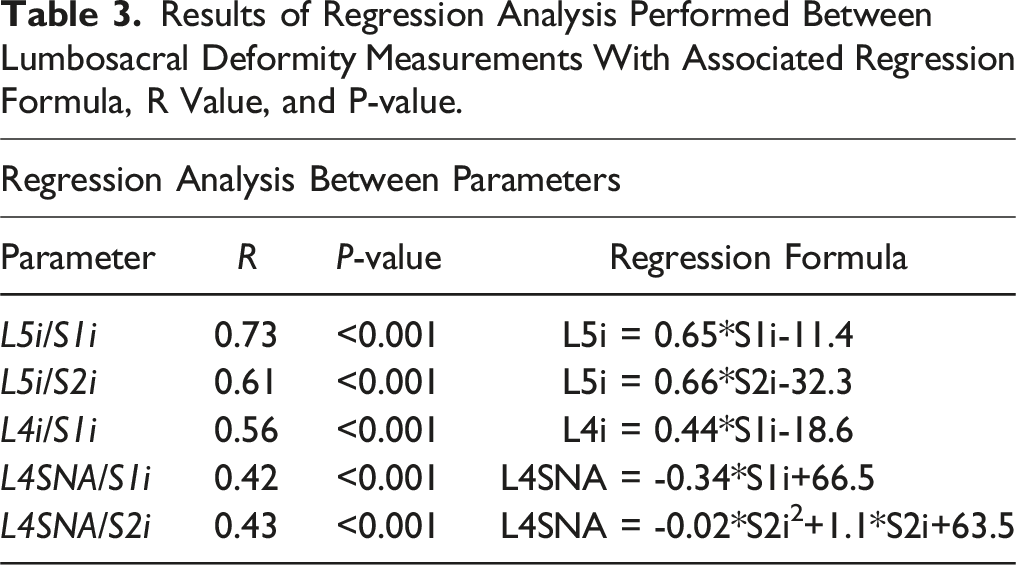
Further analysis was performed to examine the relationship between the various measurements of pelvic incidence. The relationship between L5i/S1i, L4i/S1i, and L5i/S2i, is graphically represented in scatter plots (Figure 4A–C). Each relationship was plotted and a linear regression model applied to develop a simple formula intended to allow conversion between measurements. L5i can be calculated using either formula: L5i = .65*S1i–11.4 (P-value: <.001) or L5i = .66*S2i-32.3 (P-value: <.001). The relationship between L4i and S1i was defined by L4i = .44*S1i-18.6, with a P-value of <.001 (Table 3). Scatter plot showing the distribution of data for incidence measurement. (A) linear regression model evaluating the relationship between S1i and L5i. (B) Linear regression model evaluating the relationship between S2i and L5i. (C) Linear regression model evaluating the relationship between S1i and L4i. (D) Linear regression model evaluating the relationship between S1i and L4SNA. (E) Polynomial regression model evaluating relationship between S2i and L4-sciatic notch angle. Results of Regression Analysis Performed Between Lumbosacral Deformity Measurements With Associated Regression Formula, R Value, and P-value.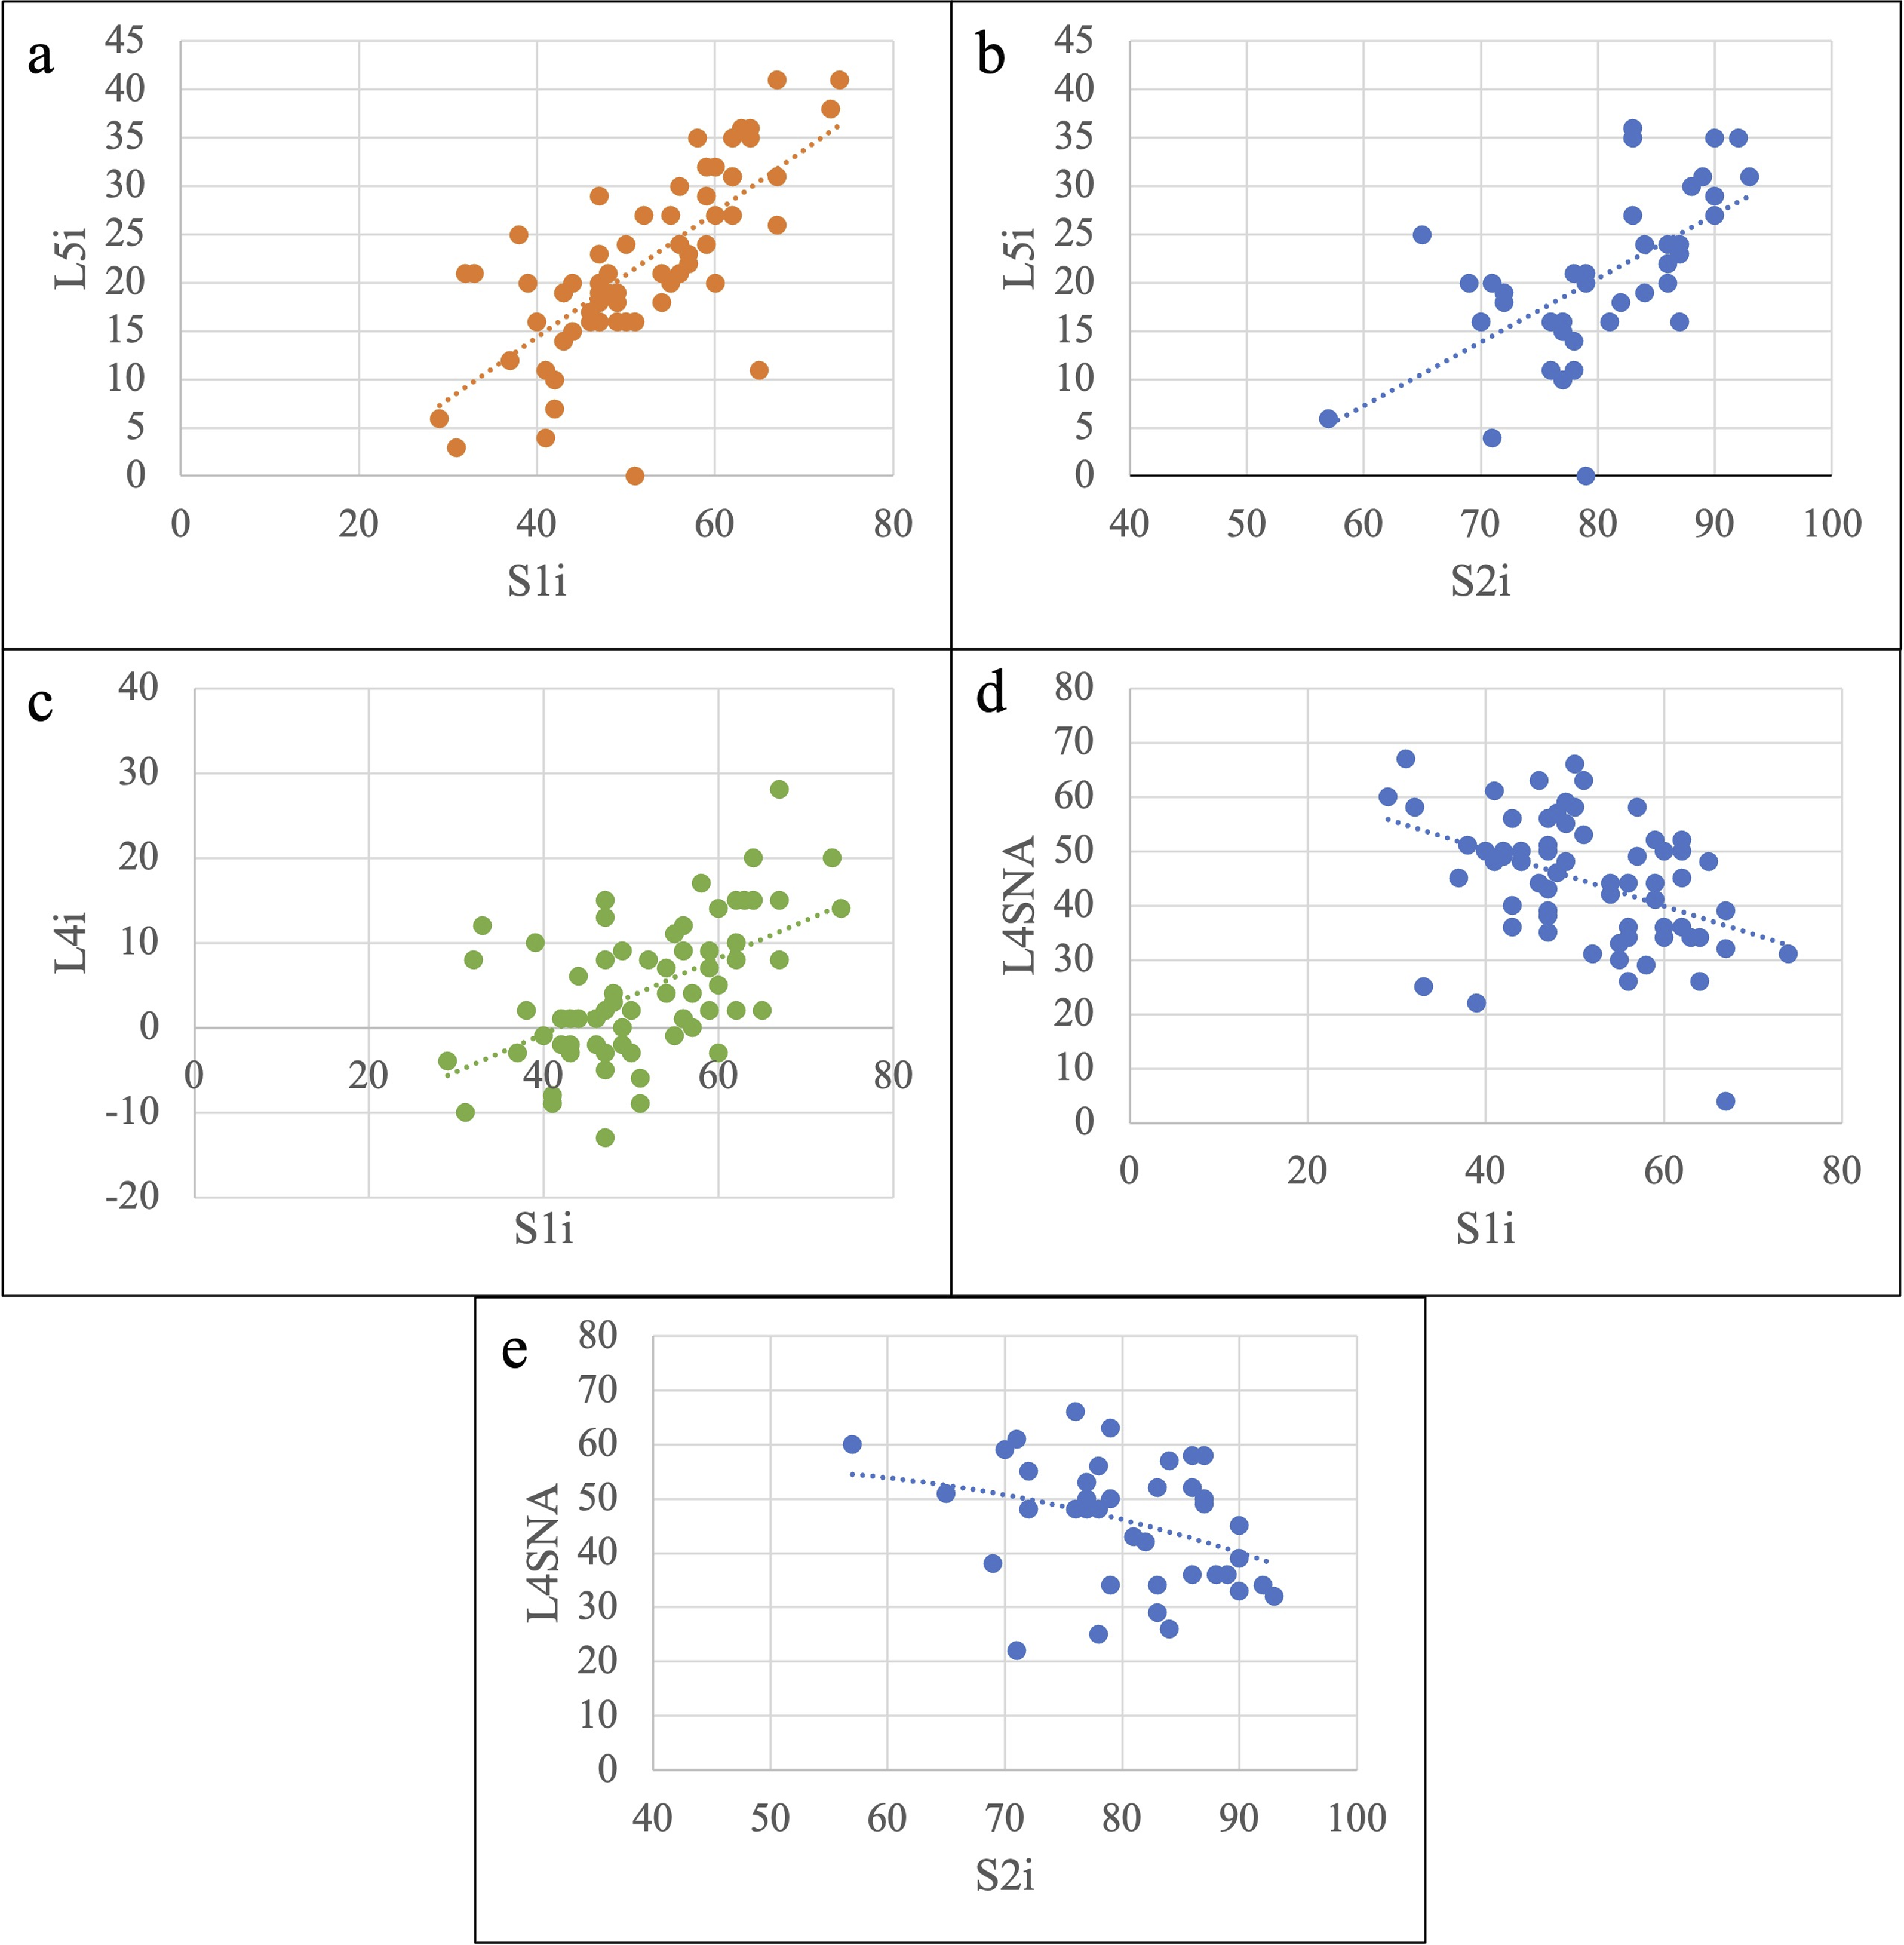
Similar comparative analysis was performed between L4-sciatic notch angle and S1i as well as L4-sciatic notch angle and S2i. The relationship between L4-sciatic notch angle and S1i was noted to best fit a linear regression model while the relationship between L4-sciatic notch angle and S2i best fit a polynomial model (Figure 4D–E). Formulas and respective R-values are reported in Table 3. P-values for both regression models were <.001.
Formula Calculation
To increase usability of these formulas, they have been compiled into an online calculator at the webpage: https://www.spine-alignment.com. The calculator is freely accessible to obtain alignment values for a given patient.
Discussion
Deformity of the thoracolumbar spine often involves a hyperkyphotic thoracic spine or hypolordotic lumbar spine, known as flat back deformity. Both conditions can lead to a positive sagittal vertical axis that is outside the cone of economy as described by Dubousset et al, 6 thus requiring additional energy expenditure to maintain an upright posture. A multicenter study published by Glassman et al 7 in 2005 established positive sagittal balance as the radiographic measure most closely predictive of low patient reported health related quality of life (HRQOL) scores. Anatomical studies revealed that pelvic incidence, a measure of the position and orientation of the sacroiliac joint within the ileum was highly determinant of lumbar lordosis and thoracic kyphosis.8,9 Since the introduction of the measurement, PI has been identified as a central radiographic measure that is fixed in adulthood and represents the key to understanding patient-specific spinal alignment.2,3,9-14 Various recent studies have identified that mismatch between PI and LL are closely associated with HRQOL measures.2,4,11 In patients with severe lumbosacral deformity, such as those with high grade spondylolisthesis or iatrogenic flat-back, a well-defined understanding of pre-operative PI, PT, and LL is essential to creating age-appropriate alignment goals for surgery. Lumbosacral deformity measurements and consistent comparison between pre-operative and post-operative films is particularly challenging in patients with high grade spondylolisthesis, spondyloproptosis or those with radiographically obscured S1 SEP. Furthermore, consistent comparison between PI on pre-operative and post-operative films may not be possible in patients undergoing sacral osteotomy. Certain pathologies, such as sacral dome remodeling, may prevent the reliable measurement of PI, PT, and LL altogether. 15 Nonetheless, matching LL to PI is important to optimize post-operative HRQOL as well as reducing risk of post-operative complications such as PJK. 2 In these settings, reliable radiographic measures that do not rely on the S1 SEP are integral to creating patient-specific alignment goals.
Incidence
First described in 2001, measurement of L5 incidence, has gained utility in patients with high grade spondylolisthesis and sacral doming where measurement of PI may be obscured. Multiple studies found that restoration of L5i within normative values in patients with severe lumbosacral deformity to be a sign of appropriate lumbosacral realignment as well as a predictor of good clinical outcome.15,16 Within the adult asymptomatic population, normative values for L5i have been previously defined as 16.43° ± 7.64 by Zhu et al. and as 22.43° ± 9.85 by Dominguez et al.; our study found a similar distribution of L5i, 21.8° ± 8.9. Both Zhu et al. and Dominguez et al. performed linear regression analysis to evaluate the relationship between PI and L5i with the resultant formulas: L5i = .725*PI−12.757 (R = .82) and L5i = .764*PI-17.72 (R = .83), respectively; our formula was similar, L5i = .65*S1i–11.4 (R = .73).17,18 This study serves to provide validation to prior studies while also expanding investigation into additional adjunctive deformity measures such as L4 incidence and the mathematical relationship between L5i and S2i. These formulas can be utilized in settings where the S1i cannot be reliably calculated on post-operative imaging and correction is evaluated using L5i (Table 3). Normative values of tilt, slope, and incidence for L4, L5, and S2 are all reported in Table 1 and can serve as a reference range when establishing correction goals.
L4-Sciatic Notch Angle
Previously undefined, the angle between the L4 SEP and a line from the sciatic notch to the acetabulum was calculated and regression analysis performed to evaluate its relationship with S1i and S2i. The correlation analysis performed revealed moderate association between L4-sciatic notch angle and S1i, L4SNA = −.34*S1i + 66.5, R = .42, P < .001. The relationship between L4SNA and S2i was noted to have moderate association in a polynomial regression model, L4SNA = −.02*S2i
2
+1.1*S2i + 63.5, R = .43, P < .001. These measurements and formulas have great utility in patients undergoing sacral osteotomy and during intra-operative fluoroscopy where the L4 SEP and sciatic notch are readily distinguishable (Table 3, Figure 5). Case examples of the utility of deformity measurements. (A) pre-operative radiograph showing high grade L5/S1 spondylolisthesis. S1i calculated as 48°, LL as 20° and mismatch of 28°. (B) Use of calculator from https://www.spine-alignment.com to establish intra-operative goals using pre-operatively calculated S1i. Preoperative S1i is entered (green arrow) and three different target alignment parameters are returned from the calculator. Although all of these parameters can be evaluated during surgery through lateral fluoroscopy, the highest correlation was found for L5i, followed by L4i and L4SNA. (C) Intraoperative fluoroscopy with calculated L4i, L5i, and L4SNA. L4i is calculated at 1.5°, L5i as 15.5° and L4SNA as 50.9°. This is compared to pre-operative goals. (D) Post-operative sagittal CT highlighting the surgical alteration of the S1 endplate where neither S1i or LL can be reliably used to assess alignment.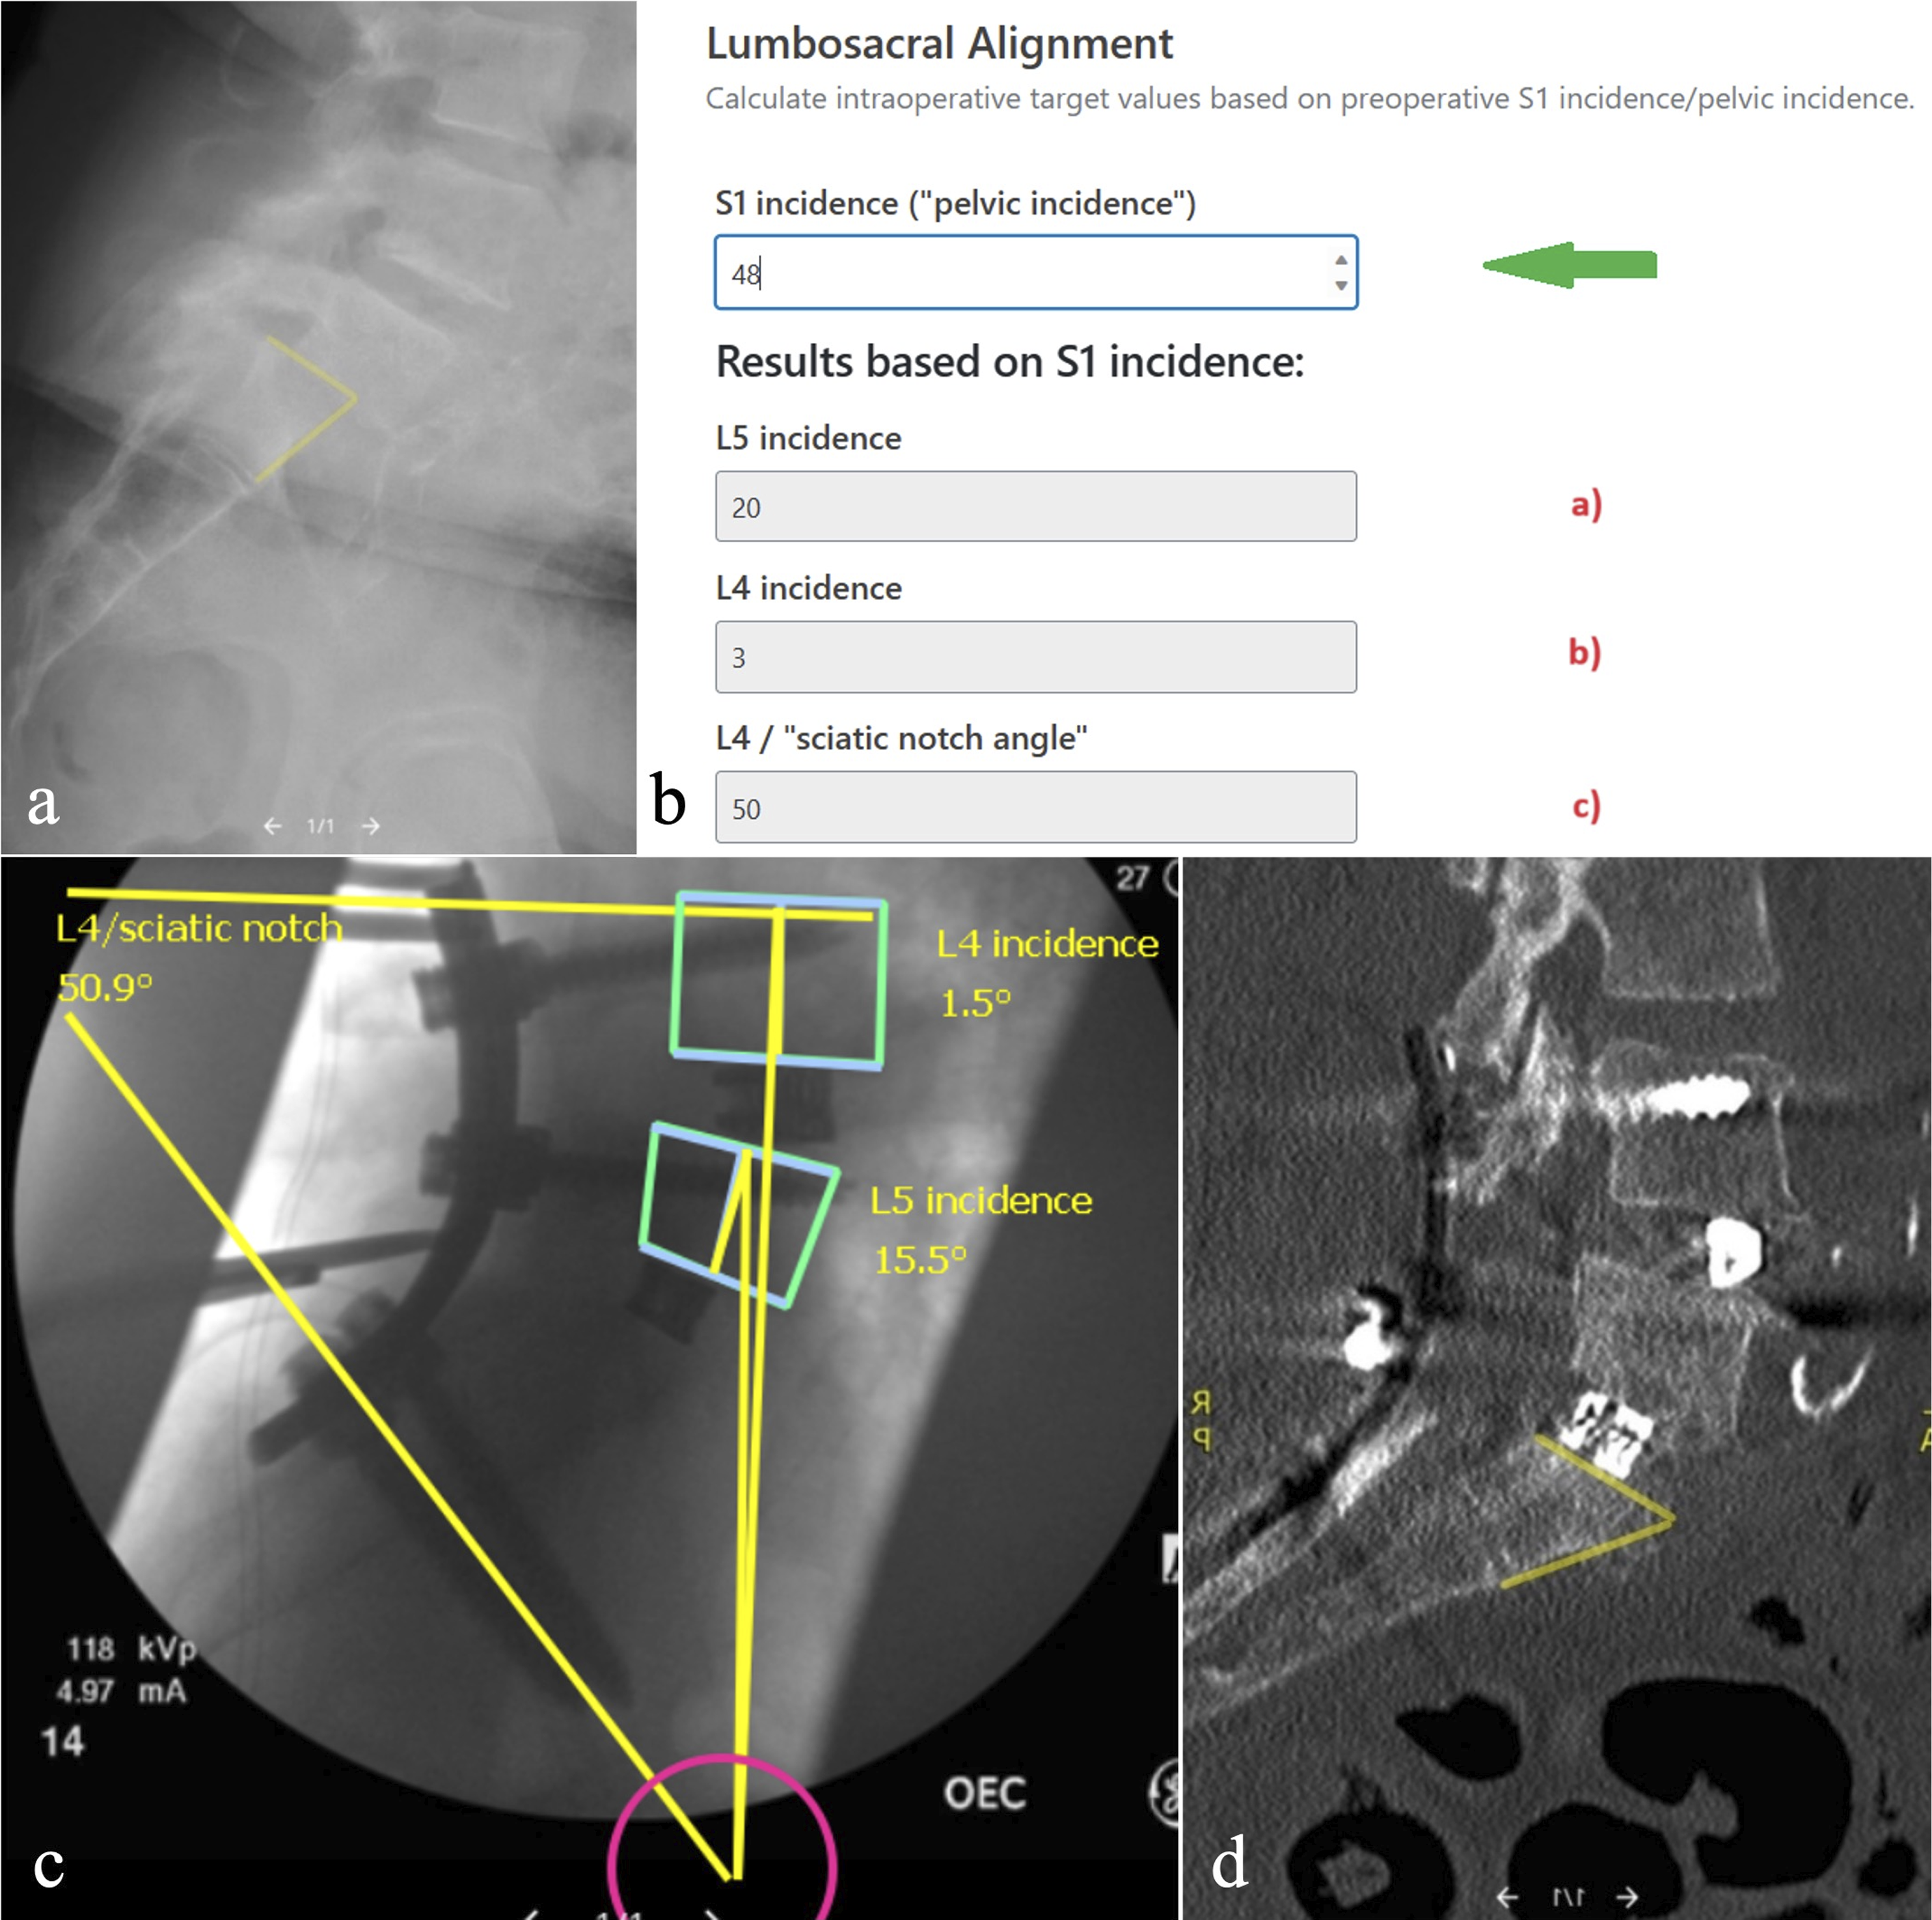
Logarithmic Relationship
Comparing the individual measurements of tilt, slope, and incidence from each vertebral body, S2, S1, L5 and L4, a natural logarithmic relationship was noted amongst mean values with strong magnitude of correlation, R = .96-.99. (Figure 2A–D, Figure 3, Table 2). While the formula calculated from the regression model is not relevant, the nature of the mathematical relationship presents perhaps another occurrence of the natural logarithmic pattern in biology and nature. Certainly, the curvature of the entire spine cannot fit into a single a logarithmic pattern but when evaluating each curve individually, a logarithmic pattern may emerge.
Case Example and Formula Utilization
To best understand the utility and function of the aforementioned formulas and measurements, a case example is described.
The case example involves a patient who presented with high grade spondylolisthesis (Figure 5A). The pre-operative S1i was 48° and LL was 20° with a resultant mismatch of 28°. Utilizing the L4i = .44xS1i-18.6 and L5i = .65*S1i–11.4 formulas, the expected L4i was 3° and the expected L5i was 20°. Using the L4SNA = −.34*S1i + 66.5 formula, the expected L4SNA was 50° (Figure 5B). The patient underwent L4-iliac posterior fusion with sacral dome resection. Following correction and reduction of the spondylolisthesis, intra-operative fluoroscopy was obtained to evaluate the degree of correction. Given the surgical alternation of the S1 SEP, LL and PI could no longer be reliably measured. The intra-operative film revealed a calculated L4i of 1.5° and L5i of 15.5° and a L4SNA of 50.9° suggestive of satisfactory deformity correction (Figure 5C). The post-operative CT reveals the appropriate deformity correction and the surgically altered S1 SEP, emphasizing the utility of the above formulas and calculator (Figure 5D).
Basic guidelines and utilization suggestions of the formulas have been outlined in a flowsheet (Figure 6). In cases where the S1 SEP is preserved before surgery, the pre-operative S1i is entered into the following formulas to develop intra- and post-operative alignment goals: L4i = .44*S1i-18.6, L5i = .65*S1i–11.4, and L4SNA = −.34*S1i + 66.5. In cases where the pre-operative S1 SEP is altered such as sacral dome remodeling or tumor infiltration, the S2i is calculated and entered into the following formulas to generate intra- and post-operative alignment goals: L5i = .66*S2i-32.3 and L4SNA = −.02*S2i2 + 1.1*S2i + 63.5 (Table 3). Flowchart to guide which radiographic parameter to utilize depending on pre-operative preservation of S1 endplate.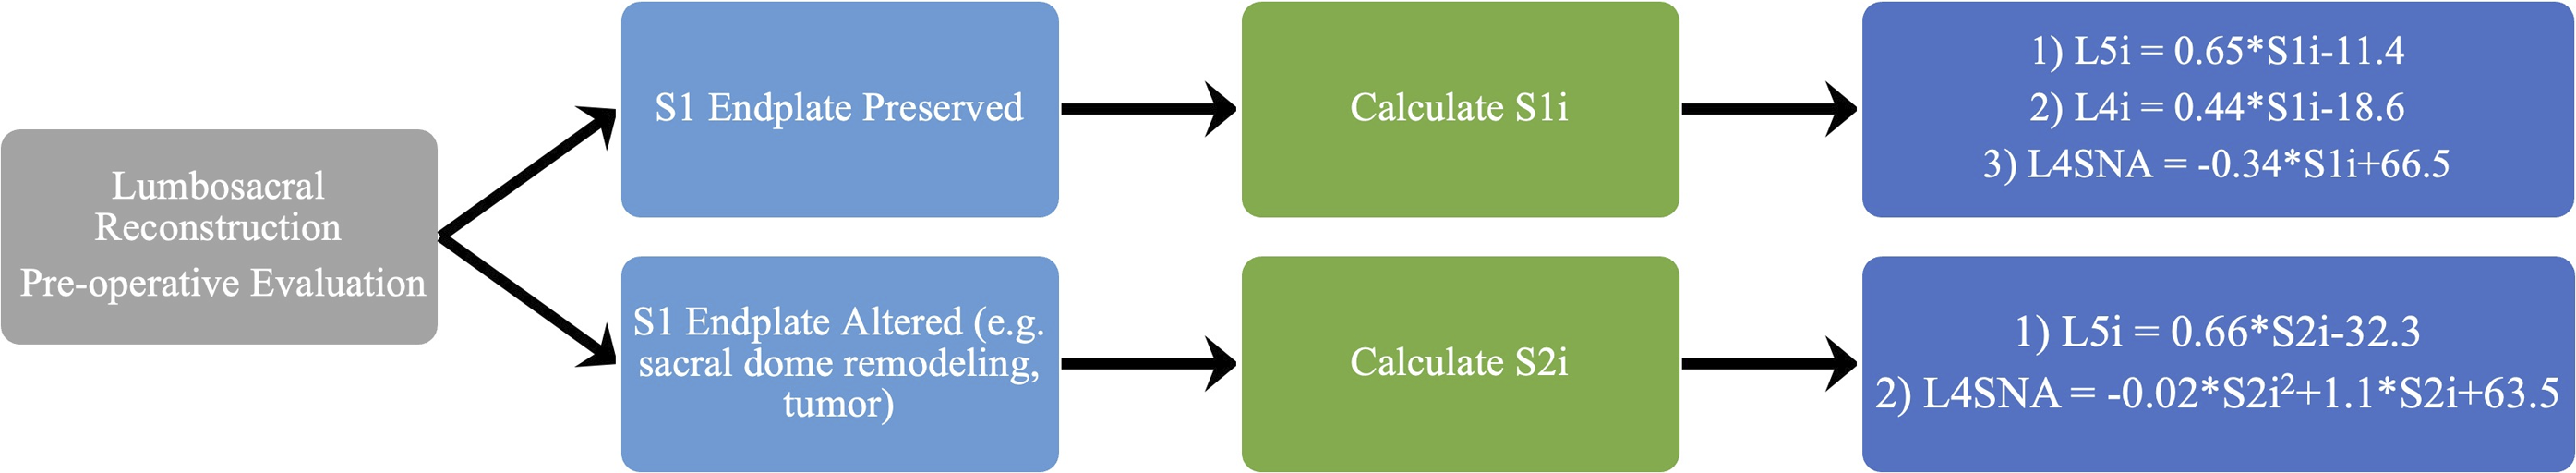
Limitations
Linear correlation analysis on the pelvic tilt, vertebral slope, and pelvic incidence data obtained from S1 vs L4, L5, or S2 implies a physiological univariate relationship between the parameters. While the mathematical model serves purpose for predictive formulas in surgical planning, it is not intended to represent the true physiological and anatomical relationship among these parameters which is likely multivariate or logarithmic.
Conclusion
This study provides radiographic target alignment values for normal lumbosacral alignment that are independent of S1/pelvic incidence. These values can be utilized during surgery with lateral fluoroscopy and are useful in any surgical case with either preoperatively altered S1 endplates or in cases with intraoperative alteration of S1 (S1 osteotomy). The formulas and calculator are freely accessible at https://www.spine-alignment.com.
Footnotes
Author Contributions
AAP: data analysis, writing/original draft preparation, approval of final version of manuscript
SS: writing/original draft preparation, approval of final version of manuscript
JKG: data collection, critical review of manuscript, approval of final version of manuscript
DWP: critical review of manuscript, approval of final version of manuscript
JWS: critical review of manuscript, approval of final version of manuscript
MPS: critical review of manuscript, approval of final version of manuscript
AS: data collection, critical review of manuscript, approval of final version of manuscript
Declaration of Conflicting Interests
The author(s) declared no potential conflicts of interest with respect to the research, authorship, and/or publication of this article.
Funding
The author(s) received no financial support for the research, authorship, and/or publication of this article.