
Abstract
Study Design
A retrospective study.
Objective
To develop a prognostic score for mortality and treatment failure in Spinal epidural abscess (SEA), based on simplicity and multidimensional assessment principles.
Methods
One-hundred-fifty patients were reviewed. Variables assessed included comorbidities, functional status, clinical presentation, Frankel classification, and biochemical and radiological parameters. The main outcomes were the 90-day mortality and treatment failure, corresponding to any intensification of the initial treatment plan. Variables were sorted out with a factorial analysis. Logistic regressions were performed, and the new score was derived from the coefficients. ROC curves with Area Under Curve, calibration plots, and cross-validation were performed.
Results
Forty-three patients (29%) had treatment failure, and 15 died (10%) by 90 days. Factorization created 3 groups:
Conclusions
Comorbidities, Severity, and Function is a new simplistic tool, easy to use in daily practice; its performances were excellent for 90-day mortality, and acceptable for failures. Simple tools are more likely to be adopted into practice. External validation of this technique is desirable.
Introduction
Spinal epidural abscess (SEA) often occurs in the context of hematogenous seeding and is potentially life-threatening. 1 The mortality risk is significant, with 90-day mortality approximately 15%.2-4 SEA is associated with a neurological deficit in up to 50%, and survivors may suffer lifelong impairment. 2 Globally, the incidence is increasing due to a combination of greater prevalence of comorbid conditions, increased life expectancy, and improved diagnosis. 2 Both medical and surgical treatment play a role, although medical treatment alone has gained in popularity over the last decades. However, the risk of failure of medical treatment is high, up to 40%.2-4
Surgical management is not without risk of failure, as some patients require revision or unplanned secondary surgery for recurrent abscesses or subsequent spinal instability. SEA often occurs in the context of physiologic frailty and comorbidity. An accurate assessment of the risks associated with the disease and treatment is crucial to help clinicians and patients in their management and decision-making.
Patient-based risk assessment remains a challenge. Diabetes, age over 65, antibiotic resistance, elevated inflammatory markers, intravenous drug use (IVDU), and radiological instability are common prognostic factors.3,5-7 An assessment based on a single variable is not sufficiently discriminant to guide clinicians. Several scores or prognostic tools have been proposed, amongst them the 11-item modified Frailty Index (mFI-11)8,9 mFI-5, 10 Mortality in Spinal Infection (MSI), 11 Charlson Comorbidity Index (CCI),8,12,13 SORG Orthopaedic Research Group (SORG),14,15 Spinal Infection Treatment Evaluation Score (SITE), 16 and the postoperative decrease in CRP.7,17
However, the performances of these tools come with numerous weaknesses, methodological issues, and clinical paradoxes. The first issue is the simplicity of the score, which is directly linked to its ability to be deployed in daily practice. All the scores mentioned above have more than 5 items, and 4 have more than ten items. The SITE score includes the Charlson and American Society of Anaesthesiologists (ASA) scores. In addition, SEA is a relatively low-incidence disease compared to hip fractures, for example. All these scores were developed from several years of recruitment period or multicentric cohorts. In daily practice, it is unlikely that the volume of patients allows clinicians to explore the full range of these scores: there are too few events compared to a too large range of predictions. Therefore, there is a need for a new simple score that can be easily deployed in daily practice.
Moreover, collinearities, meaning correlations between items 18 are a silent but potentially deleterious issue when the aim is to develop a discriminative score. There are at least 2 main consequences: a decrease in the multidimensional assessment capability and the impossibility of relying on the score’s ponderation. Even if mFI-118,9 does not have ponderation, half of its items are related to cardiac disease, meaning they assess the same dimension. For MSI, a pondered score, the ASA score, and CCI score probably have associations, and the septic status might also increase the ASA score. For the SITE score, another pondered score, the neurological status is linked to canal stenosis and probably to the ability to ambulate. For SORG, there is collinearity between the multiple inflammatory markers, including platelets,19,20 and between the Albumin and the age.14,21
The baseline value of the score, also called intercept,18,22,23 represents the value when all the parameters are at their baseline and may lead to a clinical paradox. For SORG, 14 a patient with all parameters at their minimum is unlikely to exist. The SITE score is “upside down” and the lower figures indicate the worst conditions. Consequently, the figures for the healthiest patients depend on the score ponderation, which, again, may be unreliable. Also, the baseline for SITE corresponds to patients with an S2-S5 infection, with no pain and no specific radiological features; these particular radiological features are not compatible with an S2-S5 infection (spinal column deformity and disc erosion). It is unlikely a patient could reach the baseline with SITE.
Classifying variables according to their interdependence allows for determining the dimensions of the dataset; this process is called factorial analysis. 24 The new variables created after the factorization allow a multidimensional assessment. 25 We hypothesized that a factorial analysis could help develop a new performant prognostic score, addressing several of the issues mentioned above.
Therefore, this study aimed to develop a prognostic score for mortality and failure in SEA, focusing on simplicity, multidimensional assessment, and clinical coherence principles.
Material and Methods
Ethics
This study received the Hospital Review Board approval (Waikato District Health Board, Clinical Audit Support Unit; registration Number 4341PDOR220726, demand 4341P). As data were analyzed in retrospect, patient consent was not required.
Setting and Participants
This study was conducted at a tertiary referral spine center, servicing over 900,000 people. The hospital coding provided a list of patients over 18 years old diagnosed with spinal epidural abscess from January 2010 to November 2022. Patients included in the study had their electronic medical records checked to confirm a radiological diagnosis of SEA.
Variables
The demographic data collected were the age at admission, gender, ethnicity, comorbidities included in the mFI-11 and CCI, and functional status (independent or dependent). The clinical information were the clinical presentation (particularly, septic shock), the location of the infection (cervical, thoracic, lumbar, multilevel, and extra-spinal locations), the neurological status (using the Frankel classification: from E, no neurological deficit to A, complete motor and sensitive deficit). 26 The laboratory values were the C-reactive protein (CRP, mg/L), Haemoglobin (g/L), White Blood Cell Count (WBC, g/L), Platelets, and renal profile. Information about the microbiology were the type of bacteria and the resistance/sensitivity profile. The radiological information was the presence of osteomyelitis or discitis. The SORG, mFI-11, and CCI were subsequently calculated.8,9,27
Outcomes
The risk of death was assessed at 90 days as a primary outcome of interest. Any intensification of the treatment defined the failure, for example, a failure of initial medical management with antibiotics requiring surgery (that is, the initial treatment plan was nonoperative, but the patient subsequently required surgery), or the failure of surgical treatment (that is requiring a second surgery for either recurrent abscess collection or subsequent need to stabilize due to ensuing instability).
Bias
When elaborating a score, there is a risk of overfitting the models. K-fold cross-validation was performed to test the score's performance. 28
Statistics
When describing the data, we report the median, first, and third quartiles for quantitative variables. We report counts for categorical variables. The associations between all the variables and the outcome were tested using a Generalized Linear Regression.
The main objective was to elaborate on a prognostic score for the risk of death and treatment failure. It was a four-step process.
The first step was a factorial analysis using a correlation matrix and Pearson correlations. The factorization aimed to identify all the correlations between the variables. After mapping all the correlations between all the variables (these correlations can be visualized in a colored matrix), the variables were regrouped in clusters of similar clinical meaning. For instance, in the case of inflammation, there is a raised CRP, white cells, and a decrease in hemoglobin; these 3 variables are correlated and can be regrouped in a cluster called “inflammation”. A similar process can lead to a cluster “comorbidity,” with the variables “medical history of a heart attack,” “chronic kidney failure,” and “chronic obstructive pulmonary disease.” After the process of factorization, the second step was to test its quality. A good factorization meant a low correlation between the clusters, allowing a multidimensional assessment. The correlations between the clusters were tested using Pearson correlations. Similarly, the internal consistency between the clusters was tested with a Cronbach’s alpha score; a low internal consistency (<.70) was expected, reflecting the multidimensional assessment.
After assessing the quality of the factorization, the third step was to produce a point-based score. The clusters became the items of the score, and the points attributed to each item were calculated using logistic regressions. Regressions were performed to test the association between the items, the 90-day mortality, and treatment failure. The coefficients of the regressions allowed to determine the points attributed to the items.
The last step was for the score performance assessment and the cross-validation. C statistics were performed, and the Area Under Curves (AUC) was calculated to assess discrimination. Calibration was assessed graphically with calibration plots. 23 These plots compare the actual and predictive probabilities: scores with a good calibration had a nonparametric curve (dashed curve) close to the ideal curve (grey line). K-fold cross-validation was performed with test datasets, with k = 4 for failures (37 observations each) and k = 3 (50 observations each). The subdivision of the primary dataset in 3 or 4 smaller datasets for the cross-validation inevitably led to a decrease in power, and smaller counts were expected for each score figure. The primary alpha risk was set at .05.
Results
Cohort Description
Descriptive data. Quantitative Variables: Median (Q1-Q3). Categorical Variables: Number (%).
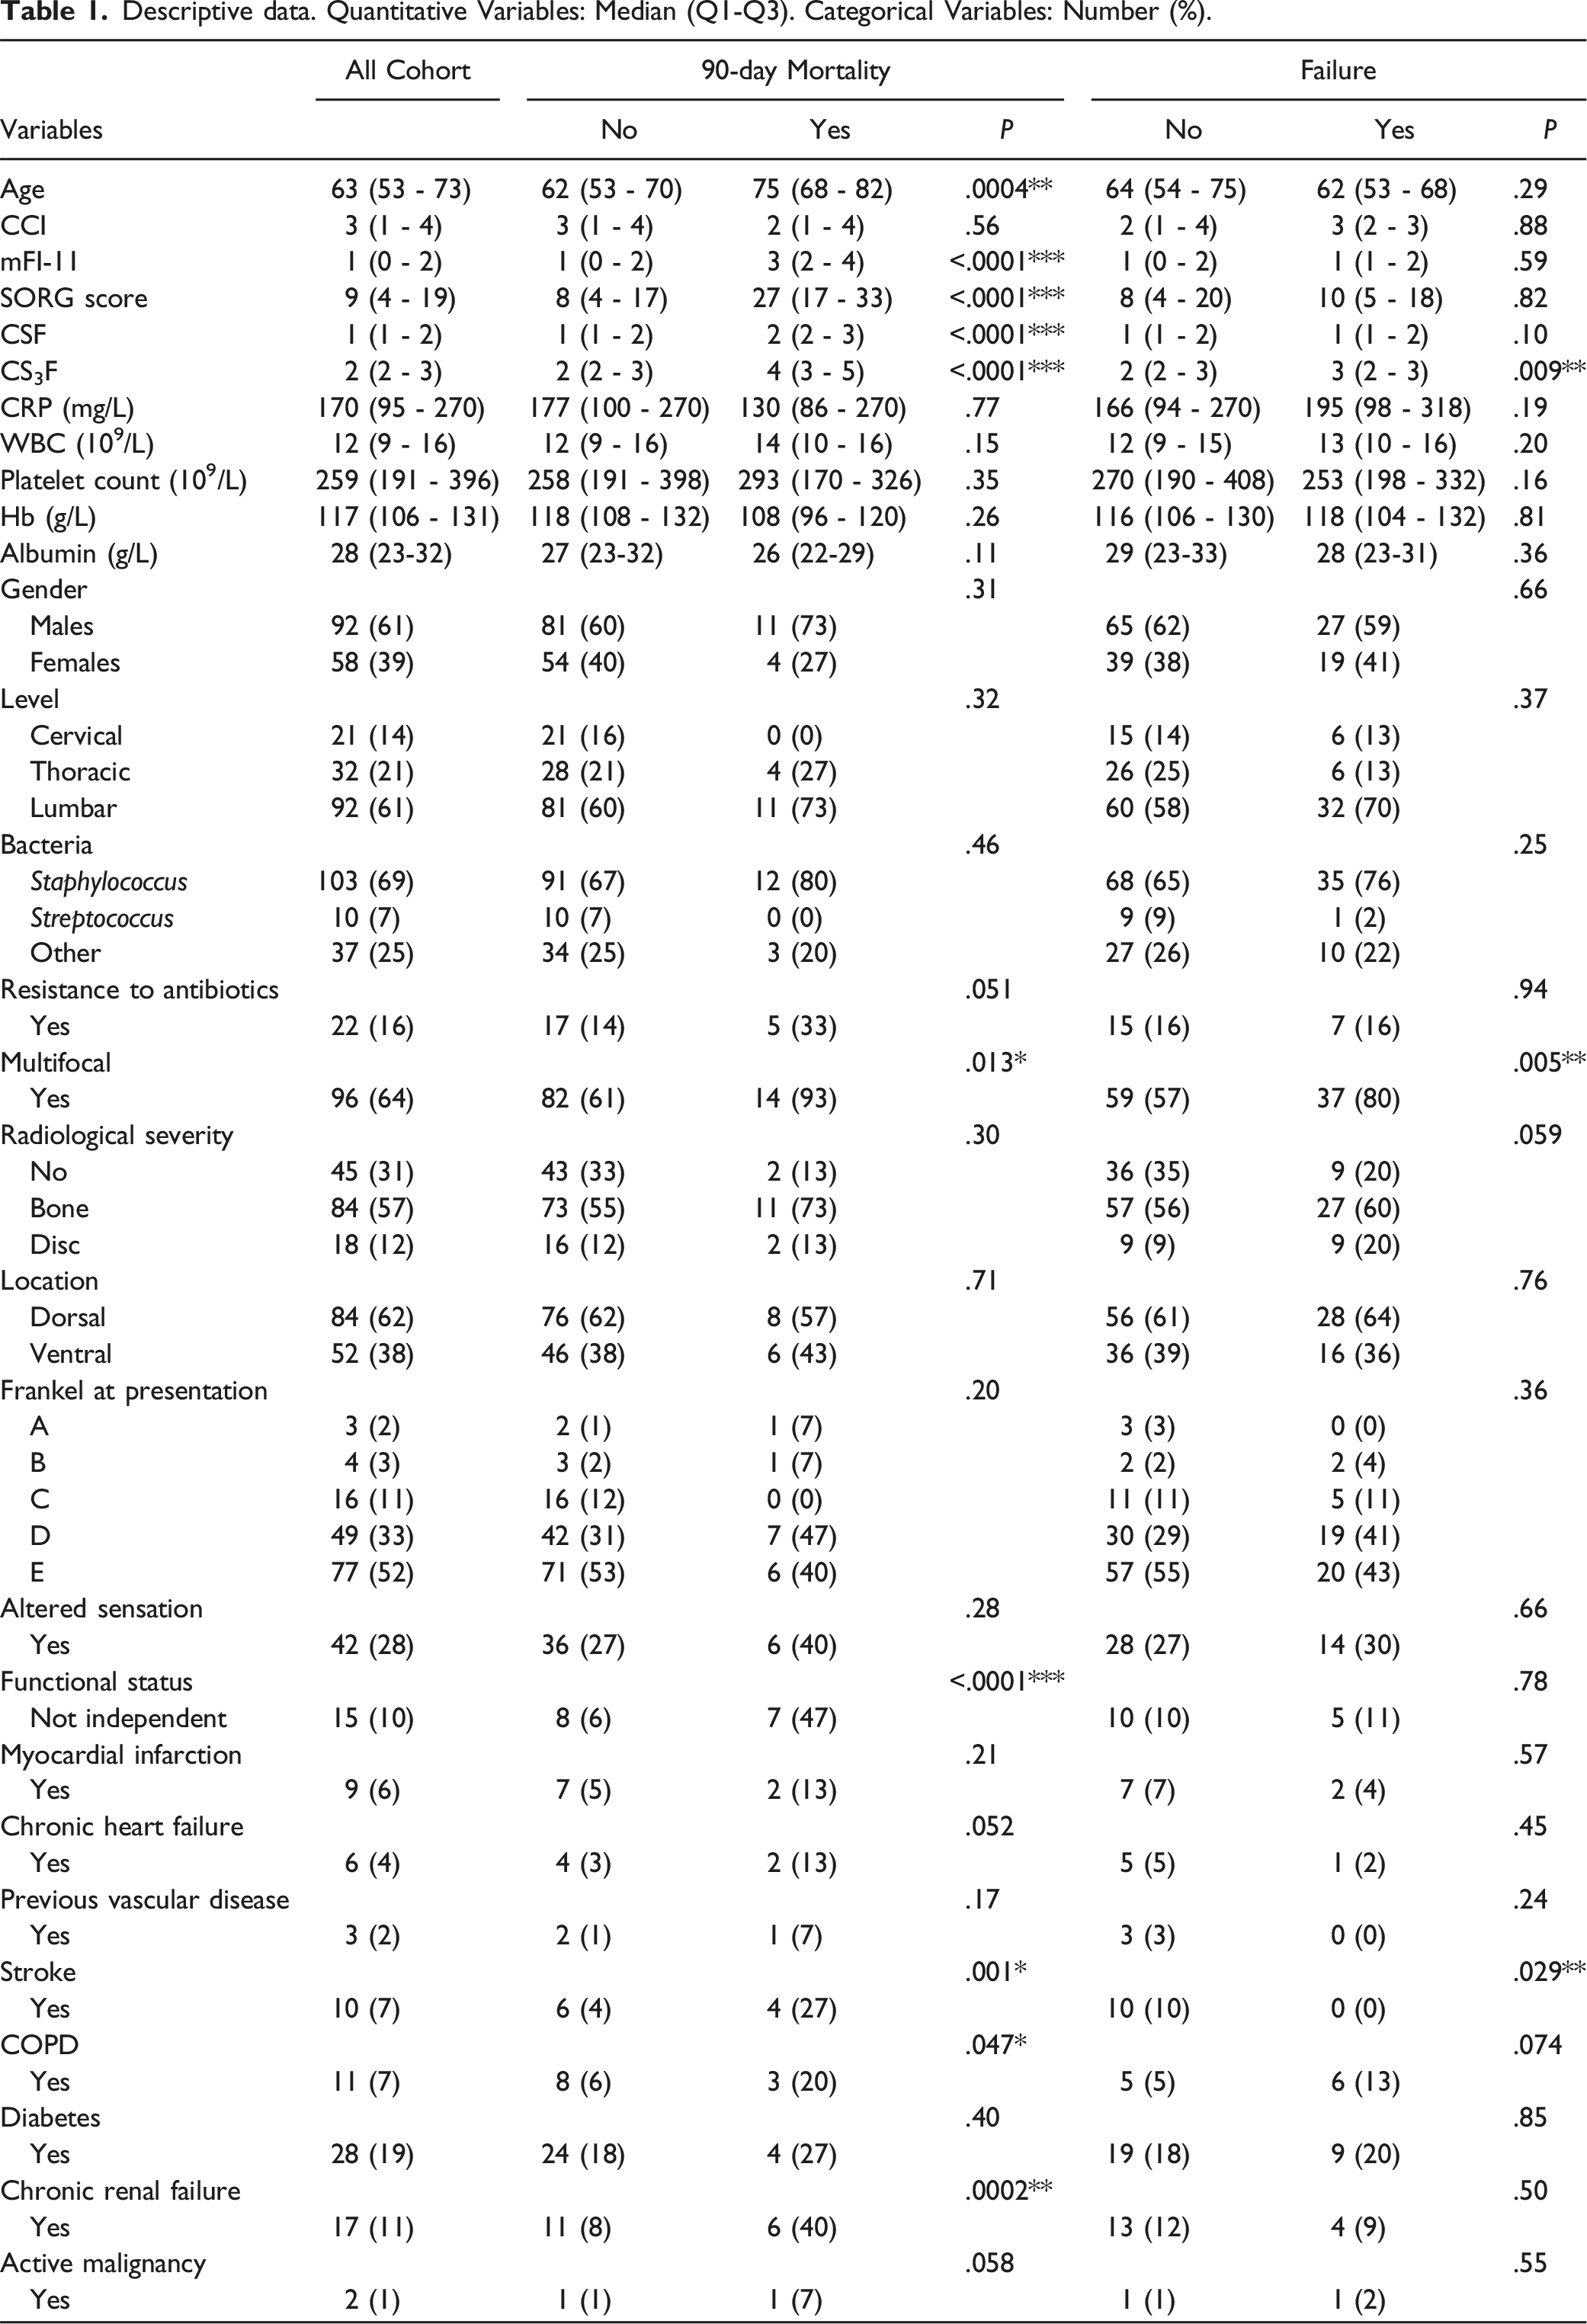
The variables associated with the risk of failure were multifocal infection (OR = 3.15, 95% CI 1.4-7.5, P = .002) and history of stroke (OR = 7, 95% CI 1.78-31, P = .02). The involvement of the disc or the bone has some association with failure (OR = 1.97, 95% CI .98-4.65, P = .059), Table 1.
None of the CCI, mFI-11, and SORG scores were associated with the risk of failure (P = .87, .58, and .81, respectively).
The variable associated with the risk of death was age (OR = 1.07, 95% CI [1.03-1.12], P = .0002), P = .03), history of stroke (OR = 7, 95% CI [1.9-30], P = .002), congestive heart failure (OR = 5, 95% CI [1.2-40], P = .02), a functional status not independent (OR = 13, 95% CI [2.3-24], P = .0006), chronic obstructive pulmonary disease (COPD) (OR = 2.5, 95% CI [1-5], P = .04), chronic renal failure (CRF) (OR = 7, 95% CI [2-25]), and multifocal infection (OR = 6.5, 95% CI [1.7-41], P = .01), Table 1. The mFI-11 and SORG scores were associated with both the 30-day and 90-day mortality; the ORs were 3.1 95% CI [1.9-5.5] P < 10−4, and 1.07 95% CI [1.03-1.12] P = .0006, for mFI-11 and SORG, respectively, at 90-day.
Factorial Analysis
Age and hemoglobin were the variables with the maximum number of significant correlations (Figure 1). Pre-factorisation correlation matrix. Numerous correlations are found between variables. The age and haemoglobin were the 2 variables with the maximum correlations. There were excluded from the score because of the risk or collinearity. Functional status was separated alone because of a fewer number of correlations, and because it brought a relevant clinical information. Other clusters were the comorbidities, avec the severity parameters.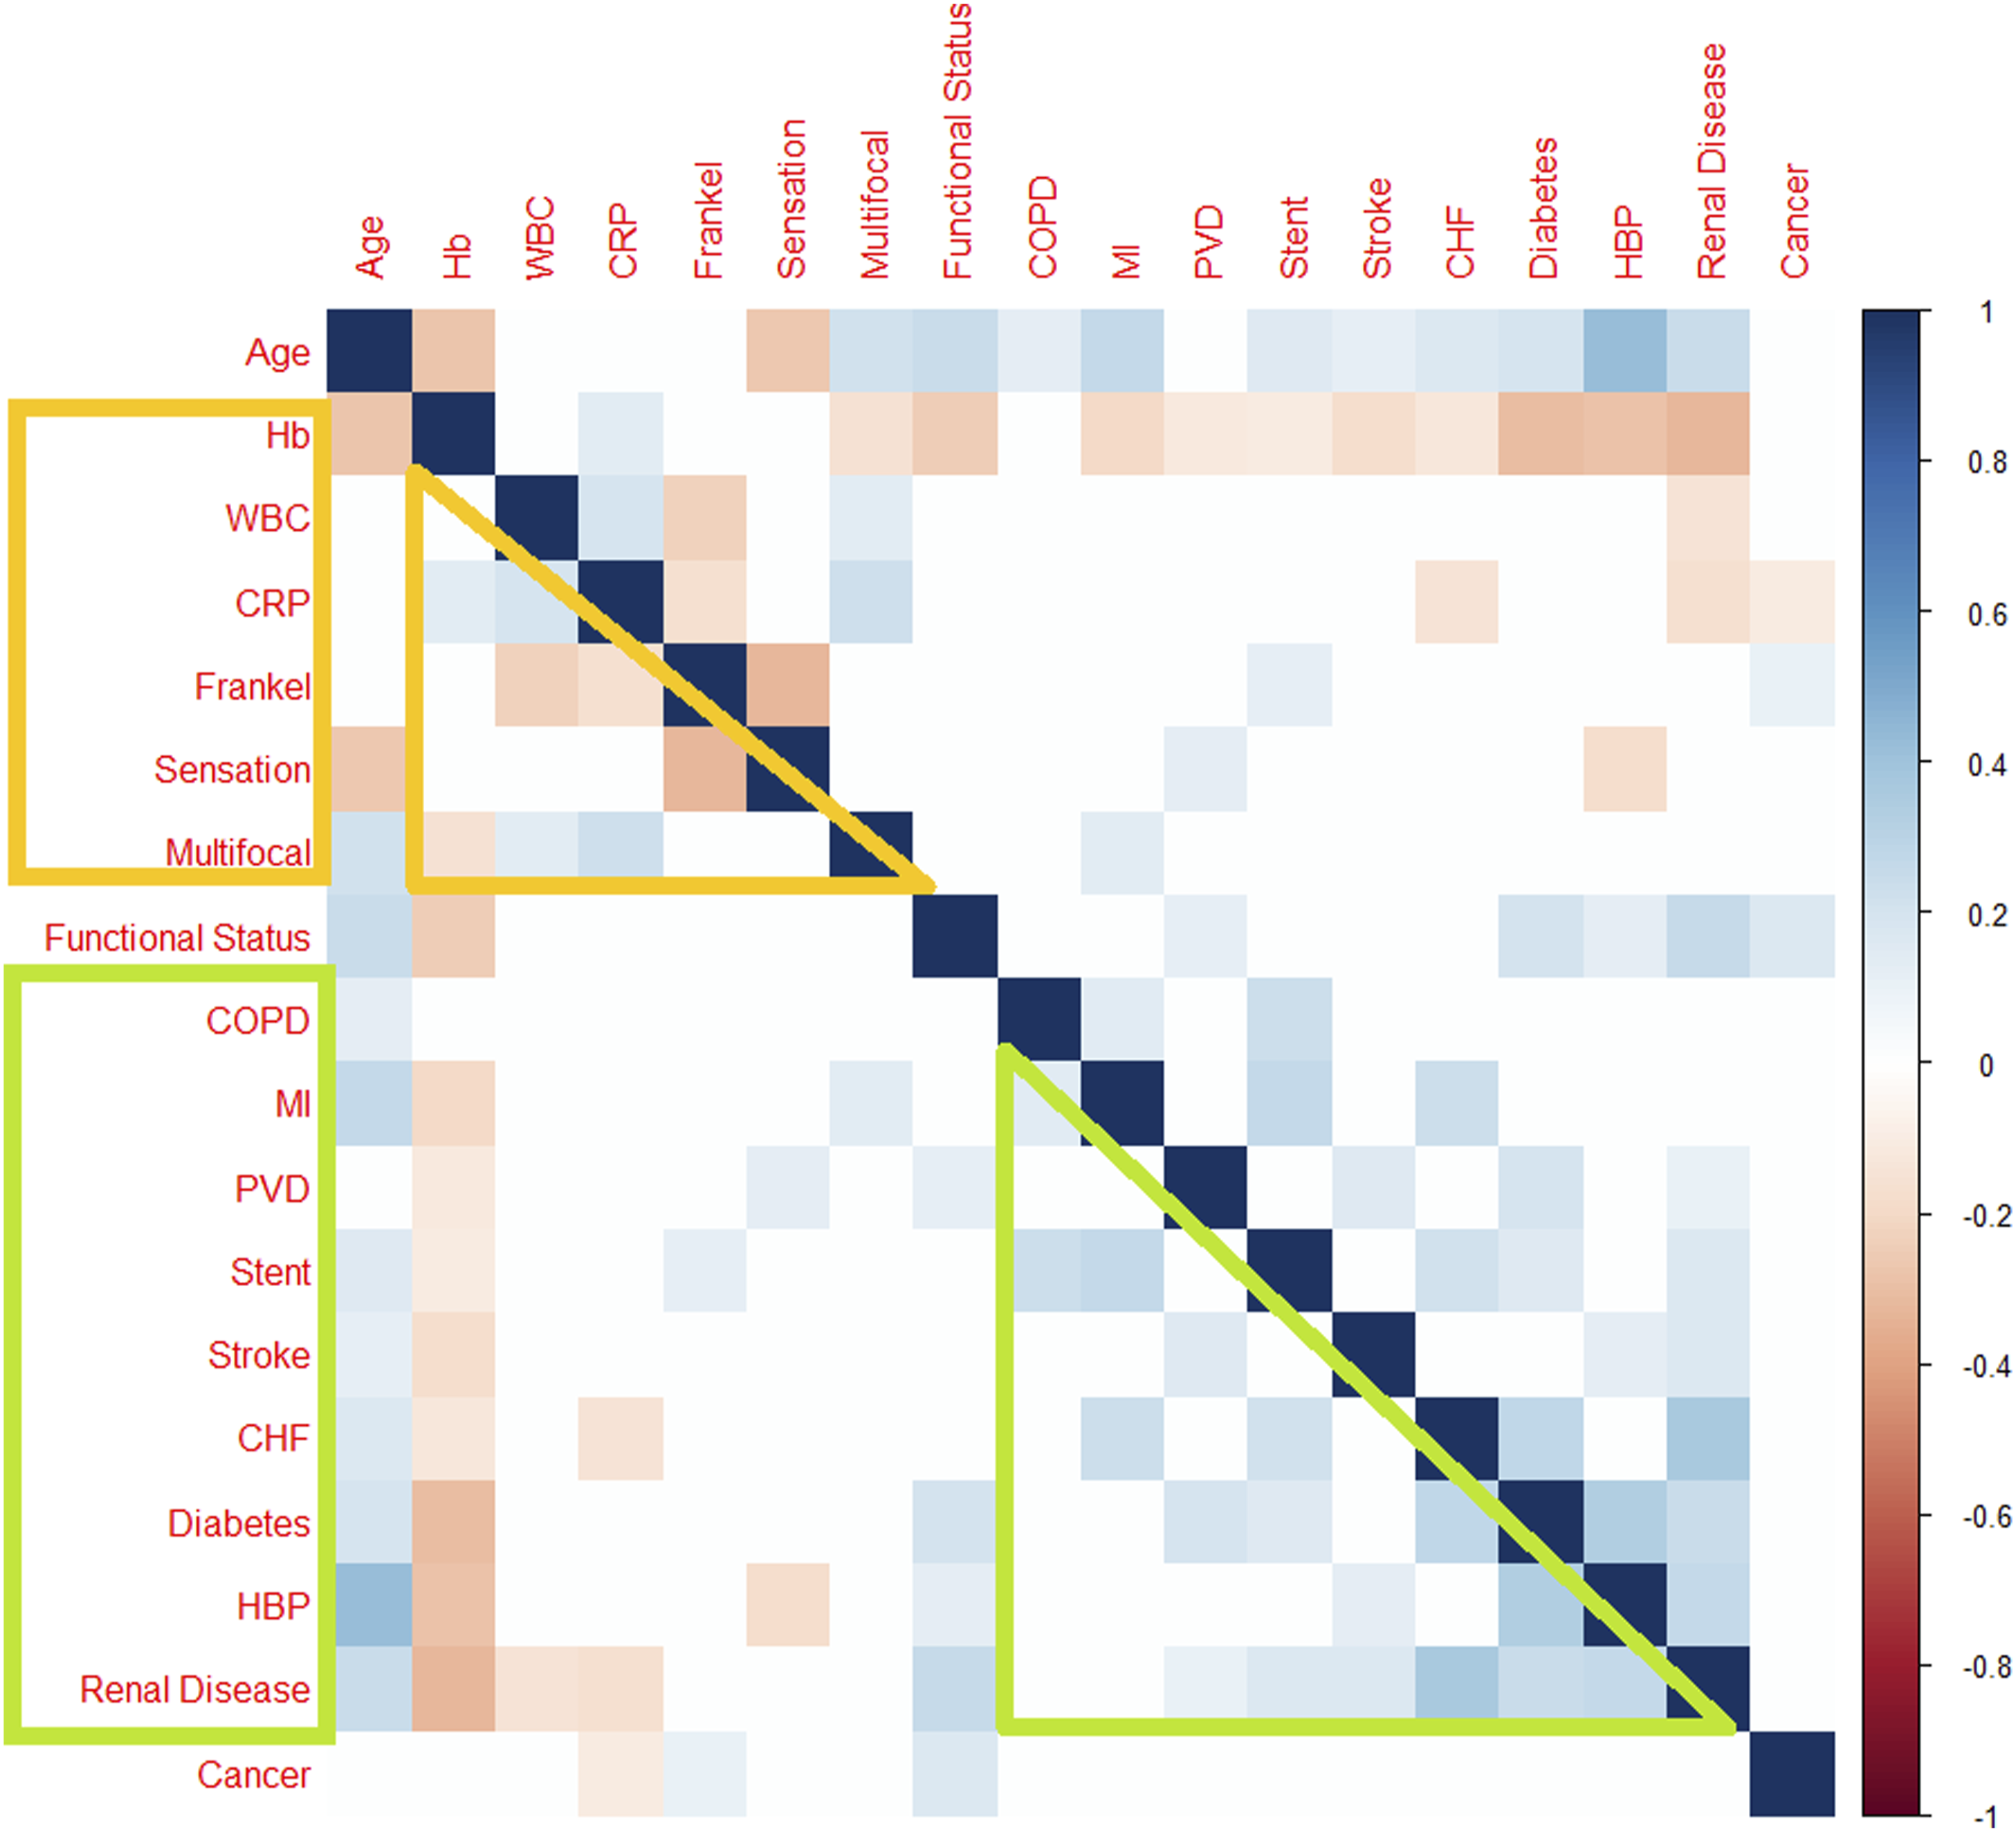
There were several significant positive or negative correlations between the comorbidities, especially between myocardial infarction, chronic renal failure, congestive cardiac failure, previous vascular disease, diabetes, and COPD (Heatmap). These variables were grouped in an entity called Comorbidities, and all the patients with 1 or more criteria were considered the same entity.
The functional was correlated to an active malignancy (r = .15, P = .05), age (r = .3, P < 10−4), diabetes (r = .16, P = .04), and chronic renal failure (r = .24, P = .002). Functional status was considered a proper cluster called Function, because it was the variable with the stronger association with 90-day and because diabetes and chronic renal failure were already in Comorbidities. Moreover, Function brought a piece of relevant clinical information, different than Comorbidities.
There was a significant negative correlation between CRP >300 mg/L and Haemoglobin <100 g/L: r = −.17, P = .05, WBC (r = .18, P = .02), Platelets (r = −.39, P < 10−4). Albumin was correlated with WBC (r = −.15, P = .05), hemoglobin (r = .35, P < 10−4), and CRP (r = −.17, P = .04). These variables gave information about the biochemical Severity of the infection and were included in a subgroup called Biochemical Severity. Involvement of either disc or bone represents the Radiological Severity and was correlated with Biochemical Severity (r = .21, P = .04).
There was a correlation between altered sensation and motor weakness Frankel < D (r = .35, P = .0009). Moreover, multifocal infection had some correlation with sensation (r = .12, P = .04). All these variables gave information about the clinical Severity of the infection and were included in a subgroup called Clinical Severity. Biochemical Severity and Clinical Severity were correlated (r = .3, P = .002), mainly due to correlations between multifocal infection, neurological weakness, and inflammatory markers (heatmap). Thus, Clinical, Radiological, and Biochemical Severity were gathered in the same Severity group.
After factorization (Figure 2), there was some correlation between Comorbidities and Function (r = .15, P = .04). Cronbach’s alpha score .12. The product of this factorization was named CSF (standing for Post-factorisation correlation matrix. There was only a small correlation between Function and Comorbidities. This correlation was expected as Function was associated with some comorbidities. Items of CFS Score.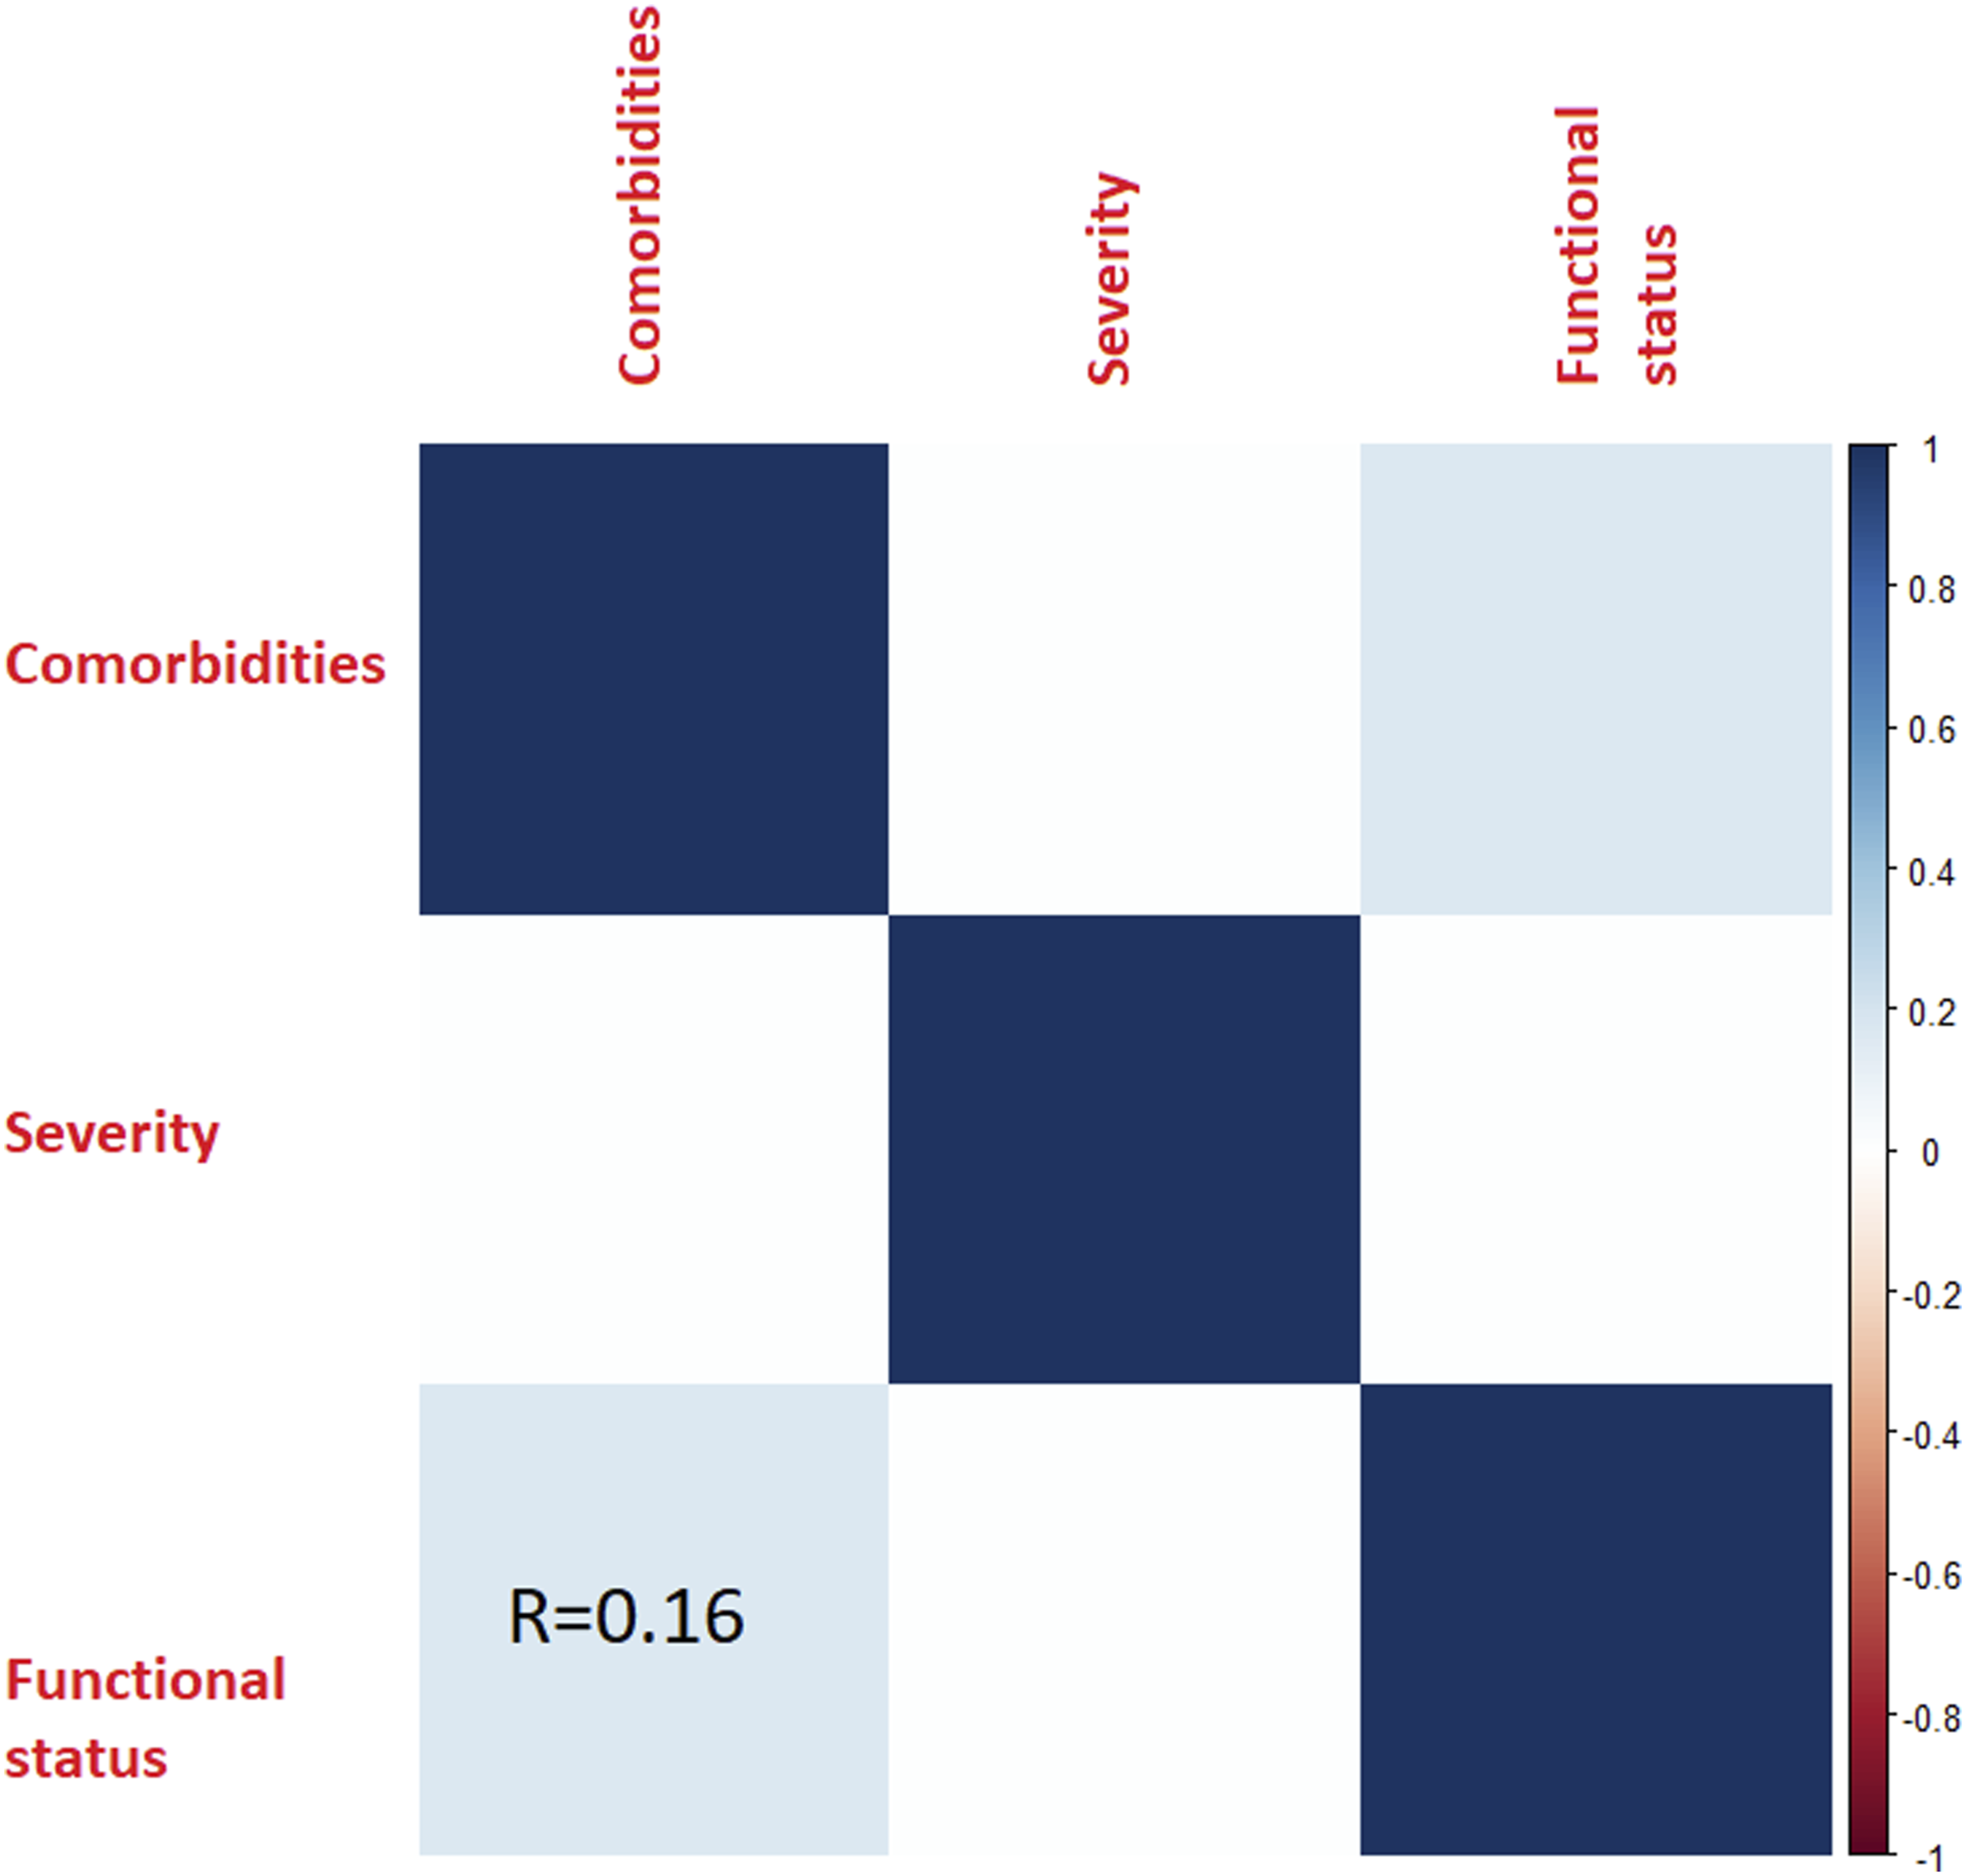
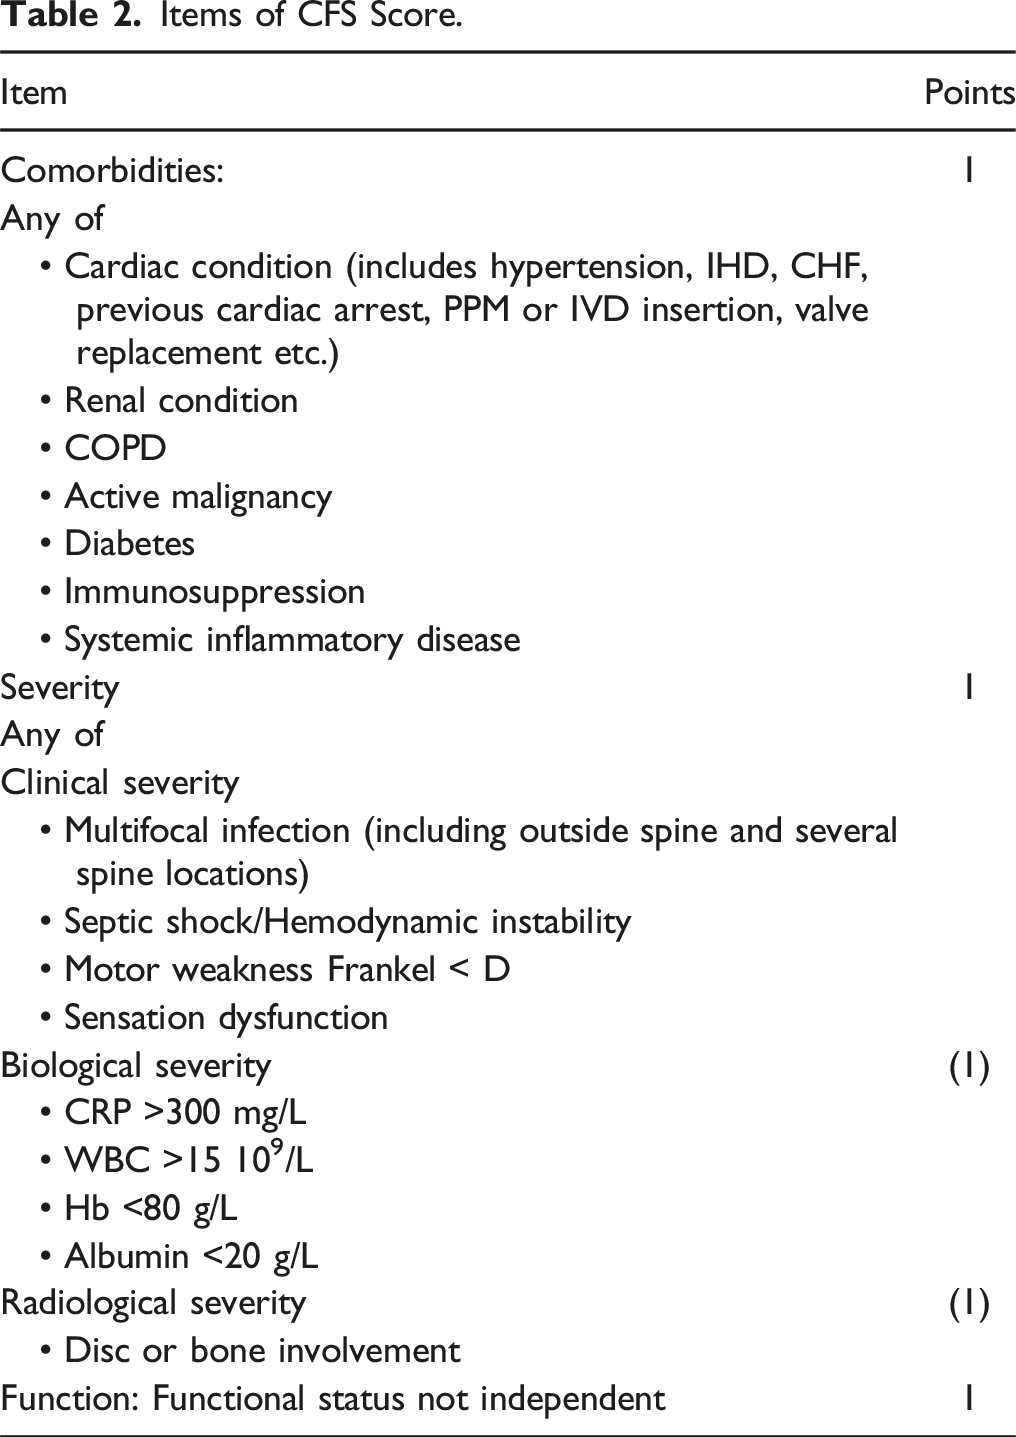
Point-Based CSF Score
Comorbidities, Severity, and Function were significantly associated with the 90-day and 1-year mortality. For the 90-day mortality, the OR were 1.20, 95% CI [1.1-1.31] P = .0002, 1.15, 95%IC [1.01-1.27] P = .03, and 1.36, 95% CI [1.18-1.58] P < 10−4 for Comorbidities, Severity, and Function, respectively. The OR being relatively similar, Severity, Gravity, and Comorbidities were attributed 1 point each.
Severity was significantly associated with the risk of treatment failure, OR = 1.38 (95% CI [1.15-1.65], P = .007. Comorbidities had some association with the risk of failure (OR = 2.17, P = .08). There was no association with Function.
Score Performances
Comorbidities, Severity, and Function could vary between zero and 3 points. There were 14, 76, 51, and 8 patients with a CSF score of 0, 1, 2, and 3 points, respectively. CSF score was significantly associated with the risk of death at 90 days and 1-year; the OR increased by 1.2 per point, on average, for both endpoints (CI 95% [1.1-1.3]), P < 10−4). The observed mortality rates were 0%, 1%, 15%, and 75% at 90-day, and 0%, 2%, 23%, 75% at 1-year. The AUCs were .86 and .83 for 90-day and 1-year mortality, respectively. For the 90-day mortality, the AUCs decreased from .86 to .74, .81, and .79 when removing the weight of C, S, and F, respectively. The calibration plots showed good calibration (Figure 3). Cross-validation of CSF for 90-day mortality. The area under the curve was stable around .80. The calibration plots showed a steadily increase of the observed risks with the estimated risks. The slopes and intercepts were a bit labile, and this may be explained by the small samples.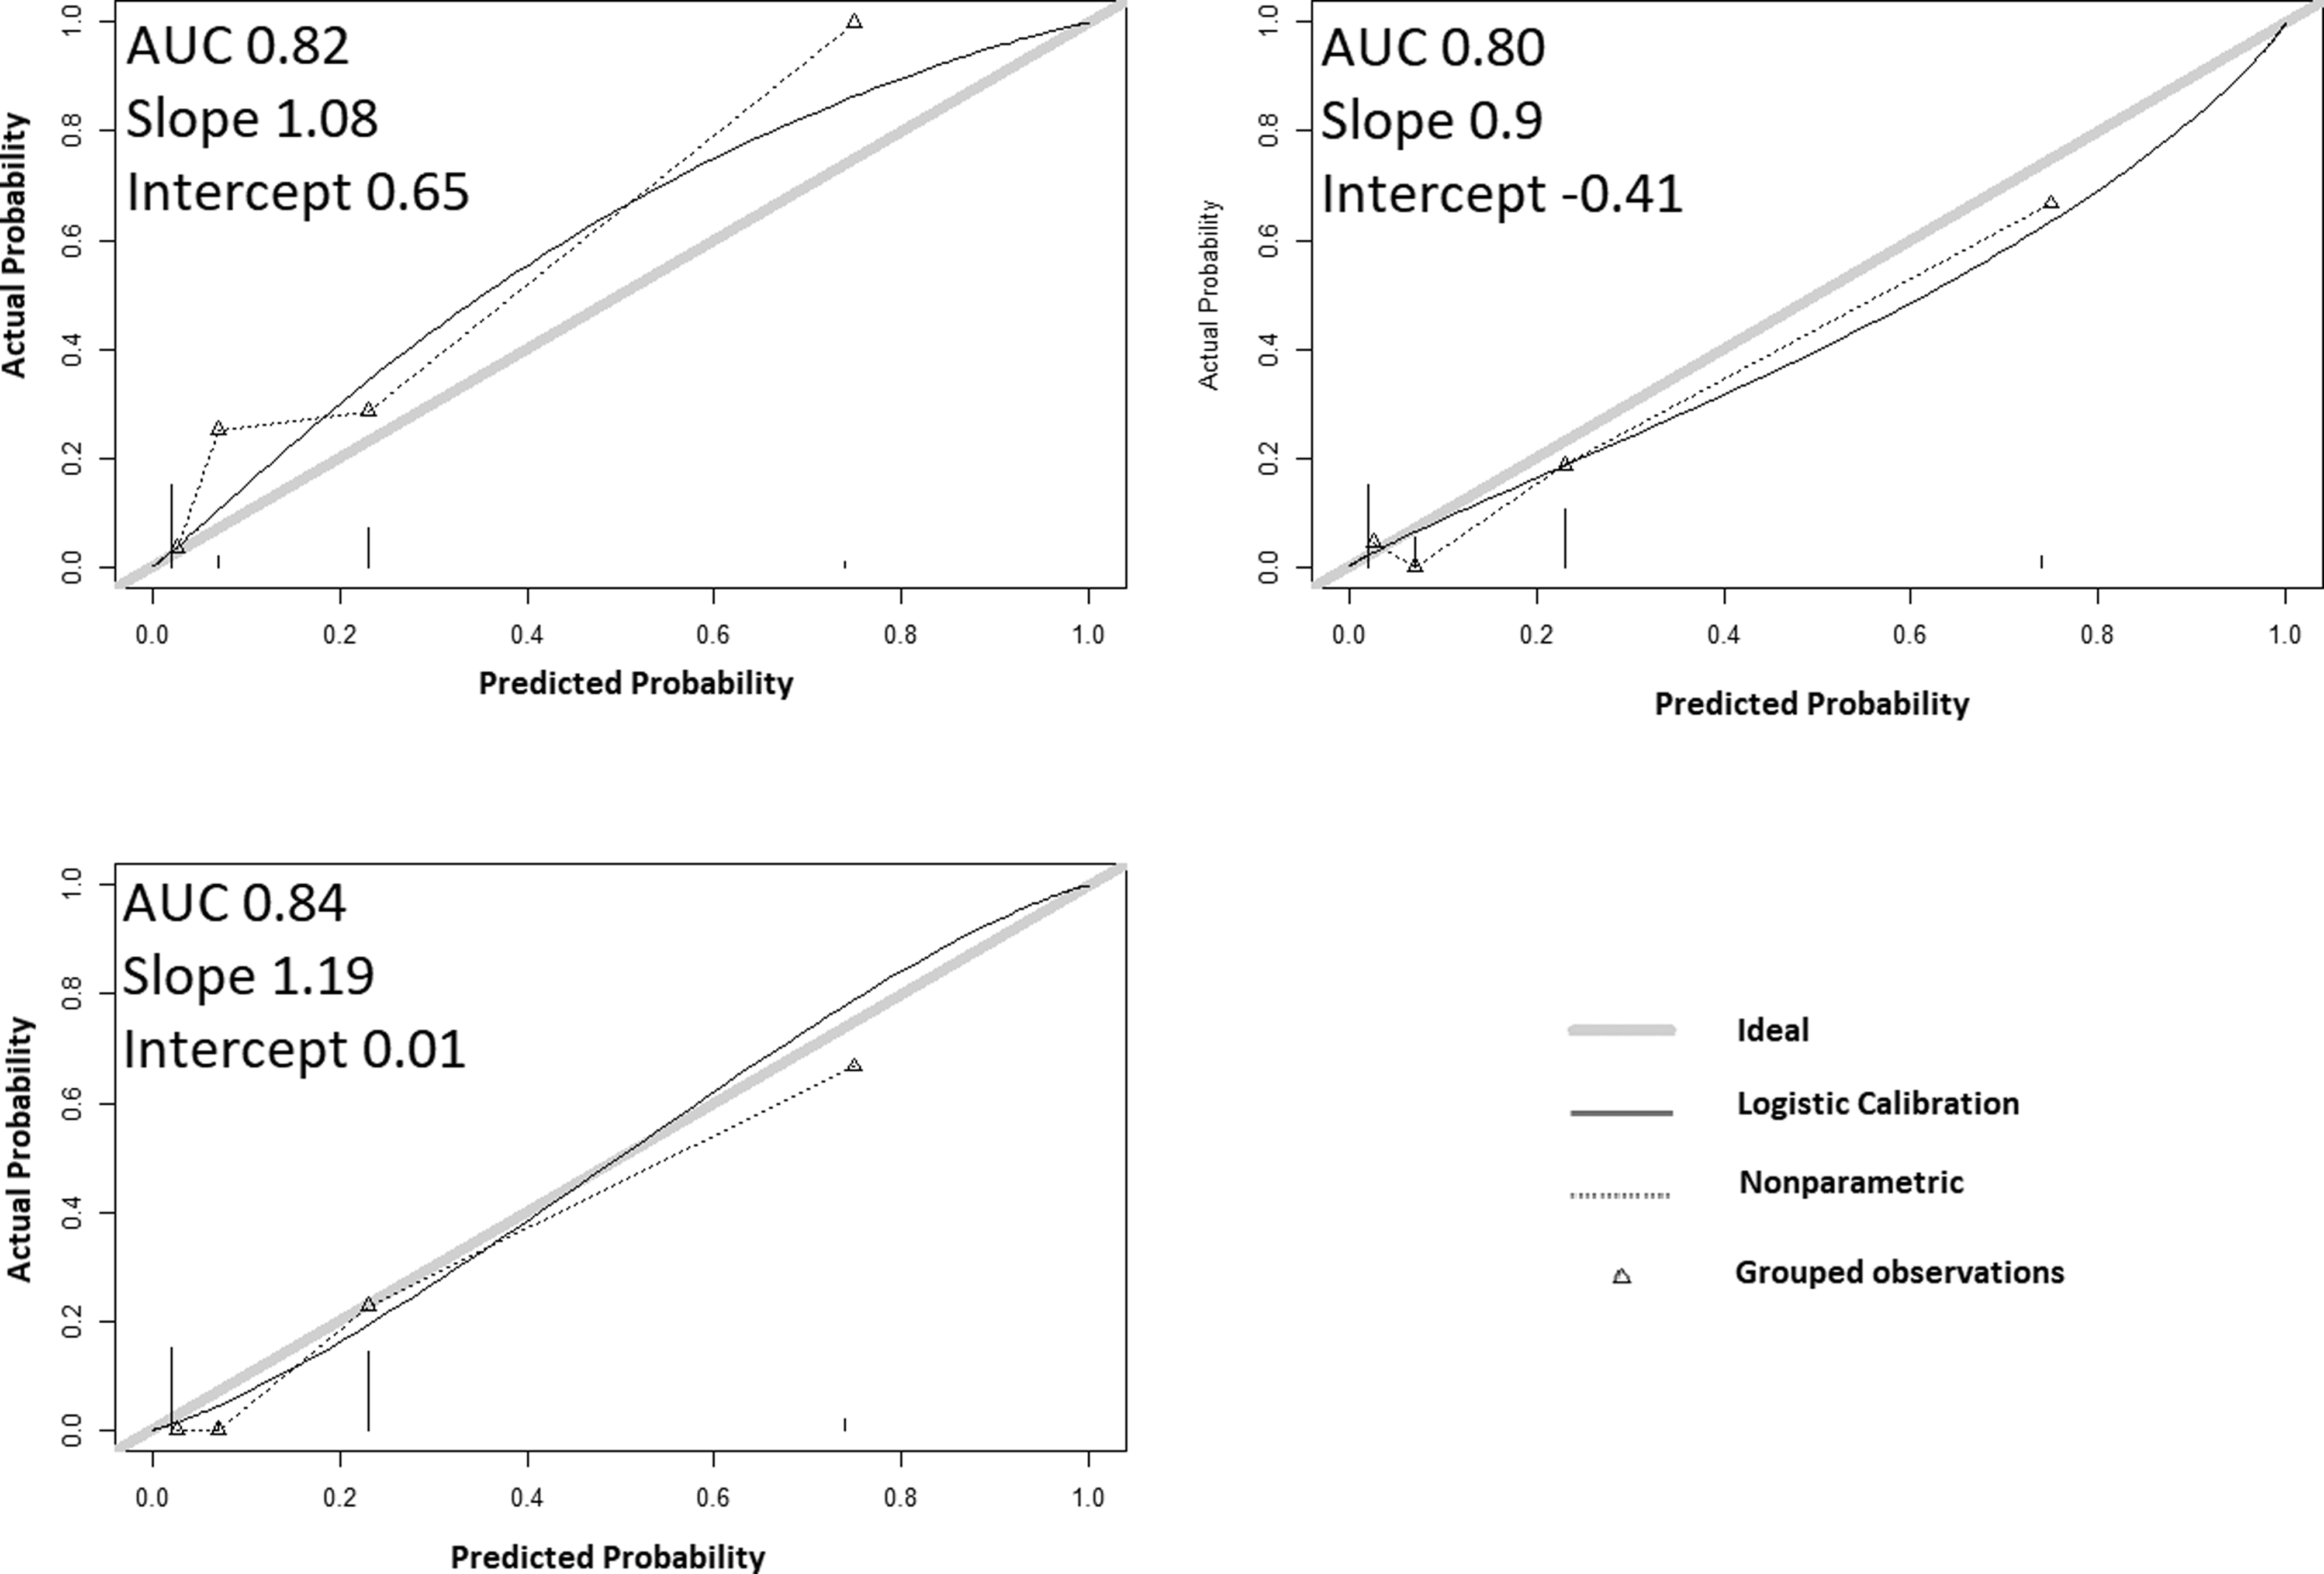
CSF score was significantly associated with the risk of failure, and the OR increased by 1.15 per point on average (CI95% [1.02-1.28], P = .014). The observed rates of failures were 0%, 48%, 44%, and 4%, with an AUC = .58, considering all the cohorts. When considering the patients who survived after 90 days, the AUC improved up to .64. The AUC further improved to .69 when the score was calculated, attributing 1 point for both Clinical, Radiological, and Biochemical Severity (CS3F), and the observed failure rates were 0%, 8%, 28%, 47%, and 33% for 0, 1, 2, 3 and ≥4 points, respectively. The calibration plots showed stable AUC, but slopes were labile and tended to be higher than 1 (Figure 4). Cross-validation of CSF for failures. The area under the curve was stable around .70. The calibration plots showed the observed risks were labile for the 2 higher estimations, which may be explained by small samples and competition between mortality and failures. Patients with high score were also at risk of death and some were “removed” from the failure group.
Discussion
This study demonstrated the extent of the cross-correlations amongst candidate predictive variables for death or treatment failure in SEA. Age and hemoglobin were the 2 variables most frequently correlated with others. Considered separately, they were some of the very few variables correlated with the risk of treatment failure. The factorization process created 3 group variables: Comorbidities, Severity, and Functional status; this process transformed a highly correlated set of variables into very informative items with absence or very low cross-correlation. The ‘CSF’ score, elaborated from the factorization, had high performance and discrimination to predict the 90-day mortality. When the Severity component is considered separately by Clinical, Radiological, and Biochemical criteria (CS3F), the score was also correlated to the risk of failure, with reasonably good discrimination but labile calibration.
Comparison With the Other Scores.
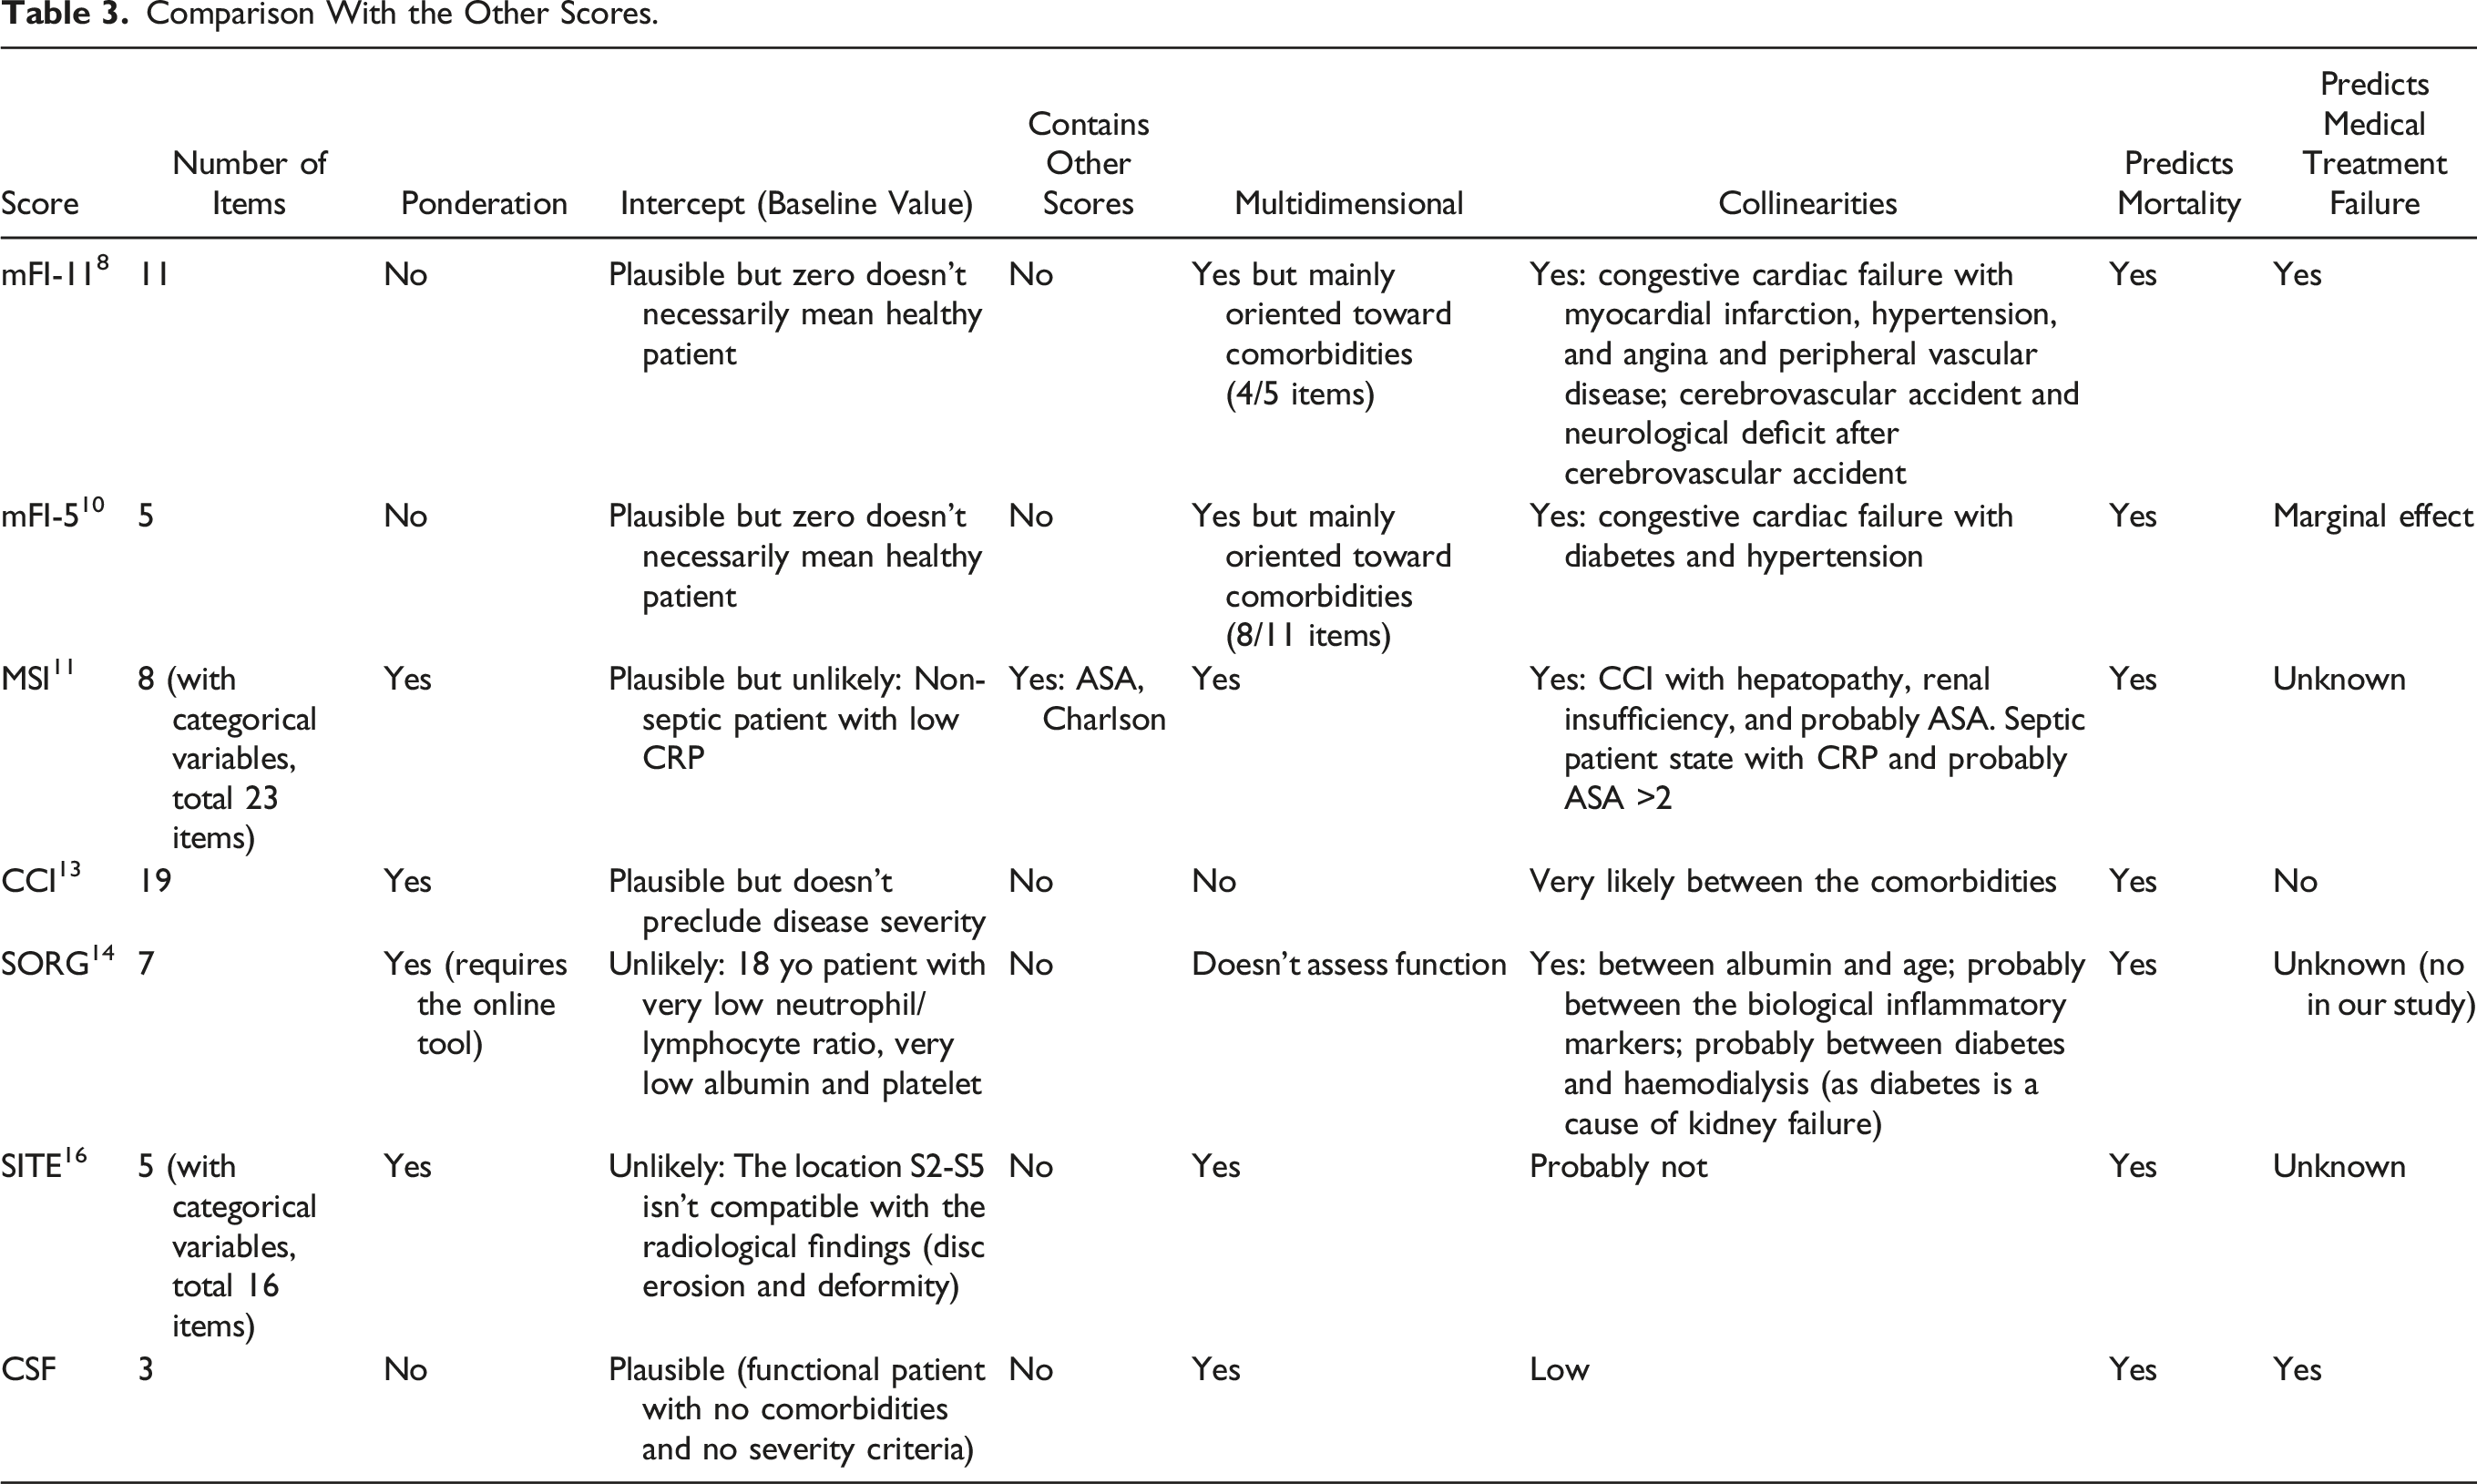
The calibration of the prognostic score determines its performance. However, in the context of external validation, the variables' weight in scores may vary, and the calibration may decrease in quality. In extreme cases, the variables contained in scores are not even associated with the outcome. Kim et al found diabetes and Methicillin-resistant Staphylococcus aureus (MRSA) as prognostic factors for failure, 29 but these 2 variables did not have an association with failure in our cohort. It is the same conclusion for Page et at., who found an active malignancy, organism identification, and gender as predictive factors of failure.33,34 Clustering the variables in patterns with a clinical signification helps to “catch” the information through the internal cross-correlations of the variables into the cluster. For instance, diabetes, a significant factor for Kim et al and Patel et al,7,29 was correlated with almost all the variables in the cluster Comorbidities.
The performances of CSF were excellent when predicting mortality but needed to be more consistent for failure. Amongst all the scores published, only the MFI-11 has shown a significant association with the risk of surgical treatment. 8 Dominguez et al have found a marginal association between the mFI-5 and the risk of failure 10 (Table 3). Severity was the main item associated with treatment failure, while all 3 items of CSF were meaningful for mortality. One of the hypotheses is the competition 35 between failure and death at the early stage. The patients with high CSF scores died earlier, so they could not have a failure anymore - this is why the AUC improved when considering only the patients who survived after 90 days. This is also why only 4% of the patients with a score CSF = 3 had a treatment failure: most patients with CSF = 3 had rather died.
This series presents some differences with the literature data that are worth mentioning. The location of the abscess is a parameter often reported as a predictive variable. The location could be the segment of the spine involved (cervical, thoracic, or lumbar), or the position ventral or dorsal to the thecal sac.5,13 None of these parameters involved the risk of treatment failure in our cohort. Diabetes is a predictive factor commonly found in the literature.5,7,29 It’s unclear why diabetes was not found significant in this cohort; it is not a matter of power because the P-value of .8 for diabetes was far from significant. Ethnicity was a prognostic factor found in a previous study in our center but was not significant in this cohort. 13 The involvement of discs and bone was a strong predictive factor in the SITE score. 16 The association was attenuated in our cohort.
This study has several limitations. The surgical delay was not considered, while it was shown to be a crucial parameter.2,36 The delay to the first antibiotherapy is also a key parameter that was not assessed. The main reason is that the population of this study is mainly from a remote area, and the care in the community was not easily standardized and accessible. Also, there needed to be more power when performing the cross-validation. We chose a k-fold number of 4 for failures and 3 for death, which allowed us to observe up to 15 events for death in each test dataset. A higher k-fold would have led to unobserved events. The slopes were labile, which can be explained by the small size of the test samples. 23 We grouped the highest figures of the score for failure (4 and 5), so it would decrease the likelihood of non-event. Despite proceeding with this grouping, no event has been observed for score = 3 for the calibration plot left bottom. Another limitation is the imprecision of some parameters, such as the radiological characteristics. Moreover, although failures corresponded to an escalation in the treatment, there was a lack of details for the reasons for treatment failure and why the treating surgeon decided to modify treatment plans. For instance, it could be an increase in instability, cord compression, or a second new abscess location. Finally, the factorization was maybe too much for failures, with a narrow range of figures. This is probably why CSF was better when differentiating Clinical, Radiological, and Biological Severity for failures.
Conclusion
CSF is a three-item score that is easy to memorize and use in daily practice. Its performance was excellent and robust to predict 90-day mortality. CS3F, which detailed the clinical, biological, and radiological criteria of disease severity, was associated with the risk of failure, but the performances were not as well calibrated as those for mortality. A competition between treatment failure and mortality was responsible for an overall decrease in the score performance when assessing the risk of failure. In daily practice, the multidimensional assessment of the patients leads to as good discrimination as more refined scores. The numerous cross-correlations between the variables helped to catch information. They led to a change in paradigm when developing the score: not using “AND” anymore, but “OR” when considering variables of the same dimension.
Footnotes
Declaration of Conflicting Interests
The author(s) declared no potential conflicts of interest with respect to the research, authorship, and/or publication of this article.
Funding
The author(s) received no financial support for the research, authorship, and/or publication of this article.