
Abstract
Study Design
Retrospective Study.
Objective
At the North American Spine Society (NASS) conference, participants may influence spine surgery practices and patient care through their contributions. Therefore, their financial conflicts of interest are of notable interest. This study aims to compare the demographics and payments made to participating surgeons.
Methods
A list of 151 spine surgeons was created based on those who participated in the 2022 NASS conference. Demographic information was obtained from public physician profiles. General payments, research payments, associated research funding, and ownership interest were collected for each physician. Descriptive statistics and two-tailed t-tests were used.
Results
In 2021, 151 spine surgeon participants received industry payments, totaling USD 48 294 115. The top 10% of orthopedic surgeons receiving payments accounted for 58.7% of total orthopedic general value, while the top 10% of neurosurgeons accounted for 70.1%. There was no significant difference between these groups’ general payment amounts. Surgeons with 21-30 years of experience received the most general funding. There was no difference in funding between surgeons in academic or private settings. For all surgeons, royalties accounted for the largest percentage of the general value exchanged, while food/beverage accounted for the largest percentage of transactions.
Conclusion
Our study found that only years of experience had a positive association with general payments, and most monetary value belonged to a small handful of surgeons. These participants receiving significant money may promote techniques requiring products of companies providing their compensation. Future conferences may require disclosure policy changes so attendees understand the degree of funding participants receive.
Keywords
Introduction
Financial relationships between physicians and the medical device industry are common and have the potential to influence research, education, and patient care.1-3 To increase transparency and knowledge of these relationships, the Physician Payments Sunshine Act was signed into law in 2010. 4 This law requires transfers of value from manufacturers to health care professionals over 10 USD to be reported to the (CMS) following Centers of Medicare and Medicaid for public disclosure.5,6 In 2014, CMS began publishing the payments reported by drug and device companies to physicians on Open Payments, a publicly searchable database.7,8 In 2021, Open Payments records reported a total value of over 10 billion USD was exchanged between industry and health care professionals or teaching hospitals. 9
Relationships between spine surgeons and the medical device industry have been well-established.10-12 The use of implants and surgical tools are routine in spine surgery, and patients support manufacturers receiving input of surgeons to innovate these products.13,14 As a result, numerous studies using the Open Payments database have highlighted the strong ties of orthopedic surgeons and neurosurgeons to industry.10,12,15,16 Both specialties have been among the top recipients of funding from medical device and pharmaceutical companies.12,15 Additionally, orthopedic and neurological surgery has been found to have the first and second surgeon greatest general payment amounts of any specialties, valued at over USD 38 million and 17 million, respectively. 15 However, funding from industry can create conflicts of interest when it comes to a surgeon’s research and educational activities. Matsen, F.A., et al. found significant positive correlation between number of physician’s disclosures and the number of presentations they give at conferences. 17
The clinical findings and techniques presented by surgeons at national spine conferences have the potential to shape physician practice throughout the country as conference attendees often consider the information presented for implementation into their own practices. As a result, the North American Spine Society (NASS) conference requires participants in NASS-related events to disclose all commercial support relationships within the last two years, along with relevant financial relationships no matter when they existed. 18 However, there is a paucity of literature examining the funding of those that participate in national conferences. Ultimately, further exploration of the influential participants at the 2022 NASS conference and their funding is warranted.
The purpose of our study is to compare demographics and industry payments made to participating spine surgeons to determine if any differences exist. In this study, we chose to analyze specialty, practice setting, years of experience, state of practice, and sex. Limited research has been performed on national spine conference participants and their financial relationships. Our goal is to shed light on the funding received by physicians presenting at leading conferences. Given the potential impact these conferences have on practices around the country, it is important to examine the funding associated with those who present. This examination will help attendees of large national conference to better understand the potential biases and conflicts of interests that may be present and could ultimately lead to changes in conference policies.
Methods
Data Source and Collection
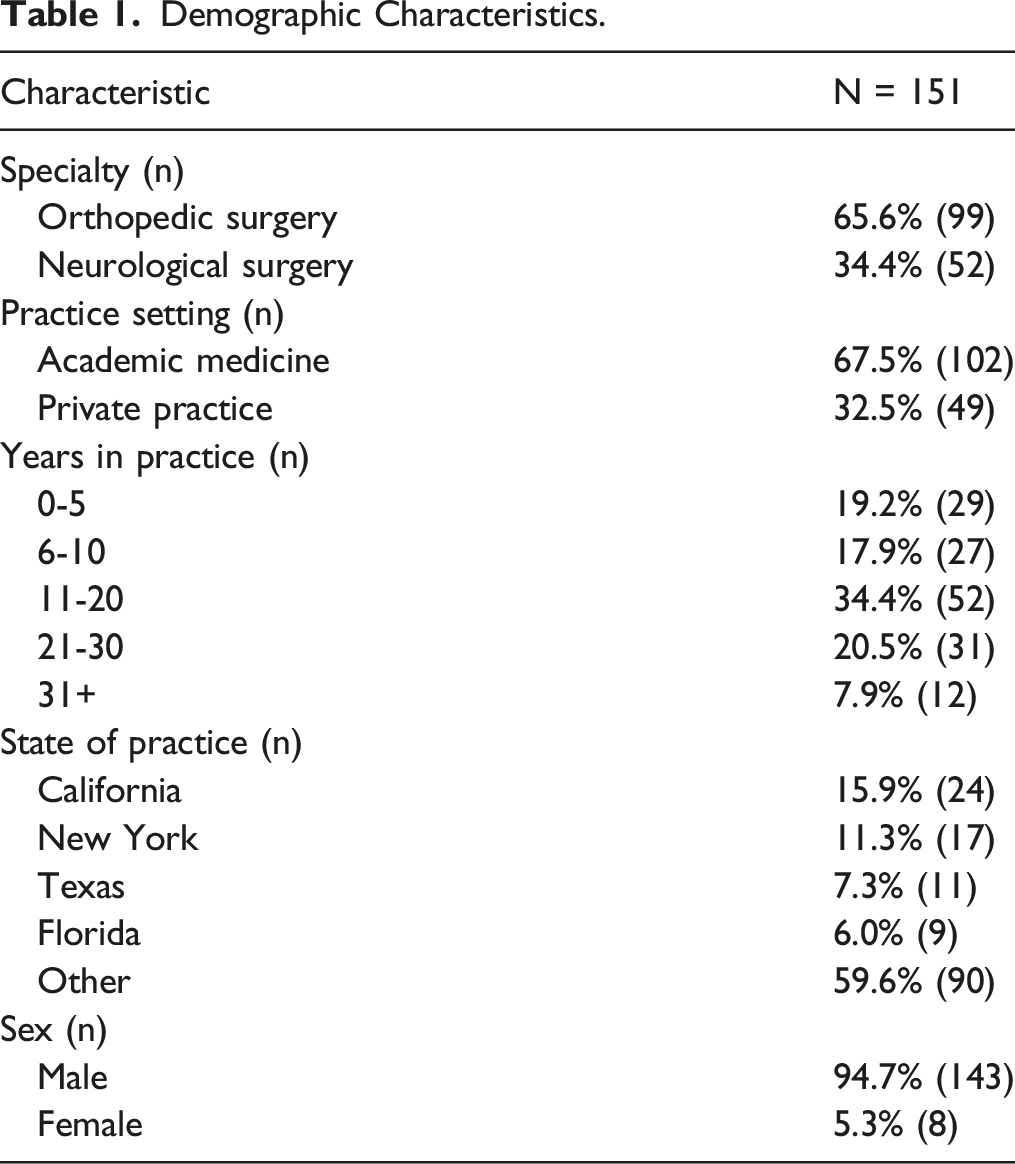
From October 12-15th, the 37th North American Spine Society Annual meeting was held in Chicago, Illinois. 19 The 2022 NASS Final Program was used as the source of physicians for this study. Participants who presented techniques, moderated debates, reviewed abstracts, or were board members for the 2022 NASS conference were recorded. Of the 312 physician participants, 151 met the inclusion criteria: Physician with a completed training in orthopedic spine or neurological surgery, practice based in the United States, and training completed prior to or during 2021. 161 physicians were excluded due to: (61) Training in fields other than orthopedic spine or neurological surgery, (44) training completed during or after 2021, (37) practiced based outside the United States, or (19) no available payment information.
Demographic information was obtained on each surgeon who met the inclusion criteria using public physician records. These records include faculty, medical school, and physician group websites. Years of experience, practice setting (academic or private), sex, and state of practice were adapted from each of the physician’s profiles.
Open Payments database was used to collect information on payments made to NASS participants. Primary outcomes included general payments, research payments, associated research funding, ownership and investment interest, and the number of companies making payments. General payments were further divided into subgroups: royalty/license, consulting fee, traveling/lodging, food/beverage, entertainment, grant, honoraria, education, gift, current/prospective ownership, acquisitions, and other services. For each subgroup, the amount, number, and proportion of total value was recorded.
Data Analysis
Data analyses were performed using Matlab R 2022b and Microsoft Excel 2022 (Version 16.69). Assessment of payment differences between demographic groups were analyzed using Student t-tests. All statistical tests performed in this study were two-tailed, and significance was set at P < .05. Parametric data was recorded in tables as mean ± standard deviation, followed by the associated P-value. Descriptive statistics were performed on each Open Payments category, such as general payments. Averages and percentages were used to express the final data.
Results
Demographic Information
Demographic Characteristics.
Payment Information
The total industry payments of the 151 included surgeons in 2021 rounded to USD 48 294 115. Total general payment value was USD 15 717 413. Total ownership and investment value totaled USD 30 409 185 with 1 surgeon collecting USD 26 590 482. Associated research funding totaled USD 2 150 793. Additionally, total research payments totaled USD 16 725.6 625 general payment exchanges occurred between the surgeons and industry in 2021. The median general payment amount was USD 14 760 per-surgeon, while the average was USD 104 089 per-surgeon.
Funding Characteristics by Surgeon Specialty.
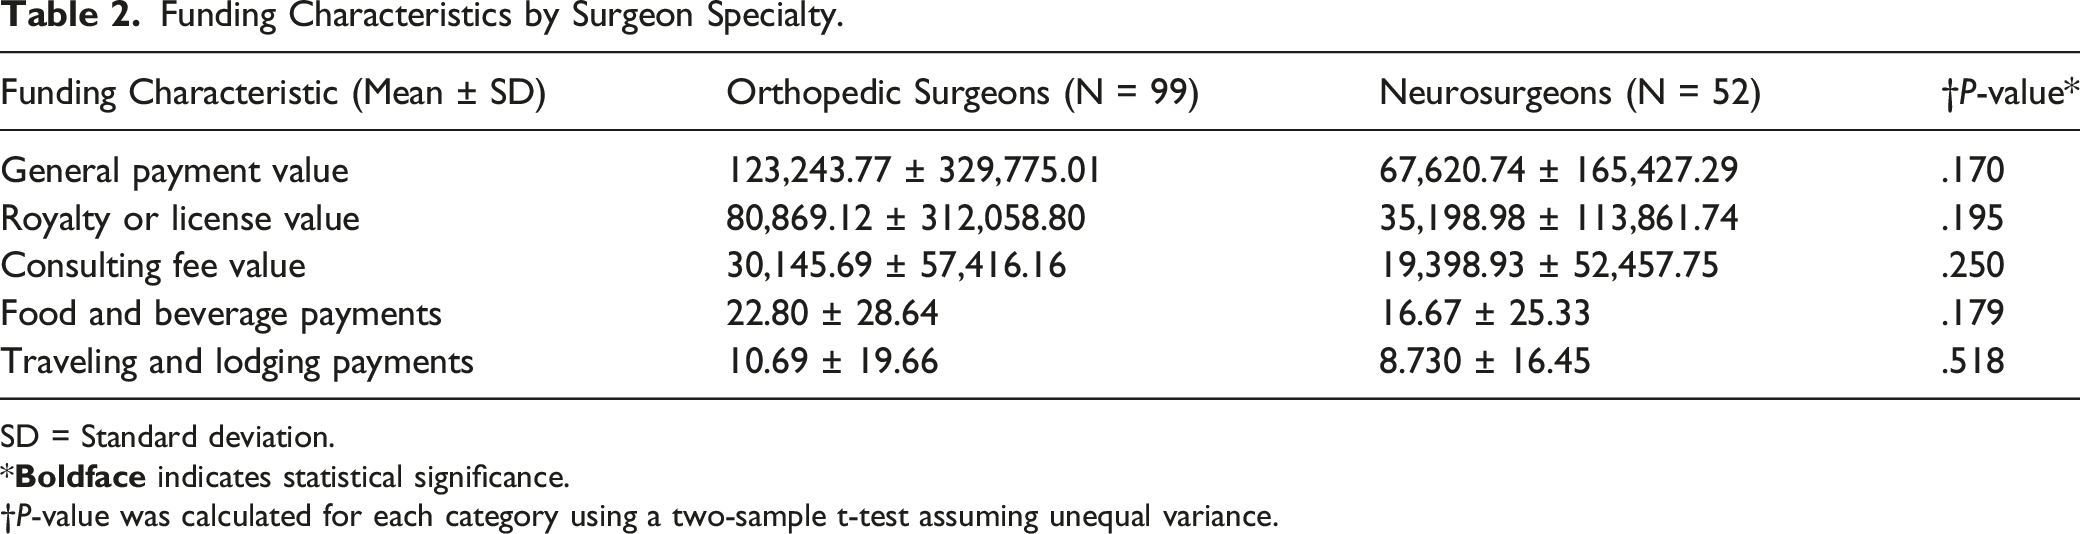
SD = Standard deviation.
*
†P-value was calculated for each category using a two-sample t-test assuming unequal variance.
Funding Characteristics by Years in Practice.
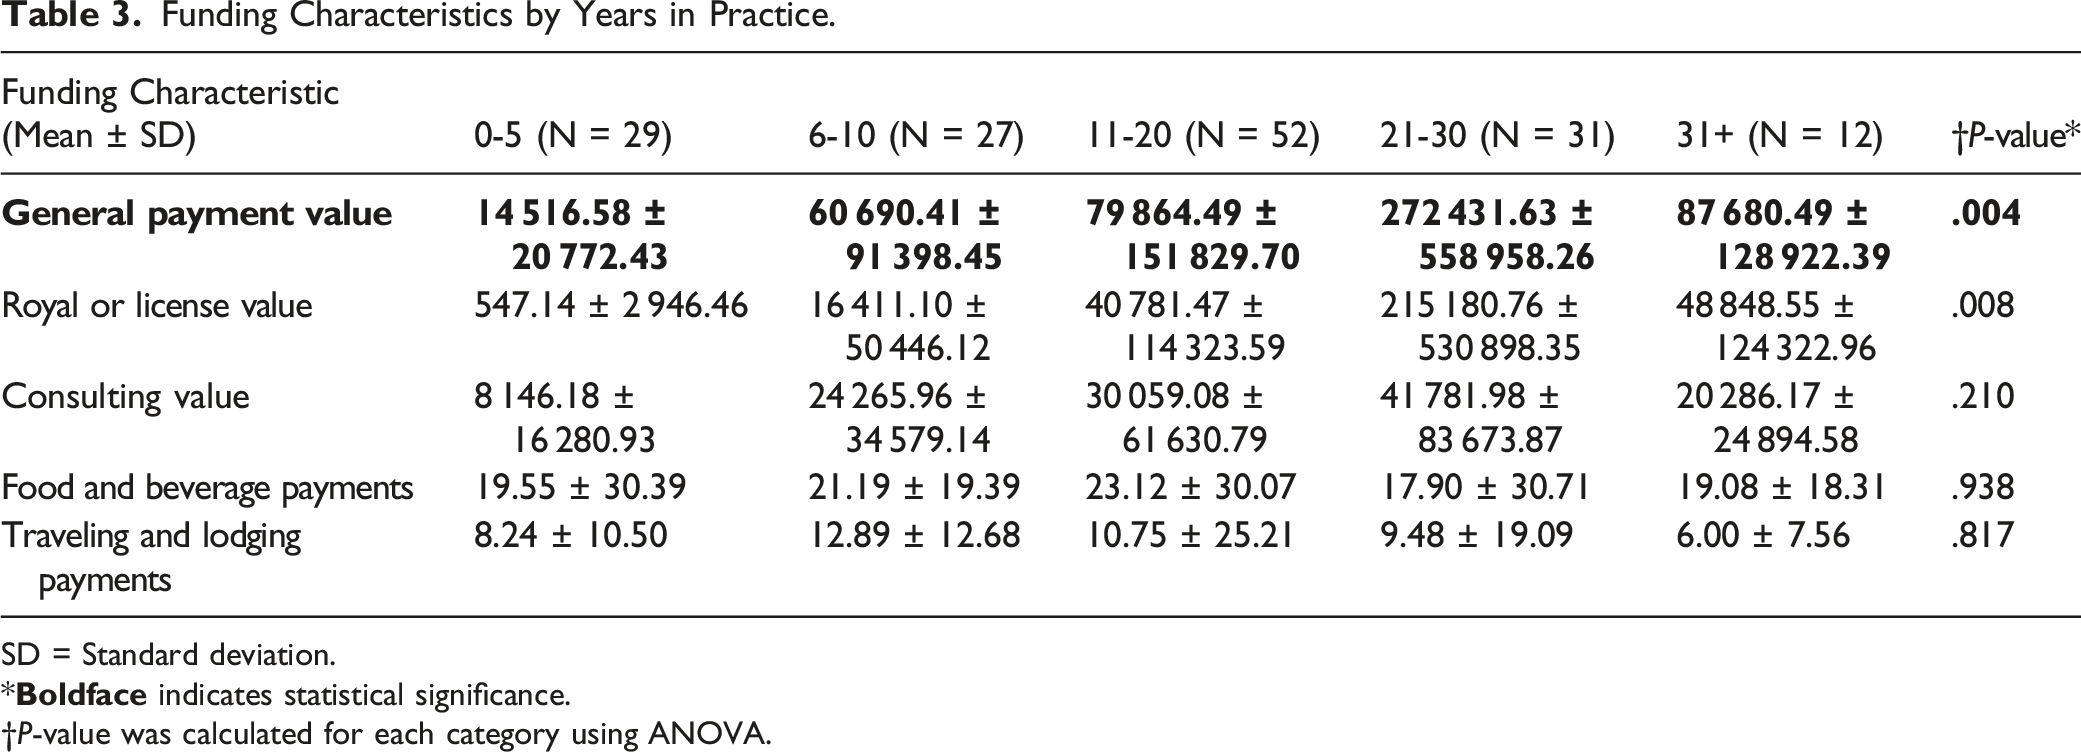
SD = Standard deviation.
*
†P-value was calculated for each category using ANOVA.
Funding Characteristics by Practice Setting.
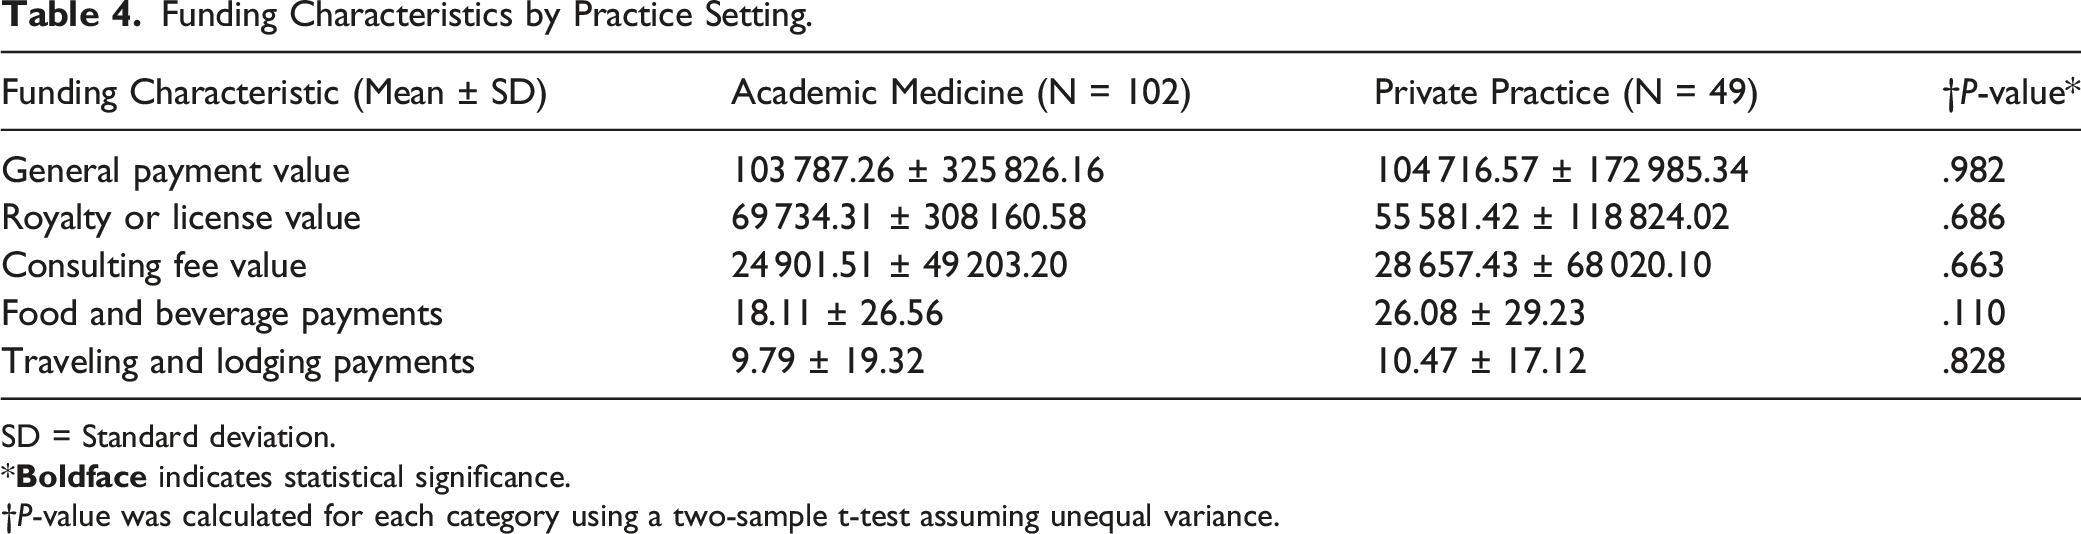
SD = Standard deviation.
*
†P-value was calculated for each category using a two-sample t-test assuming unequal variance.
Funding Characteristics by State.
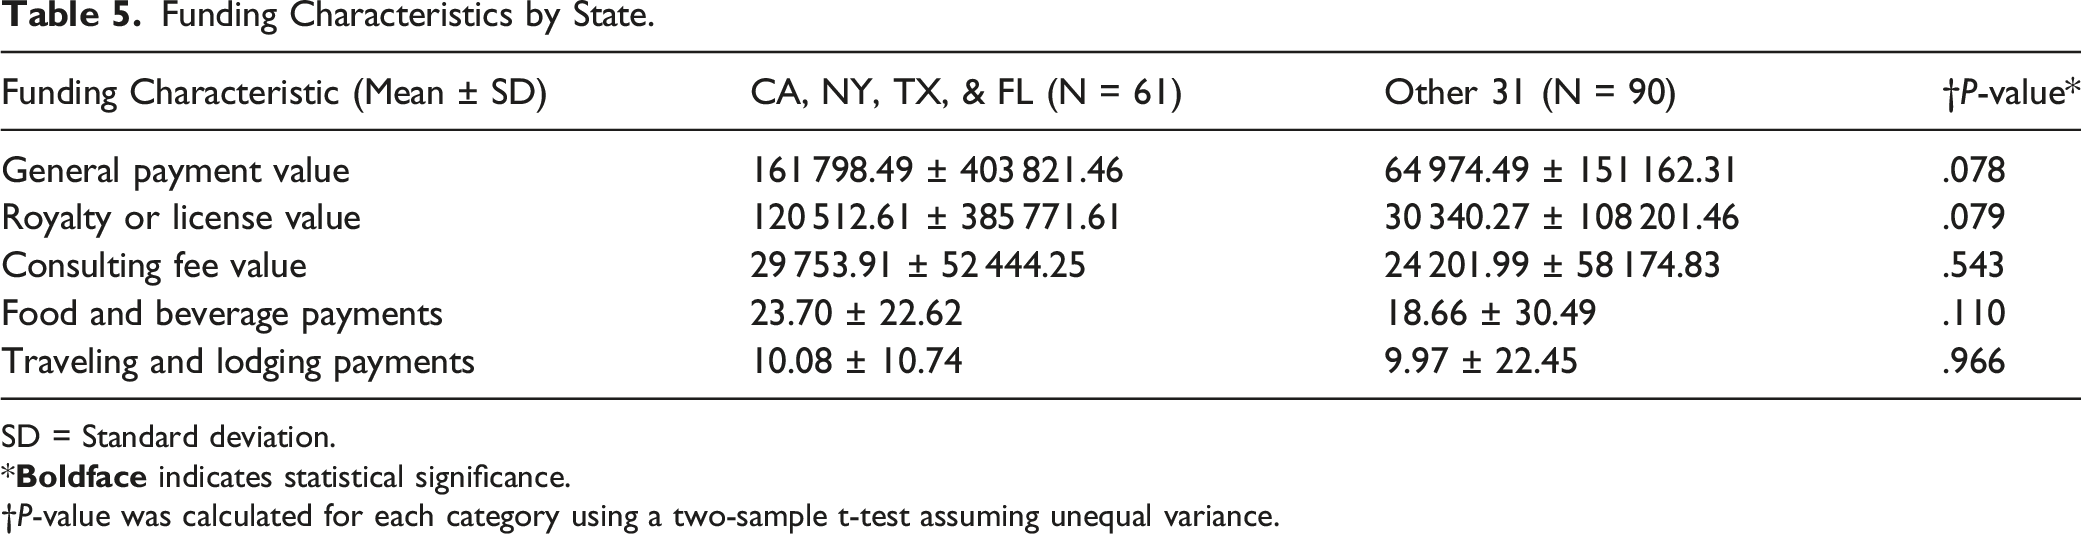
SD = Standard deviation.
*
†P-value was calculated for each category using a two-sample t-test assuming unequal variance.
General Payments Breakdown.
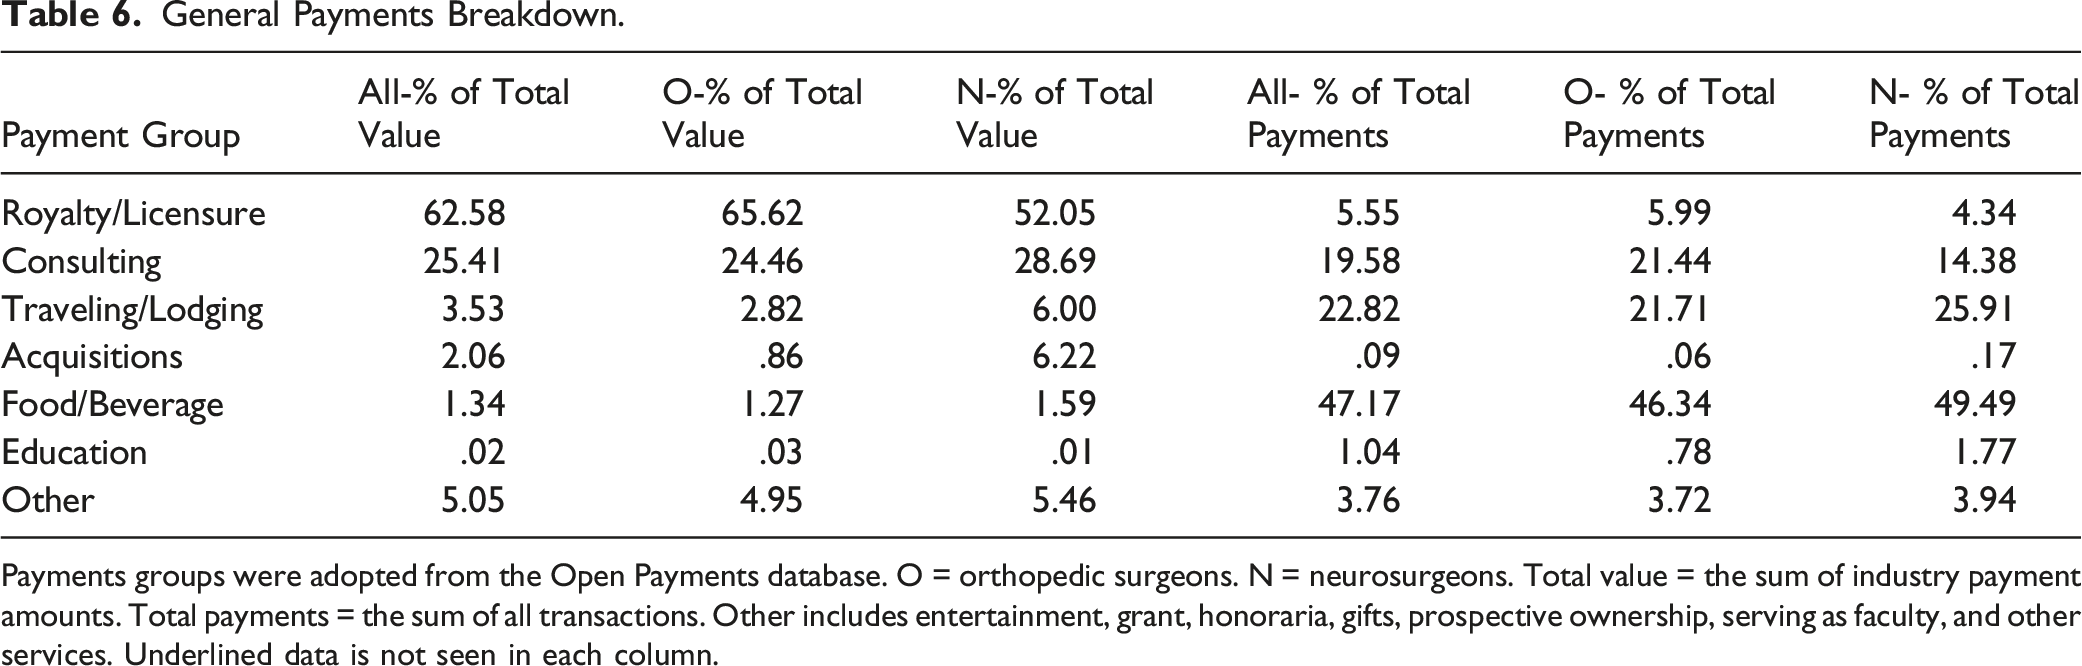
Payments groups were adopted from the Open Payments database. O = orthopedic surgeons. N = neurosurgeons. Total value = the sum of industry payment amounts. Total payments = the sum of all transactions. Other includes entertainment, grant, honoraria, gifts, prospective ownership, serving as faculty, and other services. Underlined data is not seen in each column.
Discussion
Spine surgery national conferences are a time when presented techniques and clinical findings create an opportunity to shape medical practice and patient care throughout the country. Financial relationships between physicians and medical manufacturers may favor pro-industry findings and conclusions in research, which are in turn portrayed through a physician’s presentations.2,20 Accordingly, annual data publication on the Open Payments database provides an opportunity to analyze financial relationships between medical manufacturers and NASS conference participants. Using the 2021 Open Payments database, we were able extract funding data, with a focus on general payments, on 151 2022 NASS-participating surgeons.
Our results revealed that a large portion of the financial exchange between industry and physicians is concentrated to a small fraction of all participants. The top 10% of orthopedic surgeons in terms of funding accounted for 58.7% of total orthopedic general value, while the same neurosurgical cohort accounted for 70.1%. These surgeons receive significant funding from medical device companies that drive the average per-physician ($104 089) substantially higher than the median ($14 760). These disparities are not limited to the 2022 NASS conference, as previous studies using Open Payments have found top-funded surgeons to make up the bulk of value exchanged. Samuel A.M. et al, found the top 10% of funded orthopedic surgeons in an analysis of Open Payments were determined to receive 95% of the total payments made to the field. 11 Similarly, Pathak et al determined the top 10% of surgeons accounted for 89% of the total general payment compensation. 16 Accordingly, it is important to consider both the potential conflicts of interest presenters have and the amount of funding they receive from these physician-industry relationships. Most conference participants receive well below the average determined and do not have strong financial ties to industry. However, the top 10% of participants receive significant funding that may influence the promotion of certain techniques or advancements that require the product of companies with whom they have financial ties. Royalties and licensure comprised the majority of the funding exchanged in this study, and these payments provide a way for industry to reimburse surgeons for their input in product innovation. 21 As these payments usually correlate with sales revenue, the top 10% of surgeons have a financial incentive to promote the use of company products 22 . Recognizing these participants may help attendees better understand the potential biases present.
In our study, royalties or licensure accounted for 62.6% of our general monetary value exchanged between industry and the spine surgeons. Previous literature has also reported that most of the general value exchanged between industry and surgeons is for royalties. Only 1.7% of the 12 320 orthopedic surgeons in a study by Cvetanovich et al received royalty or licensure payments, but the percentage accounted for 69.5% of the total value exchanged. 23 Again, as the royalties or licensure subgroup comprises intellectual property, these payments may benefit patients by innovating medical products and technology. 21 However, as royalties were as large as USD 2 875 454 in our data, it again illustrates the importance of understanding not only the conflicts of interest present but also the value associated with them. Surgeons with royalty funding may present findings that promote the use of his or her product.
Furthermore, our study did not find any difference between orthopedic spine surgeons and neurological spine surgeons in their general payment values. This result differs from Weiner, J.A., et al. where the value exchanged was determined to be significantly higher for orthopedic-trained spine surgeons than their neurosurgery counterparts using Open Payments ($51 661.53 vs $26 556.87, P < .001). 10 Additionally, our study found no significant difference in payments between academic and private practice physicians. Weiner, J.A., et al. found surgeons in the academic setting receive significantly more in industry payments compared to those surgeons in private practice ($109 359.75 vs $29 948.45, P < .001). 10 With only 151 surgeons in this study, its small sample size may not be adequately powered to determine a difference between groups. 24 Additionally, the lack of difference between specialty and practice setting cohorts may relate to the fact this study examined those participating in a national conference. Most participants have conducted research and likely attended conferences in the past, providing a greater avenue for them to interact with industry, regardless of specialty. Matsen et al supports this claim by showing a significant correlation between number of physician disclosures and presentations at a national conference, along with greater than 75% of all presentations having physicians with industry disclosures. 17 The lack of difference between orthopedic and neurological spine surgeons, along with their practice setting, illustrates the importance of considering funding for those participating in conferences as it may differ from funding in the larger surgeon population.
Our results showed significant differences between years of experience and positive outcome payments with 21 to 30 years of experience having the greatest general amount per-surgeon. Inoue, K. et al Found physicians with 21-30 years in practice to have the highest average annual payment value from industry ($5 160, P < .001). 25 Motiwala et al also found surgeons 10 to 20 years into their career to significantly higher median general payment amounts per surgeon. 26 This positive correlation between years of experience and payment value is likely related to stronger relationships with industry. Surgeons further along in their career are sought by industry for their expertise that’s gathered over many years in practice. 27 Understanding the relationship between years of experience and funding can help attendees better interpret the conflicts of interest that are present.
Approximately 40% of conference participants were determined to hail from 4 states (California, New York, Texas, and Florida) out of the thirty-five represented. As these states comprise 4 of the most populated states in the most recent census, it is understandable they had the greatest represenation at the 2022 NASS conference. 28 It’s probable that surgeons from populated states with larger research centers form more industry connections through meetings, research, and events, which could ultimately impact funding. 29 Choosing to look at individual states for general payments, our results did not produce a significant finding between the 4 most represented and the other thirty-one states. In Weiner, J.A., et al, census regions of the United States were compared for orthopedic surgeons. 10 Though these similar studies have looked into regional associations, we believe our state breakdown provides further insight into the geographic distribution of presenting surgeons at conferences. A large portion of presenters came from 4 states; it is possible regional differences can impact outcomes reported by these presenters.
Our study is not without limitations. First, our study only contains 151 spine surgeons from a single conference. This small sample size limits the scope to which our results can be applied to other conferences. Future studies could be performed using multiple national spine conference to increase sample size. Second, our data source was adapted from a program of the conference. It is possible surgeons could be missing due to misspelling of names or human error. Lastly, demographic information was extracted from public physician profiles, and misreporting on these sites is possible. Despite these limitations, this is the first study to date that examines funding differences specifically for those participating at spine conferences.
Conclusion
The medical device industry and spine surgeons have longstanding relations that are evident in numerous studies using the Open Payments database. Therefore, it is no surprise spine surgeons participating in the 2022 North American Spine Society conference also take part in financial relationships with industry. Out of specialty, years of experience, practice setting, and practice location cohorts, only years of experience was found to be significantly associated with greater funding. In general payment breakdown, the royalties or license subgroup comprised the greatest proportion of the total value exchanged. Lastly, the top 10% of funded participants received most of the total funding. This funding provides an opportunity for significant conflicts of interest and biases. Though conferences have implemented disclosure policies to account for the conflicts of interests created by industry payments to physicians, we recommend future conferences incorporate a way to categorize the different levels of funding. This difference could help conference attendees better consider the presented techniques and findings for implementation into their own practices and provide the best care for patients.
Footnotes
Declaration of conflicting interests
The author(s) declared no potential conflicts of interest with respect to the research, authorship, and/or publication of this article.
Funding
The author(s) received no financial support for the research, authorship, and/or publication of this article.