
Abstract
Study Design:
Controlled laboratory study.
Objective:
To measure the total bone mineral density (BMD), cortical volume, and cortical thickness in seven different anatomical regions of the lumbar spine.
Methods:
Using computed tomography (CT) images, 3 cadaveric spines were digitally isolated by applying filters for cortical and cancellous bone. Each spine model was separated into 5 lumbar vertebrae, followed by segmentation of each vertebra into 7 anatomical regions of interest using 3-dimensional software modeling. The average Hounsfield units (HU) was determined for each region and converted to BMD with calibration phantoms of known BMD. These BMD measurements were further analyzed by the total volume, cortical volume, and cancellous volume. The cortical thickness was also measured. A similar analysis was performed by vertebral segment. St Mary’s Medical Center’s Institutional Review Board approved this study. No external funding was received for this work.
Results:
The lamina and inferior articular process contained the highest total BMD, thickest cortical shell, and largest percent volumes of cortical bone. The vertebral body demonstrated the lowest BMD. The BMDs of the L4 and L5 segments were lower; however, there were no statistically significant differences in BMD between the L1-L5 vertebral segments.
Conclusion:
Extrapedicular regions of the lumbar vertebrae, including the lamina and inferior articular process, contain denser bone than the pedicles. Since screw pullout strength relies greatly on bone density, the lamina and inferior articular processes may offer stronger fixation of the lumbar spine.
Keywords
Introduction
Pedicle screw fixation is currently the preferred method of posterior thoracolumbar fixation for a variety of pathologies, ranging from spine degeneration, deformity, instability, neoplasms, infections and trauma. 1 Pedicle screw loosening is a known complication of posterior spinal fusion and can lead to suboptimal outcomes, including the need for reoperation. 2 Related fixation failures may include screw bending and breakage. 3 While many factors contribute to screw loosening such as stress shielding 4 and toggling, 3,5 low bone mineral density (BMD) is a major risk factor for spine construct failure. 5 -8 Although most studies report low rates of pedicle screw loosening in nonosteoporotic patients, 2,9 -11 this complication may occur in up to 10% to 25% of osteoporotic patients undergoing traditional pedicle screw fixation. 12,13
Although pedicle screw fixation is most commonly used, other regions of the lumbar vertebrae possess greater bone density and may be better zones for posterior spinal instrumentation. 14 However, few studies have been published on the bone quality of anatomical regions within the lumbar spine. In a study comparing traditional pedicle and cortical screws, Mai et al 16 found that the BMD along the cortical screw trajectory was significantly higher in both nonosteoporotic and osteoporotic patients. The difference in bone density between the 2 trajectories was even greater for patients with osteoporosis than for those without osteoporosis. In a similar study comparing 7 predefined regions of the lumbar spine in nonosteoporotic cadaveric specimen, Hohn et al 14 reported that the lamina and inferior articular processes have significantly higher BMD than the pedicles and other vertebral regions.
While Hohn et al 14 found the posterior elements to exhibit high total BMD, they do not report other indicators of bone quality such as cortical volume, cortical thickness, and cortical-cancellous bone ratios. BMD may only explain 60% to 70% of the variability in bone strength, while the remaining bone strength is determined by other factors such as the bone geometry, cortical thickness and porosity, and trabecular bone morphology. 15 In addition, Hohn et al 14 were unable to detect any differences between the extrapedicular regions requiring a more granular comparison. Since cancellous bone is more affected by osteoporosis, 17 anatomical regions of the lumbar spine with a high cortical-cancellous bone ratio may represent ideal sites for extrapedicular fixation in osteoporotic patients. It remains unclear whether this ratio differs among the posterior elements. In addition, previous studies suggest that regional alterations to trabecular architecture influence the biomechanics of the vertebral body with little effect on overall bone density. 18,19 Therefore, it is possible that variations in cortical BMD, cancellous BMD, and cortical-cancellous bone ratio also exist among the posterior elements despite their similarity in average total BMD. Furthermore, previous research suggests that loads applied to the lumbar spine differ according to vertebral segment. 20 Yet few studies have investigated vertebral segment-specific differences in BMD within the lumbar spine. 21,22
The goal of this study was to measure and compare the bone quality of 7 different anatomical regions (and potential fixation sites) in each of the 5 vertebrae of the lumbar spine. We investigated the bone quality of these regions by assessing the average total bone BMD, cortical BMD, cancellous BMD, cortical-to-cancellous bone ratio, cortical volume, and cortical thickness using computed tomography (CT) imaging and 3-dimensional software modeling. Our second aim was to compare the total BMD, cortical BMD, and cancellous BMD by vertebral segment (L1-L5). A greater understanding of bone quality may be useful when developing new fixation strategies to reduce the risk of screw loosening, pullout, and construct failure.
Methods
Study Specimens and CT Imaging
Three cadaveric spinal columns were imaged and analyzed for the present study (2 males, 1 female, age 35, 70, and 90 years). All 5 lumbar vertebrae were analyzed from each for a total of 15 vertebrae. High-resolution helical CT scans were conducted on all specimens. All scans were performed on the same scanner (GE Lightspeed VCT) with the same imaging parameters (64-slice, 512 × 512 pixel resolution) to reduce interspecimen variability.
CT Image Segmentation
CT scans were postprocessed using commercial medical image processing software (Mimics; Materialise, Leuven, Belgium). The lumbar spine (L1-L5) was digitally isolated from surrounding tissue by applying a preset thresholding filter for adult bone to the CT scans. Using this thresholding as well as manual segmentation, the lumbar spine model was separated into 5 separate vertebrae, followed by segmentation of each vertebra into 7 predefined anatomic regions (Figure 1). When visible, suture lines were utilized as anatomic boundaries between vertebral regions. The right and left superior articular processes, inferior articular processes, laminae, pedicles, and transverse processes were also isolated using the Mimics software (Figure 2A). This resulted in 30 individual bone measurements for each of these anatomical regions (3 specimens × 5 vertebrae per specimen × 2 regions per vertebra) and 15 individual bone measurements for the spinous process and vertebral body (3 specimens × 5 vertebrae per specimen × 1 region per vertebra).
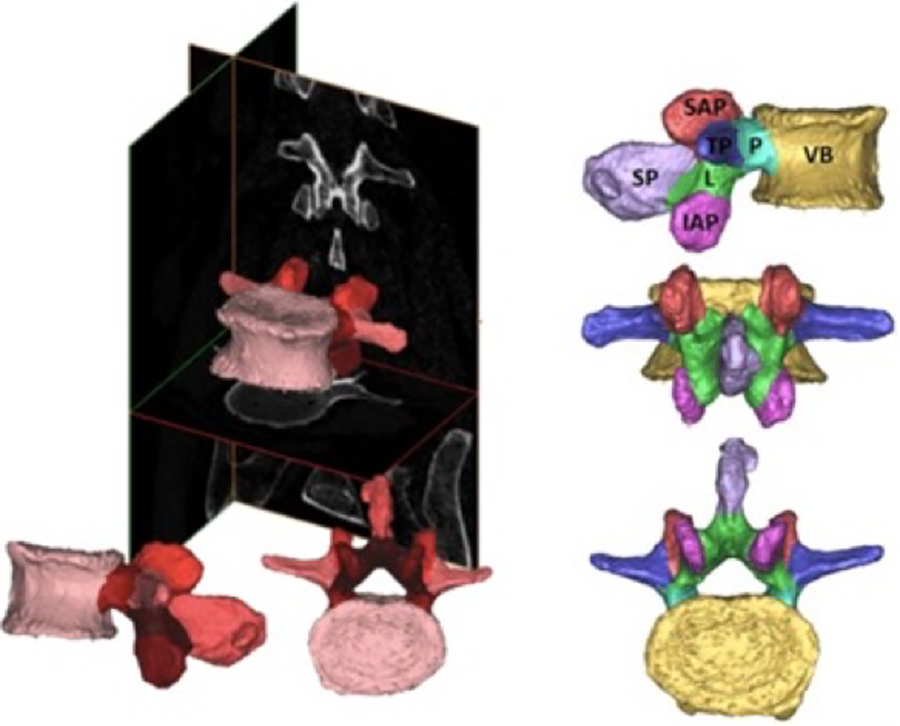
Images depicting the data collection process, including the conversion of computed tomography (CT) scans to engineering solid models. The 2-dimensional images (left) are segmented from a series of CT images to define volumes. Each vertebra was divided into 7 regions (right) followed by further segmentation of cancellous and cortical bone within each anatomic volume. SAP, superior articular process; IAP, inferior articular process; L, lamina; P, pedicle; SP, spinous process; TP, transverse process; VB, vertebral body.
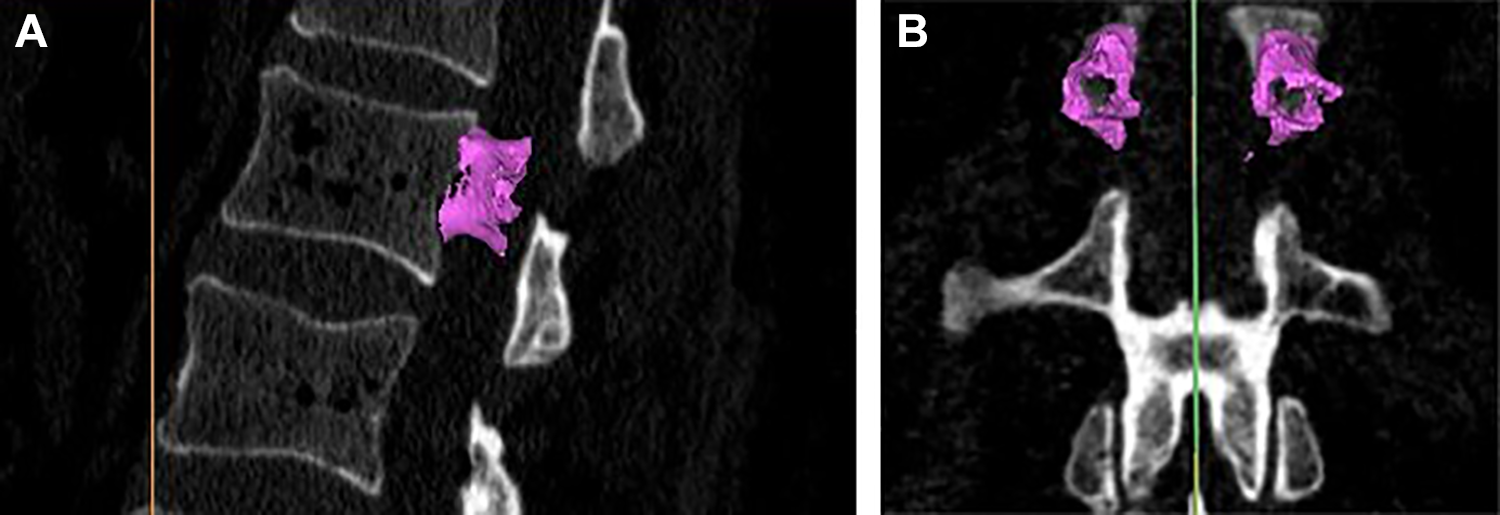
(A) Three-dimensional rendering of cortical bone within the pedicles of the L1 vertebra using (A) sagittal magnetic resonance images (MRI). Cortical and cancellous bone was separated by a filter algorithm provided by the segmentation software. (B) Three-dimensional rendering of cortical bone within the pedicles of the L1 vertebra using (B) coronal MRI. The methods used to determine cortical and cancellous bone mineral density (BMD) have been previously described in detail. 26,28
The same team member segmented each vertebral region to reduce interobserver variability. This team member segmented the L1-L5 transverse processes, pedicles, inferior articular processes, and superior articular processes twice from 2 of the study specimens to assess the inherent variability in the manual segmentation protocol. A previous study using this method of segmentation produced an average difference in BMD of 1.5% between the first and second measurements of the same anatomical region (SD ±0.7%). 14 The largest percent discrepancy between the repeated measures was 3.0%.
Bone Density, Volume, and Thickness Measurements
Cortical and cancellous bone was separated by a filter algorithm provided by the segmentation software. The filter for cancellous bone included pixels with Hounsfield units (HU) between 200 and 450 HU. For cortical bone, the filter included pixels between 450 and 1400 HU. Average total, cortical, and cancellous BMD measurements of each anatomical region and from each vertebral segment (L1-L5) were recorded. A cortical-cancellous ratio was calculated as the mean cortical BMD divided by the mean cancellous BMD. The cortical bone, cancellous bone, and non-bone volumes were also assessed (Figure 2B). The nonbone volume reflects the porosity of the anatomical regions. The cortical wall thickness was measured using an algorithm provided by the segmentation software. 23
Conversion From HU to BMD
Conversion from HU to BMD units (mg/cm3) was performed in accordance with previously described guidelines. 24 -27,29 In brief, HUs were converted to BMD through a calibration equation derived from CT scans of tissue surrogate materials (Electron Density Phantom, Model 62; CIRS) using the same scanning protocol that was used for all specimens. Specifically, “phantoms” of 200 and 800 mg/cm3 were utilized to account for the known range of BMD in various anatomic locations. 24 These “phantom” blocks have been previously reported to produce reliable calibration formulas between HU and BMD and are not influenced by CT mode, slice thickness, reconstruction algorithm, or pitch factor. 24,29 The results of a previous HU to BMD analysis produced a linear calibration relationship of 1 mg/mL for every 0.78 HU. 14 Validation studies using this protocol report that the bone mineral content of vertebrae can be measured with an accuracy of 6% compared with ash weight gold standard. 26 Similar work by Cann and Genent 27 found no significant differences between direct measurement of calcium ash and CT measurements of BMD in the thoracic vertebrae.
Outcome Measures and Statistical Analysis
The primary outcome measures from densitometry were mean total, cortical, and cancellous BMD for each vertebral segment (L1-L5) and anatomical region. One-way analysis of variance was conducted to determine any significant differences in the cortical volume and cortical thickness of the vertebral regions, with α = .05.
St Mary’s Medical Center’s Institutional Review Board approved this study. No external funding was received for this work.
Results
Densitometry by Anatomical Region
The BMDs for each anatomical region are displayed in Table 1. The mean total BMD of the lamina and inferior articular process were higher than the pedicles (P = .042 and P = .059, respectively). However, the difference in total BMD between the lamina and pedicle was greater in the 35-year-old specimen and less pronounced in the 70- and 90-year-old specimens, as demonstrated in Figure 3. The vertebral body demonstrated the lowest total BMD (P < .05 for all comparisons).
Bone Density, Volume, and Thickness Results by Anatomical Region.a
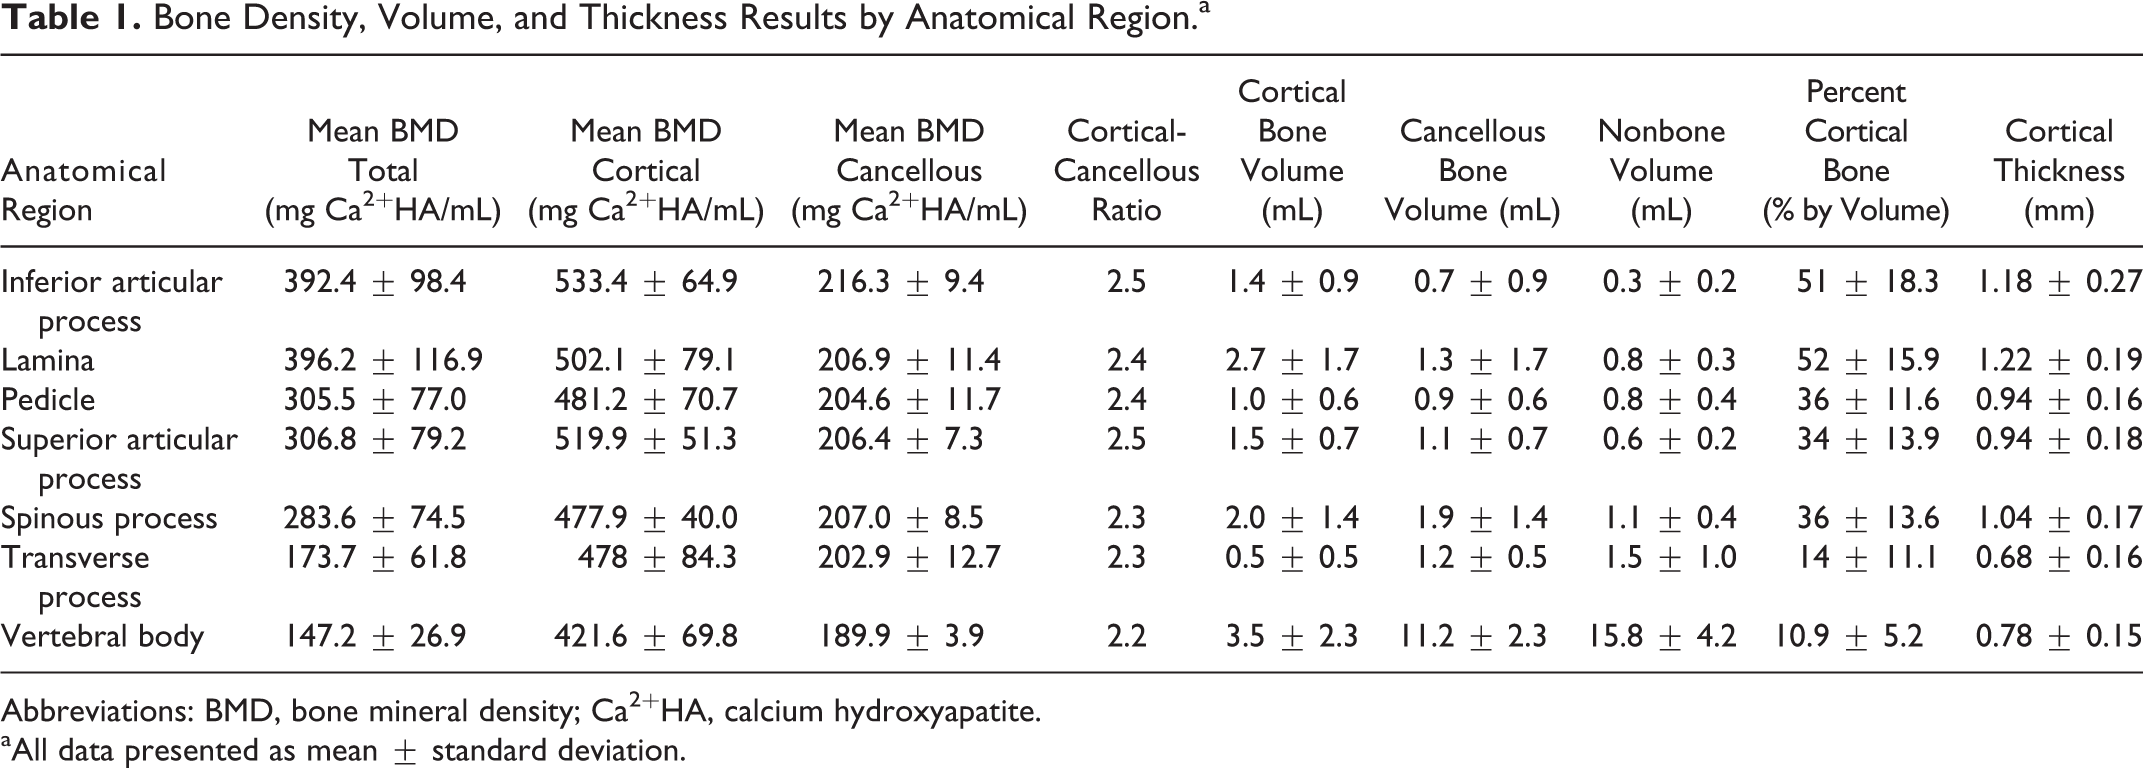
Abbreviations: BMD, bone mineral density; Ca2+HA, calcium hydroxyapatite.
aAll data presented as mean ± standard deviation.
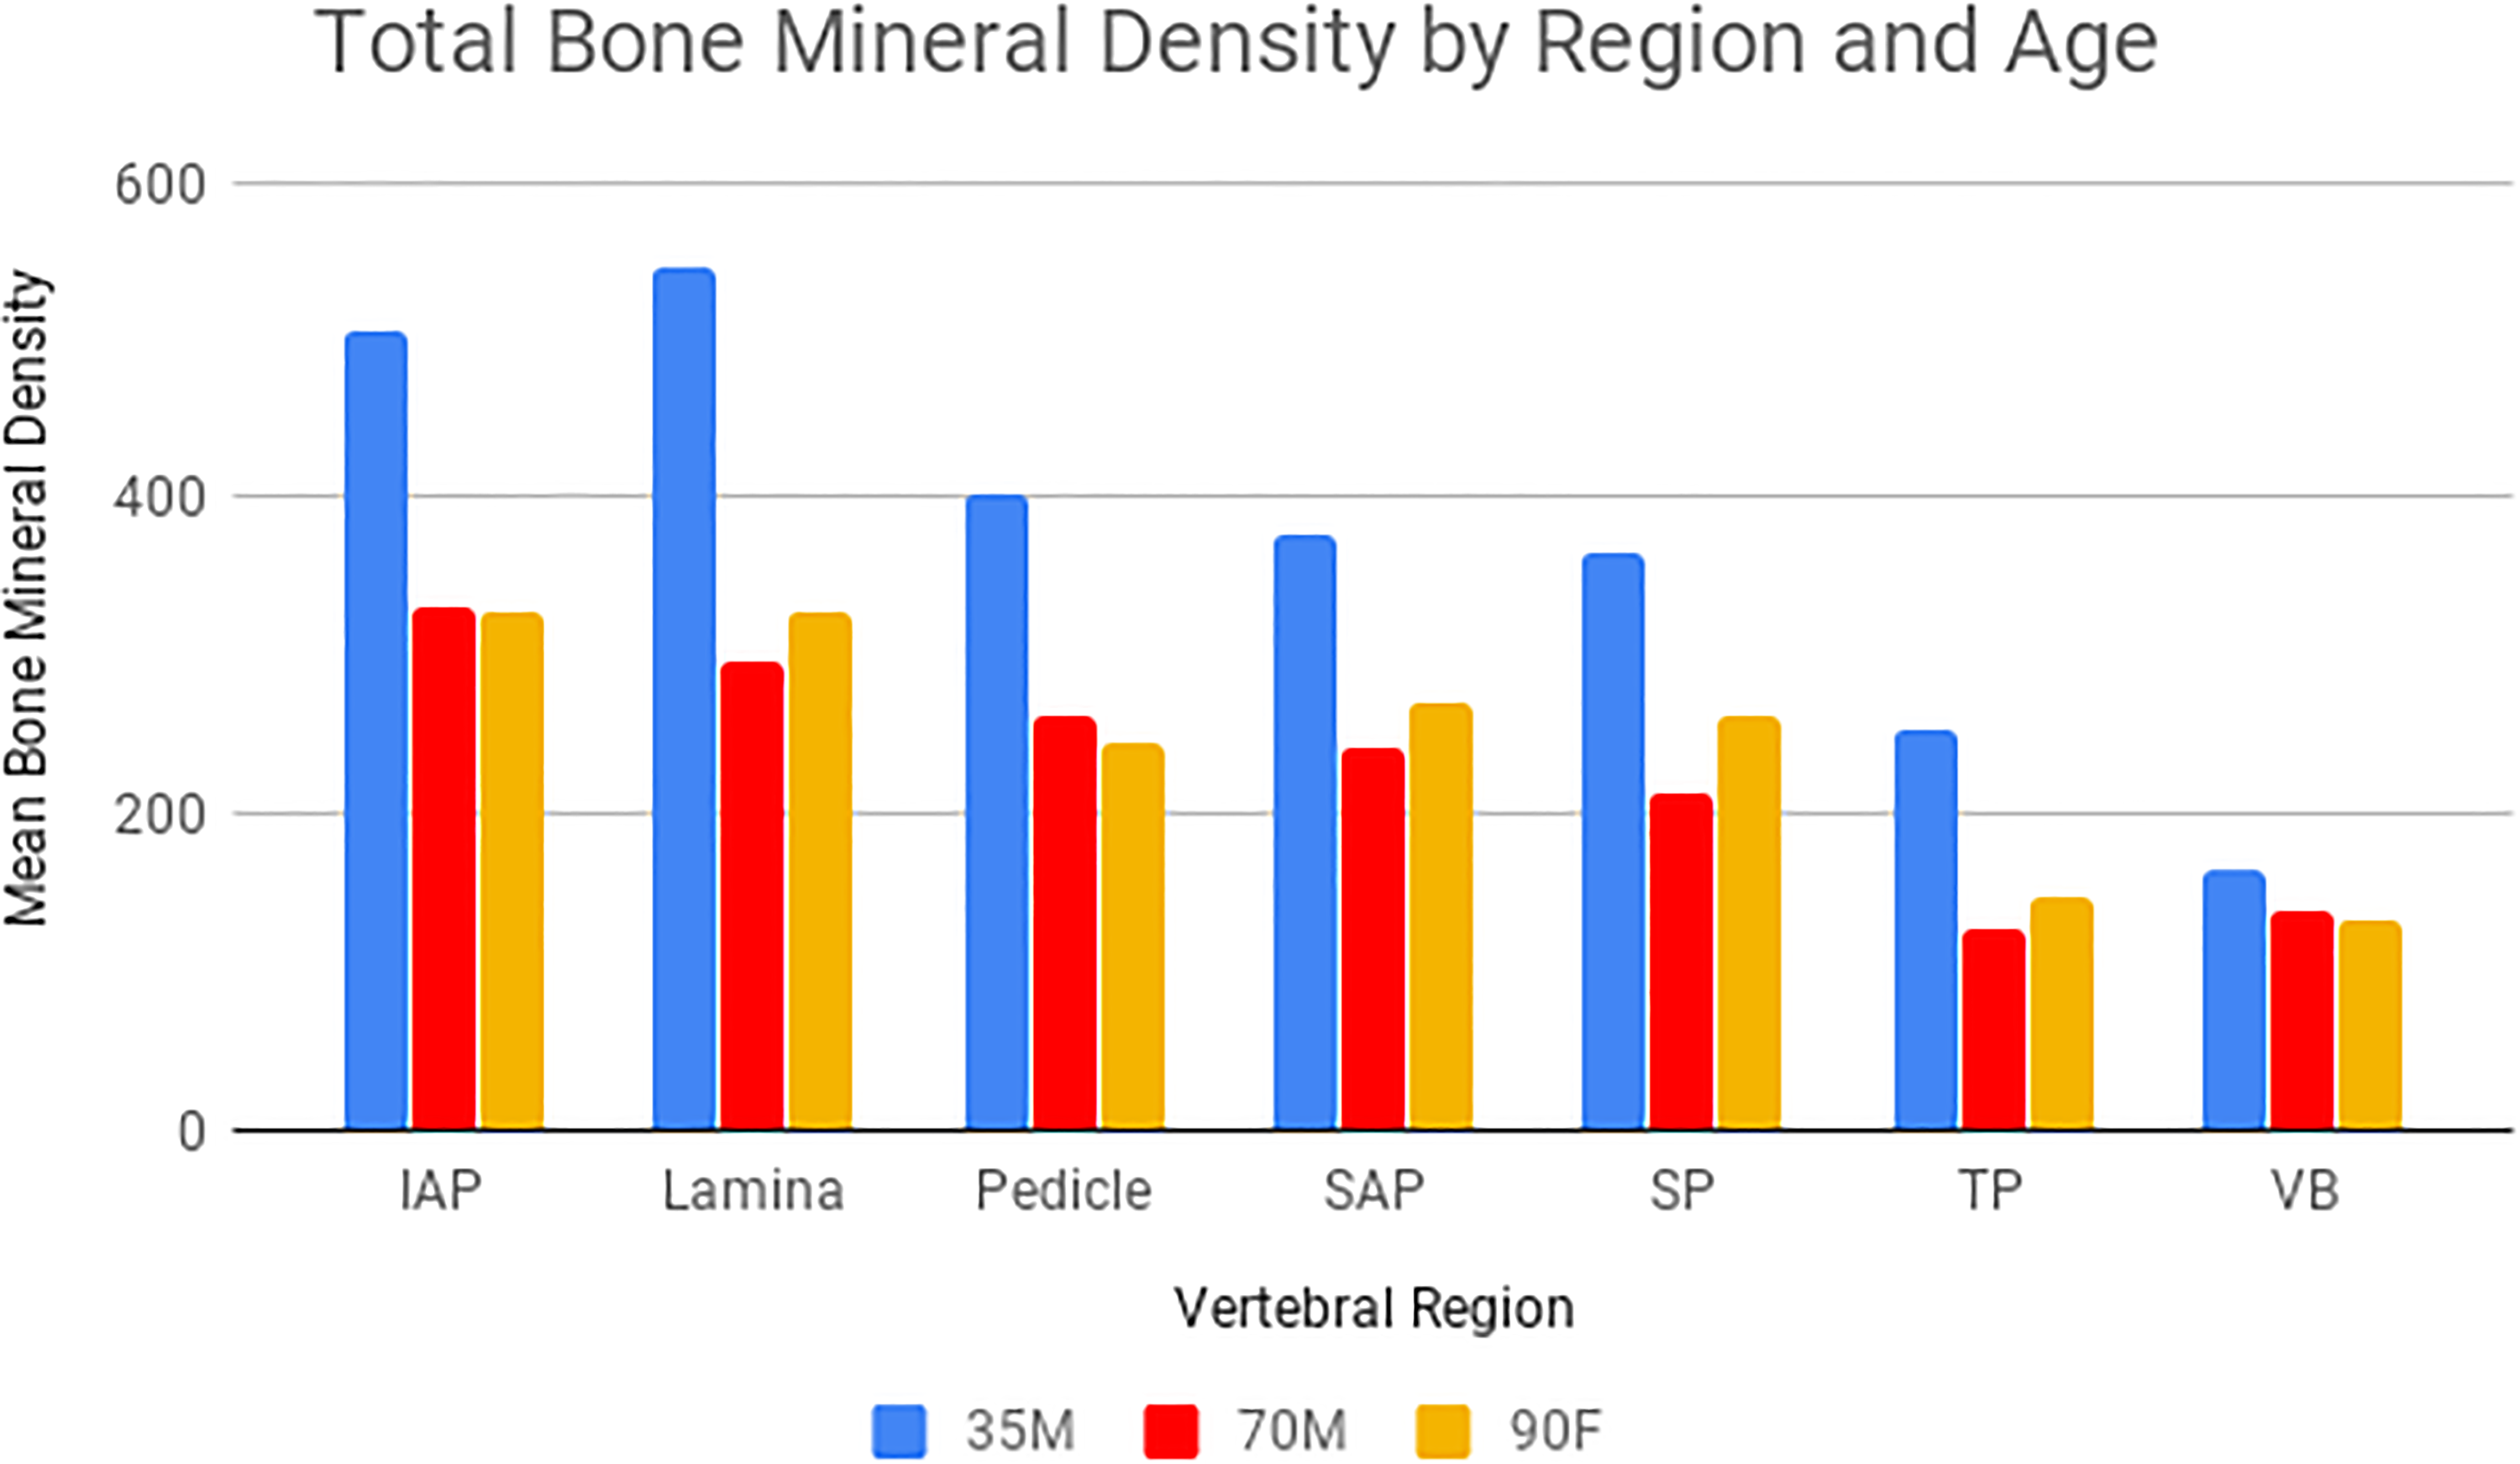
Mean bone mineral density (mg Ca2+HA [calcium hydroxyapatite]/mL) of the vertebral regions for each specimen. The specimens are labeled with “M” for male or “F” for female, followed by 2-digit age. All data presented as mean ± standard deviation.
Mean BMD of the cortical bone alone was highest in the lamina, superior articular process, and inferior articular process. The vertebral body demonstrated a significantly lower cortical bone density compared to these anatomical regions (P = .0054, P = .0002, and P = .0001, respectively). The cortical densities of the lamina and articular processes were higher than the pedicles. Specifically, the cortical density of the inferior articular process was 11% higher; however, the difference was not statistically significant (P = .057). The density of the cancellous bone in the inferior articular process was significantly higher than all other regions (P < .05 for all comparisons). However, the differences in cancellous BMD between the anatomical regions were relatively small. The highest cortical-cancellous ratios were found in the lamina and both articular processes. The only statistically significant difference between ratios was the superior articular process and the vertebral body (P = .013).
The bone densities, volumes, and thicknesses for each anatomical region are displayed in Table 1 and Figures 3 –6. The lamina and the inferior articular process exhibited the highest percentage of cortical bone by volume and both were significantly higher than the pedicles (Figure 4A, P = .033 and P = .049, respectively). The transverse process and the vertebral body exhibited the lowest volume percentage of cortical bone. This trend in percentage of cortical bone was also observed within each specimen despite their differences in age, as demonstrated in Figure 4B.
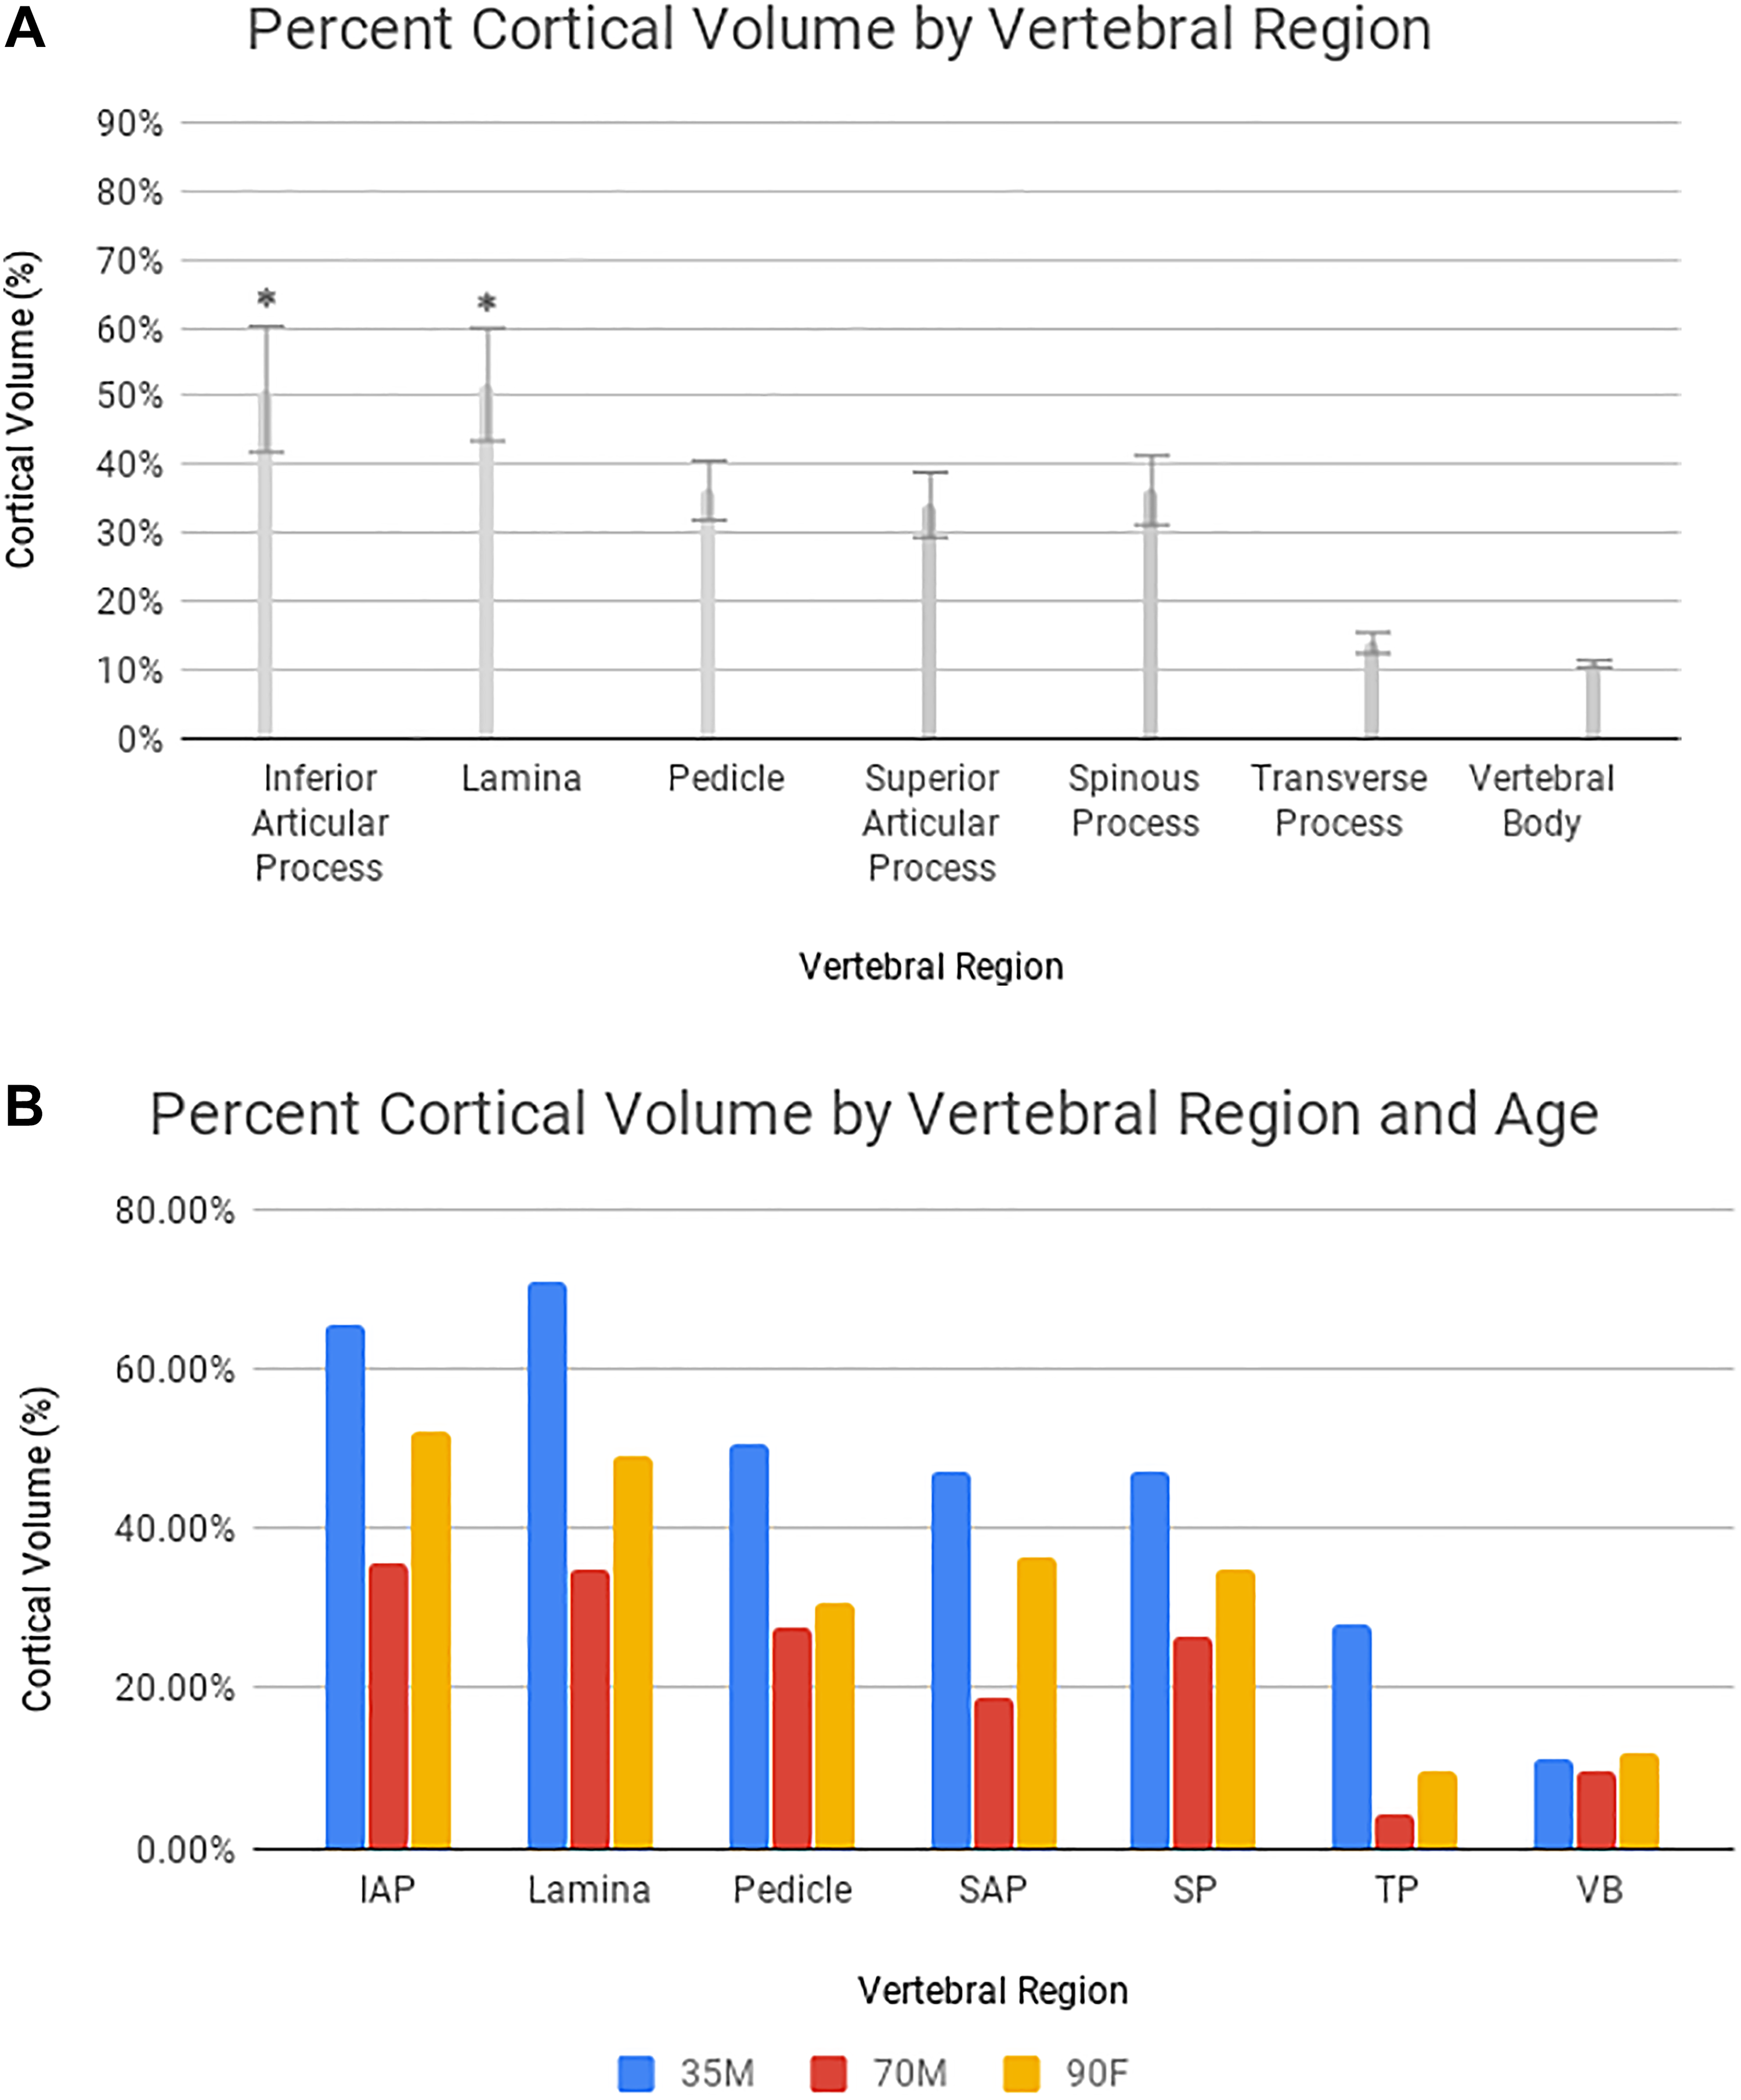
(A) Percent cortical volume for each anatomical region. Statistically different means (P < .05) as compared with the pedicle are annotated and indicated with an asterisk. (B) Percent cortical volume by anatomical region and specimen age.
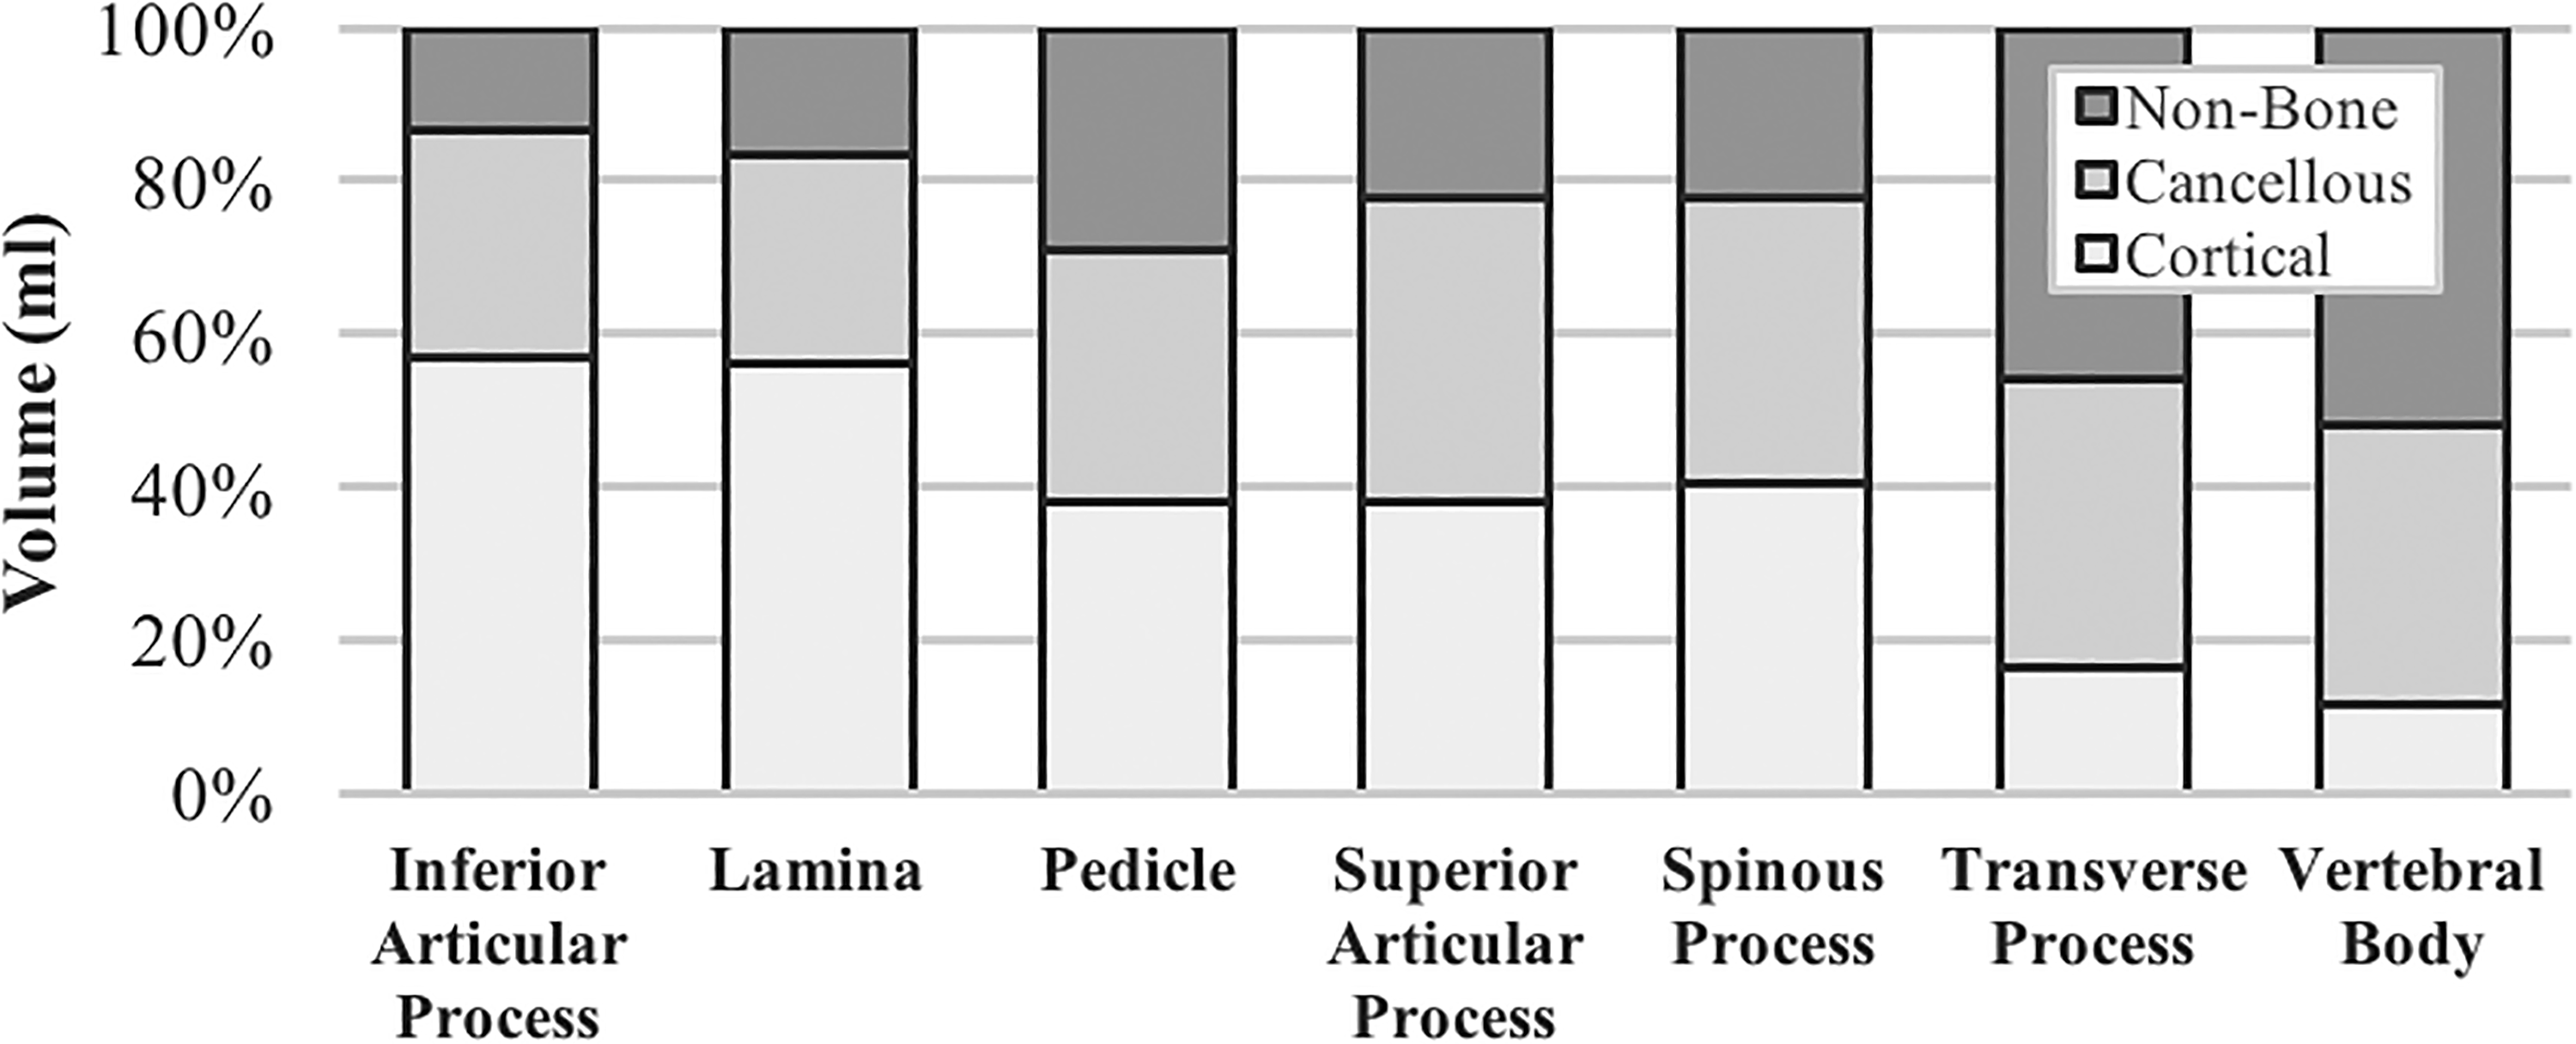
The cortical, cancellous, and nonbone (porous) volume percentages of each region.
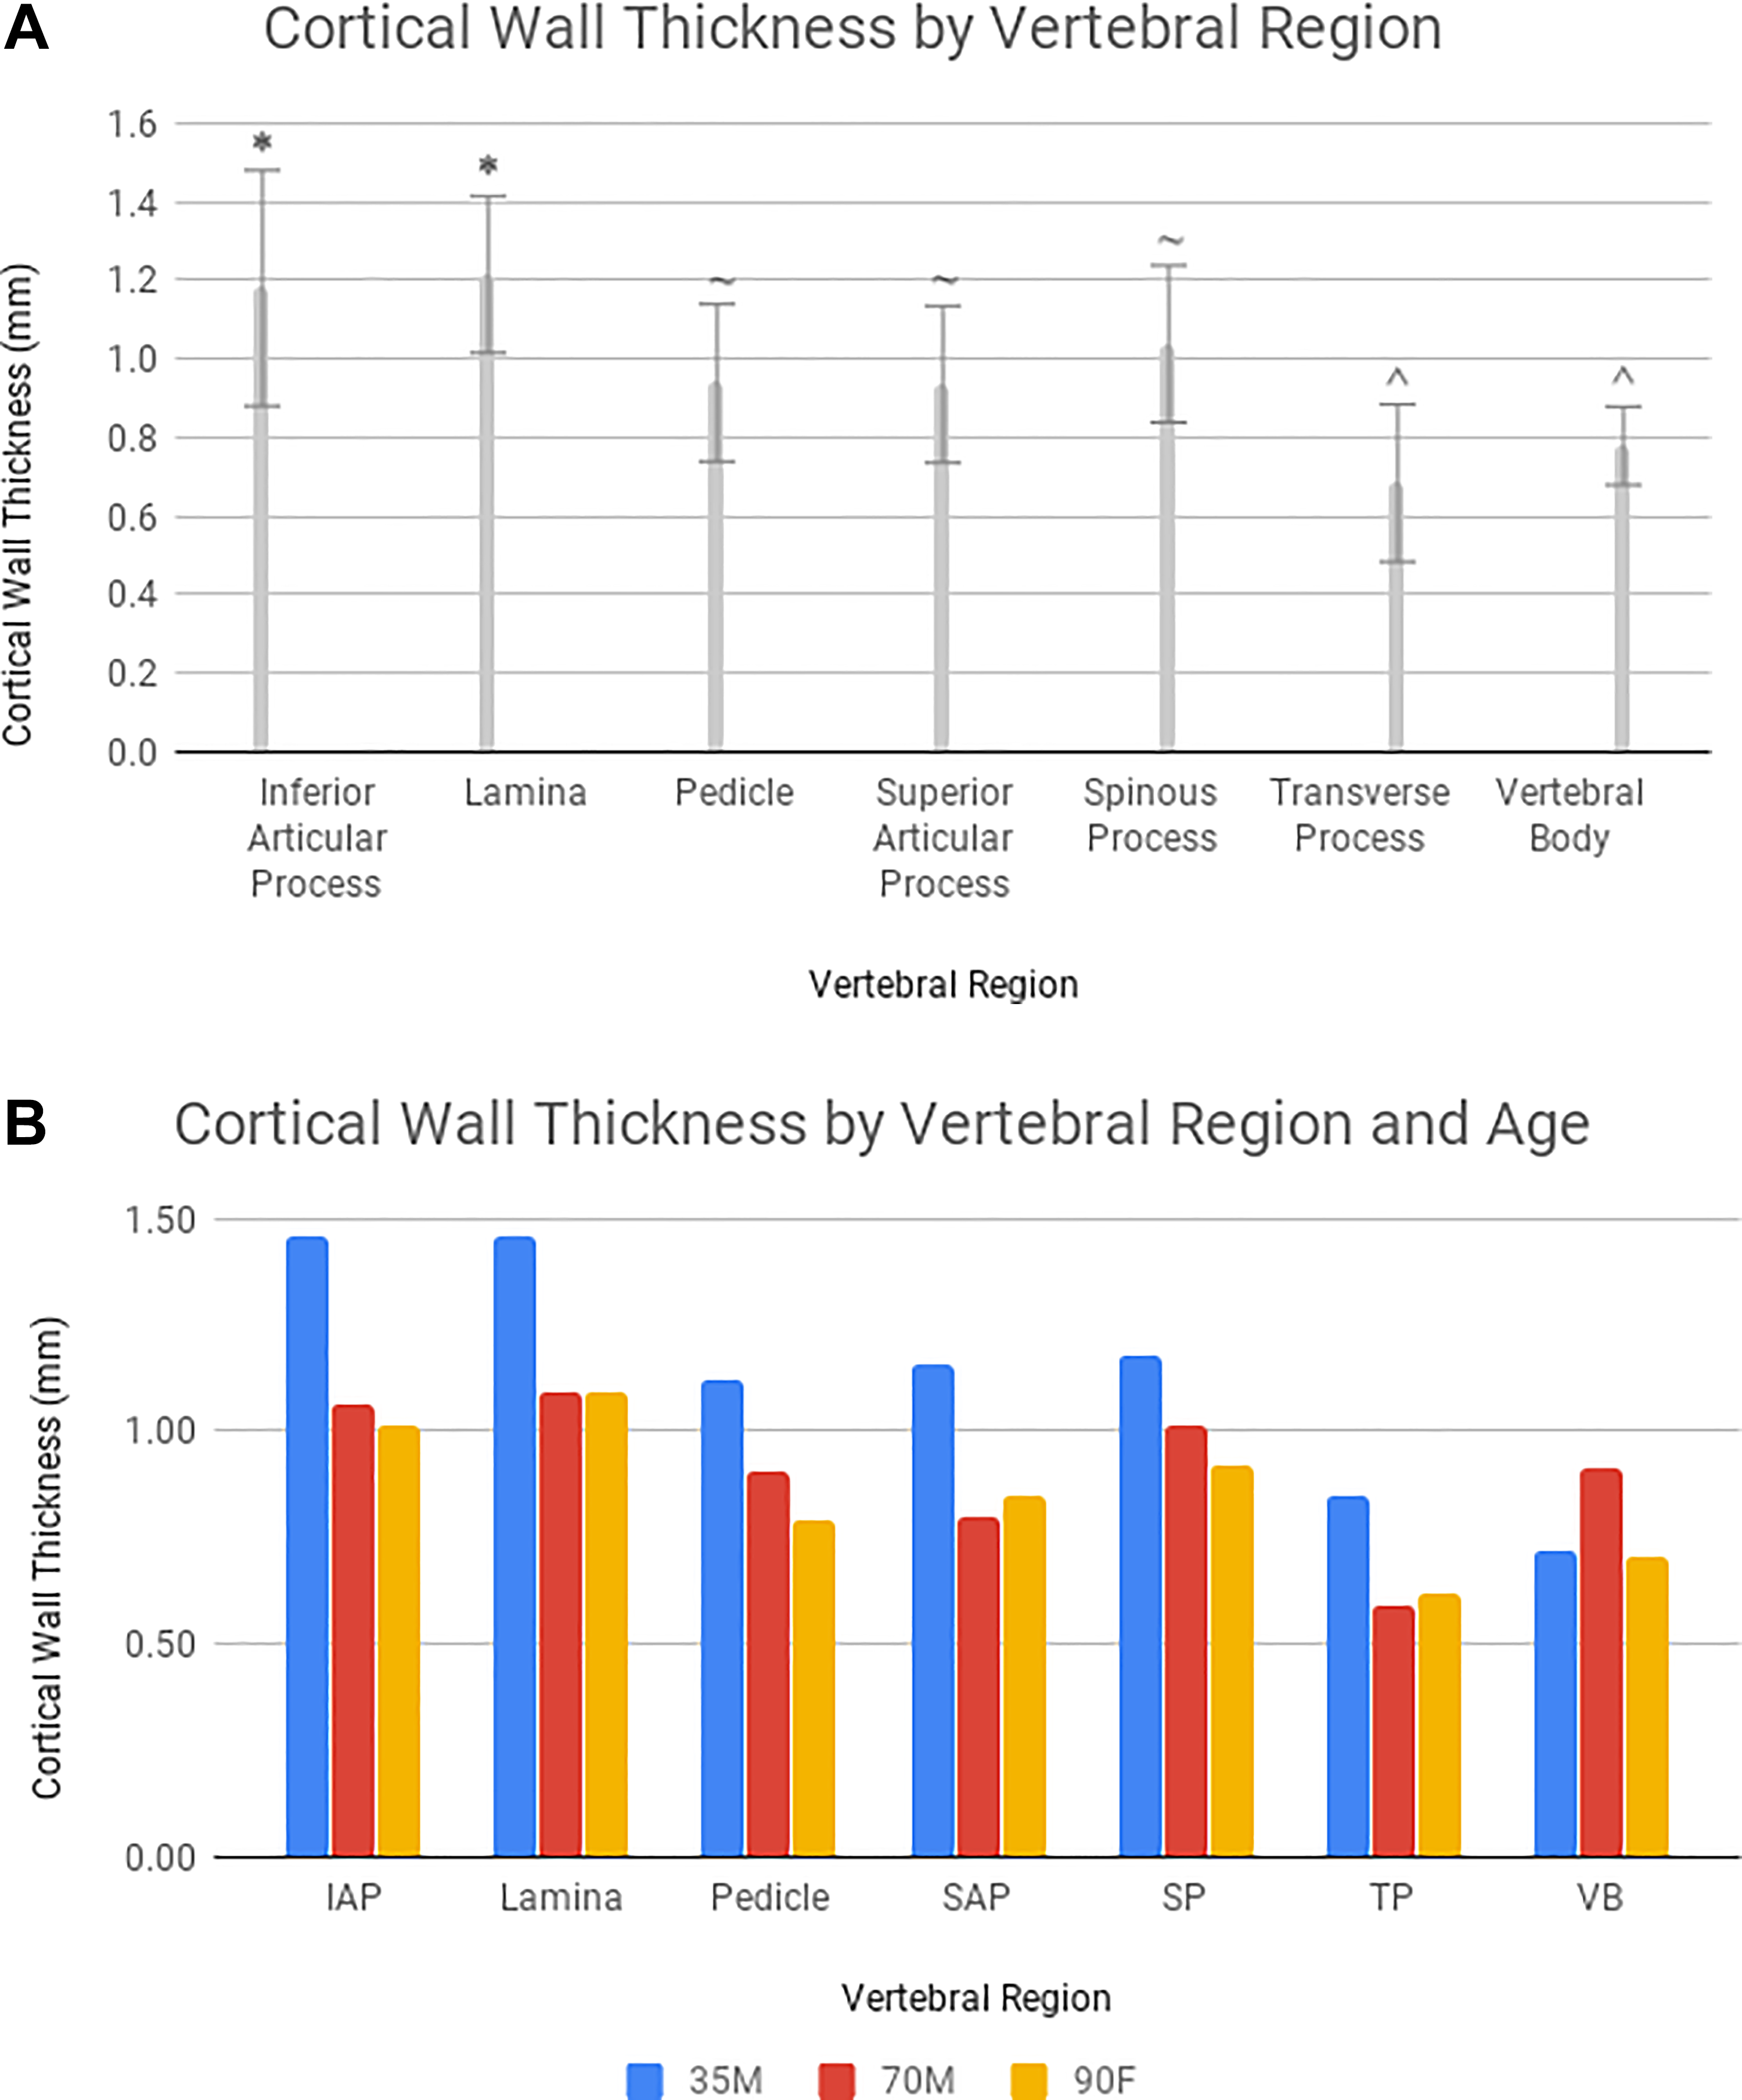
(A) Cortical volume ratio of each anatomic region calculated as a percentage of the total volume. Means not connected by the same annotation symbol (*, ^, or ∼) are significantly different from one another (P < .05). (B) Cortical wall thickness by anatomical region and specimen age.
The lamina exhibited the largest amount of cortical bone volume, apart from the vertebral body (Table 1). The difference in cortical bone volume between the lamina and the vertebral body were not statistically significant (P = .68). The vertebral body contained the highest cancellous bone volume and nonbone volume (Figure 5, P < .0001 for all comparisons). However, there were no statistically significant differences among the other regions.
The lamina and inferior articular process exhibited the highest cortical wall thickness, and both were significantly higher than the pedicles (Figure 6A, P = .002 and P = .011, respectively). However, the difference in cortical wall thickness between the lamina and pedicle was greater in the 35-year-old specimen and less pronounced in the 70- and 90-year-old specimens, as demonstrated in Figure 6B.
Densitometry by Vertebral Segment
The BMDs of each vertebral segment are displayed in Table 2. The mean BMDs of both the cortical and cancellous bone were lower at L4 and L5 compared with L1-L3. The L4 and L5 vertebrae also had lower cortical-cancellous ratios. However, there were no statistically significant differences in total BMD, cortical BMD, cancellous BMD, or cortical-cancellous ratio between the L1-L5 vertebral segments (P > .05 for all comparisons).
Bone Density, Volume, and Thickness Results by Vertebral Segment.a
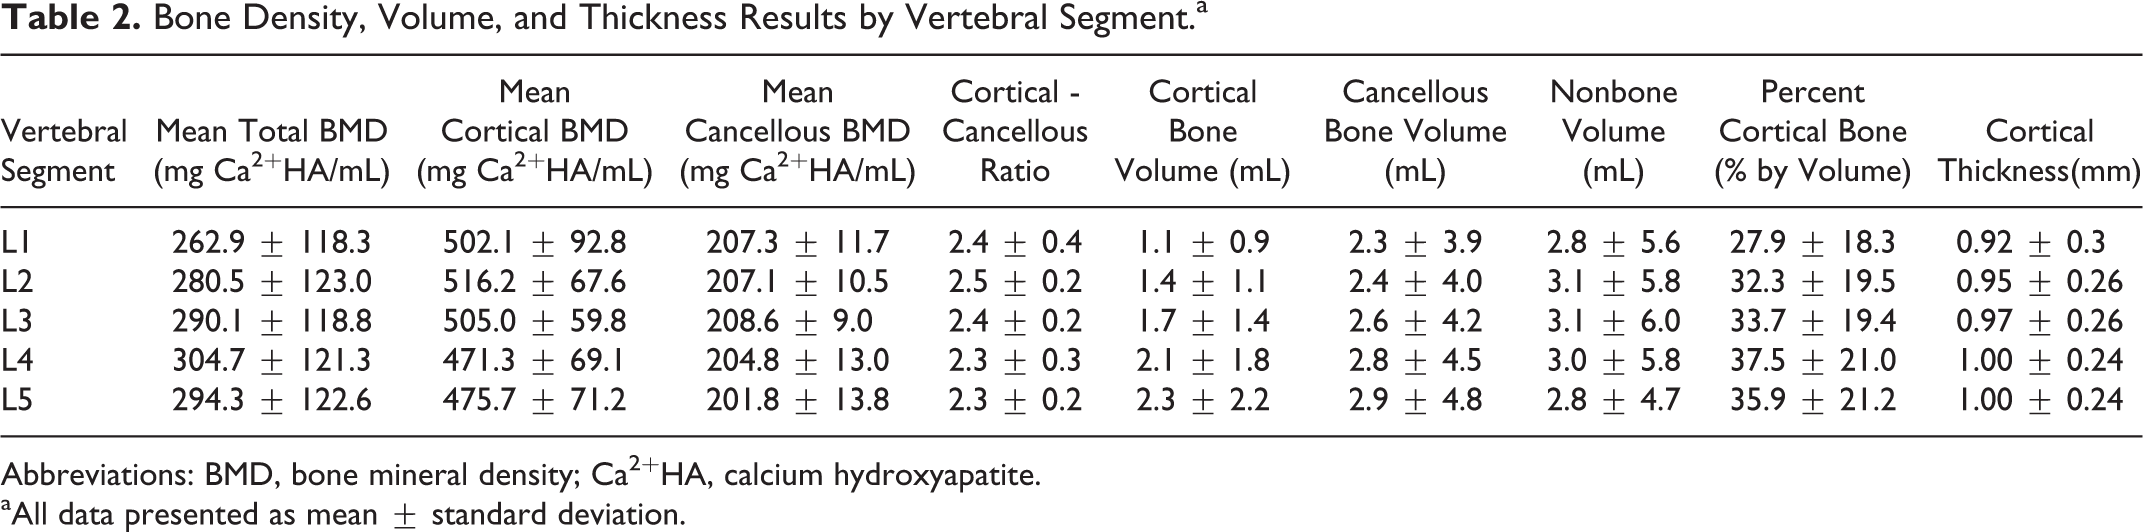
Abbreviations: BMD, bone mineral density; Ca2+HA, calcium hydroxyapatite.
aAll data presented as mean ± standard deviation.
Discussion
Pedicle screw loosening is an important complication of posterior spinal fusion, particularly among osteoporotic patients. 2,12,13 Expandable and cement-augmented pedicle screws are often used to decrease the risk of screw pullout and fixation failure. 1 Extrapedicular regions of the lumbar vertebrae possess greater total BMD and may offer stronger fixation compared with the pedicles. 14 The purpose of this study was to assess the total BMD, cortical BMD, cancellous BMD, cortical volume, and cortical thickness of 7 different anatomical regions of the lumbar spine. Our results indicate that the lamina and inferior articular process have a higher cortical thickness and percentage of cortical volume than the pedicles and other vertebral regions, although the differences in cortical thickness were less pronounced in older specimens. To the authors’ knowledge, this is the first study to compare the cortical thickness of different anatomical regions within the lumbar spine. 30,31 The total BMD and cortical BMD of the lamina and inferior articular process were also higher than those values in the pedicles, but only the difference in total BMD was statistically significant. Since screw pullout strength relies greatly on bone density, 6 -8 fixation at the lamina and inferior articular processes may reduce the risk of screw loosening and construct failure. We did not observe any statistically significant differences in total, cortical, or cancellous BMD between the L1-L5 vertebrae.
Substantial differences in BMD between vertebral levels have been previously reported in the cervical spine. 23 However, few studies have investigated BMD variations within the lumbar vertebrae. In a study using CT scans and 3-dimensional modeling, Yoganandan et al 32 found that the BMD of the vertebral bodies did not vary significantly among the L1-L5 vertebrae. In contrast, other studies have reported that the L4-L5 vertebral bodies have a higher BMD. 21,33 Each of these studies measured the BMD of an area of cancellous bone within the vertebral bodies, and cortical bone and nonbone areas were excluded from density measurements. Our study analyzed the total, cortical, and cancellous BMD of each anatomical region and vertebral segment including the posterior elements. Knowledge of the potential differences in BMD among the L1-L5 levels may be useful in guiding surgical treatment and fixation strategies. In the cervical spine, Anderst et al 23 suggested that anterior cervical fusion of C6-C7 may require a larger interbody spacer due to significantly lower BMD of the vertebral endplates at these levels and a higher likelihood of graft subsidence.
Few studies have been published previously on the bone quality of the posterior column in the lumbar spine. However, several cadaveric biomechanical studies have compared stiffness, range of motion, and load to failure of pedicle screw and extrapedicular fixation methods. 35,36 For example, Ferrara et al 35 found no differences in stability between translaminar screw and traditional pedicle screw fixation after long-term cyclic loading of the lumbar spine. However, this biomechanical study did not use osteoporotic specimen. Coe et al 36 showed increased load to failure of laminar hooks compared to pedicle screws in osteoporotic bone.
According to the results of our study, facet and translaminar screws traverse anatomical regions of the spine that have high total BMDs, cortical volumes, and cortical thicknesses. On the other hand, pedicle screw trajectories involve the pedicles and vertebral bodies, which demonstrated moderate and low BMDs and cortical volumes respectively. While “traditional pedicle screw” trajectories follow the anatomical axis of the pedicle and engage both cortical and cancellous bone, newer cortical trajectories are directed laterally and do not involve the cancellous bone of the vertebral body. 37
Our study used CT scans and image processing software to determine the bone density of 7 predefined anatomic regions of the lumbar spine. The use of CT, rather than DEXA (dual-energy X-ray absorptiometry), represents a strength of this study. While useful clinically, DEXA scans may be less able to detect variations in BMD within specific regions of the vertebrae. 34 In contrast to DEXA, CT scans are also less susceptible to confounding factors such as variation in bone size and overlying osteophytes. 38 -40 In addition to BMD, our study used multiple measures of bone quality, including cortical volume, cortical thickness, and the cortical-cancellous bone ratio. As shown previously by Pollintine et al, 18 specific anatomical regions within the spine may demonstrate differences in trabecular bone architecture without altering the overall BMD.
Our algorithm for measuring cortical thickness has its limitations. Some studies suggest that CT does not produce accurate measurements of cortical thickness. 41 -53 Although Prevrhal et al 43 demonstrated that cortical thickness can be measured using CT with an error of less than 10%, the error in detecting cortical width may increase significantly for shell thicknesses less than 1.2 mm. However, studies using direct anatomical measurement, which may represent the gold standard, have reported wide variations in cortical thickness of the lumbar vertebral bodies. 30,31,41,44 Because of the limited resolution of CT scanners used in clinical practice and the small thickness of the vertebral shell (thicknesses less than 0.5 mm have been reported in the lumbar spine, 31,45,46 CT scans likely overestimate cortical thickness of the vertebral bodies. 41,43,47 As a result, the cortical thickness of the pedicles, spinous processes, transverse processes, and vertebral body may actually be lower than reported in our study. In addition, some authors have questioned the validity of HU to BMD conversions when cone beam computed tomography (CBCT) is used. 48,49 Conversion methods are based on the underlying assumption that CT numbers are mostly consistent throughout the volume of interest, which requires that the tissue is represented by the same CT numbers for any voxel in a given volume and CT examination. 49 In our study, all scans were sequentially performed on the same scanner with the same imaging parameters to reduce interspecimen variability.
Additional limitations of this study include its limited sample size, wide range of specimen ages, and lack of osteoporotic specimens. Our 90-year-old female specimen likely had osteoporosis or osteopenia; however, we did not use DEXA to confirm the overall BMD of our specimens. Despite the relatively small sample size, we were still able to demonstrate statistically significant differences in total BMD, percentage of cortical bone volume, and cortical thickness between the laminae/inferior articular processes and the pedicles. It is possible that a larger sample size may be sufficiently powered to detect differences in BMD between the L1-L5 vertebral segments. Furthermore, a larger sample size may also allow for the comparison of bone density by factors such as gender, age, and osteoporosis. Of note, the differences in total BMD and cortical wall thickness between regions were less pronounced in older specimens than in the younger specimen. Last, degenerative changes, including vertebral osteophytes, facet joint degeneration, and sclerosis of intervertebral discs have been shown previously to artificially elevate BMD measured by DEXA scan. 39,54 -57 Future studies should adjust for the relative contributions of degenerative changes to bone mineral density measurements of the anatomical regions.
Significant differences in BMD of the posterior elements may exist between younger and older specimens. Although our study lacked osteoporotic specimen confirmed by DEXA, our conclusions are unlikely to change given our finding that the laminae and inferior articular processes demonstrate similar cancellous volumes and cancellous BMDs compared with the pedicles. In addition, the highest cortical-cancellous ratios were found in the lamina and both articular processes. Since previous studies suggest that cancellous bone is more affected by osteoporosis than cortical bone, 15,17 the differences in BMD between anatomical regions are unlikely to change significantly in osteoporotic specimen.
Conclusion
Although pedicle screw fixation is the most widely used method of posterior thoracolumbar fusion, extrapedicular regions of the vertebrae may contain denser bone. In the present study, we found that the inferior articular processes and laminae have significantly higher total BMD, cortical bone percentage, and cortical thickness than the pedicles and other anatomical regions of the lumbar spine. Our results suggest that extrapedicular fixation may reduce the risk of screw loosening and construct failure compared with pedicle screw fixation. Patients with osteoporosis may especially benefit from the development of extrapedicular fusion strategies due to the relatively higher BMD of these fixation sites. Additional studies are necessary to determine whether these differences in bone quality translate into reduced rates of screw loosening and need for reoperation in clinical settings.
Footnotes
Declaration of Conflicting Interests
The author(s) declared following potential conflicts of interest with respect to the research, authorship, and/or publication of this article: Dr Dimitriy Kondrashov receives grants/research support from SI-BONE ($30 000-$50 000), SpineArt ($10 000-$15 000), and the AO Foundation ($40 000-$60 000). Jeremi Leasure and Dr Kondrashov receive $10 000 to $15 000 in royalties from SpineArt. Jeremi Leasure and Dr Kondrashov have 20% to 30% stock ownership in Triptych Surgical Inc.
Funding
The author(s) received no financial support for the research, authorship, and/or publication of this article.