
Abstract
Study Design:
Retrospective cohort study.
Objectives:
To characterize regional variations in maximal nonoperative therapy (MNT) costs in patients suffering from lumbar stenosis or spondylolisthesis.
Methods:
Medical records from patients with symptomatic lumbar stenosis or spondylolisthesis undergoing primary ≤3-level lumbar decompression and fusion procedures from 2007 to 2016 were gathered from a large insurance database. Geographic regions (Midwest, Northeast, South, and West) reflected the US Census Bureau definitions. Records were searchable by International Classification of Diseases diagnosis/procedure codes, Current Procedural Terminology codes, and insurance-specific generic drug codes. Utilization of MNT, defined as cost billed, prescriptions written, and number of units disbursed, within 2-years prior to index surgery was assessed.
Results:
A total of 27 877 patients underwent 1-, 2-, or 3-level lumbar decompression and fusion surgery. Regional breakdown of the study cohort was as follows: South 62.3%, Midwest 25.2%, West 10.4%, Northeast 2.1%. Regional variations in the number of patients using nonsteroidal anti-inflammatory drugs (NSAIDs) (P < .0001), opioids (P < .0001), muscle relaxants (P < .0001), and lumbar steroid injections (P < .0001) were detected. A significant difference was identified in the regional MNT failure rates (P < .0001). The total cost associated with MNT prior to index surgery was $48 411 125 ($1736.60/patient), with the Midwest ($1943.83/patient) responsible for the greatest average spending. Despite comprising 62.3% of the cohort, the South was accountable for 67.5% of NSAID prescriptions, 64.6% of opioid prescriptions, and 71.2% of muscle relaxant prescriptions.
Conclusions:
Regional differences exist in the costs of MNT in patients with lumbar stenosis and spondylolisthesis prior to surgery. Future studies should focus on identifying patients likely to fail prolonged nonoperative management.
Introduction
Low back pain is a ubiquitous condition estimated to affect nearly 85% of patients at some point during their lifetimes and is the leading cause of years lived with disability worldwide. 1,2 While the majority of patients with low back pain experience spontaneous resolution of symptoms, between 6% and 11% progress to develop chronic lumbar pain, 3 and the overall prevalence of this condition more than doubled in the United States throughout a recent 14-year interval. 4 The rise in chronic debilitating low back pain is expected to continue as degenerative spinal disorders including lumbar stenosis and spondylolisthesis increase in conjunction with the aging US population. 5 -8
Treatment of chronic lumbar pain generally begins with a trial of nonoperative therapies such as nonsteroidal anti-inflammatory drugs (NSAIDs), opioid analgesics, muscle relaxants, lumbar epidural steroid injections (LESIs), physical and/or occupational therapy (PT/OT) treatments, and chiropractor sessions. 9,10 While these conservative measures are sufficient for the majority of patients, 1 a small proportion fail maximal nonoperative therapy (MNT) and elect to undergo surgical intervention. 9,11,12 Symptomatic lumbar stenosis is the most common reason patients older than 65 years undergo spine surgery in the United States, 10,13 and the costs and resource utilization associated with prolonged courses of MNT prior to spinal operations have been shown to be considerable. 9,14 -17 In our current era of bundled payment strategies that continue to shift the responsibility of judicious resource management onto providers, the duration and makeup of conservative trials are being reevaluated. 9,12,14,18
Significant geographic variations have been identified in the management of chronic back pain in the United States. 18,19 This includes regional differences in the utilization of many treatment modalities traditionally incorporated within conservative therapy trials including LESIs, opioid analgesics, NSAIDs, muscle relaxants, and PT/OT. 19 -23 However, a paucity of data exists elucidating geographic differences in MNT in patients who ultimately require lumbar decompression and fusion surgery. As the prevalence of symptomatic lumbar stenosis and spondylolisthesis continues to increase, more robust characterization of the differences in this cohort is required. This becomes particularly relevant as regional differences in healthcare utilization have been identified in policy reform discussions as indicators of inefficiency and targets for quality improvement. 24 Therefore, the purpose of this study is to characterize regional variations in the resource utilization and associated costs of MNT in patients suffering from lumbar stenosis or spondylolisthesis.
Methods
Data Source
Our patient population was obtained from a large third-party database, which consists of more than 20.9 million covered lives and includes private/commercially insured and Medicare Advantage beneficiaries with an orthopedic diagnosis. Patient medical records were retrieved through a remote server supported by PearlDiver (PearlDiver Technologies, Inc, Colorado Springs, CO). Patient records were searchable by International Classification of diseases (ICD) diagnosis and procedure codes, Current Procedural Terminology (CPT) codes, and generic drug codes specific to the Humana system.
Patient Sample
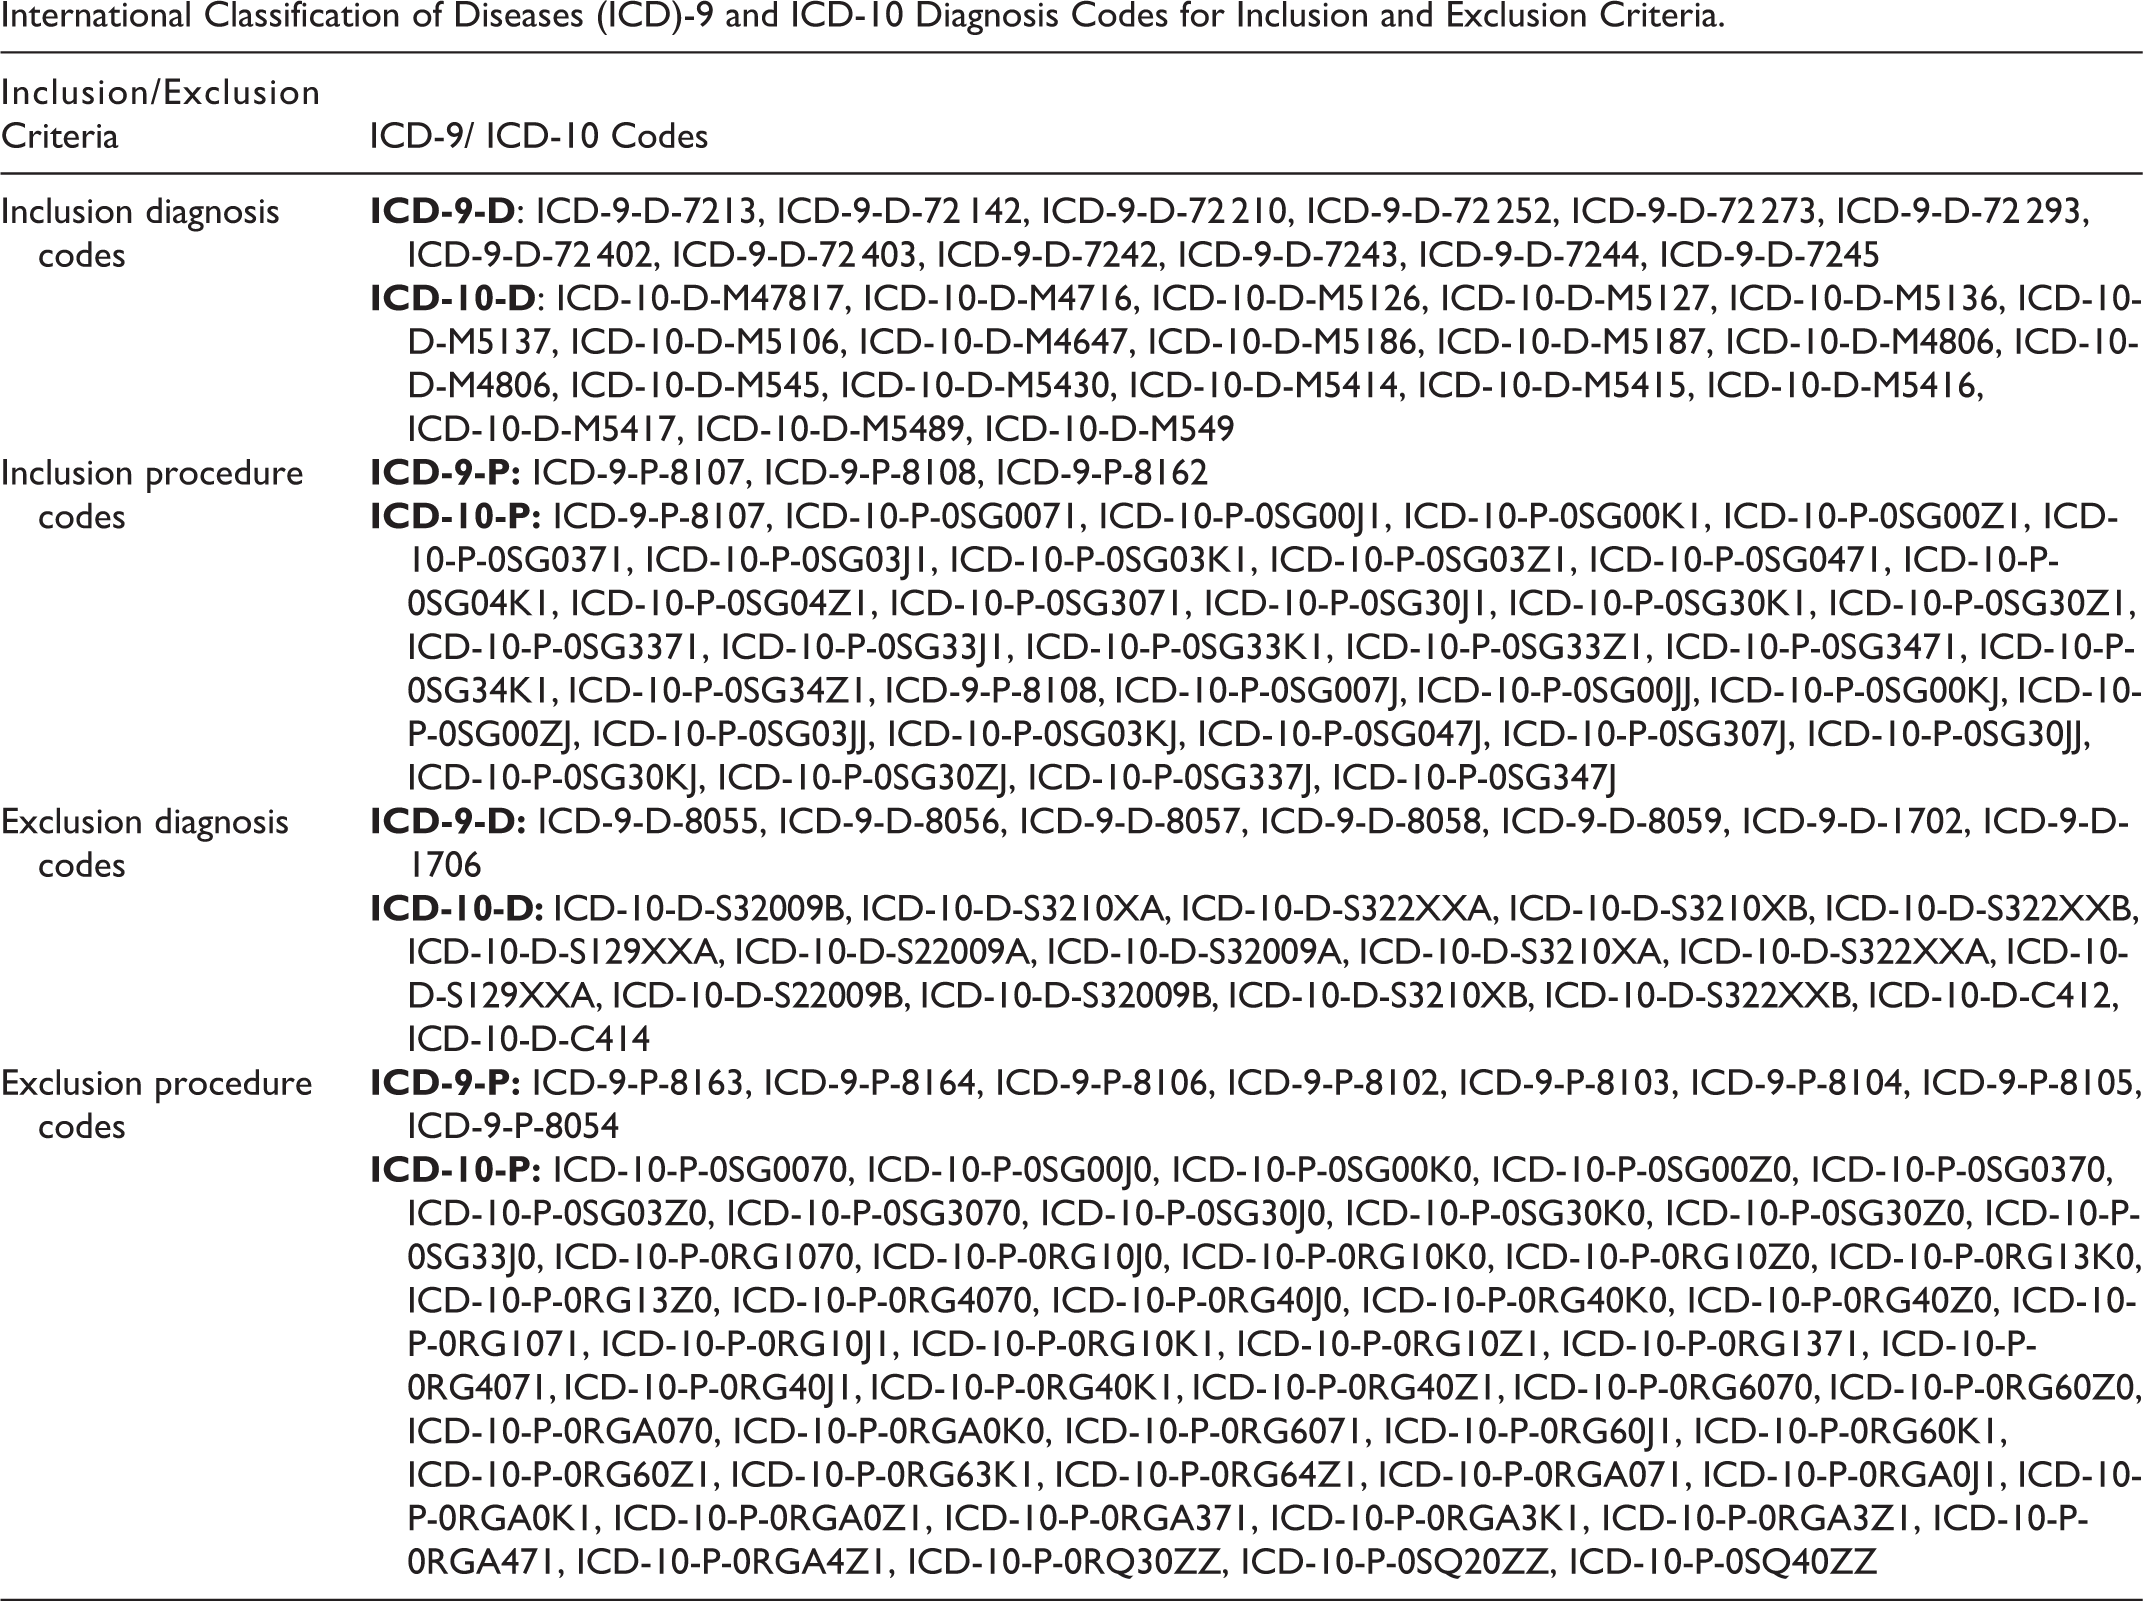
Adult patients (≥19 years old) with degenerative conditions of the lumbosacral spine that underwent an index lumbar decompression and fusion procedure between 2007 and 2016 were considered for analysis. Specifically, patients undergoing primary 1-, 2-, or 3-level lumbar spinal fusion surgery (ICD-9: 8107, 8108, 8162) were collected. Only patients with a documented diagnosis of lumbar stenosis (ICD-9: 72 402, 72 403), spondylolisthesis (ICD-9: 7213, 72 142), intervertebral disc degeneration (ICD-9: 72 252, 72 210, 72 273, 72 293) or low back pain (ICD-9: 72 420, 72 440, 72 450) prior to index lumbar fusion surgery were considered for analysis. Patients were excluded if they underwent greater than 3-level lumbar fusions (ICD-9: 8163, 8164), an anterior fusion approach (ICD-9: 81.06), or had a history of cervical (ICD-9: 8102, 8103) or thoracic fusion (ICD-9: 8104, 8105). Moreover, patients with a concurrent diagnosis of spinal fracture (ICD-9: 8054, 8055, 8056, 8057, 8058, 8059) or spinal malignancy (ICD-9: 1702, 1706) were excluded. For each of the aforementioned ICD-9 codes, the relevant corresponding ICD-10 codes were incorporated into the patient selection/exclusion criteria (Appendix A). Last, in an effort to determine the total number of patients eligible for spinal fusion, all adult patients (≥19 years old) with an inclusion degenerative spinal diagnosis that did not satisfy exclusion criteria were captured.
Medical Therapies
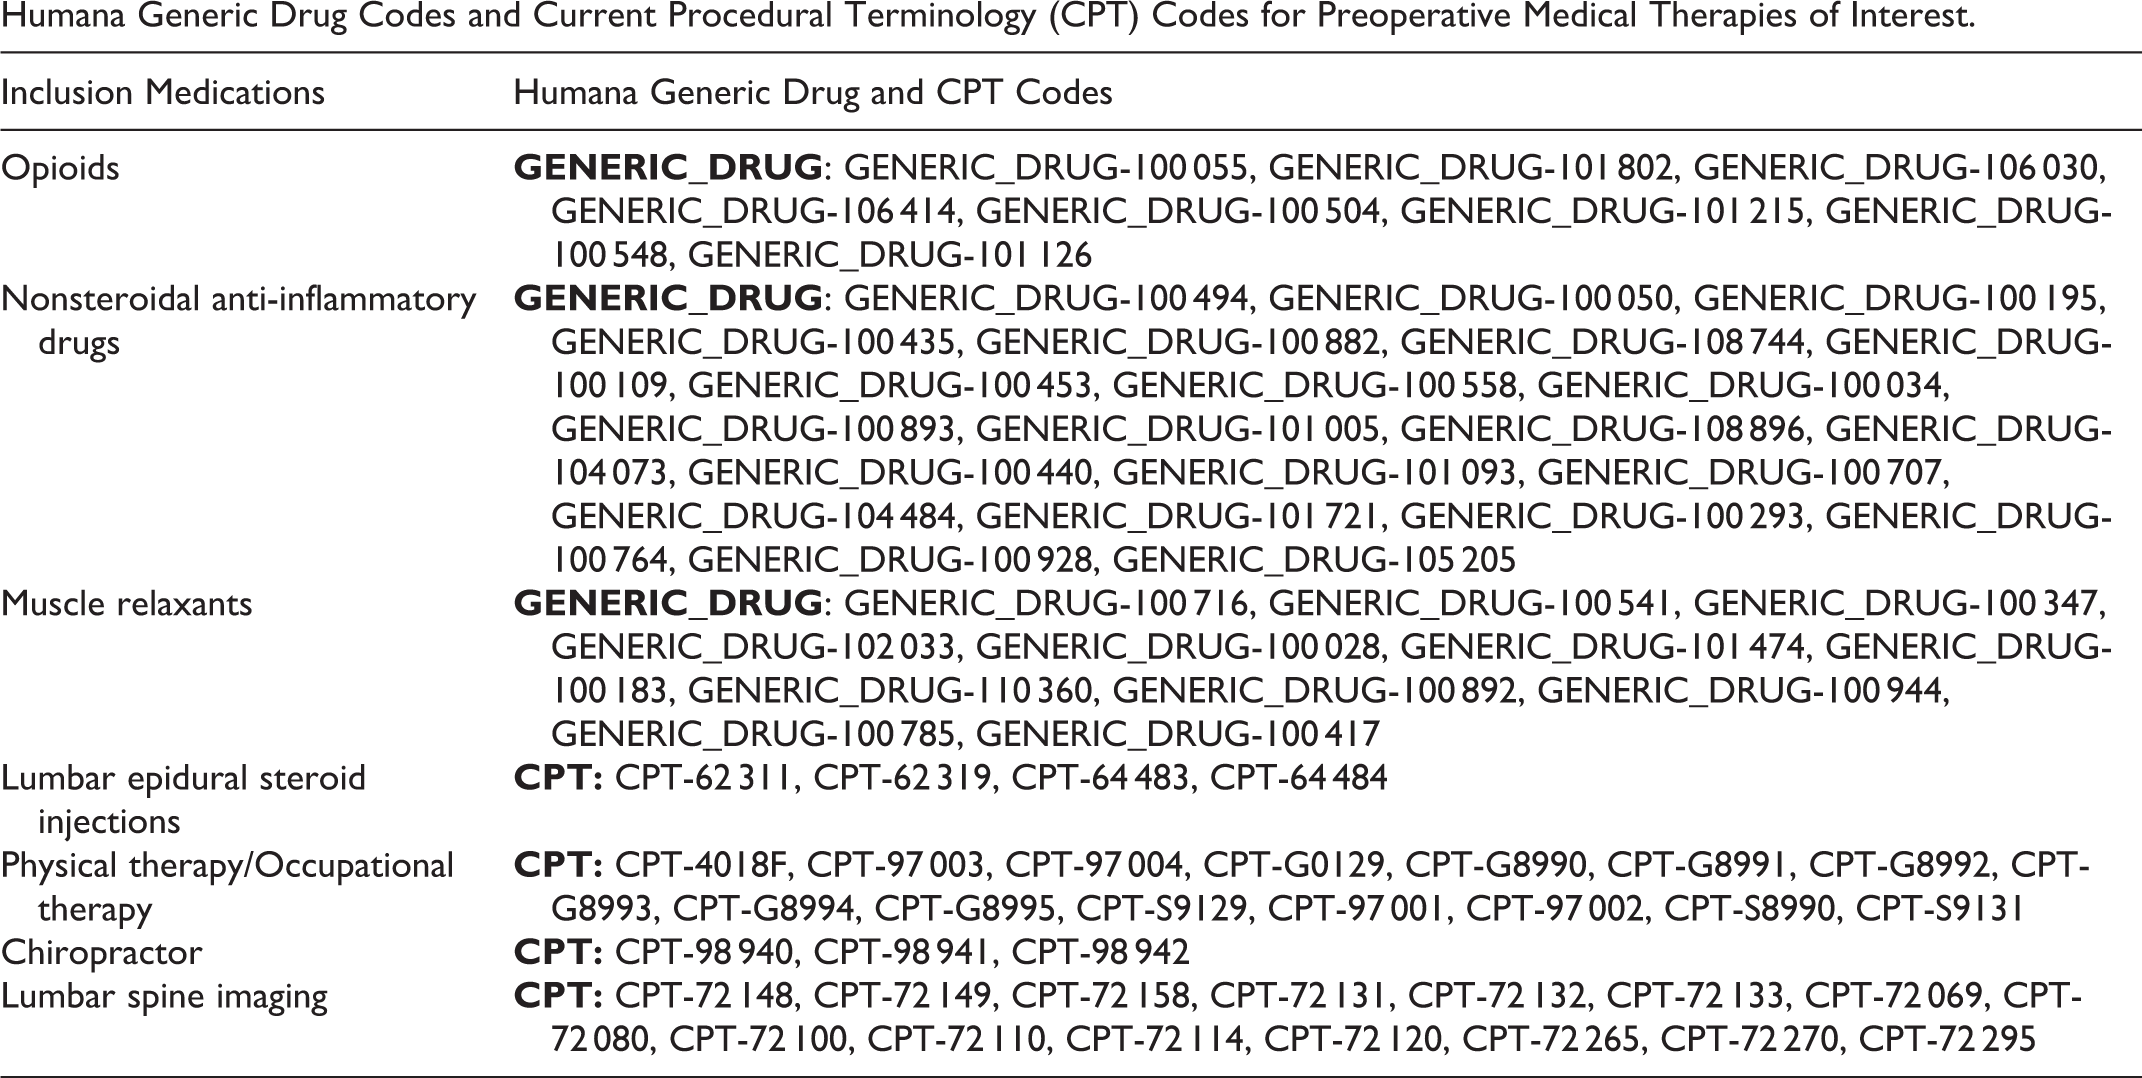
Medical therapy utilization within 2 years prior to the index lumbar fusion surgery was captured. More specifically, nonoperative therapies of interest included NSAIDs, opioid medications, muscle relaxants, LESIs, PT/OT sessions, and chiropractor treatments. Preoperative lumbar spine imaging studies, including x-rays, computed tomography (CT), and magnetic resonance imaging (MRI) were included as nonoperative therapies. Additionally, emergency department (ED) visits for which an inclusion degenerative spinal condition was listed as the primary active problem were documented. Generic drug codes specific to the insurance system were used to capture NSAID, opioid, and muscle relaxant prescriptions prior to surgery (Appendix B). With regard to the use of opioid medications, only the most frequently prescribed opiate formulations, including oxycodone hydrochloride, hydrocodone/acetaminophen, and oxycodone/acetaminophen were queried, which were prescribed in the majority (>80%) of patients while alternative formulations were used in the minority of patients. Similarly, relevant CPT codes for LESIs, PT/OT sessions, chiropractor visits, and lumbar spine imaging were used to gather the number of treatments billed prior to the index operation (Appendix B).
The magnitude of preoperative medical therapy utilization was characterized by total dollars spent, number of units billed for, and quantity of documented prescriptions. A “unit” consisted of an individual pill, injection, therapy session, imaging series, or independent ED visit. In addition to the absolute totals, the use of each medical therapy was normalized by the number of unique patients using the respective treatment.
Baseline Demographics and Comorbidities
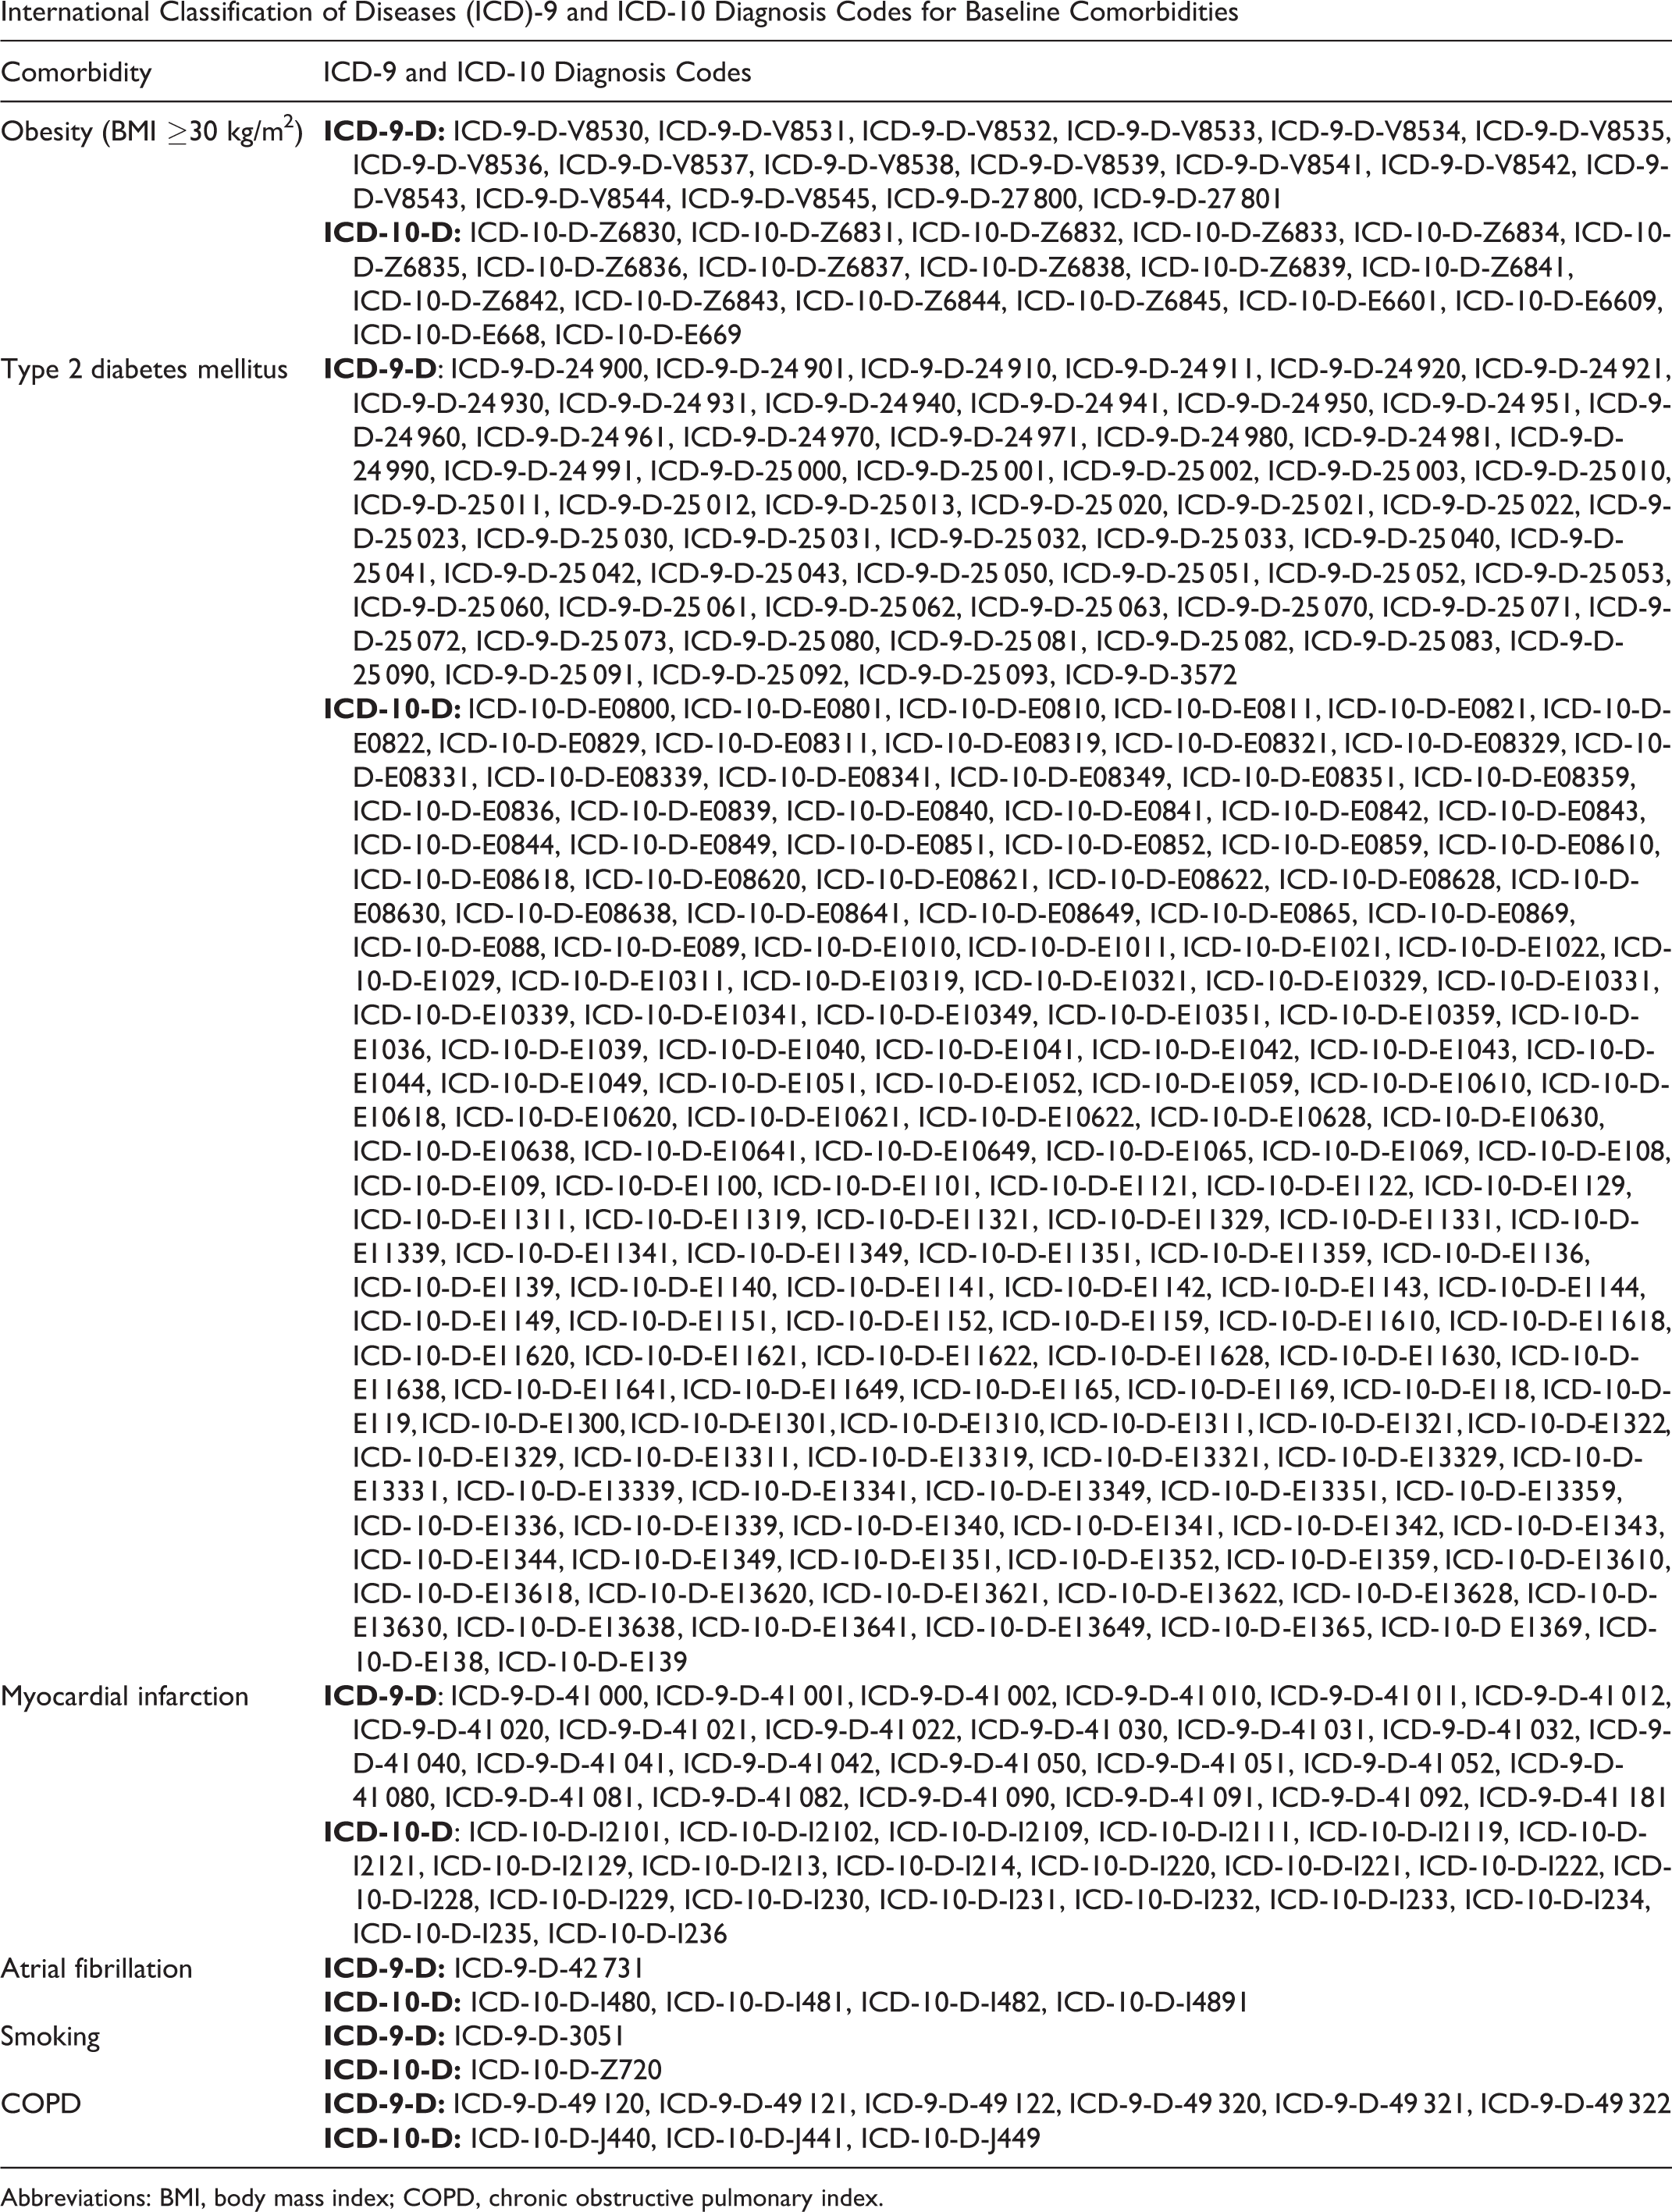
Patient demographic information, including age, gender, ethnicity, and geographical region were captured. As a measure for ensuring patient privacy, the HORTHO patient age data is binned into buckets consisting of 5-year intervals. Patient geographic region designation was separated into 4 distinct quadrants (Midwest, Northeast, South, and West), consistent with the United States Census Bureau classification, and was based on the location in which the insurance claim was initiated. Additional preoperative co-morbidities known to affect spinal surgery outcomes such as obesity (body mass index ≥30 kg/m2), type 2 diabetes mellitus, atrial fibrillation, myocardial infarction (MI), smoking status, and chronic obstructive pulmonary disease (COPD) were captured using the relevant ICD-9 and ICD-10 diagnostic codes (Appendix C).
Data Analysis
The primary objective of this study was to characterize regional variations in the resource utilization and associated costs of MNT in patients suffering from lumbar stenosis and spondylolisthesis. All statistical analysis were executed in R (The R Project for Statistical Computing) through the PearlDiver interface. The terms “cost,” “payment,” and “reimbursement” are used interchangeably to report financial data and represent the actual amount paid by insurers. Comparisons of categorical variables were made using 2-sided χ2 tests, with statistical findings defined as P values <.05.
Results
A total of 27 877 patients underwent 1-, 2-, or 3-level posterior lumbar instrumented fusion and met the inclusion criteria (Table 1). Regional breakdown of the study cohort was as follows: South 62.3%, Midwest 25.2%, West 10.4%, Northeast 2.1%. There were 3 423 114 adult patients eligible for lumbar fusion surgery, meaning they had an inclusion spine diagnosis and did not meet exclusion criteria. Consequently, of the eligible lumbar fusion patients with a degenerative spine diagnosis, only 0.8% failed medical management and elected to have an operation. A significant difference in the regional distribution of the patients who failed conservative management was identified (P < .0001), with regional failure rates of 0.89% in the West, 0.87% in the Midwest, 0.78% in the South, and 0.77% in the Northeast.
Characteristics of Lumbar Stenosis and Spondylolisthesis Population Prior to Primary Lumbar Fusion Surgery.
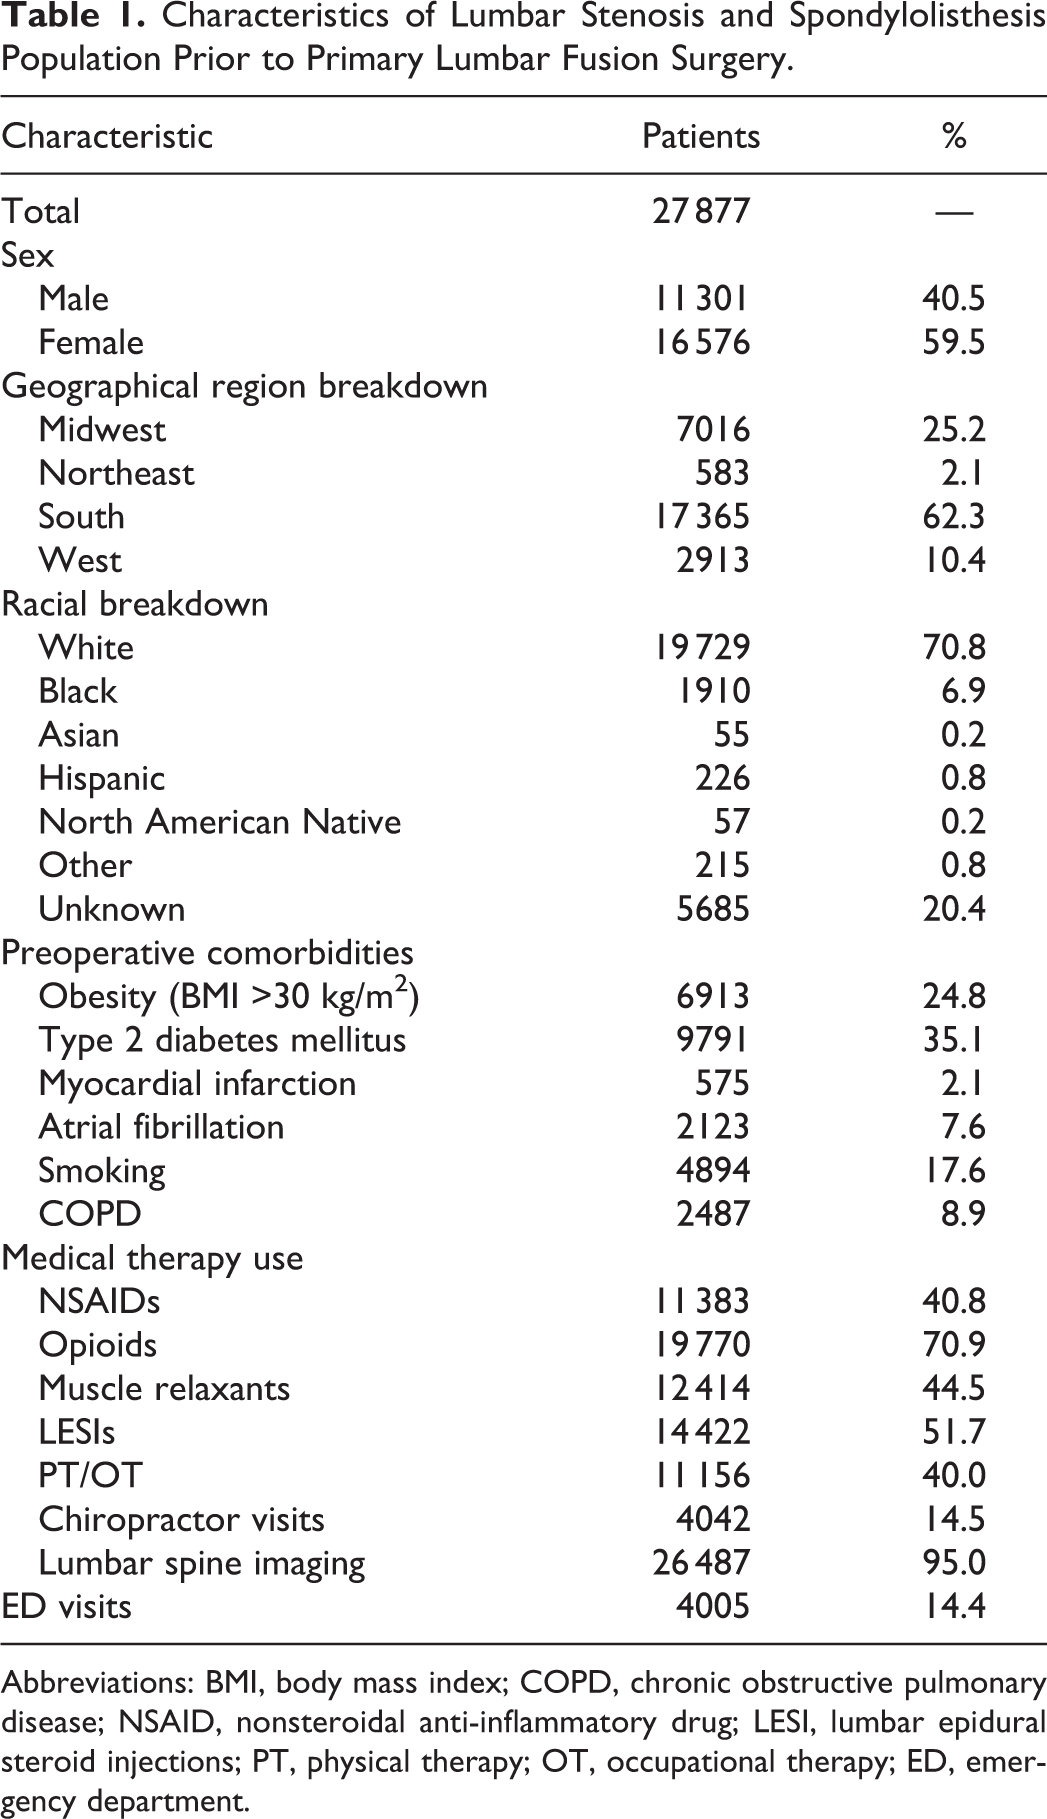
Abbreviations: BMI, body mass index; COPD, chronic obstructive pulmonary disease; NSAID, nonsteroidal anti-inflammatory drug; LESI, lumbar epidural steroid injections; PT, physical therapy; OT, occupational therapy; ED, emergency department.
Demographically, females (59.5%) and Caucasians (70.8%) comprised the majority of the patient cohort (Table 1). Looking at the age distribution of our population, 22.5% fell within the 65- to 69-year-old grouping, 21.0% in the 70- to 74-year-old bin, 12.9% in the 75- to 79-year-old bin, and 11.1% in the 60- to 64-year-old bin. The prevalence of preoperative comorbidities was as follows: 35.1% had type 2 diabetes mellitus, 24.8% were obese, 17.6% were smokers, 8.9% had COPD, 7.6% had atrial fibrillation, and 2.1% had a prior MI (Table 1). Significant variation in the regional distribution of patients with obesity, type 2 diabetes mellitus, smoking history, and COPD was identified (P < .0001) (Table 2).
Regional-Specific Comparison of Patient Demographics and Preoperative Conservative Therapy Utilization, n (%).
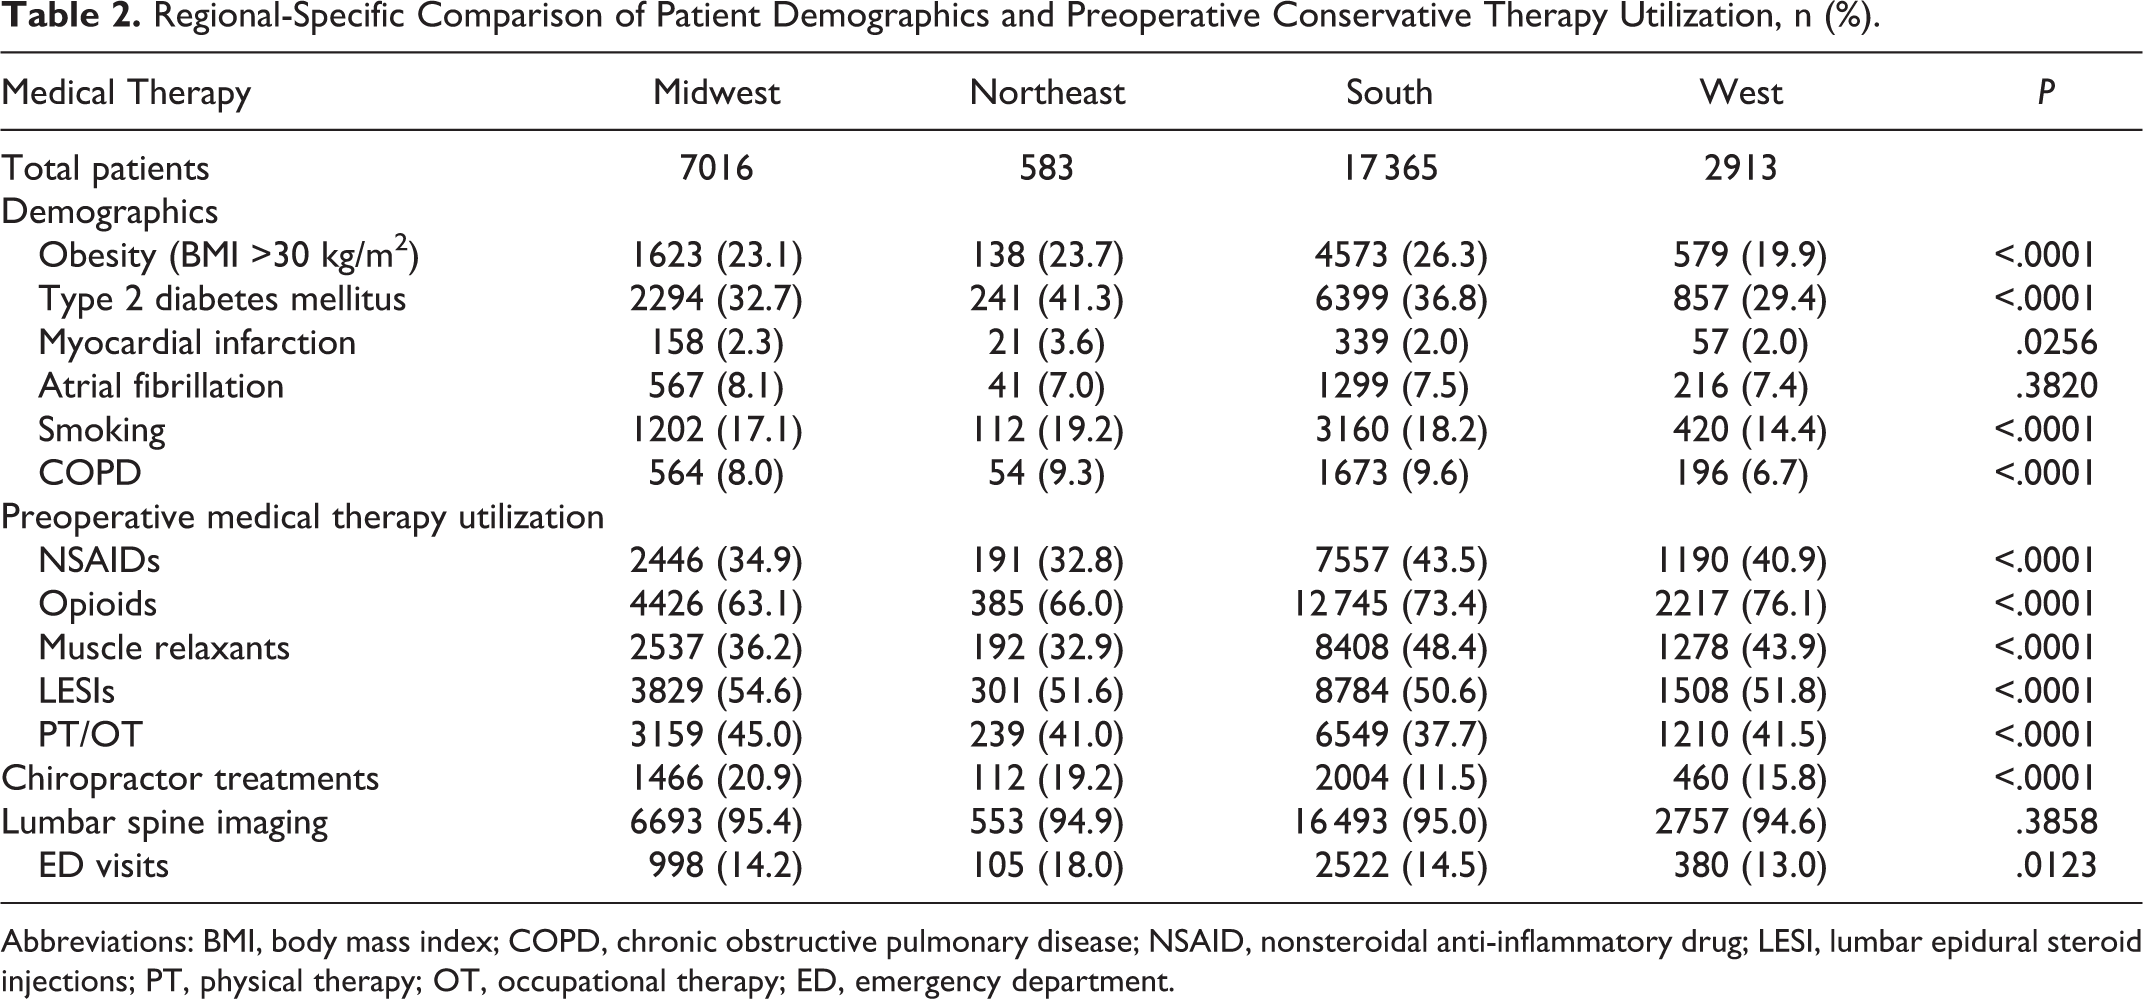
Abbreviations: BMI, body mass index; COPD, chronic obstructive pulmonary disease; NSAID, nonsteroidal anti-inflammatory drug; LESI, lumbar epidural steroid injections; PT, physical therapy; OT, occupational therapy; ED, emergency department.
Maximal Nonoperative Therapy Utilization
When considering the lumbar fusion cohort in its entirety, lumbar spine imaging (95.0%) opioid medications (70.9%), LESIs (51.7%), and muscle relaxants (44.5%) were the most frequently used nonoperative therapies (Table 1). Regional variations in the number of patients using NSAIDs (P < .0001), opioids (P < .0001), muscle relaxants (P < .0001), LESIs (P < .0001), PT/OT treatments (P < 0.0001), chiropractor visits (P < .0001), and ED visits (P = .0123) were identified (Table 2). The West (76.1%) and South (73.4%) regions had the greatest percentage of patients using opioid medications (Table 2).
The total cost associated with all nonoperative therapies prior to index fusion surgery was $48 411 125 ($1736.60 per patient), with the Midwest ($1943.83 per patient) responsible for the greatest average spending per patient. Despite comprising 62.3% of the cohort, the South was accountable for 71.9% of muscle relaxant spending, 67.1% of prescription NSAID spending, and 64.9% of opioid spending (Table 3). When normalized by number of opioid users in the region, the Northeast spent $271.04 per patient on opioid medications compared to the average cohort spending of $187.28 per opioid user (Table 3).
Total Dollars ($USD) Spent and Normalized Cost ($USD/Patient Using Respective Therapy) of Maximal Nonoperative Medical Therapies Prior to Index Lumbar Spinal Fusion Surgery, n (%) (These Values Reflect Payments to Providers).
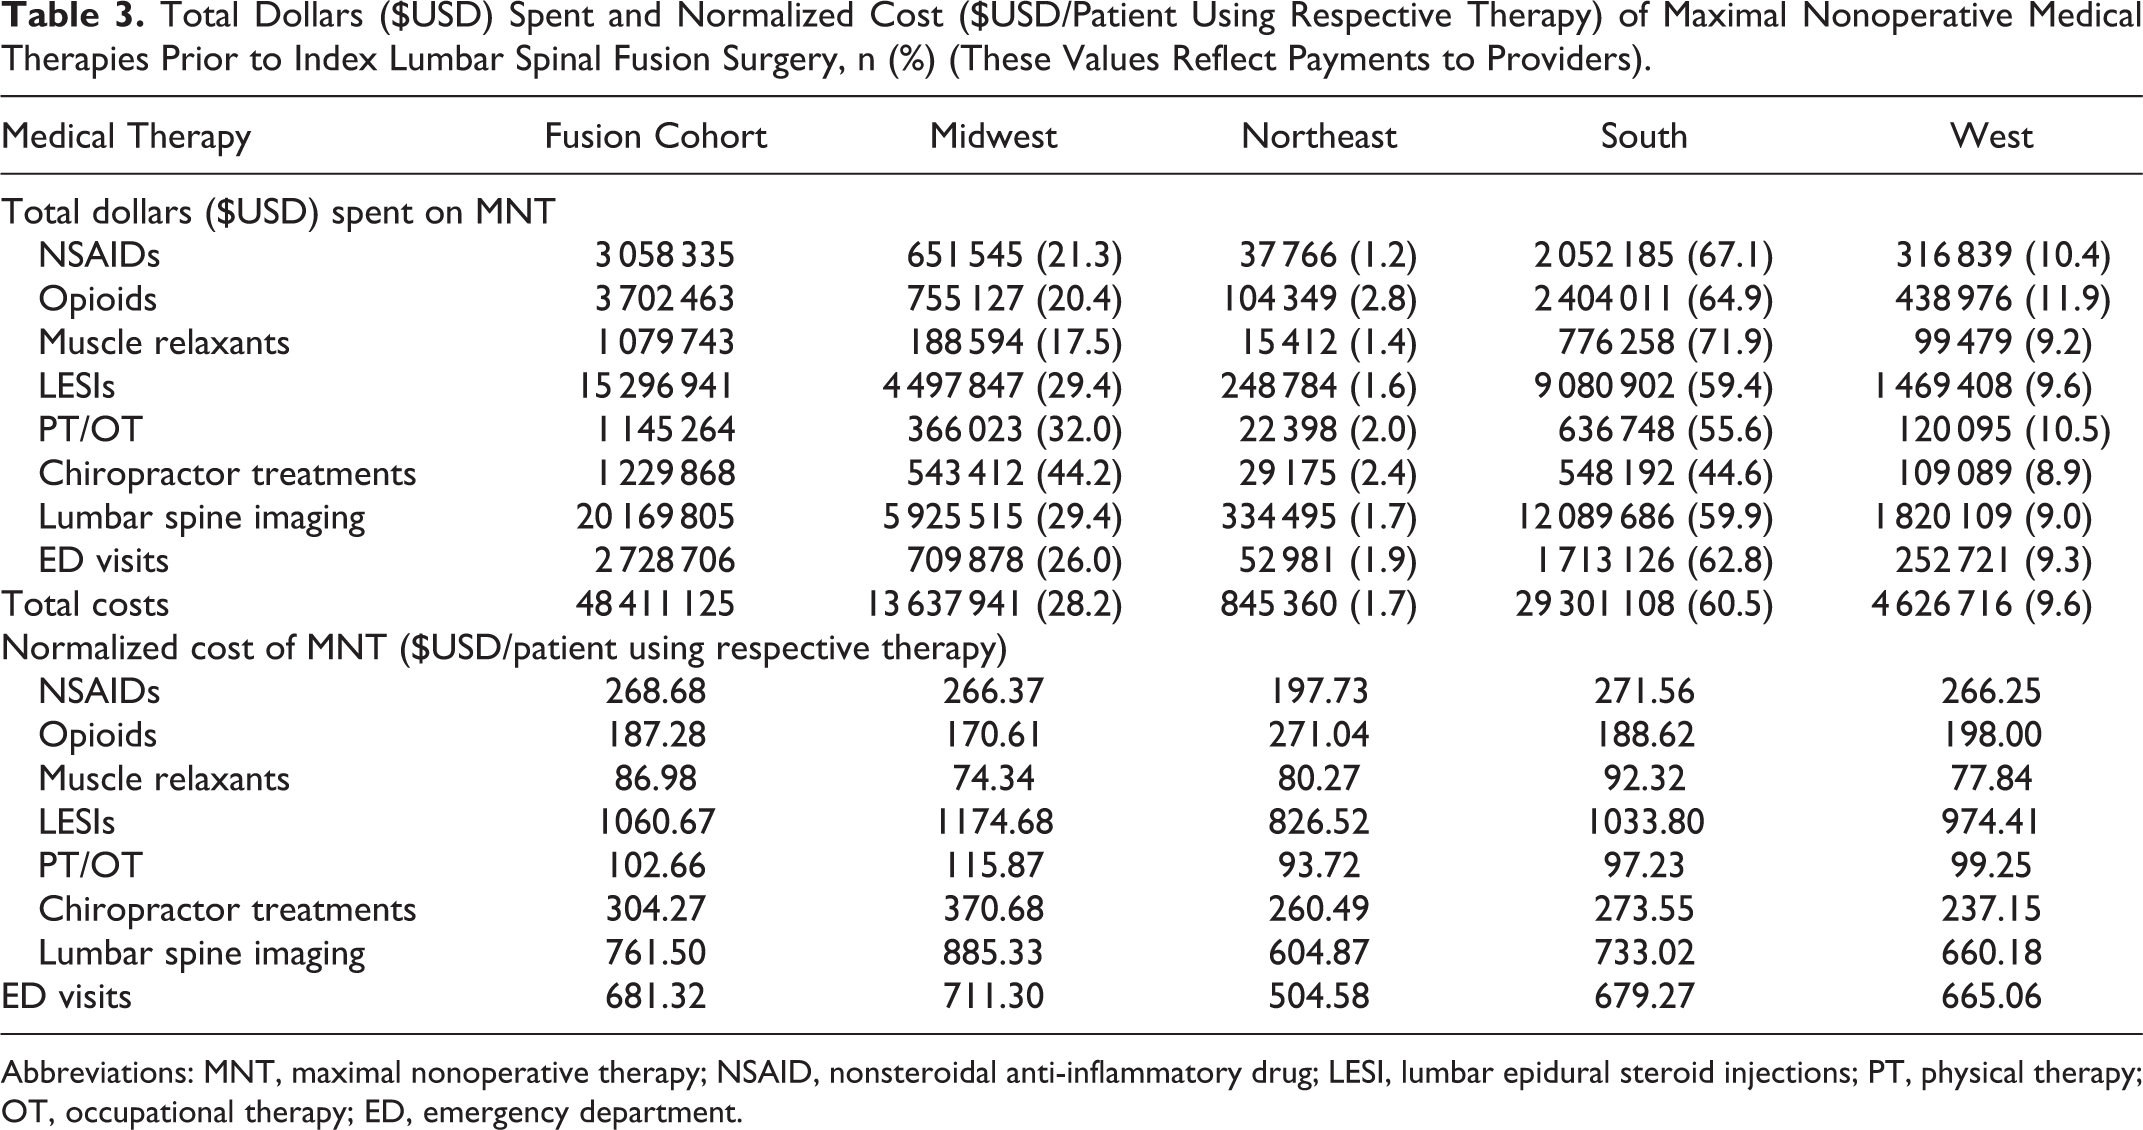
Abbreviations: MNT, maximal nonoperative therapy; NSAID, nonsteroidal anti-inflammatory drug; LESI, lumbar epidural steroid injections; PT, physical therapy; OT, occupational therapy; ED, emergency department.
Looking at the number of prescriptions written for conservative therapies, the South was responsible for a disproportionate amount of the prescriptions for muscle relaxants (71.2%), NSAIDs (67.5%), and opioids (64.6%) within the 2 years prior to lumbar fusion (Table 4). Alternatively, while the Midwest comprised 25.2% of the spinal fusion cohort, these patients were associated with 41.7% of prescriptions for chiropractor therapy treatments, 27.8% of prescriptions for PT/OT sessions, and 27.2% of the lumbar spine imaging prescriptions (Table 4).
Total Number of Prescriptions and Normalized Prescription Counts (Prescriptions/Patient Using Respective Therapy) Written Prior to Index Lumbar Fusion Surgery, n (%).a
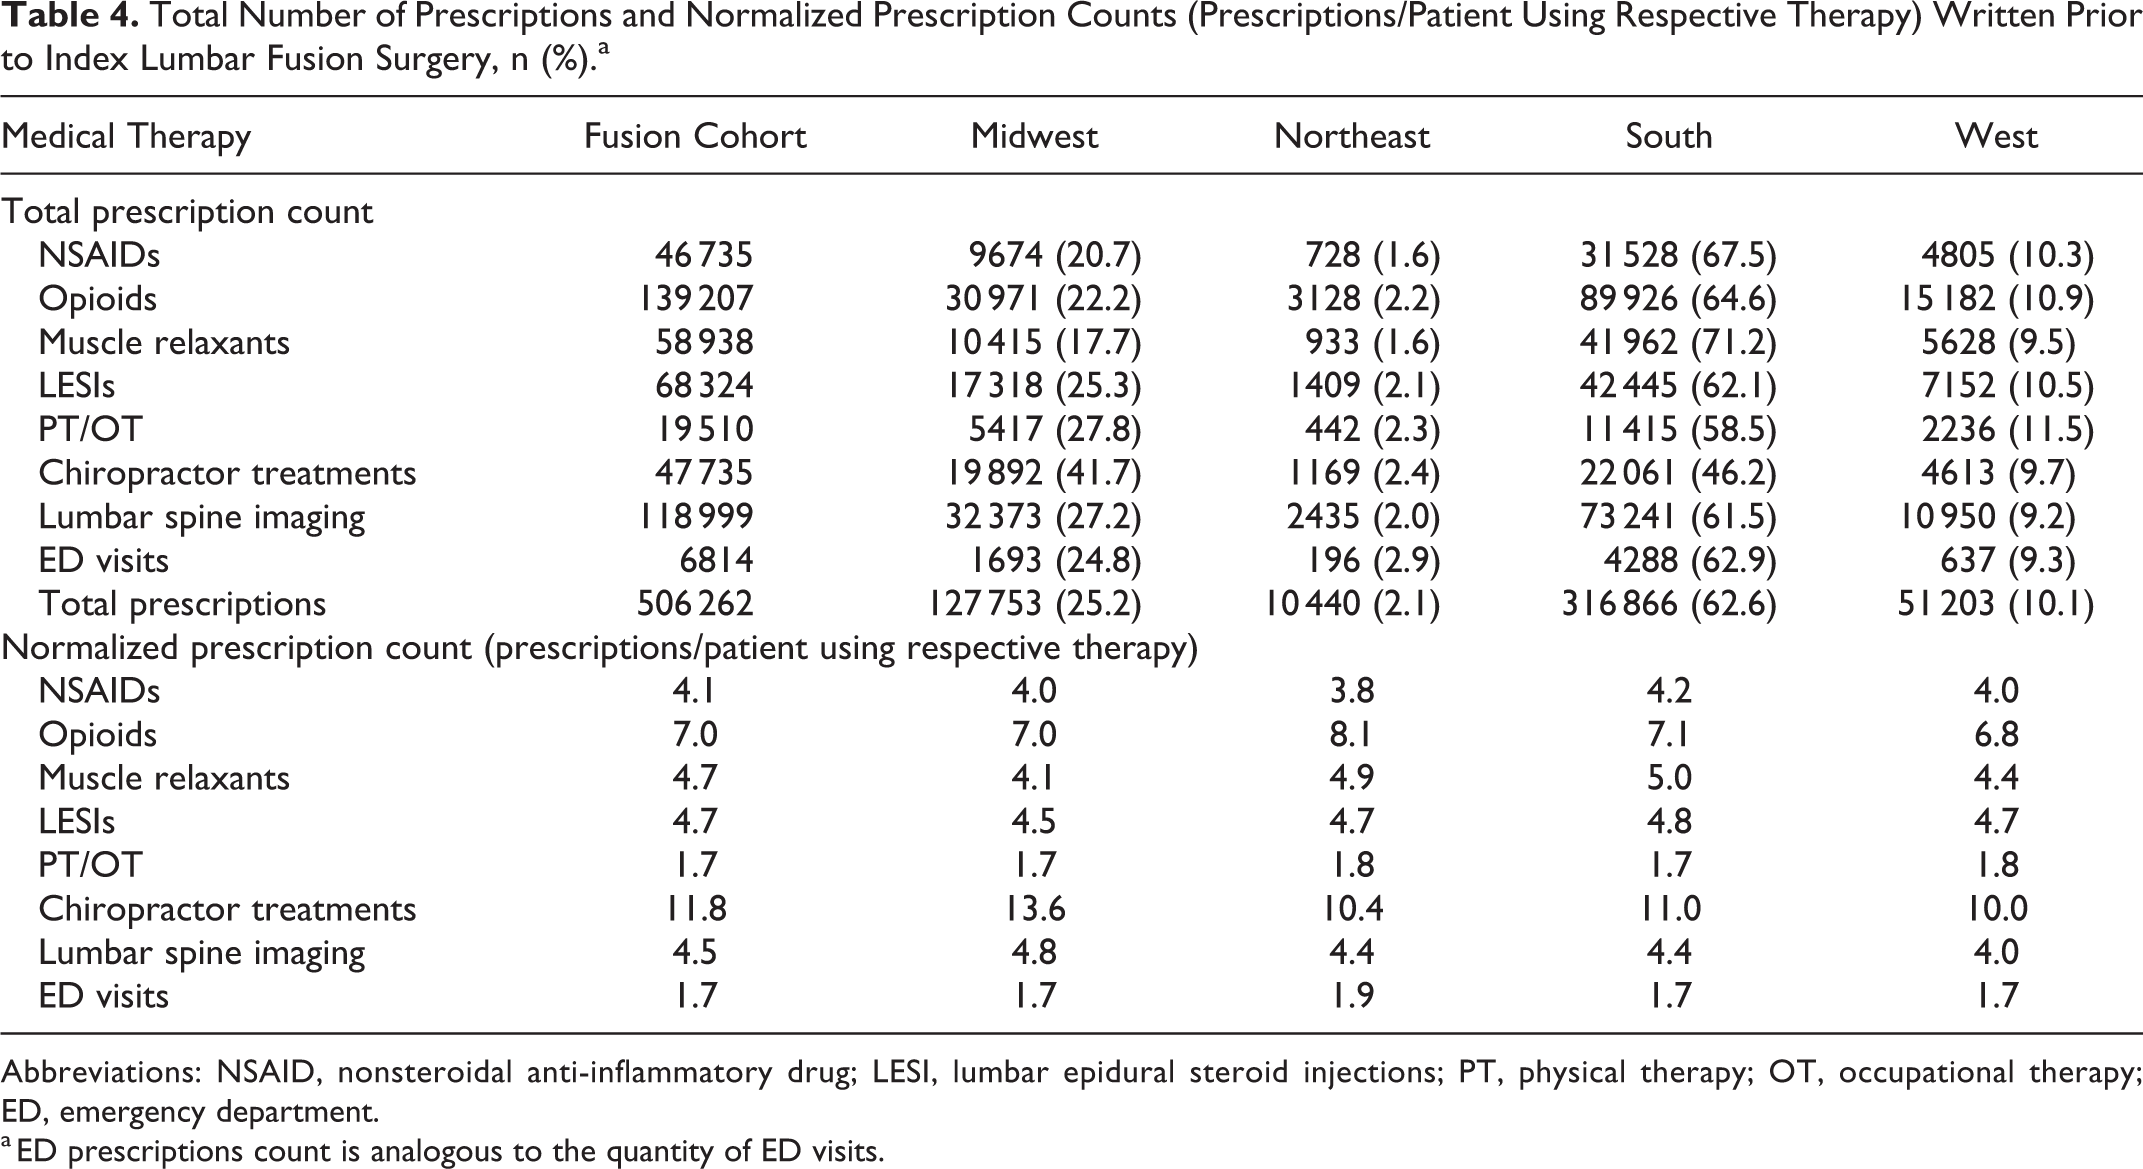
Abbreviations: NSAID, nonsteroidal anti-inflammatory drug; LESI, lumbar epidural steroid injections; PT, physical therapy; OT, occupational therapy; ED, emergency department.
a ED prescriptions count is analogous to the quantity of ED visits.
Similar trends are noted in the regional distribution of unit counts billed for, with patients from the South billing for greater quantities of muscle relaxants, NSAIDs, and opioids while the Midwest billed for more PT/OT treatments, chiropractor sessions, and diagnostic spinal imaging (Table 5). When normalized by the number of opioid-using patients, the Northeast billed for an average of 704.4 opioid pills per patient, which is greater than the normalized average for the entire cohort (552.1 opioid pills per patient) (Table 5). Moreover, when normalized by patients using the respective therapy, the total population billed for 4.6 LESIs per patient and 1.7 ED visits per patient (Table 5).
Total Medical Therapy Units Billed and Normalized Therapy Units Billed (Units/Patient Using Respective Therapy) Prior to Index Lumbar Spinal Fusion Surgery, n (%).
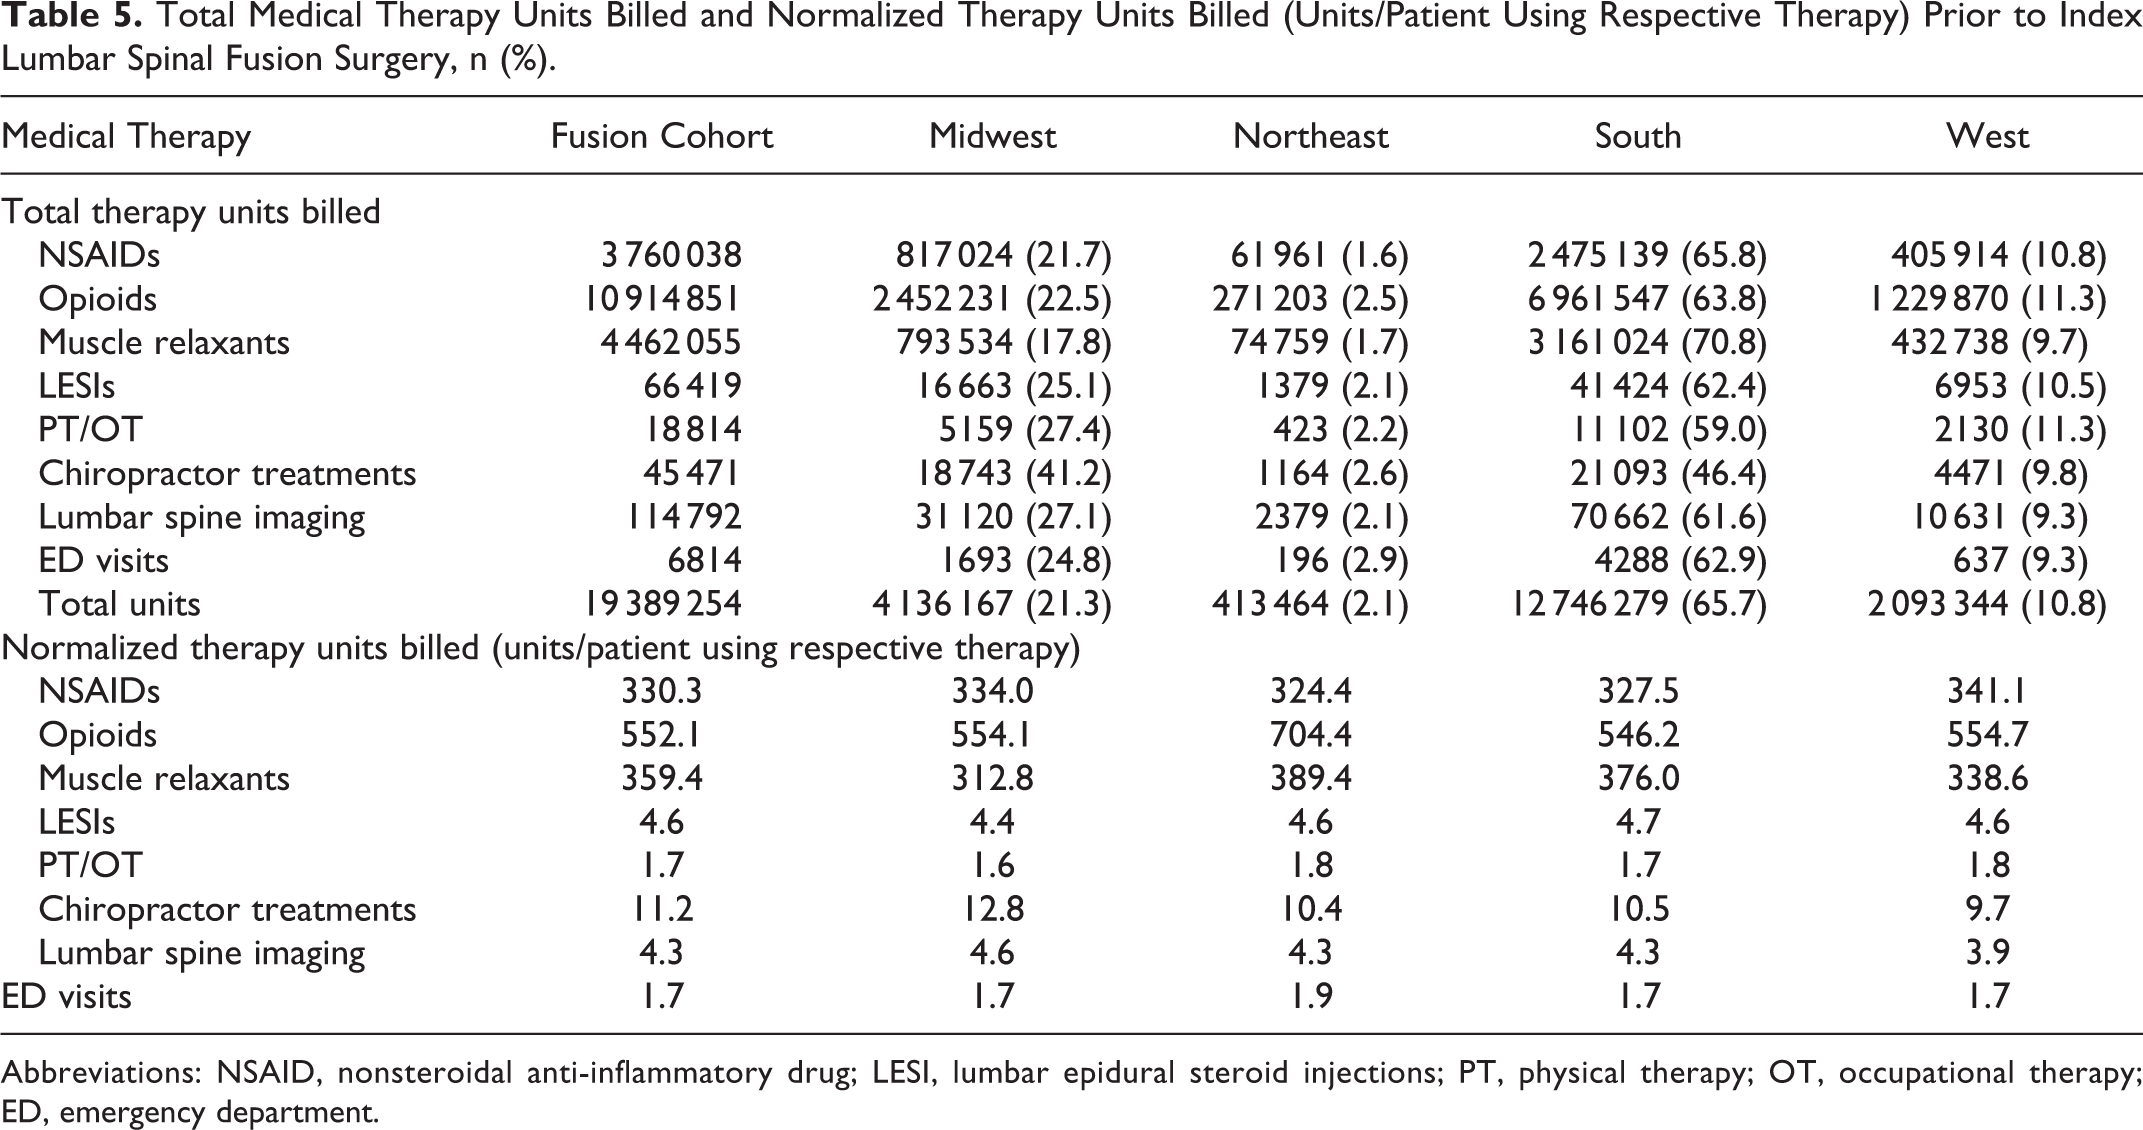
Abbreviations: NSAID, nonsteroidal anti-inflammatory drug; LESI, lumbar epidural steroid injections; PT, physical therapy; OT, occupational therapy; ED, emergency department.
Discussion
In this retrospective study of 27 877 patients who underwent 1-, 2-, or 3-level lumbar decompression and fusion surgery for symptomatic lumbar stenosis or spondylolisthesis, we found significant regional differences in the number of patients using opioids (P < .0001), NSAIDs (P < .0001), muscle relaxants (P < .0001), LESIs (P < .0001), PT/OT treatments (P < .0001), chiropractor visits (P < .0001), and ED services (P = .0123) during the preoperative period. Significant regional variations were additionally found in conservative therapy failure rates (P < .0001), with the West (0.89%) and Midwest (0.87%) having the highest rates of failure. Cost analysis of total MNT utilization revealed that 34.1% more was billed for per patient in the highest spending region (Midwest: $1943.83/patient) than in the lowest spending region (Northeast: $1450.02/patient).
Regional trends that may reflect provider preferences also emerged, with providers from the Southern region disproportionately emphasizing oral medications, including prescription NSAIDs, opioids, and muscle relaxants. Alternatively, Midwest providers relied disproportionately on PT/OT treatments, chiropractor sessions, and lumbar spine imaging. The observation that the Midwest had the highest spending per patient of any region on conservative therapy may reflect these differences in MNT selection.
Our findings are consistent with previous studies demonstrating geographic variations in the utilization of nonoperative therapies for the management of back pain. In a study of 23 839 respondents within the Medical Expenditure Panel Survey (MEPS) on the prescription of NSAIDs and muscle relaxants for treatment of back pain, Luo et al 20 found that patients from the South were significantly more likely to be prescribed COX-2 inhibitors and muscle relaxants than patients from the West. A separate analysis of MEPS data by Luo et al 21 similarly found that opioid use for back pain was significantly higher in patients from the South than any other region in 3 of the 4 years analyzed. Numerous supplementary studies have similarly demonstrated significantly increased rates of opioid utilization in the South versus other geographic regions. 19,23,25,26
The use of LESIs for low back pain has also been previously demonstrated to exhibit significant regional variations, with a study by Friedly et al 22 finding a 7.7-fold difference in lumbar injection utilization between US states. Furthermore, in a study encompassing a broad array commonly prescribed therapies for low back pain within a large private insurance database, Salt et al 19 demonstrated significant geographic differences across many nonoperative modalities. Specifically, medications, including NSAIDs, opiates, muscle relaxants, steroids, benzodiazepines, anticonvulsants, and hypnotics were used with considerable regional variation and with consistency, greater proportions of patients from the South used these therapies. Interestingly, while non-medication treatments such as physical therapy, occupational therapy, and exercise therapy also demonstrated significant regional differences, these were employed least in the South compared to all other regions. 19 The results from these aforementioned studies are consistent with our findings that significant regional variations exist in MNT utilization in patients with lumbar stenosis or spondylolisthesis who eventually undergo lumbar decompression and fusion surgery. Moreover, as seen in previous reports, patients receiving treatment in the south received disproportionate quantities of oral medications.
The reasons for the observed regional differences in MNT are likely multifaceted, however provider level factors may play a substantial role as patient characteristics are alone inadequate to explain the discrepancies. In a study of the geographic variation of opioid prescribing in the United States, McDonald et al 25 observed significant disparities in prescription rates that were unrelated to regional variations in the prevalence of injuries, surgeries, or medical conditions requiring analgesic use. Moreover, in a study focusing on geographic disparities in medication spending in 533 170 Medicare beneficiaries, Zhang et al 24 found a 60% difference in spending between regions after isolating variations unrelated to drug market prices, patient health, or population characteristics. Similarly, our study found geographic variations in utilization and spending on MNTs in patients suffering from lumbar stenosis or spondylolisthesis, with our analysis restricted to patients who underwent short-segment fusions and were covered primarily by employer-based insurance plans. This presumably controlled for the potential confounding effects of the extent of spinal disease or patient socioeconomic status.
Rather than patient level factors, geographic variations in MNT prior to spine surgery may stem in large part from the lack of consensus among providers surrounding the most efficacious nonoperative therapies or the optimal duration of conservative trial periods. In a study of 445 US spine surgeons given surveys designed to assess their treatment patterns of low back pain, Lubelski et al 27 found roughly 75% disagreement between providers on their treatment approach. This disagreement was most pronounced in the Southwest and weakest in the Midwest. Similarly, in an analysis limited to spondylolisthesis management, significant regional differences were found in treatment options selected by the practitioners. 28 These studies illustrate that when clinical guidelines are lacking, individual providers may base their therapeutic approach on factors that reflect the institution where they completed their training or other personal considerations that may contribute to regional differences in clinical practice. As value-based health care strategies continue to prioritize the cost-effectiveness of treatments, the finding that substantial regional differences exist in the utilization and costs of MNT in patients with symptomatic lumbar stenosis or spondylolisthesis is significant and has the potential to help direct future management guidelines.
Limitations
The results and clinical implications of this study should be interpreted within the context of its limitations. The database is composed solely of private insured patients or Medicare Advantage beneficiaries. Consequently, Medicaid patients were precluded from the current investigation. Medicaid patients have been shown to use considerably more opioid medications and ED resources than patients with alternative insurance types, 11 which indicates that our study likely underestimates MNT costs in the general population. Similarly, a disproportionate geographical distribution of Medicaid patients may influence the observed trends in cost and utilization of MNT.
Our study makes the assumption that all preoperative medical therapies are rendered through the insurance provider; however, we know this not to be entirely true. Many patients use over-the-counter NSAIDs or private diagnostic imaging services, which are not captured in our analysis. Additionally, the insurance database lacks diagnostic and therapeutic context that may potentially affect the outcomes of this analysis. Finally, when constructing the inclusion criteria, both ICD-9 and ICD-10 procedural codes were used. By nature, the ICD-9 procedural coding system is far broader than ICD-10 and encompasses procedural codes that are irrelevant to the intended study design (e.g. sacroiliac joint fixation). Despite best efforts to remove these procedure codes, the authors estimate a residual <1% of the sample size is included in the study population. Despite these limitations, the current study demonstrated that within the 2-year preoperative window, significant regional variations in the utilization and associated costs of MNT exist.
Conclusions
The results from this study suggest that regional differences exist in the costs and utilization of MNT in patients with lumbar stenosis and spondylolisthesis prior to surgery. Future studies should be directed toward identifying patients more likely to fail prolonged nonoperative management.
Footnotes
Appendix A
International Classification of Diseases (ICD)-9 and ICD-10 Diagnosis Codes for Inclusion and Exclusion Criteria.
| Inclusion/Exclusion Criteria | ICD-9/ ICD-10 Codes |
|---|---|
| Inclusion diagnosis codes |
|
|
|
|
| Inclusion procedure codes |
|
|
|
|
| Exclusion diagnosis codes |
|
|
|
|
| Exclusion procedure codes |
|
|
|
Appendix B
Humana Generic Drug Codes and Current Procedural Terminology (CPT) Codes for Preoperative Medical Therapies of Interest.
| Inclusion Medications | Humana Generic Drug and CPT Codes |
|---|---|
| Opioids |
|
| Nonsteroidal anti-inflammatory drugs |
|
| Muscle relaxants |
|
| Lumbar epidural steroid injections |
|
| Physical therapy/Occupational therapy |
|
| Chiropractor |
|
| Lumbar spine imaging |
|
Appendix C
International Classification of Diseases (ICD)-9 and ICD-10 Diagnosis Codes for Baseline Comorbidities
| Comorbidity | ICD-9 and ICD-10 Diagnosis Codes |
|---|---|
| Obesity (BMI ≥30 kg/m2) |
|
|
|
|
| Type 2 diabetes mellitus |
|
|
|
|
| Myocardial infarction |
|
|
|
|
| Atrial fibrillation |
|
|
|
|
| Smoking |
|
|
|
|
| COPD |
|
|
|
Abbreviations: BMI, body mass index; COPD, chronic obstructive pulmonary index.
Declaration of Conflicting Interests
The author(s) declared no potential conflicts of interest with respect to the research, authorship, and/or publication of this article.
Funding
The author(s) received no financial support for the research, authorship, and/or publication of this article.